inquiry into social public and affordable … social, public and affordable housing legislative...
TRANSCRIPT

Submission No 87
INQUIRY INTO SOCIAL, PUBLIC AND AFFORDABLE
HOUSING Organisation: Save Our Suburbs
Date received: 28/02/2014
1
Social, public and affordable housing
Legislative Council Inquiry
Submission by Tony Recsei
President Save Our Suburbs (SOS) NSW Inc
28 February 2014
Table of Contents
1. INTRODUCTION ……………………………………… 2
2. EXECUTIVE SUMMARY ……………………………. 3 3. THE NECESSITY OF AFFORDABLE HOUSING … 4 4. IMPROVING HOUSING AFFORDABILITY . ………. 6
5. EFFECT OF PLANNING POLICIES ……. ………… 8
6. STATEMENTS RELATING TO LAND COSTS …….. 12 7. OTHER COST FACTORS …………………………….. 13 8. NEGATIVE GEARING …………………………………. 14 9.. SUPPLY AND DEMAND ..……………………………. 15
10. CONCLUSION ……………………………………..…. 16 11. REFERENCES ………………………………………... 17
2
Social, public and affordable housing 1. INTRODUCTION
Save Our Suburbs expresses appreciation to the New South Wales Legislative Council for the opportunity to comment on Social, Public and Affordable Housing in New South Wales. A disciplined objective approach to the question is essential if an acceptable quality of life will be available for the majority of citizens in the state.
Save Our Suburbs (NSW) is a non-profit and non-aligned group of residents with aims to
promote residential amenity, local character and a high quality built environment
promote conservation of built and cultural heritage
protect the natural environment
empower the community to participate in planning and development decisions.
Housing unaffordability has devastating human consequences, ranging from families forced to make excessive mortgage payments that preclude expenditure on many essential and discretionary purchase options to the wretchedness of not having a regular roof over their heads.
The main factors affecting the affordability of housing are land cost, construction cost, service and finance charges and government charges. This submission will concentrate on what has emerged as the major factor affecting housing cost – the cost of land.
3
2. EXECUTIVE SUMMARY
Over the past three decades the average cost of housing in New South Wales has changed from being affordable to being unaffordable. This affects not only the segment of the population who traditionally have relied on affordable public housing but now a much larger population segment. The median price of a Sydney house has risen from four to nine times median family income. This is having significant social consequences. New home owners pay a much higher percentage of their income on house payments than they should. Similarly, renters are paying increased rental costs reflective of the higher capital and financing costs in turn paid by landlords. Many young people and the underprivileged will never be able to own their own home.
It is apparent that of the factors affecting housing affordability in New South Wales the major component is a distortion in the housing market resulting from a supply-demand imbalance. This distortion results from current prescriptive planning practices which have caused a restricted supply. It is essential that planning practices be altered so as to allow supply and demand to once more come into a natural equilibrium.
4
3. THE NECESSITY OF AFFORDABLE HOUSING
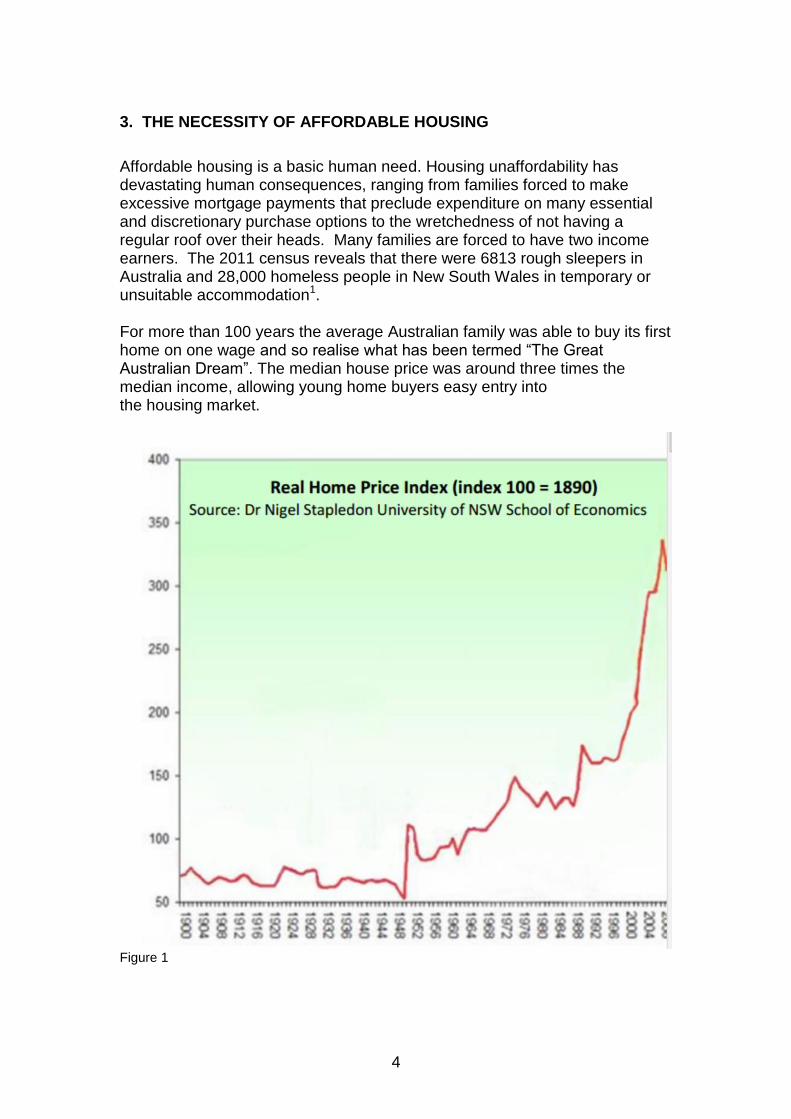
Affordable housing is a basic human need. Housing unaffordability has devastating human consequences, ranging from families forced to make excessive mortgage payments that preclude expenditure on many essential and discretionary purchase options to the wretchedness of not having a regular roof over their heads. Many families are forced to have two income earners. The 2011 census reveals that there were 6813 rough sleepers in Australia and 28,000 homeless people in New South Wales in temporary or unsuitable accommodation1. For more than 100 years the average Australian family was able to buy its first home on one wage and so realise what has been termed “The Great Australian Dream”. The median house price was around three times the median income, allowing young home buyers easy entry into the housing market.
Figure 1
5
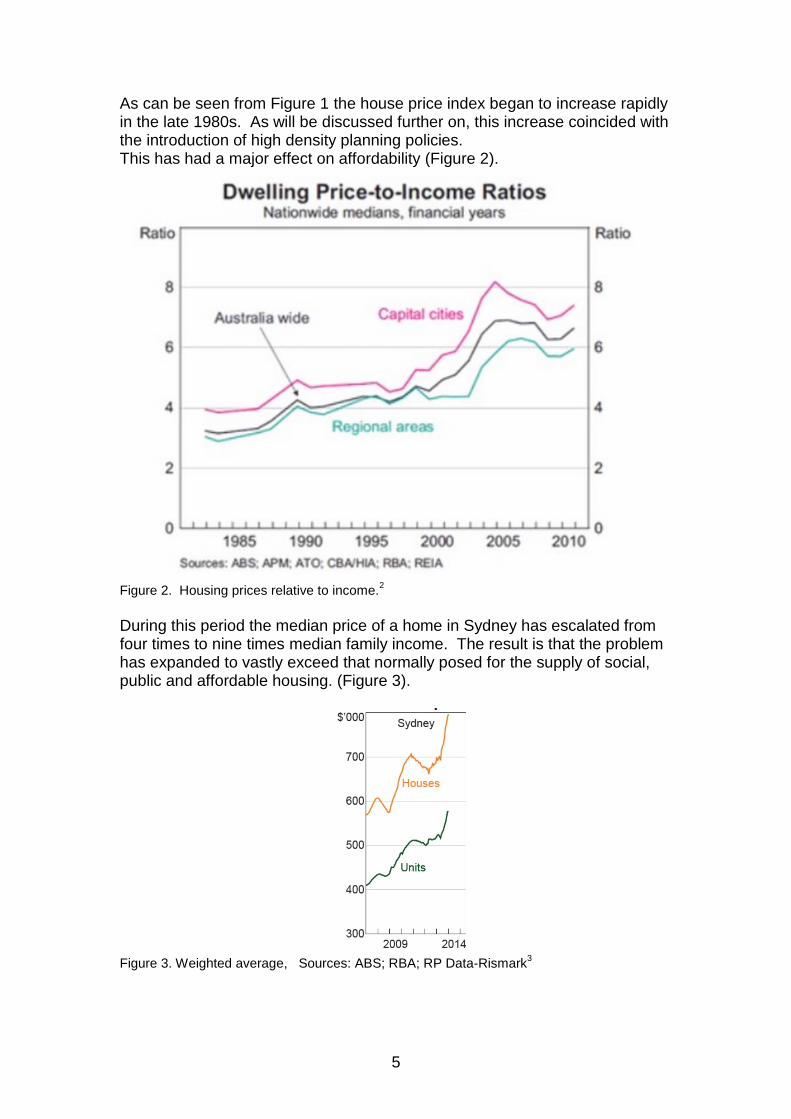
As can be seen from Figure 1 the house price index began to increase rapidly in the late 1980s. As will be discussed further on, this increase coincided with the introduction of high density planning policies. This has had a major effect on affordability (Figure 2).
Figure 2. Housing prices relative to income.
2
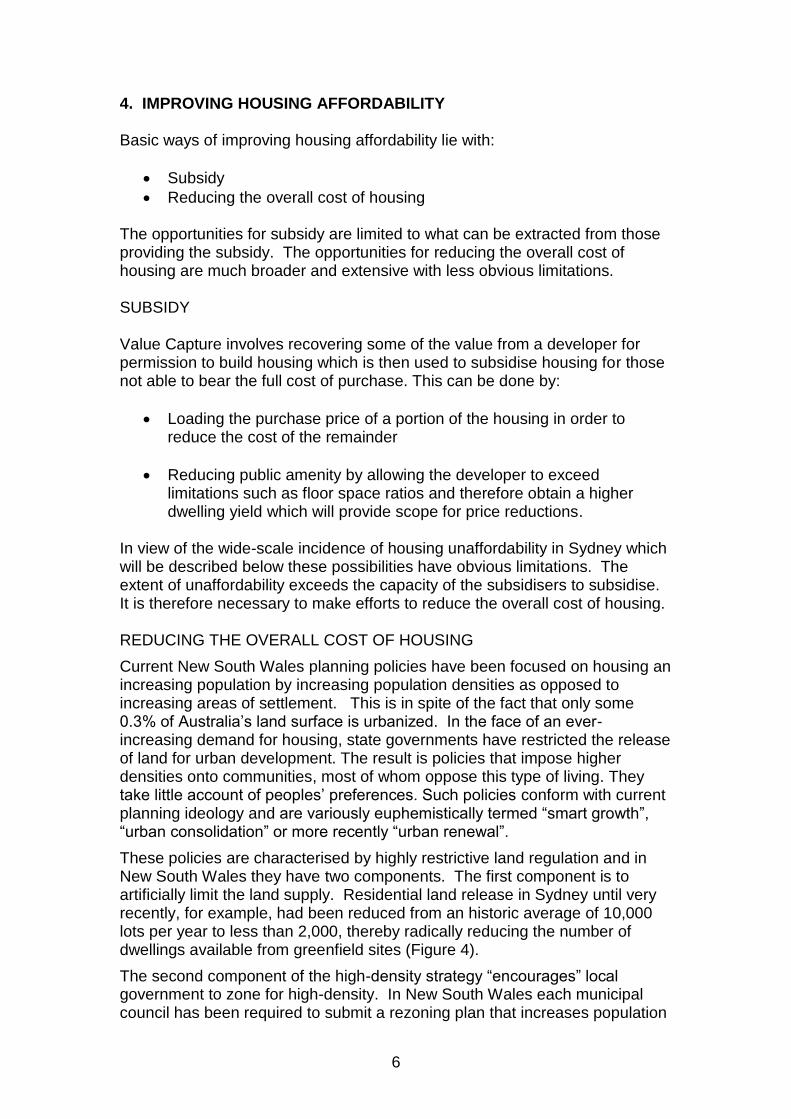
During this period the median price of a home in Sydney has escalated from four times to nine times median family income. The result is that the problem has expanded to vastly exceed that normally posed for the supply of social, public and affordable housing. (Figure 3).
Figure 3. Weighted average, Sources: ABS; RBA; RP Data-Rismark
3
6
4. IMPROVING HOUSING AFFORDABILITY Basic ways of improving housing affordability lie with:
Subsidy
Reducing the overall cost of housing The opportunities for subsidy are limited to what can be extracted from those providing the subsidy. The opportunities for reducing the overall cost of housing are much broader and extensive with less obvious limitations. SUBSIDY Value Capture involves recovering some of the value from a developer for permission to build housing which is then used to subsidise housing for those not able to bear the full cost of purchase. This can be done by:
Loading the purchase price of a portion of the housing in order to reduce the cost of the remainder
Reducing public amenity by allowing the developer to exceed limitations such as floor space ratios and therefore obtain a higher dwelling yield which will provide scope for price reductions.
In view of the wide-scale incidence of housing unaffordability in Sydney which will be described below these possibilities have obvious limitations. The extent of unaffordability exceeds the capacity of the subsidisers to subsidise. It is therefore necessary to make efforts to reduce the overall cost of housing. REDUCING THE OVERALL COST OF HOUSING
Current New South Wales planning policies have been focused on housing an increasing population by increasing population densities as opposed to increasing areas of settlement. This is in spite of the fact that only some 0.3% of Australia’s land surface is urbanized. In the face of an ever-increasing demand for housing, state governments have restricted the release of land for urban development. The result is policies that impose higher densities onto communities, most of whom oppose this type of living. They take little account of peoples’ preferences. Such policies conform with current planning ideology and are variously euphemistically termed “smart growth”, “urban consolidation” or more recently “urban renewal”.
These policies are characterised by highly restrictive land regulation and in New South Wales they have two components. The first component is to artificially limit the land supply. Residential land release in Sydney until very recently, for example, had been reduced from an historic average of 10,000 lots per year to less than 2,000, thereby radically reducing the number of dwellings available from greenfield sites (Figure 4).
The second component of the high-density strategy “encourages” local government to zone for high-density. In New South Wales each municipal council has been required to submit a rezoning plan that increases population
7
density to government satisfaction; otherwise that municipality is adversely impacted and in extreme cases the council’s planning powers can be undemocratically taken away by various means. These tactics force high-density onto communities originally designed for low densities.
Since 1977, during which period the New South Wales population increased by 38%4, the proportion of greenfields land release sites decreased from an annual average of 20% of dwelling production to 5% 5. As a consequence of the resultant land shortage the land component in the price of a house in Sydney has increased from 32% in 1977 to 60% in 2002 6 and to an estimated 70% today. As part of the trend resulting from the Sydney Metropolitan Strategy, over a five-year period (2000 to 2004), annual greenfield housing land production on the Sydney fringe decreased by 6,000 lots.
These prescriptive policies result in an increase in median residential lot prices. As economics teaches, scarcity raises prices. During this period the median price of lots in Sydney escalated from $150,000 to $350,0007 and the median price of a house in Sydney is now about $630,0008, more than it is likely to be if there were no shortages
It has been shown elsewhere that advantages claimed for high-density policies do not materialize9. They do not improve transport, increase housing choice, reduce the cost of services, improve sustainability or assist the ecology.
8
5. EFFECT OF PLANNING POLICY
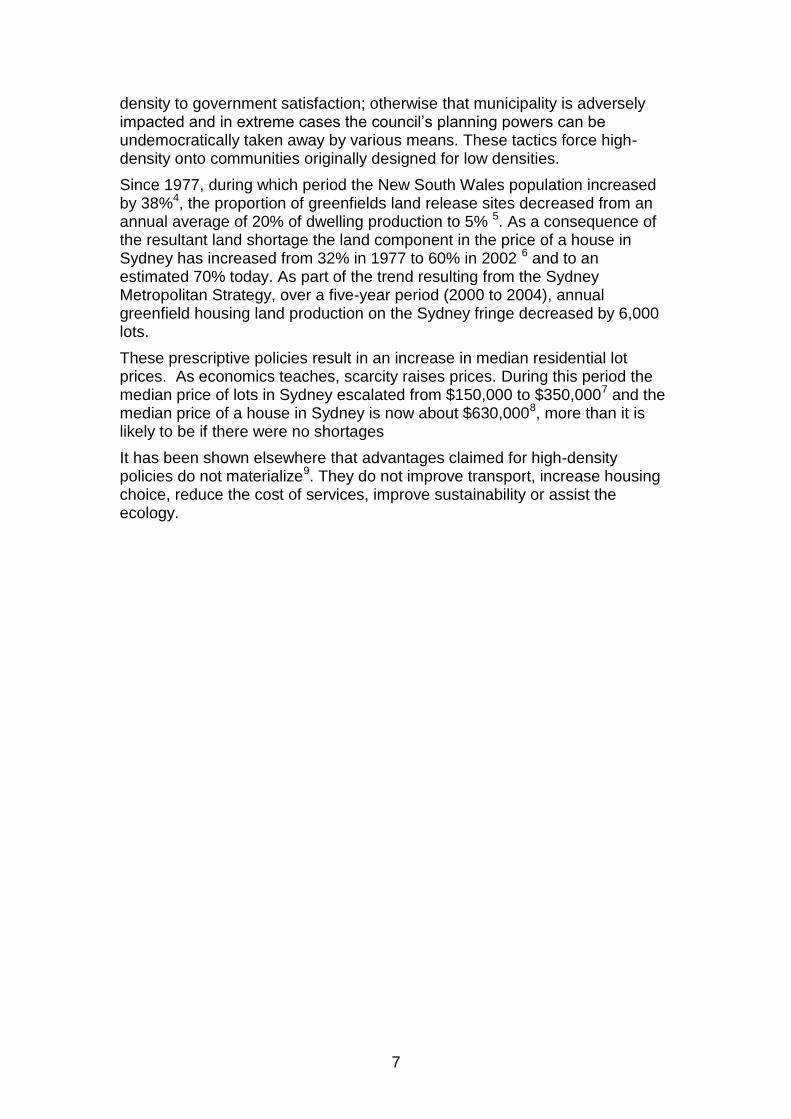
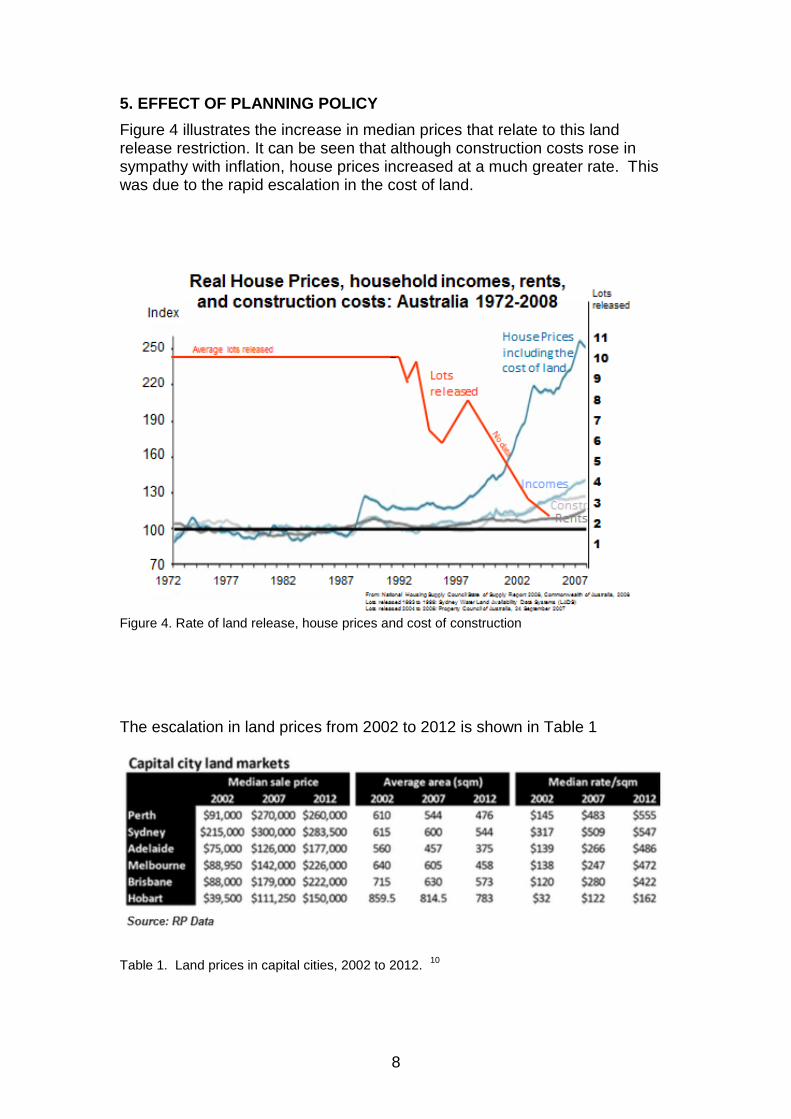
Figure 4 illustrates the increase in median prices that relate to this land release restriction. It can be seen that although construction costs rose in sympathy with inflation, house prices increased at a much greater rate. This was due to the rapid escalation in the cost of land.
Figure 4. Rate of land release, house prices and cost of construction
The escalation in land prices from 2002 to 2012 is shown in Table 1
Table 1. Land prices in capital cities, 2002 to 2012. 10

9
The 10th Annual Demographia International Housing Affordability Survey11 in an international comparison reveals the extent to which houses in Australia’s capital cities have become unaffordable. Of the cities in the nine countries surveyed, Sydney is fourth least affordable, coming behind Hong Kong, Vancouver and San Francisco.
The Demographia Survey portrays a widespread relationship between high housing cost and overly restrictive planning. The depiction below shows housing cost as years of household income needed to purchase a house in a number of jurisdictions.
(median house price divided by gross annual median household income).
Figure 5. Housing cost and land regulation
It is apparent here that housing costs are higher in jurisdictions employing prescriptive land regulation (which limits the availability of land for housing).
The alternative to less restrictive land use regulation is responsive land use regulation (also called "traditional" regulation). This allows development to respond to the market as reflected in the preferences of people and businesses (and subject to reasonable environmental and health regulation).
A comparison of Sydney and Melbourne with restrictive land regulation and Dallas-Fort Worth and Atlanta in the United States with responsive land regulation starkly illustrates the effect of prescriptive land restriction policies. These cities had equivalent populations in the early 1980s. The population growth of the latter two have since exceeded that of the Australian cities, yet their housing costs today are almost one third of that of the Australian cities.

10
0
1
2
3
4
5
6
7
1981 2008
Population: 1981-2008SYDNEY, MELBOURNE, DALLAS-FORT WORTH & ATLANTA
Pop
ula
tio
n in
Mill
ion
s
DALLAS-FORT WORTH
ATLANTA
SYDNEY
MELBOURNE
0
1
2
3
4
5
6
7
8
9
10
1981 1986 1991 1996 2001 2006 2009
Housing AffordabilitySYDNEY, MELBOURNE, DALLAS-FT WORTH & ATLANTA
ATLANTA
SYDNEY
DALLAS-FORT WORTH
Med
ian
Mu
ltip
le
MELBOURNE
Figure 6. Housing affordability in four jurisdictions (from http://www.demographia.com/dhi.pdf)
Current housing construction and land cost in Dallas Fort-Worth, Atlanta and Houston where land for development is freely available is shown in Table 2.
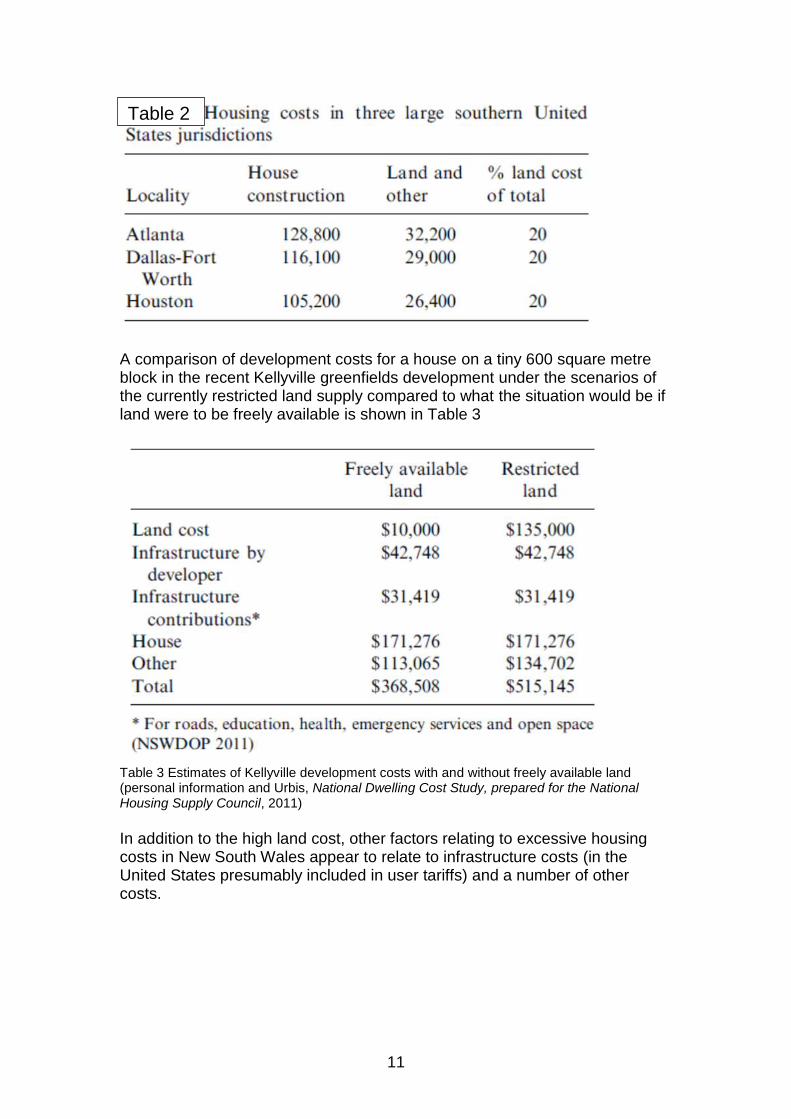
11
A comparison of development costs for a house on a tiny 600 square metre block in the recent Kellyville greenfields development under the scenarios of the currently restricted land supply compared to what the situation would be if land were to be freely available is shown in Table 3
Table 3 Estimates of Kellyville development costs with and without freely available land (personal information and Urbis, National Dwelling Cost Study, prepared for the National Housing Supply Council, 2011)
In addition to the high land cost, other factors relating to excessive housing costs in New South Wales appear to relate to infrastructure costs (in the United States presumably included in user tariffs) and a number of other costs.
Table 2
12
6. STATEMENTS RELATING TO LAND COSTS In its policy agenda the Urban Task Force, which describes itself as “representing Australia's most prominent property developers and equity financiers” reports on attempts to limit Sydney’s growth. It states these attempts “saw a spike in residential property prices from 1999 to 2003 leading to the rapid slowing in NSW population growth”. Referring to the Metropolitan Strategy, the policy it states “The development of serviced residential lots – promised to be an average of 6,000 to 7,000 a year – simply has not eventuated”. The Metropolitan Strategy itself warns that such an outcome ‘would put great pressure in Sydney’s existing suburbs and character and would potentially further reduce housing affordability’12 . The Task Force also states “Zoning and strategic policy restrictions reduce competition amongst property owners, and therefore increase the price of land available for large development projects”13 The Governor of the Reserve Bank, Ian Macfarlane, offered the following evidence to the House of Representatives, Standing Committee on Economics, Finance and Public Administration:
“Why has the price of an entry-level new home gone up as much as it has? Why is it not like it was in 1951 when my parents moved to East Bentleigh, which was the fringe of Melbourne at that stage, and where they were able to buy a block of land very cheaply and put a house on it very cheaply? Why is that not the case now? I think it is pretty apparent now that reluctance to release new land plus the new approach whereby the purchaser has to pay for all the services up front – the sewerage, the roads, the footpaths and all that sort of stuff – has enormously increased the price of the new, entry-level home.”14
13
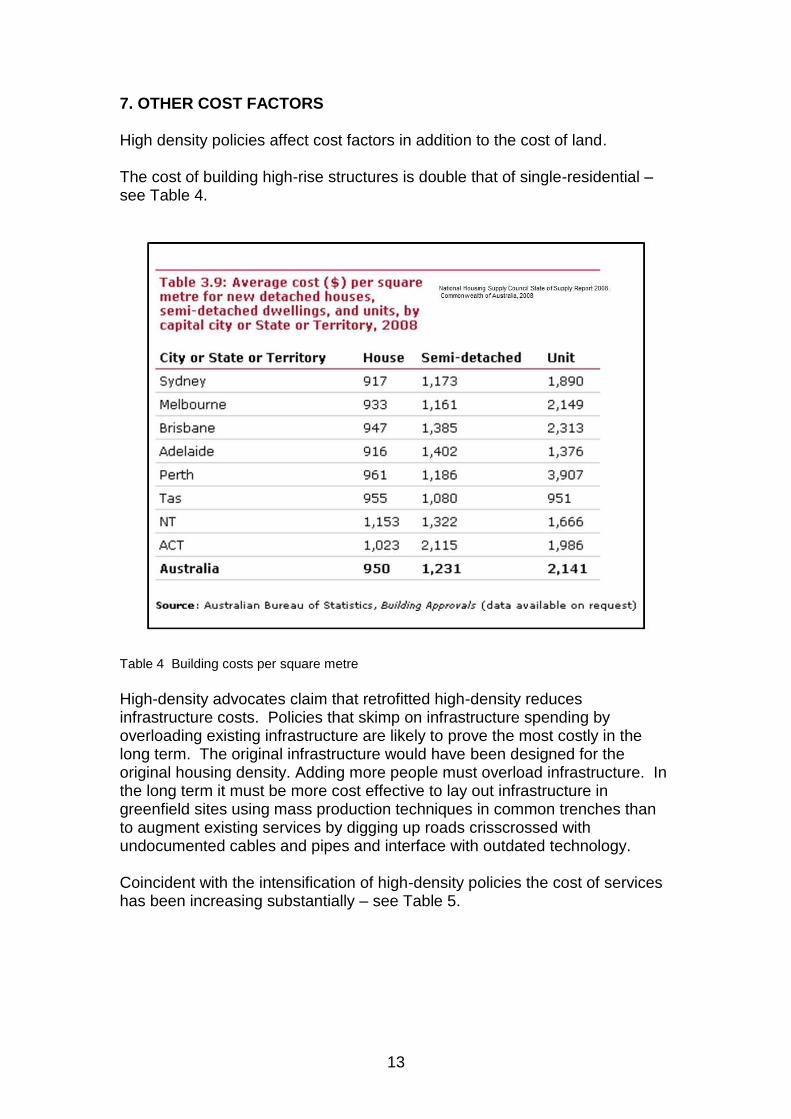
7. OTHER COST FACTORS High density policies affect cost factors in addition to the cost of land. The cost of building high-rise structures is double that of single-residential – see Table 4.
Table 4 Building costs per square metre
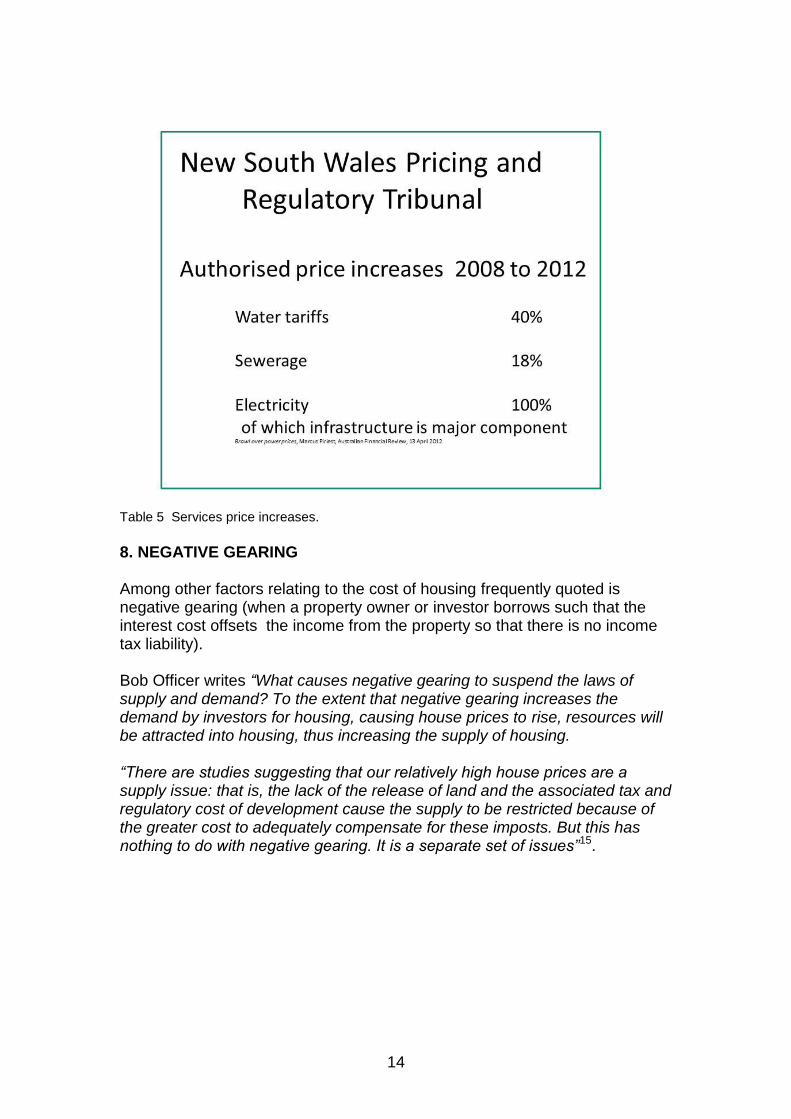
High-density advocates claim that retrofitted high-density reduces infrastructure costs. Policies that skimp on infrastructure spending by overloading existing infrastructure are likely to prove the most costly in the long term. The original infrastructure would have been designed for the original housing density. Adding more people must overload infrastructure. In the long term it must be more cost effective to lay out infrastructure in greenfield sites using mass production techniques in common trenches than to augment existing services by digging up roads crisscrossed with undocumented cables and pipes and interface with outdated technology. Coincident with the intensification of high-density policies the cost of services has been increasing substantially – see Table 5.
14
Table 5 Services price increases.
8. NEGATIVE GEARING Among other factors relating to the cost of housing frequently quoted is negative gearing (when a property owner or investor borrows such that the interest cost offsets the income from the property so that there is no income tax liability). Bob Officer writes “What causes negative gearing to suspend the laws of supply and demand? To the extent that negative gearing increases the demand by investors for housing, causing house prices to rise, resources will be attracted into housing, thus increasing the supply of housing. “There are studies suggesting that our relatively high house prices are a supply issue: that is, the lack of the release of land and the associated tax and regulatory cost of development cause the supply to be restricted because of the greater cost to adequately compensate for these imposts. But this has nothing to do with negative gearing. It is a separate set of issues”15.
15
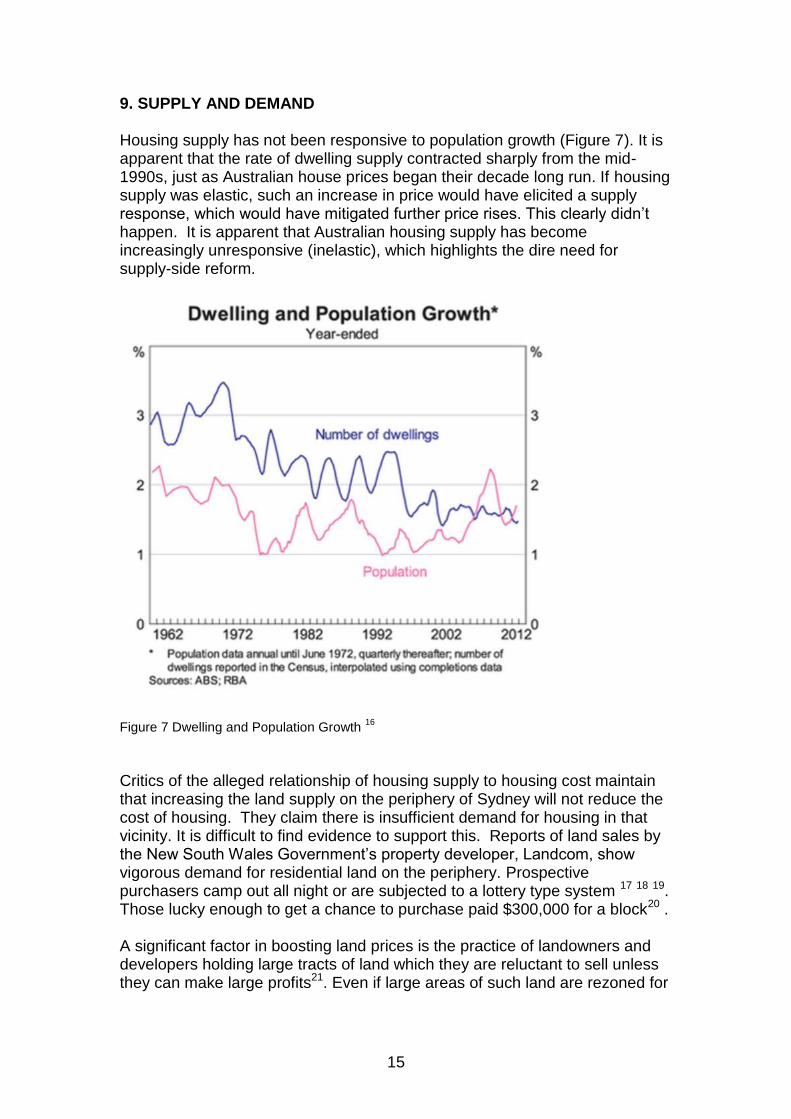
9. SUPPLY AND DEMAND Housing supply has not been responsive to population growth (Figure 7). It is apparent that the rate of dwelling supply contracted sharply from the mid-1990s, just as Australian house prices began their decade long run. If housing supply was elastic, such an increase in price would have elicited a supply response, which would have mitigated further price rises. This clearly didn’t happen. It is apparent that Australian housing supply has become increasingly unresponsive (inelastic), which highlights the dire need for supply-side reform.
Figure 7 Dwelling and Population Growth
16
Critics of the alleged relationship of housing supply to housing cost maintain that increasing the land supply on the periphery of Sydney will not reduce the cost of housing. They claim there is insufficient demand for housing in that vicinity. It is difficult to find evidence to support this. Reports of land sales by the New South Wales Government’s property developer, Landcom, show vigorous demand for residential land on the periphery. Prospective purchasers camp out all night or are subjected to a lottery type system 17 18 19. Those lucky enough to get a chance to purchase paid $300,000 for a block20 . A significant factor in boosting land prices is the practice of landowners and developers holding large tracts of land which they are reluctant to sell unless they can make large profits21. Even if large areas of such land are rezoned for
16
development, this practice, known as “land warehousing” reduces elasticity of supply and can maintain the cost of land higher than it otherwise would be 13. There can be little doubt that in a theoretical scenario in which land on the periphery of Sydney could be freely developed (excluding specific areas where this is prohibited for valid reasons) the price of housing lots on the periphery would plummet. There are easily observable examples of the effect of supply and demand on housing cost. In Western Australian towns such as Karratha during the mining boom scarcity caused the median price of houses to reach $900,000. With the boom coming to an end the prices are sliding. In the small town of Richmond where there is no demand housing blocks are being offered for the price of $1.00. Finally, one merely needs to ask any estate agent whether prices increase when there is a shortage of housing stock and decrease when there is a surplus. 10. CONCLUSION
It is apparent that the major factor affecting housing affordability in New South Wales cities relates to current prescriptive planning regimes. The distortion in the housing market resulting from the supply-demand imbalance is enormous by any measure and affects every other area of the economy. New home owners pay a much higher percentage of their income on house payments than they should. Similarly, renters are paying increased rental costs reflective of the higher capital and financing costs in turn paid by landlords. Many families now need two incomes to make ends meet whereas previously one sufficed. There has been a forced misallocation of capital and family income into mortgage payments. Many young people now face the prospect of never owning their own home as well as a much larger section of the population who now can be classed as underprivileged. Home ownership has become the privilege of the few rather the rightful expectation of most people. In time the fact that new generations will not be able to afford a family home will be bitterly resented. Anecdotal evidence indicates dissatisfaction is becoming widespread.
The economic consequences of all that has happened over these past few years are profound and damaging. The capital structure of the economy has been severely affected and getting it back into alignment will take considerable time and effort. There should be an optimal balance between prescriptive and responsive land regulation. Within reasonable limits land regulation should be reactive to community needs and maximise opportunities to cater for these needs. This should maximise the availability of affordable housing and reduce the incidence of people being unable to secure a vital human need - regular, safe, secure, and adequate housing.

17
11. REFERENCES 1 Munro, K., The cold reality of homelessness bites deep on winter streets, Sydney Morning
Herald, 27-28 July 2013. 2 http://www.macrobusiness.com.au/2014/02/the-rba-is-completely-lost-on-housing-supply/
3 Reserve Bank of Australia,, Submission to the Inquiry into Affordable Housing, Senate
Economics References Committee, February 2014 4 Australian Bureau of Statistics
5 New South Wales Department of Planning Metropolitan Development Program 2007,
Section 3, p 31, Figure 3.5: Sydney Region Dwelling Production - Existing Urban and Greenfield Areas (1981/82 - 2011/12) 6 Housing Industry Association, Restoring Housing Affordability – the housing industry’s
perspective, Housing Industry Association Ltd, Australia, July 2003. 7 UDIA, 2009. (Urban Development Institute of Australia) The 2009 UDIA State of the Land :
National Land Supply Study, p.11 8 The median price for a house in Sydney is given as: $651,000 in B.Gora, Sydney house
prices worse than London or New York. Sunday Telegraph, 30 May 2010; And as: $637,600 (September 2011) in 8
th Annual Demographia International Housing Affordability
Survey, Dec 2011, p.41, http://www.demographia.com/dhi.pdf [Accessed 6 March 2012] 9 Recsei, T., Comment on Centre for International Economics report on alternative growth
paths for Sydney, Australian Planner Vol. 50 no. 3, 257-266, 2013 10
http://www.macrobusiness.com.au/2014/02/the-rba-is-completely-lost-on-housing-supply/ 11
http://www.demographia.com/dhi.pdf 12
UTA - 1 (Urban Taskforce Australia), Policy Agenda, http://www.urbantaskforce.com.au/index.php?option=com_content&view=article&id=1198:fact-sheet-getting-sydney-back-on-track&catid=41:policy-agenda&Itemid=36 [accessed 2 June 2012] 13
UTA - 2011 (Urban Taskforce Australia) Making it work Initial submission by the Urban Taskforce to the preliminary stage of the Planning Review. August 2011 http://www.urbantaskforce.com.au/index.php?option=com_content&view=article&id=29&Itemid=43 14
Macfarlane, I., 2006. Address to the House of Representatives Standing Committee on Economics, Finance and Public Administration 2006. 15
Officer, B., 2014, Removing negative gearing would be a mistake, Australian Financial Review, 24 February 2014. 16
http://www.macrobusiness.com.au/2014/02/the-rba-is-completely-lost-on-housing-supply/ 17
Vallejo,J.,2008. Camping out to claim land. Daily Telegraph 15 November 2008 18
Pollard, K., 2010. Buyers camp out to stake a claim at Warralily. Geelong Advertiser, 11 August 2010 19
Pike,B., 2010, Crowds camp out at Oran Park to stake their claim at new housing development, Macarthur Chronicle, 26 March 2010, http://macarthur-chronicle-camden.whereilive.com.au/news/story/crowds-camp-out-at-oran-park-to-stake-their-claim-at-new-housing-developmen/,[accessed 5 June 2012] 20
Squires,R.,2011, Sydney’s land lottery, Sunday Telegraph, 27 February 2011, http://www.dailytelegraph.com.au/property/sydneys-land-lottery/story-e6freztr-1226012554896 [accessed 5 June 2012] 21
Perinotto, T., 2007. Land hoarding a problem. Australian Financial Review, 2 August 2007