inquiry into environmental design & public health
DESCRIPTION
This Victorian state government report explores the compelling evidence linking these public health challenges to the planning and design of our urban environments.TRANSCRIPT

Inquiry into Environmental Design and Public Health in Victoria Final Report May 2012 Legislative Council Environment and Planning References Committee Report No. 1

Inquiry into Environmental Design and Public Health
in Victoria
Legislative Council
Environment and Planning References Committee
Report No. 1
May 2012
Ordered to be Printed
By Authority Government Printer for the State of Victoria
No. 123 Session 2010‐12

Legislative Council Environment and Planning References Committee
Inquiry into Environmental Design and Public Health in Victoria ISBN: 978‐0‐9872446‐2‐8

Contents
i
Contents
Environment and Planning References Committee iii
Chair’s foreword v
Executive summary vii
Recommendations x
Acronyms xviii
Chapter 1: Introduction 1
1.1 Establishment of the Committee 4
1.2 Terms of Reference 5
1.3 Inquiry process 6
1.4 Scope of the Inquiry 6
1.5 Summary of submissions 7
1.6 Structure of the Report 8
Chapter 2: Chronic disease 9
2.1 The cost of chronic disease 10
2.2 Type 2 diabetes 11
2.3 Cardiovascular disease 13
2.4 Mental illness 14
2.5 Respiratory illness 15
Chapter 3: Contributing factors to chronic disease 17
3.1 Obesity 17
3.1.1 Obesity and the built environment: the evidence 19
3.2 Physical inactivity 21
3.2.1 Physical inactivity and the built environment: the evidence 22
3.3 Healthy eating 26
3.4 Alcohol 29
3.5 Socio‐economic status 31
3.6 Ageing population 34
3.7 Climate change 36
Chapter 4: Urban growth and public health 41
4.1 Urban population growth 41
4.2 Service delivery 43
4.3 Housing density and mixed land use 44
4.4 ‘Affordable housing’ and car dependency 50
4.5 Urban renewal 52
4.6 Design for older people and the disabled 54
Chapter 5: Health in planning: legislation, guidelines and policy approaches 59
5.1 Planning and Environment Act 1987 59
5.1.1 Health and wellbeing in the Planning and Environment Act 1987 61

Inquiry into Environmental Design and Public Health in Victoria
ii
5.2 Victoria Planning Provisions 64
5.2.1 Health and wellbeing in the Victoria Planning Provisions 64
5.3 Health Impact Assessment 66
5.4 Precinct Structure Plans and Guidelines 69
5.4.1 Growth Corridor Plans 70
5.4.2 Evidence received on PSPs 70
5.5 Urban Design Charter 73
5.6 Planning panels 74
5.7 Melbourne Metropolitan Strategy 75
5.7.1 Case Study: Health in All Policies 76
5.8 Municipal Public Health and Wellbeing Plans 78
5.9 Environments for Health Municipal Public Health Planning Framework 80
5.9.1 Shade 83
Chapter 6: Parks and open spaces 85
6.1 Physical benefits 87
6.1.1 Case study: Active in Parks program 88
6.2 Psychological benefits 89
6.3 Children’s development 90
6.4 Quality of green and public spaces 92
6.5 Building community 95
6.6 The built environment and crime 96
Chapter 7: Active transport 99
7.1 Walking 99
7.2 Cycling 103
7.3 Public transport 106
7.4 Trips to work and school 109
7.5 Road safety 112
7.6 Active transport and outer suburban and regional areas 116
7.6.1 Case study: Corio Norlane 118
Chapter 8: Case studies 121
8.1 Bradmill 121
8.2 Armstrong Creek 122
8.3 Kingston Green Wedge 123
8.4 Selandra Rise 124
Appendix A: Submissions received 127
Appendix B: List of witnesses 129
Appendix C: List of site visits 132
Appendix D: Extracts of the proceedings 133
Bibliography 153
Minority Report 167

Environment and Planning References Committee
iii
Environment and Planning References Committee Committee members
Ms Gayle Tierney – Chair Member for Western Victoria Region
Mrs Inga Peulich – Deputy Chair Member for South Eastern Metropolitan Region
Mr Andrew Elsbury Member for Western Metropolitan Region
Mrs Jan Kronberg Member for Eastern Metropolitan Region
Mr Craig Ondarchie Member for Northern Metropolitan Region
Ms Sue Pennicuik Member for Southern Metropolitan Region
Mr Johan Scheffer Member for Eastern Victoria Region
Mr Brian Tee Member for Eastern Metropolitan Region
Committee staff
Mr Keir Delaney – Secretary
Dr Rosalind Hearder – Research Officer
Mr Anthony Walsh – Research Assistant
Address all correspondence to –
Environment and Planning Legislation Committee Department of the Legislative Council Parliament of Victoria Spring Street MELBOURNE VIC 3002
Telephone: (03) 8682 2816 Facsimile: (03) 9651 8799 Email: [email protected] Web: http://www.parliament.vic.gov.au/standing‐committee‐on‐
environment‐and‐planning/references‐committee

Inquiry into Environmental Design and Public Health in Victoria
iv
Chair’s foreword
v
Chair’s foreword
I am pleased to present the final report of the Inquiry into Environmental Design and
Public Health in Victoria.
This is the first inquiry undertaken by the Environment and Planning References
Committee, one of three new references Committees established under the Standing
Orders of the Legislative Council in late 2010.
In recent decades, Victoria has been a world leader in innovative and effective initiatives
to prevent disease and promote health. However, today, rates of serious chronic diseases
are rising, including type 2 diabetes, heart disease and respiratory illness. Risk factors that
heighten the chances of developing chronic disease are also increasing, such as obesity
and physical inactivity. Coupled with an ageing population, these trends will place
unsustainable pressure on our healthcare system and state economy in coming years.
This report explores the compelling evidence linking these public health challenges to the
planning and design of our urban environments. We know that there are a range of health
benefits from designing environments that encourage physical activity through walking,
cycling and using public transport. We know that open space and green areas not only
provide opportunities for physical activity but also benefit mental health. We are also
increasingly aware that the style of sprawling low density, car‐oriented residential
development that characterised Victorian urban fringe areas in the past can be a barrier to
people making healthy lifestyle choices.
This report emphasises the importance of considering health in the design of our
communities, such as: creating environments that promote physical exercise and social
interaction; providing access to healthy, fresh food; facilitating access to green and other
open public spaces; and ensuring inclusivity and accessibility in the built environment.
Such health‐promoting elements can be purposely designed into the built environment,
or, as is too often the case, designed out.
Importantly, the Committee heard that there is a strong consensus between the planning
and the public health professions on how to approach the problems in Victoria. Based on
this evidence, the report makes 36 recommendations. An important first step, and a key
focus of this report, is to embed considerations of health and wellbeing throughout the
planning system’s legislative and policy framework. The concurrent development of a new
planning strategy for metropolitan Melbourne and the review of the Planning and
Environment Act 1987 both present opportunities to do this and to take up the other
themes and ideas put forward in this report.
The report acknowledges that the built environment is only one of several factors
influencing health and wellbeing. Technology and changes in the nature of work mean
that we live increasingly sedentary lives. Service provision is also fundamental –
continuing investment is needed in public transport and primary health care, particularly
in our outer suburbs and regional areas. Jobs must be located closer to where people

Inquiry into Environmental Design and Public Health in Victoria
vi
reside, requiring a stronger emphasis on developing local economies in the outer suburbs
of Melbourne and in our regional cities. Nevertheless, there are numerous practical,
achievable recommendations in this report to influence the planning and design of
communities.
The Committee was encouraged by the high level of public interest in the Inquiry. I thank
all those who took time to present to the Committee, meet with us on site visits or make
written submissions. I also thank members of the Committee for their work and
commitment to the Committee’s Inquiry.
Finally, I would like to thank the staff of the Committee secretariat for their research,
writing and administrative assistance: Mr Keir Delaney, Secretary, Dr Rosalind Hearder,
Research Officer, and Mr Anthony Walsh, Research Assistant.
Gayle Tierney, MLC Chair

Executive summary
vii
Executive summary
On 5 April 2011 the Legislative Council’s Environment and Planning References
Committee received wide‐ranging terms of reference on the contribution of
environmental design to public health in Victoria. In preparing this report, the
Committee consulted with a broad cross‐section of stakeholders through
submissions and public hearings, made a number of site visits and assessed the
extensive relevant literature.
Future challenges for public health
Victoria has seen significant public health improvements in recent decades due to
a range of government education programs and preventive health initiatives. In
today’s developed world however, more people die from chronic disease than
infectious disease. Chronic conditions including type 2 diabetes, cardiovascular
disease, mental illness and respiratory illness now account for the highest social
and economic burden on the Victorian healthcare system, and their rates are
predicted to rise.
Many chronic diseases are preventable. There are several risk factors that make
people more vulnerable to chronic disease including obesity, levels of physical
activity, diet and alcohol consumption, and socio‐economic status. The interaction
and combination of these factors can increase the likelihood of chronic disease.
The development and severity of chronic disease can be attributed partially to
lifestyle choices. However international and Australian evidence shows that the
built environment plays an influential role in encouraging or discouraging healthy
behaviours.
Other significant future challenges to Victorians’ health include a rapidly growing
population in outer suburban locations, an increasing ageing population and the
potential environmental consequences of climate change. Effective urban planning
likewise has a key role to play in mitigating the negative health effects of all these
trends.
Health in planning
Contributors to this Inquiry consistently emphasised that the Victorian planning
system needs to be better integrated with health and wellbeing goals. The
overarching legislation for state planning – the Planning and Environment Act 1987
– does not directly engage with considerations of health. Similarly, the Committee
heard that subordinate instruments (such as the Victoria Planning Provisions),
planning guidelines (such as the Precinct Structure Planning Guidelines) and
associated policy approaches (including the forthcoming Melbourne Metropolitan
Strategy) should offer specific direction in developing a healthier built
environment.

Inquiry into Environmental Design and Public Health in Victoria
viii
Victorian local governments play an important role in community wellbeing
through the delivery and regulation of public health infrastructure and disease
prevention measures. Evidence put to the Committee identified several
opportunities to assist local governments in this role, including aligning Municipal
Public Health and Wellbeing Plans with Municipal Strategic Statements, which set
the high‐level strategic direction for all the controls in local planning schemes. The
Committee also recommends that the Environments for Health framework, while
considered generally effective, be reviewed and updated.
Other opportunities to incorporate health throughout the planning system are
considered, including reviewing Precinct Structure Plans, involving health
professionals in the precinct structure planning process, and incorporating health
impact assessments into major planning decisions.
Urban growth and public health
Victoria’s rapid population growth will continue to put pressure on housing,
services and community infrastructure, making it increasingly vital to integrate
planning with public health goals. The prevailing post‐war design of outer
suburban Melbourne and Victorian regional centres – that is, sprawling, low
density lots with large, detached houses – has been criticised for creating built
environments that may not promote good public health outcomes. Such areas may
feature less provision for physical activity (such as walking and cycling), contribute
to poorer air quality due to high car emissions and fewer green spaces, and
provide fewer opportunities for social interaction and building community. They
may also fail to provide a variety of housing options for Victoria’s growing urban
and ageing populations who represent a diverse range of ages and demographics.
Several witnesses testified to the importance of increasing residential housing
densities, particularly in outer suburban areas and pockets of rapid population
growth. Higher densities and mixed land use can offer many health co‐benefits,
such as attracting a diverse variety of ages and cultures within a community,
attracting better active transport networks to accommodate more population, and
providing economic incentives to develop local shops and destinations.
Accessible and inclusive housing is increasingly essential in Victoria, both in new
developments and existing housing stock. This is particularly relevant when
considering Victoria’s growing ageing population and those living with physical
disabilities. Evidence shows, for example, that older people who can ‘age in place’
and stay in their homes or areas longer will lead more active and healthy lives.
Public spaces, active transport networks and health
This report emphasises two particular elements of the built environment that
promote healthy lifestyles choices: parks and other public open spaces, and active
transport modes (walking, cycling and public transport).

Executive summary
ix
A key finding of this Inquiry is that one of the most important aspects of the built
environment that impacts positively on health is provision of parks and other
public spaces. Extensive research links multiple positive physical, mental and social
health benefits to living near green and open public areas. Conversely, health
outcomes are generally poorer in communities that lack such spaces. Green public
spaces encourage a range of physical activities, provide opportunities for social
interaction and aid in mitigating urban heat island effects.
While provision of green and other public space is important, its quality is also
relevant to health outcomes. Attractive public spaces which offer multiple
functions and amenities encourage use for a variety of health‐promoting activities.
Shade provision in public parks and outdoor community sporting areas, for
example, is an important part of reducing Victoria’s rates of skin cancer.
Another vital part of encouraging healthy behaviours in the built environment is
facilitating active transport. Walking, cycling and public transport networks allow
people to move between places in ways that increase exercise levels. Other health
co‐benefits in using active transport include opportunities for social interaction,
reducing cars on roads and decreasing traffic congestion and air pollution, and
increasing community safety.
As in housing design, safe, accessible and reliable active transport networks need
to include all groups that may have particular needs, such as older people, the
disabled and parents with young children. The Committee also received evidence
that decreasing rates of children walking or cycling to school, and low numbers of
Victorians cycling for transport. are both often linked to concerns about road
safety.
Case studies
This report includes several case studies from information gained at site visits and
otherwise provided to the Committee during the course of the Inquiry. Members
of the Committee conducted site visits to the City of Melbourne (Docklands), the
City of Maribyrnong (Bradmill development), the City of Geelong (Armstrong
Creek), the City of Wyndham (Point Cook) and the City of Kingston (Kingston Green
Wedge).

Inquiry into Environmental Design and Public Health in Victoria
x
Recommendations
Principles informing the recommendations
The Committee recognises that increasing rates of chronic disease in Victoria,
combined with an ageing population, represent an unsustainable social and
economic burden.
Many chronic diseases are preventable, and increasing evidence shows that the built environment can influence whether people are more vulnerable to developing chronic disease.
Strategies to address chronic disease should focus on prevention rather than treatment.
The Committee believes that Government has a key role in facilitating built
environments which makes it easier for people to adopt healthy lifestyle
behaviours.
The Committee believes that as part of a coordinated response to these public
health challenges:
Considerations of health and wellbeing must be incorporated into planning legislation, statutory rules and regulations, and policy approaches.
All levels of government, community groups, private industry and professionals in the planning, health and building sectors need to be consulted and involved.
Land use planning should be based on the principles of promoting health and wellbeing, environmental and economic sustainability, and social inclusiveness.
Retrofitting healthy design elements – particularly those which facilitate physical activity – into the existing built environment is more complicated and expensive than embedding them in initial planning stages.
Traditional urban development patterns of low density sprawl which often force residents into patterns of little physical activity and car dependency are not health‐promoting, and should no longer represent the dominant development pattern in Melbourne’s metropolitan fringe areas and Victoria’s expanding regional centres.
Green and other public open spaces should be recognised and valued for their proven contribution to physical and psychological health.

Recommendations
xi
Planning and Environment Act 1987
Recommendation 12
That the Victorian Government amends section 4(1) of the Planning and
Environment Act 1987 to include ‘the promotion of environments that protect and
encourage public health and wellbeing’ (or similar wording) as an objective of
planning in Victoria. [page 63]
Recommendation 14
That the Victorian Government amends section 12 of the Planning and
Environment Act 1987 to require planning authorities to conduct a Health Impact
Assessment for key planning decisions, such as major urban developments or
making or amending a planning scheme. The Committee further recommends that:
a suitable and easy to use Health Impact Assessment tool be developed by the Department of Health and the Department of Planning and Community Development, in consultation with the planning industry and local governments
the Department of Health and the Department of Planning and Community Development provide resources and support to local governments to conduct Health Impact Assessments.
[page 69]
Recommendation 22
That the Victorian Government amends section 12A(4) of the Planning and
Environment Act 1987 to require Municipal Strategic Statements to be consistent
with Municipal Public Health and Wellbeing Plans. Following this, the Government
should conduct an audit of Municipal Strategic Statements annually to monitor
compliance with the amendment. [page 80]
Municipal Public Health and Wellbeing Plans
Recommendation 23
That the Department of Health reviews and updates Environments for Health and
provides ongoing assistance to local government to use the framework in
preparing Municipal Public Health and Wellbeing Plans. [page 83]
Recommendation 24
That the Department of Health provides guidance to local governments to evaluate
Municipal Public Health and Wellbeing Plans and to benchmark with other
municipalities. [page 83]

Inquiry into Environmental Design and Public Health in Victoria
xii
Recommendation 25
That the Department of Health works with SunSmart and local governments to
ensure that UV protective shade measures are included in Municipal Public Health
and Wellbeing Plans. This should be followed with regular audits of the Plans to
monitor compliance with the measures. [page 84]
Victoria Planning Provisions
Recommendation 13
That the Victorian Government amends the State Planning Policy Framework
within the Victoria Planning Provisions to include a policy on planning for health
and wellbeing. Following from this, clauses throughout the Victoria Planning
Provisions which relate to health and wellbeing should be amended as is necessary
to provide clear and coherent direction for the planning system. [page 66]
Recommendation 7
That the Victorian Government amends the Victoria Planning Provisions to
encourage greater housing density and minimum requirements of open space,
while maintaining choice in the market. [page 50]
Precinct Structure Plans
Recommendation 15
That a review of the effectiveness of Precinct Structure Plans be undertaken, with
a particular emphasis on whether expected outcomes for green and other public
spaces, and walking, cycling and public transport infrastructure, are being
delivered. [page 72]
Recommendation 16
That the Victorian Government revises the Precinct Structure Planning Guidelines
to:
identify public health and wellbeing as a priority matter for Precinct Structure Plans
provide clear direction on how public health and wellbeing should be advanced within Precinct Structure Plans.
[page 72]
Recommendation 18
That Planning Panels Victoria ensures that all panels established as part of the
growth areas Precinct Structure Planning process have a public health specialist as
part of their membership. [page 75]
Recommendations
xiii
Recommendation 29
That the Victorian Government requires Precinct Structure Plans to ensure the
provision of community space, such as community gardens, in new housing
developments. [page 96]
Melbourne Metropolitan Strategy
Recommendation 3
That the Melbourne Metropolitan Strategy includes measures to identify and
protect valuable agricultural land in peri‐urban Melbourne. [page 29]
Recommendation 20
That the Victorian Government ensures the Melbourne Metropolitan Strategy
includes public health and wellbeing as a key goal supported by measurable
initiatives, such as the provision of walking and cycling infrastructure, public
transport and public open space. The Committee further recommends that the
Strategy provides for a review of implementation every five years. [page 76]
Consistency of policy approaches across government
Recommendation 21
That the Victorian Government, recognising that the work of all government
agencies influence health and wellbeing, adopts a whole‐of‐government approach
to health policy‐making, such as the ‘Health in All Policies’ model used by the
South Australian Government and the European Union. [page 78]
Recommendation 9
That Environment Protection Authority Victoria plays an increased strategic role at
an early stage in major land use planning decisions. [page 54]
Recommendation 17
That the Victorian Government reviews the Urban Design Charter to:
strengthen the role and function of the Charter in guiding Victorian urban design
ensure that design objectives which promote health and wellbeing are included in the Charter.
[page 74]

Inquiry into Environmental Design and Public Health in Victoria
xiv
Recommendation 19
That the Victorian Government appoints public health specialists (or persons with
appropriate health expertise) to the Boards of the Growth Areas Authority and
Urban Renewal Authority. [page 75]
Contaminated land/air quality/heat island effect
Recommendation 8
As part of its response to the Victorian Auditor‐General’s reports in relation to
contaminated sites, the Victorian Government, together with local government:
undertakes a systematic and coordinated review of its contaminated land sites audit and considers its implications for health and wellbeing
reviews the current legislative framework for developing contaminated land with a view to making it clearer and more consistent.
[page 54]
Recommendation 5
That the Victorian Government urgently develops a whole‐of‐government
response to the emerging health problems stemming from poor air quality and the
urban heat island effect in Melbourne. As part of this, the design of residential
communities should prioritise tree planting and green spaces to provide shade,
improve respiratory health and to lower ambient temperatures in summer
months. [page 40]
Food and alcohol
Recommendation 1
That the Victorian Government:
works with VicHealth to commission further Victorian research into the cumulative health and wellbeing impacts of the density of fast food outlets on a community
assists local governments to map all food outlets within a local government area
develops a planning mechanism that can be used by local councils to limit the oversupply of fast food outlets in communities
develops a plan to facilitate the supply of healthy food choices to Victorians.
[page 28]
Recommendation 2
That the Victorian Government conducts a review into the economic,
environmental and social importance of food production and distribution in
Victoria and its consequences for public health. [page 29]

Recommendations
xv
Recommendation 4
That the Victorian Government:
works with VicHealth to commission further Victorian research into the cumulative health and wellbeing impacts of the density of packaged liquor outlets on a community
strengthens planning mechanisms to allow local government to regulate the oversupply of packaged liquor outlets.
[page 31]
An accessible built environment
Recommendation 10
That the Victorian Government supports the introduction of design standards for
new housing to ensure access for seniors and people with limited mobility. [page 57]
Recommendation 11
That the Victorian Government works with local government, developers, the
building industry and community groups to ensure that universal design principles
that improve accessibility are applied to all aspects of the built environment,
including the maintenance and retrofitting of existing building stock, roadways,
cycling and pedestrian paths, and public transport infrastructure.
The Committee further recommends that the Department of Planning and
Community Development assesses progress and reports back to the Parliament
annually on measures taken to improve the accessibility of the built environment
in Victoria. [page 57]
Parks and open spaces
Recommendation 26
That the Victorian Government takes note of the outcomes of Parks Victoria’s
innovative Active in Parks program and identifies opportunities to develop similar
partnerships involving Parks Victoria, the public and private health sectors, local
government and community groups. [page 89]
Recommendation 27
That the Victorian government establishes targets for the provision of green and
open public spaces. [page 94]

Inquiry into Environmental Design and Public Health in Victoria
xvi
Recommendation 28
That the Victorian Government takes the following steps to ensure high quality
open spaces are available:
amends the Precinct Structure Planning Guidelines to establish minimum requirements for open space, including features such as walking paths, play equipment, adult exercise equipment, seating and shade
provides guidance to local government on appropriate rating tools for assessing the quality of public open space
supports the ongoing maintenance of existing open space and the establishment of green and other public spaces in new residential developments, particularly in high density areas.
[page 94]
Walking and cycling
Recommendation 30
That the Victorian Government implements the Victorian Pedestrian Access
Strategy 2010. [page 102]
Recommendation 34
That the Victorian Government continues to support initiatives which aim to
increase the number of children walking and cycling to school, particularly in outer
suburban and regional Victoria, and calls on the State Government to reinstate the
Walking School Bus Program. [page 111]
Recommendation 31
That the Victorian Government:
reviews cycling infrastructure, with a particular focus on improving provision for Melbourne’s outer suburbs and Victoria’s regional cities
sets measurable targets and promotes activities such as the Ride2School Program to increase cycling participation, and reviews targets on an annual basis.
[page 106]

Recommendations
xvii
Public transport and road safety
Recommendation 32
That the Victorian Government recognises that public transport is a key
component of a healthy community, and:
audits current public transport provision, with an emphasis on outer suburban and regional areas
establishes minimum standards and targets for public transport in new outer suburban residential developments, linking important destinations such as schools, shops, places of work, community facilities and green and open public spaces
commits to a program of long‐term investment to improve public transport infrastructure for Melbourne’s outer suburbs and regional metropolitan areas.
[page 109]
Recommendation 33
That the State Government’s transport objectives give priority to connectivity,
safety, accessibility and reliability. [page 109]
Recommendation 35
That the case for the lowering of speed limits to 30 kilometres per hour for school,
residential and other appropriate areas be considered by current or future speed
limit reviews undertaken by VicRoads, in consultation with the Victoria Police and
other stakeholders. [page 115]
Public health and the built environment: the evidence base
Recommendation 36
That the Victorian Government takes note of the Selandra Rise project with a view to:
ensuring key lessons and quantifiable evidence arising from the project regarding health and wellbeing are widely disseminated and inform policy development
encouraging collaborations in residential development between community, private and government bodies.
[page 125]
Recommendation 6
That the Victorian Government, in partnership with universities and relevant
community groups, commissions ongoing research to further develop the evidence
base for the impact of the built environment and urban design on public health
and wellbeing. [page 49]

Inquiry into Environmental Design and Public Health in Victoria
xviii
Acronyms
AILA
BiXE
BMI
CBD
CNDAB
COTA (Vic)
CVD
DPCD
EPA (Vic)
GP
GAA
HIA
HiAP
KGW
MPHWP
MSS
OECD
PIA (Vic)
PSP
RIS
SES
SPPF
SSIG
VCAT
VPP
Australian Institute of Landscape Architects
Bicycle Expenditure Index
Body Mass Index
Central Business District
Corio Norlane Development Advisory Board
Council on the Ageing (Victoria)
Cardiovascular disease
Department of Planning and Community Development
Environment Protection Authority Victoria
General Practitioner
Growth Areas Authority
Health Impact Assessment
Health in All Policies
Kingston Green Wedge
Municipal Public Health and Wellbeing Plan
Municipal Strategic Statement
Organisation for Economic Co‐operation and Development
Planning Institute of Australia (Victorian Division)
Precinct Structure Plan
Regulatory Impact Statement
Socio‐economic status
State Planning Policy Framework
Safe Speed Interest Group
Victorian Civil and Administrative Tribunal
Victoria Planning Provisions

Chapter 1: Introduction
1
Chapter 1: Introduction
Through reducing physical and psychological barriers in the built environment, improvements to health and wellbeing may be experienced fairly and equitably by all Victorians.1
Victorians have seen steady improvements in public health over recent decades.
Through the combined efforts of the Victorian government and world‐leading
health promotion agencies such as VicHealth, people are living longer, standards of
living are high compared to many parts of the world2 and rates of smoking have
decreased significantly.3 In general, the public are also better educated about the
importance of eating well and exercising regularly.4
Melbourne is often described as one of the most ‘liveable’ cities in the world.5
Former metropolitan planning strategies Melbourne 2030 and Melbourne @ 5
million aimed to protect this liveability through sustainable planning strategies to
meet future challenges, particularly Melbourne’s rapid population growth.6
Yet Victoria is currently facing increasing rates of chronic disease and disability.
Chronic conditions such as type 2 diabetes, cardiovascular disease, mental illness
and respiratory illness are now leading causes of disability and death.7 Key risk
factors that contribute to the development of chronic disease are also rising, such
as obesity and physical inactivity. Groups within the Indigenous community and
those living in socio‐economically disadvantaged areas continue to experience ‘a
disproportionate burden of disease and injury.’8 Victoria’s increasing ageing and
urban population both present particular health challenges that will also impact on
the rates of chronic disease.
While definitive causal connections are difficult to prove, there is an emerging
body of Australian and international literature showing that aspects of the built
environment can promote, or be a barrier to, public health and wellbeing.9 People
1 Obesity Policy Coalition, ‘Modernising Victoria’s Planning Act – A discussion paper on opportunities to improve the Planning and Environment Act 1987’, Melbourne, 2009, 2. 2 Australian Institute of Health and Welfare 2010, Australia’s health 2010, AIHW, Canberra, x. 3 ‘Smoking rates in Victoria’, Quit Victoria, 2012, http://bit.ly/IykdnG accessed 13 January 2012. Such changes include a raft of reforms in 2006 to the Tobacco Act 1987: ‘New tobacco laws: Workplaces’, Department of Human Services, 2005, http://bit.ly/HFHQHu; the Tobacco Amendment (Protection of Children) Act 2009, ‘Tobacco reforms’, Department of Health, 2012, http://bit.ly/HrMfyk accessed 13 January 2012. 4 This includes the establishment of the Preventive Health Taskforce and the National Preventative Health Care Strategy, 2009, http://bit.ly/9Gtyx; other former campaigns by the Department of Health and Ageing: ‘Previous Campaigns’, 2007, http://bit.ly/HwoEQI, ‘Related departmental websites’, 2011, http://bit.ly/HYKcUA, ‘Kids – “Go for your life”’, 2012, http://bit.ly/dDh6nv; ‘Healthy living’, Better Health Channel, 2012, http://bit.ly/pVOVqL; ‘Commonwealth Commitments to Primary Health Care in Victoria – Background Paper March 2008’, General Practice Victoria, http://bit.ly/IykQh3; ‘Quit campaign’, VicHealth, http://bit.ly/HuafFz; Department of Health and Ageing, ‘Quitnow’, 2012, http://bit.ly/kpWKII; accessed 13 January 2012. 5 A Ferguson, ‘Melbourne judged world's most liveable city’, Sydney Morning Herald, 30 August 2011, http://bit.ly/nlHEoV, accessed 1 September 2011. 6 Department of Infrastructure 2002 Melbourne 2030: Planning for sustainable growth, Victorian Government, Melbourne; Department of Planning and Community Development 2008 Melbourne 2030: A planning update: Melbourne @ 5 million, Victorian Government, Melbourne. 7 ‘Chronic disease’, Department of Health and Ageing, 2011, http://bit.ly/IdgFKn accessed 7 February 2012. 8 Department of Health 2011 Victorian Public Health and Wellbeing Plan 2011–2015, Prevention and Population Health Branch, Victorian Government, Melbourne, 7. 9 HBEP literature review – Executive Summary, Healthy Built Environments Program, University of New South Wales, Sydney, 2012, 13‐19.

Inquiry into Environmental Design and Public Health in Victoria
2
make behavioural choices that affect their wellbeing ‘within environments that are
either supportive or destructive of good health outcomes.’10 The Victorian Public
Health and Wellbeing Plan 2011‐2015 outlines:
It is not the role of government to tell people what to do to follow a healthy lifestyle – people themselves have to take that responsibility – but governments can and do work hand in hand with the community to encourage healthy habits.11
For example, urban planning that encourages active transport modes (walking,
cycling and public transport) and provides public spaces for outdoor activity is
more likely to facilitate good cross‐community health.
The profession of urban planning had its beginning in the public health domain.
From the mid‐nineteenth century in Australia, rapid industrialisation and
urbanisation gave rise to overcrowding, pollution and rampant communicable
disease. An 1848 Melbourne City Council report drew attention to the need for
drainage, the filthy condition of city streets, ‘poisonous liquid and gaseous matters
generated within the city’, ‘the habit of slaughtering animals in the city proper’,
and ‘Lake Lonsdale’, a large unhealthy swamp in the city’s east.12 These conditions
were blamed for successive waves of infectious diseases, including gastrointestinal
disorders, tuberculosis and typhoid.13
The planning response included the development of a sewerage system and the
protection of potable water supplies. A land use zoning system was created to
separate land polluters (such as factories) from residential areas. In 1929 the
Metropolitan Town Planning Commission was motivated by a vision of a healthy
city when it laid out a blueprint for the public parks and recreational areas still
enjoyed by Melburnians today, noting:
Abundant evidence is available to substantiate the views of city planners, the medical profession and psychologists that proper outdoor recreation has the most beneficial effect on the health, morals and business efficiency of communities and consequently the national life.14
From the mid‐twentieth century, the suburbs became typified as the healthiest
and best place to raise families, in an environment removed from industry and the
squalor of the crowded inner city.15 A 1954 Melbourne planning report called for
houses to be designed and located ‘for health, convenience and amenity, and with
due consideration for social life … Town planning centres around the provision of
living conditions for the people.’16
10 Australian Medical Association Victoria, Submission No. 23, 30 June 2011, 1. 11 Department of Health 2011 Victorian Public Health and Wellbeing Plan 2011–2015, v. 12 ‘Health’, E‐melbourne: the Encyclopaedia of Melbourne Online, School of Historical Studies, University of Melbourne, 2010, http://bit.ly/ycbShT 13 ‘Health’, E‐melbourne: the Encyclopaedia of Melbourne Online. 14 Cited by Ms Fran Horsley, Parks Victoria, Transcript of Evidence, 7 September 2011, 232. 15 S Thompson, ‘A planner’s perspective on the health impacts of urban settings’, NSW Public Health Bulletin, 2007, 18: 157‐160. 16 Melbourne and Metropolitan Board of Works 1954 Melbourne Metropolitan Planning Scheme 1954: Report, Melbourne, http://bit.ly/HEhD2t accessed 12 October 2011.

Chapter 1: Introduction
3
Today, however, there is increasing concern that the built environment contributes
to a different set of health challenges from those faced by early public health and
urban planning movements. Low density sprawling outer suburban and regional
housing developments often lack adequate public transport provision, quality
public and green spaces, and may not meet the potential future challenges of
climate change. These factors are having a cumulative negative effect on
Victorians’ health and wellbeing – in particular, the rising rates of chronic disease.
Federal, state and local governments have varying levels of responsibility for public
health issues. The overarching legislation that guides all Victorian planning
decisions is the Planning and Environment Act 1987. Its objectives include ‘to
secure a pleasant, efficient and safe working, living and recreational environment
for all Victorians and visitors to Victoria’, yet the Act addresses health
considerations only in passing.17
Community expectations of the built environment are also changing. While many
Victorians enjoy high quality housing compared to other world standards,18 people
increasingly want to live in environments that promote health and which are
ecologically sustainable. Urban development patterns are slowly shifting away
from the late twentieth century orthodoxy of low density suburbs with detached
houses and high car dependency, to walkable, medium‐high density communities
with neighbourhood activity centres.19 In light of the general trend of smaller
backyard sizes, residential areas increasingly must provide parks and other public
open spaces that offer communities diverse forms of recreation.20
Metropolitan areas concentrate people, opportunities, and services, including
those for health and education. But they can also concentrate disadvantage, and
many studies show that a community’s socio‐economic status is often related to its
health. In general, the more socio‐economically disadvantaged an area, the poorer
its residents’ health outcomes. This relates to many interconnected factors:
housing affordability, amenity for active transport modes, the saturation of fast
food and liquor outlets, access to fresh food and other variables which
‘concentrate risks and hazards for health.’21
On some health indicators, Victorians living in rural and regional areas suffer from
poorer health than their metropolitan counterparts. Both men and women living in
Ballarat, for example, have a lower life expectancy than the Victorian average.22
This is attributed to many factors such as lower rates of physical activity, more
social isolation and higher levels of drinking, smoking and unemployment.23
17 Victorian Government, Planning and Environment Act 1987, 8. 18 Infrastructure Australia 2010 State of Australian Cities 2010, Major Cities Unit, Commonwealth of Australia, Canberra, 98. 19 Department of Infrastructure and Transport 2010 Our Cities – building a productive, sustainable and liveable future, Discussion paper, Commonwealth of Australia, Canberra, 42. 20 City of Stonnington, Submission No. 40, 14 July 2011, 2. 21 World Health Organization 2010 Why urban health matters – 1000 cities, 1000 lives, 2, http://bit.ly/eGOTX0 accessed 14 October 2011. 22 ‘Fact Sheet 1 – healthy, safe & inclusive communities’, City of Ballarat, http://bit.ly/IdQTWh accessed 15 October 2011. 23 City of Ballarat, Submission No. 19, 30 June 2011, 1.

Inquiry into Environmental Design and Public Health in Victoria
4
Weighing the evidence regarding urban planning’s potential influence on health
outcomes is a complex task.24 In linking the positive health benefits of living near
green spaces, for instance, there are several potentially interrelated factors: does
living near green space lead to better health outcomes, or do healthier people
choose to live near green space?25 As well, designing environments to promote
healthy and active lifestyles is a relatively recent concept in urban planning; many
initiatives may take years to demonstrate their benefits.
Despite decades of achievements in government‐directed health programs and
promotions, Victorians still face significant future challenges to their health and
wellbeing: the rising rates of chronic disease and resulting pressure on healthcare
services; and the health impacts of both an increasing ageing and urban
population.
This report examines some of the complex contributors to public health and
wellbeing, and how they can be influenced by the urban planning and design of the
places in which Victorians live. Through the findings and recommendations of this
Inquiry, the Victorian Government has an opportunity to improve the quality and
design of the built environment in ways that promote and encourage positive
health outcomes for all.
1.1 Establishment of the Committee
This is the inaugural report of the Environment and Planning References
Committee for the 57th Parliament.
The functions of the Committee are set out in the Legislative Council Standing
Orders. The Committee will ‘inquire into and report on any proposal, matter or
things concerned with arts, coordination of government, environment, and
planning the use, development and protection of land.’26
Further, the Standing Orders state that reference committees ‘may inquire into,
hold public hearings, consider and report on other matters referred to them by the
Legislative Council.’27 The Committee is allocated references relevant to the
following departments (and their agencies):
Department of Premier and Cabinet
Department of Planning and Community Development
Department of Sustainability and Environment.
On 8 February 2011, the following Members were appointed to the Committee:
Mr Andrew Elsbury
Mrs Jan Kronberg
24 HBEP literature review – Executive Summary, Healthy Built Environments Program, 18‐19. 25 Australian Institute of Health and Welfare 2011 Health and the environment: a compilation of evidence, AIHW, Canberra, 43. 26 Parliament of Victoria 2010 Legislative Council of Victoria Standing Orders, Parliament of Victoria, Melbourne, s.23.02 (2). 27 Parliament of Victoria 2010 Legislative Council of Victoria Standing Orders, s.23.02 (4)(b).

Chapter 1: Introduction
5
Mr Craig Ondarchie
Ms Sue Pennicuik
Mrs Inga Peulich
Mr Johan Scheffer
Mr Brian Tee
Ms Gayle Tierney
At the Committee’s first meeting, Ms Tierney was elected Chair and Mrs Peulich
was elected Deputy Chair.
1.2 Terms of Reference
On 5 April 2011, the Legislative Council agreed to the following motion:
That this House requires the Environment and Planning References Committee to
inquire into, consider and report on the contribution of environmental design to
prevention and public health in Victoria, and in particular:
1) review the evidence of the contribution of the natural and built environments to the promotion of health and well being;
2) identify and report on those elements of environmental planning and design which provide the most promising opportunities for improving health outcomes in Victoria;
3) assess the extent to which these factors are currently taken into account in environmental planning and design in both the public and private sectors, and their effectiveness, with particular reference to new growth areas;
4) determine opportunities to influence environmental planning and design for health, including consideration of the role of legislation, guidelines, and public‐private partnerships, and the costs and benefits of various options; and
5) provide recommendations for future planning and investment; and that the Committee will consider:
a) the effectiveness of the Environments for Health Municipal Public Health Planning Framework;
b) the State Public Health and Wellbeing Act 2008, the Transport Integration Act 2010 and the Planning and Environment Act 1987;
c) international experience such as the World Health Organisation’s (WHO) Healthy Cities initiative;
d) the consistency of policy approaches across the Victorian Government to promote health through evidence based environmental planning and design measures; and
e) the role of public open space in promoting health;
and that the Committee present its final report to Parliament no later than 12 months after this reference is given to the Committee.
On 29 March 2012, the Legislative Council agreed to extend the Committee's
reporting date to no later than 31 May 2012.

Inquiry into Environmental Design and Public Health in Victoria
6
1.3 Inquiry process
On 2 May 2011, the Committee advertised the terms of reference in The Age and
called for written submissions to be received by 30 June 2011. The Committee also
wrote to 173 key stakeholders throughout Australia. A total of 63 submissions
were received (see list of submissions, Appendix A).
On 25 May 2011, the Committee sought informal briefings from relevant
departments on the issues raised in the reference. On 15 and 29 June 2011
respectively, representatives from the Department of Health and the Department
of Planning and Community Development briefed the Committee.
Following receipt of written submissions, the Committee invited organisations to
appear at public hearings. The Committee held public hearings on seven separate
days and 31 different organisations or individuals appeared to give evidence (see
list of witnesses, Appendix B).
To gain further insights into the issues as they applied in different metropolitan
contexts, members of the Committee conducted site visits to five municipal areas:
City of Maribyrnong (4 October 2011) – Bradmill urban redevelopment site
City of Melbourne (4 October 2011) – Docklands
City of Wyndham (18 October 2011) – outer urban development and Point Cook town centre
City of Greater Geelong (18 October 2011) – Armstrong Creek development
City of Kingston (9 December 2011) – open space and green wedge.
1.4 Scope of the Inquiry
This report focuses on the built environment and its potential interactions with
public health and wellbeing. The built environment encompasses the human‐made
aspects of our cities and towns, such as buildings, transport infrastructure (such as
public transport and roads), parks and open spaces, and utilities. The report also
discusses components of the natural environment, including air quality and global
climate change, and how these may impact on public health for people living in
urban areas.
The terms of reference provided for this Inquiry include the ambiguous phrases
‘environmental design’ and ‘environmental planning.’ The Committee was advised
by the Planning Institute of Australia (Victorian Division) that these may cause
confusion. In the built environment sector, these terms imply a focus on the
natural physical environment, whereas health professionals would interpret
‘environmental planning’ more widely, encompassing the natural, built, social and
economic spheres. The Committee accepts the Institute’s suggestion that the term
‘land use planning and design’ more accurately describes the intent of the
Committee’s Inquiry.

Chapter 1: Introduction
7
The report has a distinct focus on land use planning and design in metropolitan
Melbourne and, to a lesser extent, regional cities. This in part reflects the weight of
evidence: most submissions and witnesses focused on the larger population
centres where development activity and population pressures on service delivery
are at their strongest. It also reflects the terms of reference which direct the
Committee to particularly investigate the new growth areas (those municipalities
on the edge of Melbourne designated as growth corridors). However, rural and
regional areas have distinct health challenges and the Committee includes
discussion of these throughout the report.
Victorian health services are not examined in this report. It is important to
emphasise that the term ‘public health’ refers to populations, not individuals, and
is about prevention, promotion and protection, not treatment. Public health
initiatives aim to improve health, prolong life and improve the quality of life among
whole populations through disease prevention, health promotion and other forms
of protection.
The term ‘wellbeing’ – also used in the terms of reference – has different meanings
for different people. By one definition, wellbeing relates to ‘the desire for optimal
health, for better living conditions and improved quality of life.’ It also depends on
many factors, including family and community connections.28
1.5 Summary of submissions
The Committee received 63 submissions, including from local government
(representing nearly one‐third of submissions received), planning and health peak
bodies, various community groups, and individuals and academic researchers in
the fields of planning, public health and the environment.
While the Inquiry’s terms of reference encompass a range of potentially relevant
issues, there were common themes across submissions. These are briefly
summarised below:
The link between the built environment and public health: submissions drew the Committee’s attention to evidence linking the built environment with public health. For example, people living in more walkable neighbourhoods are reported to have higher levels of physical activity and lower obesity rates. In general, submissions concurred that while it is difficult to identify definitive causality between aspects of the built environment and health, there is substantial evidence that better urban design is an important element in encouraging better public health.
Legislation, policy and guidelines: submissions from planning groups and local government discussed the need for public health objectives to be part of Victorian planning legislation, policy and associated guidelines. Changes were most commonly proposed to the Planning and Environment Act 1987, as well as integration with the Public Health and Wellbeing Act 2008.
28 Australian Bureau of Statistics 2001 Measuring Wellbeing: Frameworks for Australian Social Statistics, ABS, Canberra, 3.

Inquiry into Environmental Design and Public Health in Victoria
8
Chronic disease: submissions highlighted concerns over Victoria’s rising chronic disease rates (including cardiovascular disease, type 2 diabetes and respiratory illness) and argued that risk factors (such as obesity) could be mitigated through modifying the built environment. Several submissions highlighted the importance of planning for inclusivity, so that older people and the disabled can live in appropriate accommodation, access public transport and continue to engage with their communities.
Active transport: submissions stressed the importance of planning for active transport networks (walking, cycling and public transport) in all communities to encourage physical activity in both adults and children; decrease car use, traffic congestion and emissions; and build community through encouraging social interaction. Factors such as urban density, the availability of local destinations, and the quality of people’s experience of walking, cycling and public transport, all influence transport choices.
Public open space: the Committee received a significant amount of evidence promoting the physical and mental health benefits of attractive, high quality parks, public open space and ‘green infrastructure’ (such as trees and green spaces).
1.6 Structure of the Report
Chapters 2 to 4 of this report review the extensive Australian and international
literature linking aspects of the built environment to negative impacts on public
health, and consider them in the Victorian context. The rising rates of chronic
disease and disability among Victorians are explored, along with some of the main
environmental factors contributing to these health trends. The population growth
of outer suburban Melbourne and Victoria’s regional areas is examined in terms of
its potential impacts on public health.
Chapter 5 explores Victoria’s complex legislation and regulatory planning
framework, and its engagement with issues of public health and wellbeing.
Drawing on evidence from the Inquiry’s submissions and public hearings, it
explores opportunities to promote considerations of planning for health and
wellbeing in Victorian legislation, guidelines and policy approaches.
Chapters 6 and 7 focus on two important elements of environmental design –
parks and public open spaces, and active transport modes. They examine best
practice models in terms of modifying aspects of the built environment in ways
that lead to better health outcomes.
Chapter 8 discusses a number of relevant case studies brought to the Committee’s
attention during the Inquiry.
Chapter 2: Chronic disease
9
Chapter 2: Chronic disease
We should think of the built environment as a potential ‘treatment’ for chronic disease, as well as a place for ‘prevention’ of disease.29
Infectious disease was once the leading cause of death around the world; today,
chronic disease holds that position.30 Chronic disease is currently the largest
burden on Australian healthcare services, yet like infectious disease, is often
preventable and/or attributable to individual lifestyle and behavioural choices.31
This chapter briefly describes the main chronic diseases that are increasing in
Australia and Victoria, and examines some of the circumstances contributing to
their prevalence.
Chronic diseases are ‘illnesses that are prolonged in duration, do not often resolve
spontaneously, and are rarely cured completely’,32 and are defined by the
following broad characteristics:
complex causality
multiple risk factors
long latency periods
a prolonged course of illness
functional impairment or disability.33
The Australian Institute of Health and Welfare has identified twelve main chronic
diseases:
1) coronary heart disease
2) stroke
3) lung cancer
4) colorectal cancer
5) depression
6) type 2 diabetes
7) arthritis
8) osteoporosis
9) asthma
10) chronic obstructive pulmonary disease
11) chronic kidney disease
12) oral disease.34
29 A Capon, ‘The view from the city’, World Health Design, July 2011, 8. 30 ‘Noncommunicable diseases now biggest killers’, World Health Organization, 2008, http://bit.ly/cIN9Ly; see also A Caldwell, ‘“Lifestyle” diseases the world's biggest killer’, ABC News, 28 April 2011, http://bit.ly/IfwJa2 accessed 6 October 2011. 31 Department of Health 2011 Victorian Public Health and Wellbeing Plan 2011–2015, Prevention and Population Health Branch, Victorian Government, Melbourne, 17. 32 ‘Chronic disease’, Department of Health and Ageing, 2011, http://bit.ly/IdgFKn accessed 6 October 2011. 33 ‘About chronic disease’, Australian Institute of Health and Welfare, 2011, http://bit.ly/IuCkr7 accessed 6 October 2011. 34 ‘About chronic disease’, Australian Institute of Health and Welfare, 2011.

Inquiry into Environmental Design and Public Health in Victoria
10
The rise in chronic disease can be partially explained by Australia’s ageing
population – as people live longer, they are more likely to suffer from poor
health.35 They are also more likely to develop more than one, as chronic diseases
are interrelated and can lead to clusters of comorbidities.36 Diseases related to
ageing, such as osteoarthritis and dementia (comprising a range of conditions
including Alzheimer’s disease), are predicted to increase markedly in coming years.
2.1 The cost of chronic disease
Over the past decade, Australian government expenditure on healthcare has
grown by approximately 70 percent.37 Figure 1 shows funding for health in Victoria
since 2001‐02.
Figure 1: Total funding for health output groups
Source: Department of Health, presentation to Committee at public hearing, 14 September 2011, slide 5.
Much of this increase is attributable to the rise of chronic disease. In 2004‐2005,
one‐third of approximately 10.5 million Australians aged 25‐64 years were
diagnosed with at least one of the following chronic conditions: arthritis, asthma,
coronary heart disease, chronic obstructive pulmonary disease, depression,
diabetes, osteoporosis or stroke.38 A person with a chronic disease was 60 percent
more likely to be unemployed or employed part‐time than a person without a
chronic disease.39
Management and treatment of chronic disease places multiple demands on
different healthcare sectors including primary medical care, care coordination and
specialists.40 An estimated 70 percent of the nation’s disease burden is caused by
chronic disease through death, disability and diminished quality of life, and this is
projected to increase another ten percent by 2020.41 In Victoria, government
35 Department of Health 2011 Victorian Public Health and Wellbeing Plan 2011–2015, 8. 36 ‘About chronic disease’, Australian Institute of Health and Welfare, 2011. 37 G Banks, ‘Health costs and policy in an ageing Australia’, Health Policy Oration 2008, Menzies Centre for Health Policy, John Curtin School of Medical Research, ANU, Canberra, 26 June 2008, 1. 38 Australian Institute of Health and Welfare 2009 Chronic disease and participation in work, AIHW, Canberra, vii‐viii. 39 Australian Institute of Health and Welfare 2009 Chronic disease and participation in work, vii‐viii. 40 Department of Health 2011 Metropolitan Health Plan Technical Paper, Victorian Government, Melbourne, 28, 32. 41 Department of Human Services 2008 Revised Chronic Disease Management Program Guidelines for Primary Care Partnerships and Primary Health Care Services, Victorian Government, Melbourne, 5; see also Department of Health 2011 Metropolitan Health Plan Technical Paper, 7.

Chapter 2: Chronic disease
11
spending on healthcare has increased at an average of 5.4 percent each year
between 2004 and 2010.42 Figure 2 shows the recent and projected prevalence of
particular chronic diseases in Victoria by 2022.
Figure 2: Projected prevalence of chronic disease in Victoria in 2008 and 2022
Source: Department of Health 2011 Victorian Public Health and Wellbeing Plan 2011–2015, Victorian Government,
Melbourne, 18.
Due to Australia’s ageing population, dementia is predicted to rise rapidly. A 2011
study commissioned by Alzheimer’s Australia has estimated that by 2050, almost
950,000 Australians will be living with dementia,43 representing a significant
burden on the healthcare system, carer services and appropriate aged‐care
accommodation.44
2.2 Type 2 diabetes
Type 2 diabetes,45 is the fastest growing disease in Australia, projected to increase
by 436 percent by 2033.46 As in many developed countries today, it is considered
to be at pandemic rates.47 Around 275 Australians develop the disease daily,
although many may remain undiagnosed.48 Of the two types of diabetes, type 2 is
now represented by 85 to 90 percent of those diagnosed.49
42 Australian Institute of Health and Welfare 2011 Health expenditure Australia 2009‐10, AIHW, Canberra, x. 43 Alzheimer’s Australia 2011 Dementia Across Australia: 2011‐2050, report prepared by Deloitte Access Economics Pty Ltd, Canberra, 7. 44 B Nepal et al, ‘Modelling costs of dementia in Australia: evidence, gaps, and needs’, Australian Health Review, August 2008, 32 (3): 479‐487. 45 N.B. Type 2 diabetes differs significantly from type 1 in aetiology (disease causation), treatment and prognosis, and the two should never be used interchangeably. References to ‘diabetes’ in this document relate only to type 2. 46 J Goss, Projection of Australian health care expenditure by disease, 2003 to 2033, Australian Institute of Health and Welfare, 2008, Canberra, ix; see also House of Representatives Standing Committee on Health and Ageing 2009 Weighing it up: Obesity in Australia, Commonwealth of Australia, Canberra, 28. 47 ‘The diabetes pandemic’, The Lancet, 9 July 2011, 378 (9786): 99; Baker IDI Heart and Diabetes Institute 2012 Diabetes: the silent pandemic and its impact on Australia, Baker IDI Heart and Diabetes Institute, Melbourne, 9; KMV Narayan, ‘The Diabetes Pandemic: Looking for the Silver Lining’, Clinical Diabetes, 2005, 23 (2): 51‐52. 48 ‘Diabetes in Australia’, Diabetes Australia, 2011, http://bit.ly/wXoO6C accessed 12 October 2011; Planning Institute of Australia 2009 Healthy Spaces and Places: A national guide to designing places for healthy living – An overview, PIA, Australian Local Government Association and the National Heart Foundation of Australia, 3. 49 ‘What is type 2 diabetes?’ Diabetes Australia – Vic, 2008, http://bit.ly/HGVvjJ accessed 12 October 2011.
Inquiry into Environmental Design and Public Health in Victoria
12
Type 2 diabetes is linked to comorbidities such as heart and kidney disease, obesity
and depression. It is particularly prevalent in Australia’s Indigenous population,
and in 2009 was responsible for eight percent of deaths in the Indigenous
community, compared with 2.9 percent of deaths of non‐Indigenous people.50
Diabetes Australia estimates the current annual cost of type 2 diabetes to
healthcare and productivity at $10.3 billion.51
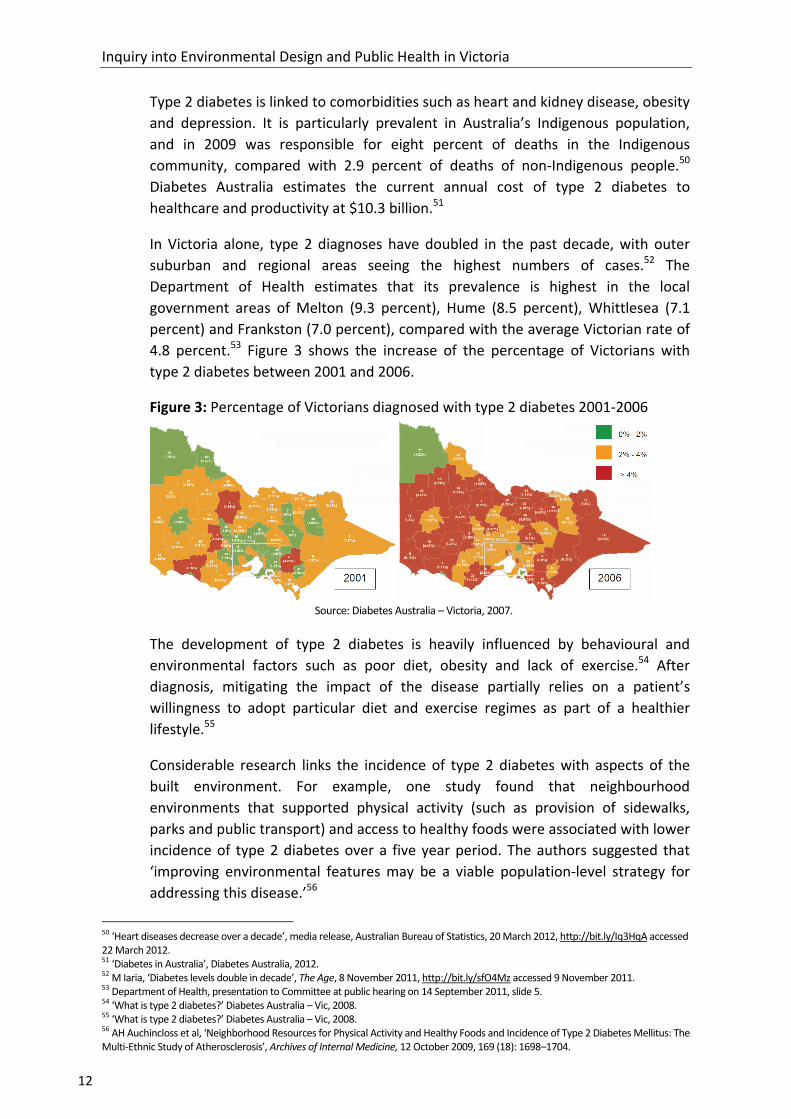
In Victoria alone, type 2 diagnoses have doubled in the past decade, with outer
suburban and regional areas seeing the highest numbers of cases.52 The
Department of Health estimates that its prevalence is highest in the local
government areas of Melton (9.3 percent), Hume (8.5 percent), Whittlesea (7.1
percent) and Frankston (7.0 percent), compared with the average Victorian rate of
4.8 percent.53 Figure 3 shows the increase of the percentage of Victorians with
type 2 diabetes between 2001 and 2006.
Figure 3: Percentage of Victorians diagnosed with type 2 diabetes 2001‐2006
Source: Diabetes Australia – Victoria, 2007.
The development of type 2 diabetes is heavily influenced by behavioural and
environmental factors such as poor diet, obesity and lack of exercise.54 After
diagnosis, mitigating the impact of the disease partially relies on a patient’s
willingness to adopt particular diet and exercise regimes as part of a healthier
lifestyle.55
Considerable research links the incidence of type 2 diabetes with aspects of the
built environment. For example, one study found that neighbourhood
environments that supported physical activity (such as provision of sidewalks,
parks and public transport) and access to healthy foods were associated with lower
incidence of type 2 diabetes over a five year period. The authors suggested that
‘improving environmental features may be a viable population‐level strategy for
addressing this disease.’56
50 ‘Heart diseases decrease over a decade’, media release, Australian Bureau of Statistics, 20 March 2012, http://bit.ly/Iq3HqA accessed 22 March 2012. 51 ‘Diabetes in Australia’, Diabetes Australia, 2012. 52 M Iaria, ‘Diabetes levels double in decade’, The Age, 8 November 2011, http://bit.ly/sfO4Mz accessed 9 November 2011. 53 Department of Health, presentation to Committee at public hearing on 14 September 2011, slide 5. 54 ‘What is type 2 diabetes?’ Diabetes Australia – Vic, 2008. 55 ‘What is type 2 diabetes?’ Diabetes Australia – Vic, 2008. 56 AH Auchincloss et al, ‘Neighborhood Resources for Physical Activity and Healthy Foods and Incidence of Type 2 Diabetes Mellitus: The Multi‐Ethnic Study of Atherosclerosis’, Archives of Internal Medicine, 12 October 2009, 169 (18): 1698–1704.

Chapter 2: Chronic disease
13
Other studies have shown that physically active individuals have between 30 and
50 percent lower risk of developing type 2 diabetes than do sedentary persons,
with as little as 30 minutes moderate to intense exercise a day.57
2.3 Cardiovascular disease
While type 2 diabetes is Australia’s fastest growing chronic disease, cardiovascular
disease (CVD) is the nation’s leading cause of death. CVD comprises a range of
conditions including coronary heart disease, cerebrovascular disease (stroke),
heart failure, rheumatic heart disease and hypertension (high blood pressure).
Despite declining levels over the past few decades, in 2008 it was still the
underlying cause of nearly 46,000, or 33 percent of deaths in Australia.58 CVD is
also responsible for one‐third of the deaths in Australia’s Indigenous community.59
CVD is the most expensive group of diseases in terms of direct government
healthcare expenditure, costing an estimated $5.9 billion annually.60 The three top
cholesterol‐lowering drugs alone cost $1.1 billion nationally. Dr Margaret Beavis, a
Victorian General Practitioner (GP) and senior examiner with the Royal Australian
College of General Practitioners, discussed this figure with the Committee:
For a point of comparison, the Victorian health budget is $13 billion, so this is a huge amount of money. That is just the drug costs; it does not include GP or specialist visits, it does not include hospitalisation and it does not include medications for other conditions or the general misery that the illness around this conveys.61
The Department of Health and Ageing estimates that 92 percent of Australian
adults have at least one risk factor for CVD and almost 40 percent have three or
more CVD risk factors.62 In Victoria, CVD is responsible for one‐fifth of the total
disease burden, and affects over 750,000 Victorians aged over 18.63
As Australia’s population ages, the impact of CVD will continue to increase.64 Like
many chronic diseases, it can largely be prevented: CVD’s development and
severity is influenced significantly by a person’s lifestyle and environment, diet and
alcohol choices, and opportunities to exercise.
57SS Bassuk and JE Manson, 'Epidemiological evidence for the role of physical activity in reducing risk of type 2 diabetes and cardiovascular disease', Journal of Applied Physiology, 2005, 99: 1193. 58 ‘Data and Statistics’, Heart Foundation, http://bit.ly/I13RDs accessed 9 November 2011. 59 Australian Institute of Health & Welfare 2003 Population Health Monitoring and Surveillance: Question Development Background Paper: Cardiovascular Disease in Australia, CATI Technical Reference Group and National Public Health Partnership, Canberra, 6. 60 ‘Cardiovascular disease’, National Health and Medical Research Council, 2011, http://bit.ly/rrSNyC accessed 14 October 2011. 61 Dr M Beavis, Transcript of Evidence, 4 August 2011, 51. 62 ‘Cardiovascular disease’, Department of Health and Ageing, 2011, http://bit.ly/HyY3Tj accessed 14 October 2011. 63 ‘Cardiovascular health: National Health Priority Areas background paper’, Department of Health, 2006, http://bit.ly/wgzEfW accessed 14 October 2011. 64 ‘Heart, Stroke and Vascular Diseases – Australian Facts 2004’, Heart Foundation, 2004, http://bit.ly/A58PmZ accessed 14 October 2011.
Inquiry into Environmental Design and Public Health in Victoria
14
2.4 Mental illness
Today, mental illness is the leading cause of non‐fatal disability in Australia.65 In
2008–09, the national government spent $2.2 billion on mental health‐related
services with an average annual increase of 7.5 percent in expenditure between
2004 and 2009.66 It is also the largest contributor to the disability burden in
Victoria, costing an estimated $5.4 billion a year through healthcare costs and
associated impacts on workforce participation and productivity.67
One in three Australians will suffer from depression and/or an anxiety disorder at
some point in their lives.68 Such conditions can be extremely debilitating and
impact on a sufferer’s ability to engage with others, maintain steady employment
and live a healthy, productive life. The national mental health initiative,
beyondblue, estimates that depression in the workforce alone costs Australian
society $12.6 billion annually.69
Many chronic illnesses lead to depression, and depression can aid the
development of chronic disease, creating a vicious cycle of poor health.70 Studies
show that 28 percent of Australians with a chronic illness also have a mental
disorder.71 People with depression, for example, are less likely to eat well,
undertake regular exercise, seek medical treatment, or engage with family, friends
and their community – all serving to exacerbate the impacts of chronic physical
conditions.72 People living in rural areas can be even more isolated, ‘due both to
the difficulty of accessing the support needed for mental illness and to the greater
visibility attached to mental health in a smaller community.’73 Suicide rates in
Australia’s rural and remote areas are up to 2.4 times higher than those in major
cities.74
The development of some serious psychological conditions, such as schizophrenia,
bipolar disorder and other psychoses, can rarely be prevented. Depression and
anxiety disorders also often cannot be prevented, but their severity and duration
can be helped by a variety of treatments and/or counselling. Aspects of the built
environment, such as housing density and proximity to green public spaces, have
been shown to have effects on those living with depression and anxiety. These are
discussed further in Chapters 4 and 6.
65 Department of Health and Ageing 2010 National Mental Health Report 2010: Summary of 15 Years of reform in Australia’s Mental Health Services under the National Mental Health Strategy 1993‐2008, Commonwealth of Australia, Canberra, i; Australian Institute of Health and Welfare 2011 Mental health services – in brief 2011, AIHW, Canberra, 1. 66 Australian Institute of Health and Welfare 2011 Mental health services – in brief, 30. 67 Department of Health 2011 Victorian Public Health and Wellbeing Plan 2011–2015, 78. 68 beyondblue, Submission No. 9, June 2011, 1. 69 beyondblue, Submission No. 9, June 2011, 2. 70 beyondblue, Submission No. 9, June 2011, 1; S Begg et al, Burden of disease and injury in Australia 2003, Australian Institute of Health and Welfare, Canberra, 2007, 3‐4. 71 ‘Chronic physical illness and depression, Fact sheet 23’, beyondblue, 2012, 1; see also Department of Health 2011 Improving the physical health of people with severe mental illness: No mental health without physical health, Ministerial Advisory Committee on Mental Health, Victorian Government, Melbourne. 72 ‘Chronic physical illness and depression, Fact sheet 23’, beyondblue, 1. 73 ‘Fact Sheet 18: Mental health in rural Australia’, National Rural Health Alliance, 2009, 1, http://bit.ly/cbJnGH accessed 14 October 2011; M Townsend and M Ebden, Feel Blue, Touch Green, People and Parks Foundation and Deakin University, Melbourne, 2006, 5. 74 ‘Fact Sheet 18: Mental health in rural Australia’, National Rural Health Alliance, 1.
Chapter 2: Chronic disease
15
2.5 Respiratory illness
There is substantial evidence that poor air quality has a direct impact on levels of
chronic disease. These include several chronic respiratory conditions and
infections, cardiovascular disease, lung cancer, birth defects, fatigue, headaches,
eye irritation and premature mortality.75 Children, the elderly and people with
existing cardiovascular and respiratory diseases are the most vulnerable to the
negative effects of air pollution.76
Air pollution occurs when the air contains gases, dust, fumes or odour in amounts
harmful to humans. This includes smog from urban concentrations of car exhaust,
chemical industrial waste, dust, lead and hydrocarbons, and home heating system
emissions such as smoke from wood heaters and fireplaces.77
Exposure to air pollutants is related to more deaths in Australia annually than the
road toll.78 However this is not limited to outside air – the Commonwealth
Scientific and Industrial Research Organisation estimates the annual economic cost
of poor internal air quality (such as in offices and houses) may be as high as $12
billion per year.79 Climate change, discussed further in Chapter 3, is expected to
contribute to a further decline in air quality,80 making forward planning to mitigate
it all the more important.
Asthma is characterised by a chronic inflammation and narrowing of the lungs, and
Australia has the second highest rate in the world.81 One in four children, one in
seven teenagers and one in ten adults has asthma,82 it is one of the most common
causes of Australian children’s hospital admissions83 and is one of the top three
causes of work absenteeism.84 Asthma can be caused and exacerbated by several
factors including: genetic background; tobacco smoke; allergens such as dust
mites, pollen and animals; and diet and levels of exercise. However its prevalence
and severity also often relates to air quality.85
75 M Dennekamp and M Carey, ‘Air quality and chronic disease: why action on climate change is also good for health’, NSW Public Health Bulletin, 2010, 21 (5–6): 116; M Younger et al, ‘The Built Environment, Climate Change, and Health: Opportunities for Co‐Benefits’, American Journal of Preventive Medicine, 2008, 35: 518; Environment Defenders Office, Submission No. 10, 29 June 2011, 8; Doctors for the Environment Australia Inc., Submission No. 51, 11 July 2011, 7. 76 Environment Protection Authority Victoria, Submission No. 54, 12 July 2011, 11. 77 ‘What Is Air Pollution?’ Environment Protection Authority Victoria, http://bit.ly/jHLeZF accessed 10 November 2011; ‘Asthma the Basics’, Asthma Foundation of Victoria, 2012, http://bit.ly/I1d1j4 accessed 10 February 2012. 78 Dr M Carey, Doctors for the Environment Australia Inc., Transcript of Evidence, 23 August 2011, 111; Prof A Capon, Australian National University, Transcript of Evidence, 4 August 2011, 35. 79 Department of Sustainability, Environment, Water, Population and Communities 2001 Air toxics and indoor air quality in Australia: State of knowledge report, Environment Australia, Commonwealth of Australia, Canberra, http://bit.ly/zWPHfu accessed 10 October 2011. 80 M Dennekamp and M Carey, ‘Air quality and chronic disease’, 115. 81 ‘Ambient air pollution and hospital admissions’, Environment Protection Authority Victoria, 2006, http://bit.ly/HGW6lq accessed 10 January 2012. 82 ‘Asthma in children’, Department of Health, 2008, http://bit.ly/IDgZiN accessed 10 January 2012. 83 ‘Children and asthma’, Asthma Foundation, http://bit.ly/IiJB3F accessed 10 January 2012. 84 Australian Institute of Health and Welfare 2009, Chronic disease and participation in work, vii‐viii. 85 ‘Causes of Asthma’, Health Insite, 2012, http://bit.ly/aWk9tu; ‘Causes’, Asthma Foundation, http://bit.ly/HNiawI, accessed 22 March 2012.

Inquiry into Environmental Design and Public Health in Victoria
16
More than 600,000 Victorians live with asthma.86 VicHealth informed the
Committee that emergency department presentations for children with respiratory
illness are notably higher in the urban growth areas of Victoria.87 This is also true
for growth area residents over the age of 65.88
In 2000 and 2001, Environment Protection Authority Victoria conducted
epidemiological studies in Melbourne which showed that approximately 300
deaths per year and 1,000 hospital admissions could be attributed to air
pollution.89 Another study investigating the relationship between air pollution and
hospital emergency admissions showed that all pollutants studied were associated
with increases in hospital admissions for respiratory and cardiovascular disease.90
While Melbourne’s air quality has improved significantly since the 1980s, carbon
monoxide and nitrogen dioxide emissions continue to increase. In other words,
cars are still the main source of air pollution.91 Urban expansion – discussed further
in Chapter 4 of this report – exacerbates poor air quality as many people make
long daily commutes to and from work by car.92
86 ‘Asthma Facts’, The Asthma Foundation of Victoria, 2012, http://bit.ly/r4Eviw accessed 10 January 2012. 87 VicHealth, Submission No. 47, 11 July 2011, 8‐9. 88 VicHealth, Submission No. 47, 11 July 2011, 8. 89 Environment Protection Authority Victoria, Submission No. 54, 12 July 2011, 4. 90 ‘Ambient air pollution and hospital admissions’, Environment Protection Authority Victoria. 91 ‘Melbourne's air quality’, Environment Protection Authority Victoria, 2007, http://bit.ly/HPsR1f accessed January 10 2011. 92 H Frumkin, ‘Urban Sprawl and Public Health’, Public Health Reports, May‐June 2002, 117: 203.

Chapter 3: Contributing factors to chronic disease
17
Chapter 3: Contributing factors to chronic disease
Many of the chronic diseases described in Chapter 2 can intersect; having one
increases the chances of developing others. There are a range of common risk
factors in the built environment that can increase the likelihood of developing
chronic diseases and magnify their health impacts. These risk factors include:
obesity; lack of physical activity; poor diet; high alcohol consumption; socio‐
economic disadvantage; an ageing population; climate change; or a combination of
these.
As a submission to the Inquiry from Wyndham City Council notes, a range of
environmental circumstances are combining in ways that compound harmful
health outcomes:
Car dependence, poor walkability, inadequate public transport options, limited sporting and recreational infrastructure and lack of access to and availability of nutritious and affordable foods exacerbate preventable health conditions.93
Many of these factors have been attributed to the prevalence of urban sprawl in
highly populated cities and regions (explored further in Chapters 4 and 6). Whereas
low density ‘drivable suburbia’ was the favoured mode of residential environment
in post‐Second World War Australia, recent years have seen medical professionals
and urban planners increasingly promoting neighbourhoods that ‘favour compact
development, infill development, and walkable communities.’94
This chapter examines international and Australian evidence that particular chronic
disease risk factors can be influenced by aspects of the built environment.
3.1 Obesity
This is a sleeping time bomb. So far the economic estimates for the costs of obesity to society … are largely underestimated. The real impact is going to be in a few years time.95
Obesity is a growing health problem that not only significantly adds to the risk of
developing chronic diseases, but also compounds their negative health effects. It is
defined as an excess in body fat due to a surplus in energy intake (diet), insufficient
energy expenditure (physical activity) or commonly, a combination of both.96 The
Australian Institute of Health and Welfare defines overweight and obesity through
the Body Mass Index (BMI). Adult BMI is calculated by dividing a person’s weight
(in kilograms) by the square of their height (in metres). A BMI of 25 or higher is
93 Wyndham City Council, Submission No. 62, 26 July 2011, 5. 94 T Banerjee and A Loukaitou‐Sideris (eds), Companion to Urban Design, Taylor & Francis, Oxon, 2011, 479. 95 Prof C Gericke, quoted in House of Representatives Standing Committee on Health and Ageing 2009 Weighing it up: Obesity in Australia, Commonwealth of Australia, Canberra, 27. 96 R Clark et al, Local government and obesity prevention: An evidence resource. Interventions to prevent obesity in early years settings; tackling food insecurity and built environment changes to support physical activity, CO‐OPS Secretariat, Deakin University, Melbourne, 2010, 1.
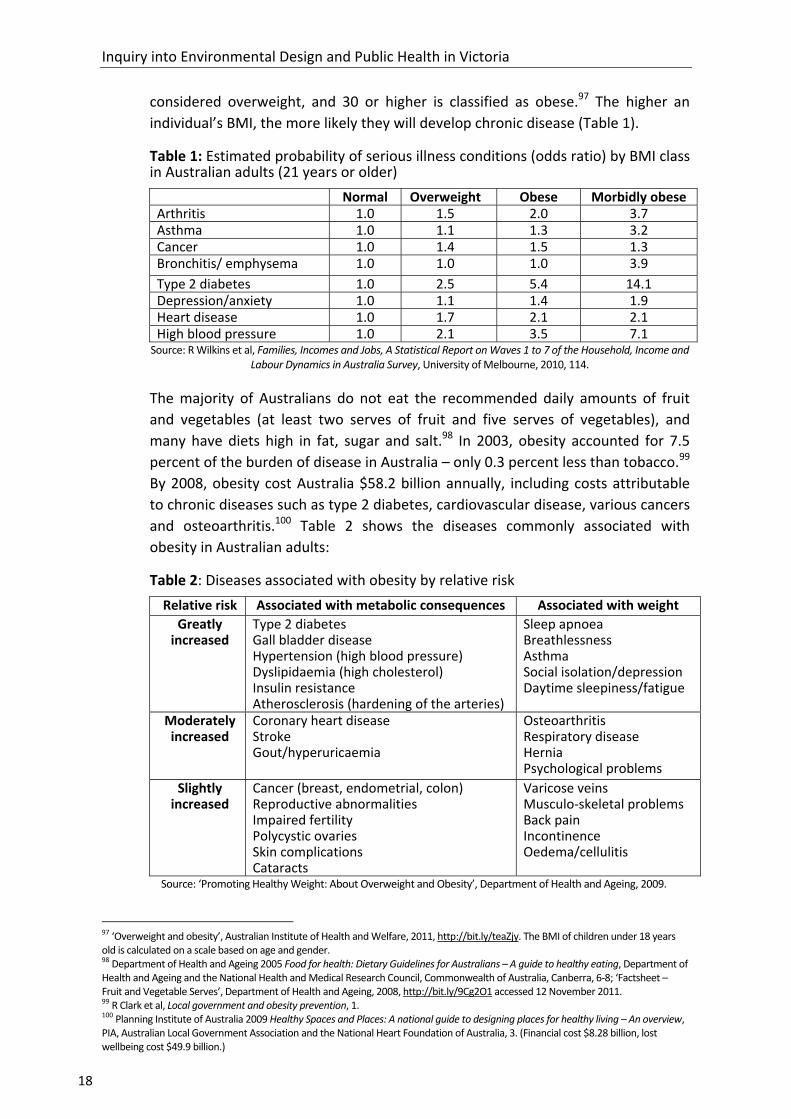
Inquiry into Environmental Design and Public Health in Victoria
18
considered overweight, and 30 or higher is classified as obese.97 The higher an
individual’s BMI, the more likely they will develop chronic disease (Table 1).
Table 1: Estimated probability of serious illness conditions (odds ratio) by BMI class in Australian adults (21 years or older)
Normal Overweight Obese Morbidly obese Arthritis 1.0 1.5 2.0 3.7 Asthma 1.0 1.1 1.3 3.2 Cancer 1.0 1.4 1.5 1.3 Bronchitis/ emphysema 1.0 1.0 1.0 3.9
Type 2 diabetes 1.0 2.5 5.4 14.1 Depression/anxiety 1.0 1.1 1.4 1.9 Heart disease 1.0 1.7 2.1 2.1 High blood pressure 1.0 2.1 3.5 7.1
Source: R Wilkins et al, Families, Incomes and Jobs, A Statistical Report on Waves 1 to 7 of the Household, Income and Labour Dynamics in Australia Survey, University of Melbourne, 2010, 114.
The majority of Australians do not eat the recommended daily amounts of fruit
and vegetables (at least two serves of fruit and five serves of vegetables), and
many have diets high in fat, sugar and salt.98 In 2003, obesity accounted for 7.5
percent of the burden of disease in Australia – only 0.3 percent less than tobacco.99
By 2008, obesity cost Australia $58.2 billion annually, including costs attributable
to chronic diseases such as type 2 diabetes, cardiovascular disease, various cancers
and osteoarthritis.100 Table 2 shows the diseases commonly associated with
obesity in Australian adults:
Table 2: Diseases associated with obesity by relative risk
Relative risk Associated with metabolic consequences Associated with weight
Greatly increased
Type 2 diabetes Gall bladder disease Hypertension (high blood pressure) Dyslipidaemia (high cholesterol) Insulin resistance Atherosclerosis (hardening of the arteries)
Sleep apnoea Breathlessness Asthma Social isolation/depression Daytime sleepiness/fatigue
Moderately increased
Coronary heart disease Stroke Gout/hyperuricaemia
Osteoarthritis Respiratory disease Hernia Psychological problems
Slightly increased
Cancer (breast, endometrial, colon) Reproductive abnormalities Impaired fertility Polycystic ovaries Skin complications Cataracts
Varicose veins Musculo‐skeletal problems Back pain Incontinence Oedema/cellulitis
Source: ‘Promoting Healthy Weight: About Overweight and Obesity’, Department of Health and Ageing, 2009.
97 ‘Overweight and obesity’, Australian Institute of Health and Welfare, 2011, http://bit.ly/teaZjy. The BMI of children under 18 years old is calculated on a scale based on age and gender. 98 Department of Health and Ageing 2005 Food for health: Dietary Guidelines for Australians – A guide to healthy eating, Department of Health and Ageing and the National Health and Medical Research Council, Commonwealth of Australia, Canberra, 6‐8; ‘Factsheet – Fruit and Vegetable Serves’, Department of Health and Ageing, 2008, http://bit.ly/9Cg2O1 accessed 12 November 2011. 99 R Clark et al, Local government and obesity prevention, 1. 100 Planning Institute of Australia 2009 Healthy Spaces and Places: A national guide to designing places for healthy living – An overview, PIA, Australian Local Government Association and the National Heart Foundation of Australia, 3. (Financial cost $8.28 billion, lost wellbeing cost $49.9 billion.)

Chapter 3: Contributing factors to chronic disease
19
In recent decades, obesity has been on the rise worldwide and represents an
increasing health crisis in Australia; currently, over 60 percent of the adult
population and 25 percent of children are classified as overweight or obese.101 In
2008 the National Preventative Health Taskforce identified obesity as an area
‘where urgent action is required’.102
Obesity rates in Australia have increased faster than any other country in the
Organisation for Economic Co‐operation and Development (OECD) in the past 20
years, and the proportion of people overweight is projected to rise a further 15
percent over the next decade.103 Figure 4 shows the past and projected rates of
overweight populations across a group of OECD countries.
Figure 4: OECD countries’ past and projected rates of overweight populations
Source: ‘Obesity and the Economics of Prevention: Fit not Fat ‐ Australia Key Facts’, Organisation for Economic Co‐
operation and Development, http://bit.ly/wQMx0n accessed 21 October 2011.
If such trends continue, VicHealth estimates that by 2025, almost three‐quarters of
Australians will be classed as overweight or obese.104 Obesity is not just a problem
for Australian adults – rates among Australian children are also rising.105
3.1.1 Obesity and the built environment: the evidence
Impacting on all aspects of health, obesity’s causes are a complex mix, involving ‘a
wide range of individual, behavioural, social, environmental and political factors
and a multitude of interactions between these factors’.106 While individual choices
such as diet and levels of exercise have a significant impact on obesity levels,
101 Department of Infrastructure and Transport 2011 Our Cities – The challenge of change, Background and research paper, Commonwealth of Australia, Canberra, 99. 102 R Clark et al, Local government and obesity prevention, 1. 103 ‘Obesity and the Economics of Prevention: Fit not Fat – Australia Key Facts’, Organisation for Economic Co‐operation and Development, http://bit.ly/wQMx0n accessed 21 October 2011. 104 ‘Overweight and obesity’, VicHealth, http://bit.ly/wzSQWO accessed 29 November 2011. 105 CB Ebbeling et al, ‘Childhood obesity: public‐health crisis, common sense cure’, The Lancet, 2002, 360: 474. 106 R Clark et al, Local government and obesity prevention, 1; J Garrard, Taking action on obesogenic environments – Building a culture of active, connected communities, National Preventative Health Taskforce, 2009, 4, http://bit.ly/yWMYFq accessed 20 October 2011.

Inquiry into Environmental Design and Public Health in Victoria
20
research shows that responsibility also lies with ‘obesogenic environments’ –
places that encourage both over‐eating and under‐exercising.107
The 2009 report of the House of Representatives’ Standing Committee on Health
and Ageing, Weighing it up: Obesity in Australia, determined:
Urban planning is a significant contributor to the high levels of obesity in Australia. As such, the Committee believes that urban planning guidelines and laws must be improved, with responsibility shared by federal, state, territory and local governments alike. Changes in this arena will result in significantly healthier environments being created for Australians to live and work in.108
Other studies of obesity similarly state that ‘Understanding effective ways to
influence these environmental determinants, and using this information to inform
decision making are vital steps in slowing the obesity epidemic.’109
International and Australian research links obesity to several aspects of
environmental design and urban planning. A common factor blamed for the rise of
obesity is low density urban expansion which reinforces sedentary lifestyles. These
areas often lack environments such as green and other open recreational spaces to
encourage physical activity and social interaction, lack active transport
infrastructure such as cycling and walking paths, and feature poor street
connectivity – all of which in turn encourage car dependency.110
Other factors in obesogenic environments include a high prevalence of fast food
and packaged liquor outlets and/or a lack of places to buy fresh food.111 Studies
show that childhood obesity also can be linked to environmental factors such as
lack of physical activity and the influence of food advertising.112
However other researchers contend that a positive correlation between urban
sprawl and obesity ‘does not necessarily imply that sprawl causes obesity or that
reducing sprawl will lead people to lose weight.’113 As with all studies that weigh
107 R Clark et al, Local government and obesity prevention, 1; Doctors for the Environment Australia Inc., Submission No. 51, 11 July 2011, 5; J Robertson‐Wilson and B Giles‐Corti, ‘Walkabilility, Neighbourhood Design, and Obesity’, in A Lake et al (eds) Obesogenic environments: Complexities, perceptions and objective measures, Wiley‐Blackwell, UK, 2010; LD Frank et al, ‘Obesity relationships with community design, physical activity, and time spent in cars’, American Journal of Preventive Medicine, 2004, 27 (2): 87‐96. 108 House of Representatives Standing Committee on Health and Ageing 2009 Weighing it up: Obesity in Australia, 88‐89. 109 R Clark et al, Local government and obesity prevention, 1‐2. 110 R Trubka et al, ‘Gen 85: The cost of urban sprawl – physical activity links to health care costs and productivity’, Environmental Design Guide, April 2010, 1‐8; P Newman and JR Kenworthy, Sustainability and Cities: overcoming automobile dependence, Island Press, Washington DC, 1999; P Newman and JR Kenworthy, ‘The Ten Myths of Automobile Dependence’, World Transport Policy & Practice, 2000, (6) 1: 15–25; LD Frank et al, ‘Obesity Relationships with Community Design’, 87‐96; R Ewing et al, ‘Relationship between urban sprawl and physical activity, obesity, and morbidity’, American Journal of Health Promotion, September‐October 2003, 18 (1): 47‐57; R Lopez, ‘Urban Sprawl and Risk for Being Overweight or Obese’, American Journal of Public Health, September 2004, 94 (9): 1574–1579; FL Garden and BB Jalaludin, ‘Impact of Urban Sprawl on Overweight, Obesity, and Physical Activity in Sydney, Australia’, Journal of Urban Health, January 2009, 86 (1): 19–30; Department of Health 2011 Victorian Public Health and Wellbeing Plan 2011–2015, Prevention and Population Health Branch, Victorian Government, Melbourne, 70‐72, 94. 111 B Giles‐Corti et al, ‘Environmental and lifestyle factors associated with overweight and obesity in Perth, Australia’, American Journal of Health Promotion, September‐October 2003, 18 (1): 93‐102. 112 W Maziak et al, ‘Childhood obesity: are we missing the big picture?’ Obesity Reviews, 2007, 9: 35–42. 113 J Eid et al, ‘Fat City: The Relationship between Urban Sprawl and Obesity’, Centre for Economic Performance Discussion Paper No 758, London School of Economics and Political Science, November 2006, 1; AC Kelly‐Schwartz, ‘Is Sprawl Unhealthy? A Multilevel Analysis of the Relationship of Metropolitan Sprawl to the Health of Individuals’, Journal of Planning Education and Research, 2004, 24 (2): 184‐196.

Chapter 3: Contributing factors to chronic disease
21
multiple and interrelated individual behavioural and cultural influences, the
process of self‐selection may play a part in these correlations: ‘we may observe
more obesity in sprawling neighborhoods because individuals who have a
propensity to be obese choose to live in these neighbourhoods’.114
While the influences of environmental factors on obesity and chronic disease
continue to be debated by academics, the majority of research supports the design
of walkable neighbourhoods that encourage physical activity, provide attractive
local green and open spaces, and feature local retail and community
destinations.115 Road or street connectivity is often cited as an important part of an
area’s perceived walkability as ‘neighbourhoods that are better connected reduce
travel times by foot or cycle and offer a greater diversity of routes to local
destinations without adding substantially to travel times.’116
Australians’ awareness of the links between obesity, unhealthy eating and lack of
physical activity is considered to be high. However, as Dr Jan Garrard has argued,
‘raising societal awareness that urban environments are a key determinant of
obesity is crucial for achieving the widespread support and action that is needed to
build a culture of active living and healthy eating in Australia.’117 The Committee
notes that the public policy response to obesity is complex. The food system, the
built environment, government bodies and the medical community must all be
part of a coordinated response.
3.2 Physical inactivity
At a public hearing on 4 August 2011, Victorian General Practitioner Dr Margaret
Beavis began her presentation to the Committee:
I want to tell you about this new pill that has come along. It is a terrific pill. It reduces heart attacks and strokes … It is called exercise. It improves mood and job satisfaction. It reduces absenteeism. It is interesting that there is a huge body of evidence saying that it is just as good as taking an antidepressant. It reduces the risk of premature death by 25 percent. Why is the entire population not taking this pill? VicHealth put out some data saying that 70 percent of Australians are inactive, so only 30 percent of people are actually getting their half an hour five times a week.118
Related to the increase of chronic disease and obesity in Australia is the concurrent
decrease in physical activity. It is estimated that 70 percent of Australian adults
(aged over 15) and two‐thirds of children do little or no physical activity and these
proportions are increasing in Victoria.119 After tobacco‐related health impacts,
114 J Eid et al, ‘Fat City: The Relationship between Urban Sprawl and Obesity’, 1‐2, 16. 115 W Maziak et al, ‘Childhood obesity: are we missing the big picture?’ 35‐42; TJ Pikora et al, ‘Neighborhood environmental factors correlated with walking near home: Using SPACES’, Medicine & Science in Sports & Exercise, April 2006, 38 (4): 708‐14; N Owen et al, ‘Neighborhood walkability and the walking behavior of Australian adults’, American Journal of Preventive Medicine, November 2007, 33 (5): 387‐95. 116 A Timperio et al, ‘Neighbourhood physical activity environments and adiposity in children and mothers: a three‐year longitudinal study’, International Journal of Behavioral Nutrition and Physical Activity, 2010, 7 (18): 6. 117 J Garrard, Taking action on obesogenic environments, 4. 118 Dr M Beavis, Transcript of Evidence, 4 August 2011, 50. 119 R Clark et al, Local government and obesity prevention, 1‐2; Dr M Beavis, Submission No. 11, 27 June 2011, 2.
Inquiry into Environmental Design and Public Health in Victoria
22
physical inactivity is the second highest risk factor that contributes to the burden
of disease, morbidity and mortality in Australia, costing an estimated $13 billion to
the economy annually.120
Compared to previous generations, on average, Australian adults today exercise
less and use their cars more to travel, most employment requires less physical
energy and ‘Recreation is also more sedentary (watching television has replaced
the cricket match in the backyard or the street)’.121 One Australian study showed
positive correlations between obesity, ‘lower educational status, higher television
viewing time and lower physical activity time’.122
Children’s rates of physical activity in Australia have also declined at an estimated
rate of four percent each decade since the 1970s.123 There are significant potential
long‐term consequences for children who do not engage in regular physical
activity. Lack of exercise not only impacts on children’s physical health and rates of
early chronic disease development, but also their mental health, self‐development
and self‐esteem, and sense of community.124
It has been estimated that just a five percent increase in the number of people
doing 30 minutes of moderate daily activity could save around 600 Australian lives
each year, with significant flow‐on savings in healthcare costs.125 People who
undertake regular exercise, for example, are also more likely to make healthier
dietary choices.126
3.2.1 Physical inactivity and the built environment: the evidence
Comprehensive research suggests that urban design influences whether people
have the opportunities and inclination to exercise regularly, and whether parents
feel the environment is safe for children to be active outdoors. An international
review of 33 studies of correlations between physical activity and the built
environment showed that ‘land use mix, connectivity and population density and
overall neighbourhood design’ were important factors.127 Land use mix refers to
the degree to which different uses of land and zone classifications are scattered
through residential, commercial and open spaces. An example would be an area
120 A Bauman et al, Getting Australia active: towards better practice for the promotion of physical activity, National Public Health Partnership, Melbourne, 2002, 4; AE Bauman and FC Bull, ‘Environmental Correlates of Physical Activity And Walking in Adults and Children: A Review of Reviews’, review undertaken for National Institute of Health and Clinical Excellence, London, 2007, 4‐5; Australian Institute of Health and Welfare 2011 Health and the environment: a compilation of evidence, Canberra, 37; An Australian vision for active transport, Heart Foundation, 5, http://bit.ly/yLD4lr accessed January 12 2011. 121 AG Capon, ‘The way we live in our cities’, Medical Journal of Australia, 2007, 187: 658; Department of Health 2011 Victorian Public Health and Wellbeing Plan 2011–2015, 22. 122 AJ Cameron et al, ‘Overweight and obesity in Australia: the 1999–2000 Australian Diabetes, Obesity and Lifestyle Study (AusDiab)’, Medical Journal of Australia, 2003, 178 (9): 427‐432. 123 S Zubrick et al, Nothing but fear itself: parental fear as a determinant of child physical activity and independent mobility, VicHealth, Melbourne, 2010, 5. 124 Assoc Prof C Whitzman, Transcript of Evidence, 7 September 2011, 265‐66 ; S Zubrick et al, Nothing but fear itself, 6. 125 B Giles‐Corti et al, ‘The co‐benefits for health of investing in active transportation’, NSW Public Health Bulletin, 2010, 21 (5‐6): 123. 126 Planning Institute of Australia 2009 Healthy Spaces and Places, 4. 127 GR McCormack and A Shiell, ‘In search of causality: a systematic review of the relationship between the built environment and physical activity among adults’, International Journal of Behavioral Nutrition and Physical Activity, 13 November 2011, 8: (125).
Chapter 3: Contributing factors to chronic disease
23
which features a combination of residences, shops, schools, offices, libraries and
open spaces.128
An Australian review similarly demonstrated that higher residential housing
densities, proximity to non‐residential destinations, land use mix, street
connectivity and provision of infrastructure such as walking paths and aesthetics
were the most significant factors determining whether people chose to walk for
transport.129
Another meta‐analysis of more than 100 American and Australian studies
examining the relationship between the built environment and physical activity
found that ‘There are reasonably consistent associations between access to
physical activity facilities, convenient and proximate access to destinations, high
residential density, land use and urban “walkability” scores and measures of
physical activity.’130 The authors identified some significant factors across the
studies that showed people were more likely to walk if there was provision of
footpaths and trails, mixed land use, pleasing aesthetics, and they lived near
recreational and retail facilities.131
Researchers caution, however, that providing such features in a neighbourhood
does not guarantee that residents will increase their physical activity levels, or that
proven associations between aspects of the built environment and physical activity
are causal:
It is clear that multiple determinants, from individual level factors, through to environmental factors, are important. More focused research will identify the specific settings and types of physical activity, and explore determinants of setting‐specific behaviours … environmental change alone may not be sufficient to influence population level physical activity prevalence, and caution should be exercised, tempering unbridled enthusiasm for environments as the ‘great white hope’ for public health approaches to physical activity.132
Researchers at the University of New South Wales’ Healthy Built Environments
Program conducted a comprehensive review of studies measuring the influence of
the built environment on levels of physical activity. They concluded that while
there are several studies supporting the connection, ‘it remains difficult to define
exactly what it is about the built environment that gets people active and what
form this environment might take in an Australian context.’133
Other relevant studies contend that while it is difficult to definitively isolate the
factors that improve levels of physical activity, any changes to the built
128 City of Casey, Submission No. 42, 6 July 2011, 8. 129 B Saelens and S Handy, ‘Built environment correlates of walking: a review’, Medicine and Science in Sports and Exercise, 2008, 40: S550–S566. 130 AE Bauman and FC Bull, ‘Environmental Correlates of Physical Activity and Walking’, 33. 131 AE Bauman and FC Bull, ‘Environmental Correlates of Physical Activity and Walking’, 34. 132 AE Bauman and FC Bull, ‘Environmental Correlates of Physical Activity and Walking’, 39; see also B Saelens and S Handy, ‘Built environment correlates of walking’, S550–S566. 133 The Built Environment and Getting People Active, Healthy Built Environments Program, University of New South Wales, Sydney, 2012, 47.

Inquiry into Environmental Design and Public Health in Victoria
24
environment that seem likely to encourage it ‘are still likely to be a vital
component’,134 and current evidence ‘is sufficient as a basis for advocating for
changes in planning policies.’135
Studies show that the reasons people do not walk or cycle often relate to
considerations of time, personal and road safety, quality and amenity of active
transport facilities, and distance to destinations. There are no easy conclusions to
what works in a particular community, and ‘comprehensive approaches to change
physical activity levels need to consider interventions at multiple levels – the
individual, social and environmental.’136
Research has also focused on specific groups such as older people, women and
children when investigating the influence of the built environment on physical
activity levels. One evidence review shows that whether older people choose to
undertake physical activity can be influenced by variables such as perceived safety,
aesthetics, provision of walking paths and convenience of access to facilities.137
Women’s Health Victoria explained to the Committee that particular
environmental design barriers can deter women from engaging in physical activity:
… good urban design needs to be gender sensitive — that is, it needs to take account of how urban design can impact differently on women than it does on men ... We know that for women the most popular form of physical activity is walking, but women face specific barriers to this and probably physical activity more broadly, which can have an impact in terms of its preventative health effects. The barriers can obviously be urban design and infrastructure, perceptions of safety in the community as well as other factors like caring responsibilities, issues associated with body image and lack of time.138
Several factors have been cited for Australian children’s decreasing fitness and
participation in regular exercise. The trend towards smaller backyard sizes (or no
backyards) has also limited the space available for children to play (discussed
further in Chapters 4 and 6). Many studies focus on the pervasive influence of a
risk‐averse culture and fear of ‘stranger danger’ among parents, meaning that they
are less likely to allow children to walk or ride to school, to play outside in their
communities or go anywhere alone.139
Despite such fears, recent VicHealth statistics show that ‘There is no evidence to
indicate any fundamental change over time of threats to children as measured by
actual crimes of abduction, robbery, assault and homicide committed against them
134 R Clark et al, Local government and obesity prevention, 21. 135 B Saelens and S Handy, ‘Built environment correlates of walking’, S550–S566. 136 The Built Environment and Getting People Active, Healthy Built Environments Program, 47. 137 GO Cunningham and YL Michael, ‘Concepts Guiding the Study of the Impact of the Built Environment on Physical Activity for Older Adults: A Review of the Literature’, American Journal of Health Promotion, July‐August 2004, 18 (6): 435–443. 138 Ms R Butera, Women’s Health Victoria, Transcript of Evidence, 7 September 2011, 248. 139 S Zubrick et al, Nothing but fear itself, 3; Department of Transport 2010 The Pedestrian Access Strategy – A strategy to increase walking for transport in Victoria, Victorian Government, Melbourne, 21; D Tucker and J Stone, ‘Active Transport To School: A Study Of Political Barriers In Glen Eira’, Faculty of Architecture, Building and Planning, University of Melbourne, 2011, 1; VicHealth 2011 Streets Ahead 2008–2011 Program evaluation report, Victorian Government, Melbourne, 16‐17.

Chapter 3: Contributing factors to chronic disease
25
by strangers.’140 Interestingly, the study also showed that while the majority of
parents were willing to let their children walk or ride to a nearby park without an
adult, they would not let them play there unsupervised.141
The study’s authors argue that while ‘initiatives put in place to address community
and personal safety have had the unintended consequence of heightening parental
caution and increasing vigilance’, the reasons why children are engaging less with
the outdoors is as much due to shifting sociological factors:
… the evidence shows there have been substantial changes in Australian family life linked to work, employment, the extension of the lifespan, the lowering of the age range for early childhood education and the need for care outside of the home. These factors, and exerting inexorable forces upon the shape of daily activity and routine, impart clear restrictions on where children can be left unsupervised, who can supervise them, the rules for transferring duty of care, and general tolerance for children having a ‘freer range’ of independent mobility.142
Some researchers and commentators have referred to the ‘bubble wrapping’143 of
children, where both real and perceived safety fears mean that parents are less
likely to allow children to play alone or unsupervised. Professor Billie Giles‐Corti
and Professor Carolyn Whitzman both told the Committee of their concerns that
some Australian children today are growing up with less independent mobility than
previous generations.144 Researcher Dr Michael Ungar has written, ‘Too much risk
and we endanger a child. Too little risk and we fail to provide a child with healthy
opportunities for growth and psychological development.’145 Similarly, Ms Rachel
Carlisle of the Heart Foundation (Victoria) said to the Committee, ‘in denying
[children] the risks they need to grow and develop, we are actually risking them
getting chronic diseases. Which risk is more prevalent?’146
Dr Rob Grenfell, Strategic Health Adviser to Parks Victoria, further commented:
It is a sad reflection on Australia that we have reached a point where we have to write physical activity guidelines for children. How did we get to this? … If we think of our own childhoods, for instance, it was hard enough for your mother to round you up to put you to bed at night.147
140 S Zubrick et al, Nothing but fear itself, 3. (Zubrick et al’s emphasis.) 141 VicHealth 2011 Towards active and independently mobile children – Survey review, Victorian Government, Melbourne, 9. 142 S Zubrick et al, Nothing but fear itself, 3. 143 K Malone, ‘The bubble‐wrap generation: children growing up in walled gardens’, Environmental Education Research, September 2007, 13 (4): 513‐527; M Ungar, Too Safe For Their Own Good: How risk and responsibility help teens thrive, Allen and Unwin, Sydney, 2008, 3; J Albrechtsen, ‘Our kids are covered in bubble wrap’, The Australian, December 28, 2011, http://bit.ly/zc5Msa accessed 23 March 2011. 144 Prof B Giles‐Corti, Transcript of Evidence, 4 August 2011, 13; Assoc Prof C Whitzman, Transcript of Evidence, 7 September 2011, 265. 145 M Ungar, Too Safe For Their Own Good, 3. 146 Ms R Carlisle, Heart Foundation (Victoria), Transcript of Evidence, 4 August 2011, 62. 147 Dr R Grenfell, Parks Victoria, Transcript of Evidence, 7 September 2011, 237.

Inquiry into Environmental Design and Public Health in Victoria
26
3.3 Healthy eating
Only 10% of Victorians meet the healthy eating guidelines for fruit and vegetable intake, the average Australian adult eats out more than 4 times per week, and everyday 4.5 million Australians visit a fast food outlet.148
Eating fresh and nutritious food is a key component of health and wellbeing.149 A
poor diet is a key contributing factor to Australians’ high rates of chronic disease
and obesity. Many people eat more food than they physically need, and ‘Food that
used to be considered a special treat (chocolate, lollies, soft drink, potato chips) is
part of the daily diet for many people.’150 Long daily commutes and shifts in work
and family patterns also have decreased the time many people have for cooking
healthy food. As Associate Professor John Fitzgerald from VicHealth pointed out to
the Committee, ‘When it takes you six minutes to get a pizza delivered to your
house but it takes you 45 minutes to cook a meal, you know which choice people
are going to make’.151
Several studies suggest that unhealthy food choices can be influenced by a high
concentration of fast food or take‐away outlets in a neighbourhood.152 It is difficult
to define what constitutes ‘fast food’ from a nutritional point of view. According to
Food Standards Australia and New Zealand, one definition of a fast food restaurant
is ‘a franchise or a number of similar establishments under one ownership, or
management with common branding, where foods such as chicken, chips, pizza,
hamburgers etc. can be provided without significant time delay.’153 Fast food meals
are often cheap, quick to purchase and consume, and may provide a range of
choices of varying nutritional quality. However they usually predominantly offer
foods that are high in energy, saturated fats and sugar, and low in protein, vitamins
and fibre essential for a healthy, nutritious diet.154
The Committee heard that under current Victorian planning laws, councils can
have a difficult time preventing a geographical oversupply of such businesses:
148 J Donovan et al, Food‐sensitive planning and urban design: A conceptual framework for achieving a sustainable and healthy food system, Heart Foundation (Victoria), Melbourne, 2011, 2; R Carey and K McConell, A Resilient Fruit and Vegetable Supply for a Healthy Victoria: Working together to secure the future, Food Alliance, Melbourne, 2011, 4. 149 Municipal Association of Victoria, Submission No. 61, July 2011, 21‐22. 150 AG Capon, ‘The way we live in our cities’, 659. 151 Assoc Prof J Fitzgerald, VicHealth, Transcript of Evidence, 23 August 2011, 82; VicHealth, Submission No. 47, 11 July 2011, 6. 152 F Li et al, ‘Obesity and the built environment: does the density of neighborhood fast‐food outlets matter?’ American Journal of Health Promotion, January‐February 2009, 23 (3): 203‐9; J Pearce et al, ‘Neighborhood deprivation and access to fast‐food retailing: a national study’, American Journal of Preventive Medicine, May 2007, 32 (5): 375‐82; LK Fraser et al, ‘The geography of Fast Food outlets: a review’, International Journal of Environmental Research and Public Health, May 2010, 7 (5): 2290‐308; J Maddock, ‘The relationship between obesity and the prevalence of fast food restaurants: state‐level analysis’, American Journal of Health Promotion, November‐December 2004, 19 (2): 137‐43; Deakin University’s Centre for Physical Activity and Nutrition Research, Submission No. 16, 30 June 2011, 3; Obesity Policy Coalition, Submission No. 32, 30 June 2011, 2; House of Representatives Standing Committee on Health and Ageing 2009 Weighing it up: Obesity in Australia, 82‐83, 126; VicHealth, Submission No. 47, 11 July 2011, 6; Victorian Council of Social Service, Submission No. 49, 8 July 2011, 2; Maribyrnong City Council, Submission No. 52, July 2011, 2; Heart Foundation (Victoria), Submission No. 55, July 2011, 34; K Wong, ‘Fast Food Linked to Obesity, Diabetes’, Scientific American, 3 January 2005, http://bit.ly/91PHyH accessed 20 February 20 2011. 153 Food Standards Australia & New Zealand, 2012, http://www.foodstandards.gov.au/ accessed 20 March 2012. Other definitions of fast food, such as that used by Fair Work Australia in determining award wages, include that food and beverages are sold primarily to be consumed away from the point of sale and are packaged accordingly. 154 ‘About the Guidelines’, Eat for Health, National Health and Medical Research Council, 2012 http://bit.ly/uPHrD9 accessed 4 April 2012; ‘Limit Access to Fast Foods’, Active Healthy Communities, Queensland Government and Heart Foundation, http://bit.ly/JmbPF1 accessed 4 April 2012.
Chapter 3: Contributing factors to chronic disease
27
Limited grounds exist to oppose their development and concerns about overweight, obesity and chronic disease within the community is not relevant grounds for opposition. Further, councils can also be reluctant to pursue their concerns at the Victorian Civil and Administrative Tribunal given the extensive resources available to large fast food companies to fight these matters.155
However a comprehensive Australian study argues that the correlation between
fast food availability and community health is simplistic, and that it is more
pertinent ‘to understand the nature of what food is available in all food outlets,
rather than to simply quantify the number of fast‐food outlets in a
neighbourhood.’156 Another Victorian‐based study of children’s eating habits and
neighbourhood fast food outlets also failed to establish a causal link, with the
authors concluding that ‘Such relationships appear to be complex and may not be
adequately captured by the measures of access included in the current study.’157 A
study of six rural areas in Victoria determined that lack of physical activity was
more relevant in a community’s obesity rates than consumption of fast food or
access to fast food outlets.158
While a high concentration of fast food in an area may contribute to a
community’s poor dietary habits, research suggests that an important factor in
people eating fresh, healthy food is proximity to stores that sell it.159 Infrastructure
barriers also can make healthy eating more difficult, such as inadequate public
transport or poor street connectivity to shops that sell fresh food.
A comprehensive analysis of relevant studies from 1985‐2008 showed that people
who have better access to supermarkets (which usually sell a wide variety of fresh
food) and less access to convenience stores and fast food outlets ‘tend to have
healthier diets and lower levels of obesity’.160 A US‐based study suggested that
people who lived within 100 metres of a store that sold fresh vegetables were
more likely to regularly eat them, and ‘each additional metre of shelf space was
associated with 0.35 servings per day of increased intake.’161
Food security refers to the ability to have regular access to adequate and nutritious
food.162 The World Health Organization defines the ‘three pillars’ of food security
as:
155 Obesity Policy Coalition, Submission No. 32, 30 June 2011, 1. 156 HBEP literature review – The Built Environment and Providing Healthy Food Options, Healthy Built Environments Program, University of New South Wales, Sydney, 2012, 87‐88; see also JR Sharkey et al, ‘Focusing on fast food restaurants alone underestimates the relationship between neighborhood deprivation and exposure to fast food in a large rural area’, Nutrition Journal, 2011, 10: 10. 157 AF Timperio et al, ‘Children's takeaway and fast‐food intakes: associations with the neighbourhood food environment’, Public Health Nutrition, October 2009, 12 (10): 1960‐1964. 158 D Simmons et al, ‘Choice and availability of takeaway and restaurant food is not related to the prevalence of adult obesity in rural communities in Australia’, International Journal of Obesity, June 2005, 29 (6): 703‐710. 159 CD Zick et al, ‘Running to the store? The relationship between neighborhood environments and the risk of obesity’, Social Science & Medicine, November 2009; 69 (10): 1493‐1500; NI Larson et al, ‘Neighborhood environments: disparities in access to healthy foods in the U.S.’ American Journal of Preventive Medicine, January 2009, 36 (1): 74‐81. 160 NI Larson et al, ‘Neighborhood environments’, 74‐81. 161 JN Bodor et al, ‘Neighbourhood fruit and vegetable availability and consumption: the role of small food stores in an urban environment’, Public Health Nutrition, April 2008, 11 (4): 413‐420. 162 A Kavanagh et al, Place does matter for your health: A report of the Victorian Lifestyle and Neighbourhood Environment Study, University of Melbourne, 2007, 65; see also ‘Food security’, VicHealth, http://bit.ly/Hr8nKp accessed 20 February 2012.
Inquiry into Environmental Design and Public Health in Victoria
28
food availability: sufficient quantities of food available on a consistent basis
food access: having sufficient resources to obtain appropriate foods for a nutritious diet
food use: appropriate use based on knowledge of basic nutrition and care, as well as adequate water and sanitation.163
The Committee heard discussion that urban expansion into peri‐urban areas (semi‐
agricultural areas that lie between metropolitan centres and rural land)164 may
pose a threat to food security. As well as supporting local employment,
biodiversity, recreational activity and tourism, peri‐urban areas are responsible for
much of the fresh produce that feeds Melbourne and its surrounding areas. More
than half of Melbourne’s vegetables and about 17 percent of its fruit is grown
within 100 kilometres of the city.165 The Food Alliance argued that ‘the protection
of these peri‐urban fruit and vegetable growing areas should be seen as a public
health issue rather than only in terms of protecting the economic value of this
production.’166
A farmers’ market support program launched by the Victorian government in 2007
and renewed in June 2011 aims to develop new and expand existing farmers
markets across Victoria.167 Research suggests that farmers’ markets can maintain
land in agricultural production by supporting the viability of small producers.168
While there has been a recent boom in small, locally‐based farmers’ markets
around Victoria, prices are often high and few are located in outer suburban or
lower socio‐economic areas. Community gardens are another response to food
security, but many are oversubscribed and are also rarely found in new outer
suburban housing developments.169
Recommendation 1
That the Victorian Government:
works with VicHealth to commission further Victorian research into the cumulative health and wellbeing impacts of the density of fast food outlets on a community
assists local governments to map all food outlets within a local government area
develops a planning mechanism that can be used by local councils to limit the oversupply of fast food outlets in communities
develops a plan to facilitate the supply of healthy food choices to Victorians.
163 ‘Food Security’, World Health Organization, 2012, http://bit.ly/dzdsS4 accessed 20 October 2011. 164 M Buxton et al, Planning Sustainable Futures For Melbourne’s Peri‐Urban Region, School of Global Studies, Social Science and Planning, Royal Melbourne Institute of Technology, 2008, i. 165 Ms K McConell, Food Alliance, Transcript of Evidence, 23 August 2011, 100. 166 Ms K McConell, Food Alliance, Transcript of Evidence, 23 August 2011, 101. 167 P Walsh, ‘Coalition delivers $2 million to enhance Victoria's popular farmers' markets’, media release, Minister for Agriculture and Food Security, 9 July 2011, http://bit.ly/yXWOSE; ‘Regional Development Victoria, Application Guidelines – Farmers’ Markets Support Program’, Regional Development Victoria, http://bit.ly/xpZGoF accessed 20 October 2011. 168 Outer Suburban/Interface Services and Development Committee 2010 Inquiry into Sustainable Development of Agribusiness in Outer Suburban Melbourne, Parliament of Victoria, Melbourne, 53. 169 Outer Suburban/Interface Services and Development Committee 2010 Inquiry into Sustainable Development, 285‐286; HBEP literature review – Executive Summary, Healthy Built Environments Program, University of New South Wales, Sydney, 2012, 14‐15.
Chapter 3: Contributing factors to chronic disease
29
Recommendation 2
That the Victorian Government conducts a review into the economic,
environmental and social importance of food production and distribution in
Victoria and its consequences for public health.
Recommendation 3
That the Melbourne Metropolitan Strategy includes measures to identify and
protect valuable agricultural land in peri‐urban Melbourne.
3.4 Alcohol
Drinking alcohol socially is considered ‘intrinsically part of Australian culture’.170
While the majority of Australians drink in moderation, it is estimated that one in
five drink at ‘short‐term risky/high‐risk levels at least once a month.’171 While
former172 and current173 government programs have addressed this problem, the
social and health‐related costs of alcohol through death, accidents, lost work
productivity, healthcare and crime are still estimated at over $15 billion
annually.174 The National Drug Research Institute has estimated that between 1996
and 2005, over 32,000 Australians died from injury and disease attributable to risky
and high‐risk drinking.175
In Victoria, the estimated annual cost of alcohol‐related harm is almost $4.3 billion,
$530 million of which relates solely to healthcare.176 It is estimated that one‐third
of Victorian adults (aged 18 or over) ‘drink at risky or high‐risk levels for short‐term
harm at least yearly’, and nine percent of Victorians drink at long‐term risky or
high‐risk levels.177
Substantial research links high alcohol consumption with several chronic diseases,
and alcohol is a significant risk factor for the development of a range of cancers.178
In 2005, long‐term chronic alcohol consumption was linked to 5,070 new cases of
170 National Public Health Partnership 2009 Australia: The Healthiest Country By 2020, Technical Report 3: Preventing alcohol‐related harm in Australia: a window of opportunity, report prepared for the National Preventative Health Taskforce by the Alcohol Working Group, Commonwealth of Australia, Canberra, 2. 171 National Public Health Partnership 2009 Australia: The Healthiest Country By 2020, 2. 172 Examples include: the National Alcohol Strategy 2006‐2011, Department of Health and Ageing, 2011, http://bit.ly/J2VODO; the 2007 establishment of the Victorian Ministerial Taskforce on Alcohol and Public Safety; and State of Victoria 2008 Restoring the balance – Victoria’s alcohol action plan 2008–2013, Melbourne, http://bit.ly/Is6yQK accessed 10 October 2011. 173 See the current Victorian Government’s Whole of Government Victorian Alcohol and Drug Strategy, http://bit.ly/xODaLg accessed 10 October 2011. 174 ‘Alcohol and Chronic Disease Prevention: Position Statement’, Australian Chronic Disease Prevention Alliance http://bit.ly/IN7tXg; ‘National Alcohol Strategy 2006‐2011’, Department of Health and Ageing, 2011, http://bit.ly/HzuReJ accessed 14 October 2011. 175 M Evans et al, Responsible Takeaway Alcohol Hours Bill 2010 – A Submission by the National Drug Research Institute, National Drug Research Institute, Curtin University of Technology, Perth, 2. 176 Alcohol Policy Coalition, Submission No. 33, 30 June 2011, 1. 177 Department of Health 2008 Victoria’s Alcohol Action Plan 2008–2013, Ministerial Taskforce on Alcohol and Public Safety, Victorian Government, Melbourne, 9. 178 Australian Chronic Disease Prevention Alliance, Submission to Senate Standing Committee on Community Affairs, 2007, 2, http://bit.ly/wRjrb2 accessed 20 January 2011; Alcohol Policy Coalition, Submission No. 33, 30 June 2011, 1; N Donnelly et al, ‘Liquor outlet concentrations and alcohol‐related neighbourhood problems’, Alcohol Studies Bulletin, NSW Bureau of Crime Statistics and Research, April 2006, 8:1; Alcohol Use and Harms in Australia (2009) – Information paper, Australian Medical Association, 2009, http://ama.com.au/node/4762 accessed 20 January 2011.

Inquiry into Environmental Design and Public Health in Victoria
30
cancer (or five percent of all cancers) in Australia.179 Alcohol can also be a factor in
the development of type 2 diabetes and kidney disease, and can compound the
effects of other major chronic disease risk factors such as obesity and physical
inactivity.180
In recent years, Australian states and territories have seen ‘a significant
liberalisation of licensing laws’ and a corresponding increase in businesses selling
alcohol.181 In Victoria alone, the number of liquor outlets has doubled over the last
two decades.182 Several studies have shown correlations between alcohol outlet
density in an area and a range of alcohol‐related harms, including rates of assaults,
domestic violence and drink‐driving.183 Some research suggests that the
prevalence of packaged (take‐away) liquor outlets in particular tends to lead to
more alcohol‐related harms compared to other licensed premises in an area (such
as pubs or restaurants).184
However it is more difficult to determine causal connections between liquor outlet
density and chronic disease, as factors such as socio‐economic disadvantage,
smoking, diet and levels of exercise all contribute to patterns of consumption.185
More research is needed, but current evidence suggests that limiting liquor outlet
saturation in an area may have multiple beneficial flow‐on effects on a
community’s health and wellbeing.186
Some Australian researchers also argue that measuring alcohol consumption
through numbers of liquor outlets is an inherently flawed methodology. Another
approach suggests measuring the volume of total alcohol consumption sold within
a specific area or population.187
As with concentrations of fast food outlets in an area, Victorian councils have
reported difficulties in opposing packaged liquor outlets on public health grounds.
Warrnambool City Council stated in their submission:
179 Alcohol and Chronic Disease Prevention Position Statement, Australian Chronic Disease Prevention Alliance, 2. 180 Alcohol and Chronic Disease Prevention Position Statement, Australian Chronic Disease Prevention Alliance, 2‐4. 181 M Livingston, Association between increased density of alcohol outlets and harmful outcomes, presentation, Turning Point Alcohol and Drug Centre, University of Melbourne, http://bit.ly/z23zqu accessed 20 January 2011. 182 Alcohol Policy Coalition, Submission No. 33, 30 June 2011, 1. 183 National Public Health Partnership 2009 Australia: The Healthiest Country By 2020, 20; T Chikritzhs et al, ‘Predicting alcohol‐related harms from licensed outlet density: a feasibility study’, Monograph Series No. 28. National Drug Law Enforcement Research Fund, 2007, Hobart, xii, 18; M Livingston et al, ‘Diverging trends in alcohol consumption and alcohol‐related harm in Victoria’, Australian and New Zealand Journal of Public Health, 2010, 34 (4): 368‐373; M Livingston, Using geocoded liquor licensing data in Victoria –The socioeconomic distribution of alcohol availability in Victoria, VicHealth, Melbourne, 2011, 9; National Drug Research Institute 2007 Restrictions on the Sale and Supply of Alcohol: Evidence and Outcomes, National Drug Research Institute, Curtin University of Technology, Perth, 2007, 30; N Donnelly et al, ‘Liquor outlet concentrations and alcohol‐related neighbourhood problems’, Alcohol Studies Bulletin, NSW Bureau of Crime Statistics and Research, April 2006, 8: 1‐15. 184 ‘Restrictions on the Sale and Supply of Alcohol: Evidence and Outcomes’, National Drug Research Institute, 31‐32; PJ Gruenewald and L Remer, ‘Changes in Outlet Densities Affect Violence Rates’, Alcoholism: Clinical and Experimental Research, July 2006, 30 (7): 1184–1193; M Livingston, ‘Alcohol outlet density and harm: Comparing the impacts on violence and chronic harms’, Drug and Alcohol Review, September 2011, 30 (5): 515–523; N Donnelly et al, ‘Liquor outlet concentrations and alcohol‐related neighbourhood problems’, 2. 185 ‘Restrictions on the Sale and Supply of Alcohol: Evidence and Outcomes’, National Drug Research Institute, 190. 186 M Livingston, Association between increased density of alcohol outlets and harmful outcomes; M Evans et al, Responsible Takeaway Alcohol Hours Bill 2010, 3. 187 T Chikritzhs et al, ‘Predicting alcohol‐related harms from licensed outlet density’, xiv; National Drug Research Institute 2007 Restrictions on the Sale and Supply of Alcohol: Evidence and Outcomes, 29‐30.

Chapter 3: Contributing factors to chronic disease
31
As the City is growing the Council is receiving more applications for liquor licensing of new premises. Whilst it has power around planning applications, decision making criteria are open to interpretation. The definition of ‘amenity’ is very subjective and therefore open to interpretation.188
There are some international precedents where government bodies have powers
to limit liquor outlets in an area. In the USA, California’s laws restricts liquor
licences on a per‐capita basis, and in the UK, the Violent Crime Reduction Act
2006 (UK) includes provisions to make licensees contribute to the costs of alcohol‐
related crime in ‘Alcohol Disorder Zones’ where a concentration of premises have
led to ‘high rates of problems’.189
A change was made to the Victoria Planning Provisions in April 2011. Previously,
bottle shops were exempt from certain planning laws and were not required to
apply for planning permits from local government before applying for a packaged
liquor license. Clause 52.27 (Licensed premises) was altered ‘to require a planning
permit to use land to sell packaged liquor; clarify the circumstances when a
planning permit is required under the Clause; and improve the readability of the
Clause.’190 This will now ‘require bottle shops to justify their presence in the
community in the same way as other licensed premises.’191
Recommendation 4
That the Victorian Government:
works with VicHealth to commission further Victorian research into the cumulative health and wellbeing impacts of the density of packaged liquor outlets on a community
strengthens planning mechanisms to allow local government to regulate the oversupply of packaged liquor outlets.
3.5 Socio‐economic status
So far as is possible, no one should be disadvantaged by their surroundings and no one
group should be healthier than another, simply by virtue of where they live.192
Research shows that people living in lower socio‐economic status (SES) areas can
be more vulnerable to risk factors which can lead to or exacerbate chronic
disease.193 Many complex and interrelated factors must be taken into account
when assessing the relationship between SES and health, such as gender, cultural,
ethnic and linguistic background, and access to health services and education.
188 Warrnambool City Council, Submission No. 13, 30 June 2011, 7. 189 M Livingston, Association between increased density of alcohol outlets and harmful outcomes. 190 ‘Victoria Planning Provisions’, Department of Planning and Community Development, 2010, http://bit.ly/HLFsDt; ‘Planning approval now required for packaged liquor outlets’, Department of Planning and Community Development, 12 April 2011, http://bit.ly/yJNr2M accessed 25 October 2011. 191 ‘Coalition Government gives communities a say on bottle shops’, media release, Department of Premier and Cabinet, 1 April 2011, http://bit.ly/ACGOGm accessed 25 October 2011. 192 ‘Modernising Victoria’s Planning Act – A discussion paper on opportunities to improve the Planning and Environment Act 1987’, Obesity Policy Coalition, 2009, 2, http://bit.ly/wUs0Ck accessed 25 October 2011. 193 HBEP literature review – The Built Environment and Providing Healthy Food Options, Healthy Built Environments Program, University of New South Wales, Sydney, 2012, 88; JD Glover et al, ‘The socioeconomic gradient and chronic illness and associated risk factors in Australia’, Australia and New Zealand Health Policy, 2004, 1 (8).
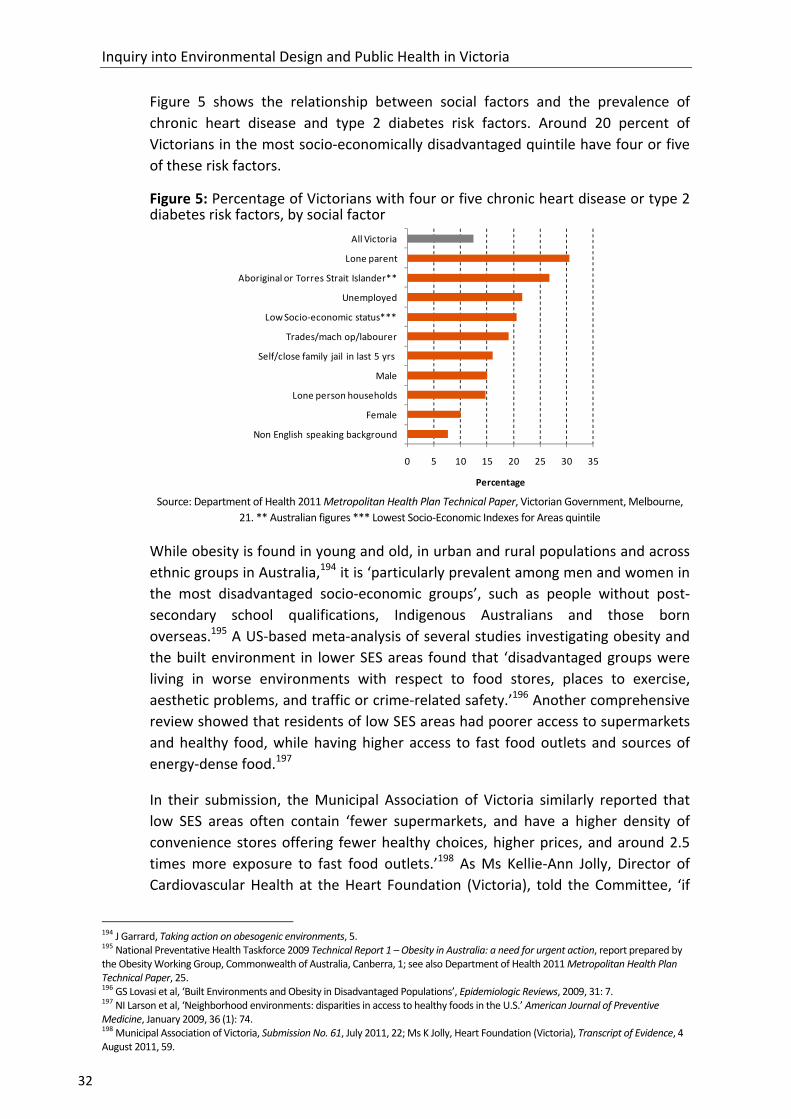
Inquiry into Environmental Design and Public Health in Victoria
32
Figure 5 shows the relationship between social factors and the prevalence of
chronic heart disease and type 2 diabetes risk factors. Around 20 percent of
Victorians in the most socio‐economically disadvantaged quintile have four or five
of these risk factors.
Figure 5: Percentage of Victorians with four or five chronic heart disease or type 2 diabetes risk factors, by social factor
0 5 10 15 20 25 30 35
All Victoria
Lone parent
Aboriginal or Torres Strait Islander**
Unemployed
Low Socio‐economic status***
Trades/mach op/labourer
Self/close family jail in last 5 yrs
Male
Lone person households
Female
Non English speaking background
Percentage Source: Department of Health 2011 Metropolitan Health Plan Technical Paper, Victorian Government, Melbourne,
21. ** Australian figures *** Lowest Socio‐Economic Indexes for Areas quintile
While obesity is found in young and old, in urban and rural populations and across
ethnic groups in Australia,194 it is ‘particularly prevalent among men and women in
the most disadvantaged socio‐economic groups’, such as people without post‐
secondary school qualifications, Indigenous Australians and those born
overseas.195 A US‐based meta‐analysis of several studies investigating obesity and
the built environment in lower SES areas found that ‘disadvantaged groups were
living in worse environments with respect to food stores, places to exercise,
aesthetic problems, and traffic or crime‐related safety.’196 Another comprehensive
review showed that residents of low SES areas had poorer access to supermarkets
and healthy food, while having higher access to fast food outlets and sources of
energy‐dense food.197
In their submission, the Municipal Association of Victoria similarly reported that
low SES areas often contain ‘fewer supermarkets, and have a higher density of
convenience stores offering fewer healthy choices, higher prices, and around 2.5
times more exposure to fast food outlets.’198 As Ms Kellie‐Ann Jolly, Director of
Cardiovascular Health at the Heart Foundation (Victoria), told the Committee, ‘if
194 J Garrard, Taking action on obesogenic environments, 5. 195 National Preventative Health Taskforce 2009 Technical Report 1 – Obesity in Australia: a need for urgent action, report prepared by the Obesity Working Group, Commonwealth of Australia, Canberra, 1; see also Department of Health 2011 Metropolitan Health Plan Technical Paper, 25. 196 GS Lovasi et al, ‘Built Environments and Obesity in Disadvantaged Populations’, Epidemiologic Reviews, 2009, 31: 7. 197 NI Larson et al, ‘Neighborhood environments: disparities in access to healthy foods in the U.S.’ American Journal of Preventive Medicine, January 2009, 36 (1): 74. 198 Municipal Association of Victoria, Submission No. 61, July 2011, 22; Ms K Jolly, Heart Foundation (Victoria), Transcript of Evidence, 4 August 2011, 59.

Chapter 3: Contributing factors to chronic disease
33
you only give people information and advice about healthy eating and exercise but
parents cannot buy the food they need to prepare those meals because their only
options for groceries are the gas station or the local mini mart, then all that is just
talk.’199
A Geelong‐based study under Professor Evelyne de Leeuw of Deakin University
discovered:
… there are neighbourhoods, even here in Melbourne, where people have a hard time getting access to nutritious foods. My students last year looked at different neighbourhoods in Geelong. In Norlane in Corio, which is in the lower end of the socio‐economic spectrum, there are seven fast food outlets.200
As with fast food, VicHealth notes that there is a pattern that the more socio‐
economically disadvantaged an area, the more packaged liquor outlets there
typically are, ‘potentially exacerbating already‐existing health inequalities.’201 A
Victoria‐based study demonstrated that in urban areas, both takeaway and
licensed liquor outlets ‘were significantly more likely to be located in areas of
socio‐economic disadvantage’, while in rural and regional areas, all types of liquor
outlets were more prevalent in low SES areas.202
The University of Melbourne’s Victorian Lifestyle and Neighbourhood Environment
Study looked at the food, alcohol and exercise patterns of almost 5000 people
across 50 areas in Melbourne. Among other findings, they discovered that
residents in low SES areas were less likely to purchase fruit and groceries that are
low in fat, salt and sugar, or to exercise at levels that are sufficient for health.
People in low SES areas were also more likely to buy fast food, and men were more
likely to consume alcohol at harmful levels.203 Low SES areas generally had more
fast food and alcohol stores than higher SES areas and fewer walking paths.204 The
authors concluded:
The lower level of healthy behaviours found in low SES areas occurs even after we statistically adjust for the socio‐economic characteristics of people who are living in disadvantaged areas. This suggests that physical and other characteristics of low SES areas are impacting on people’s ability to engage in activities that promote good health.205
Other studies have shown a socio‐economic influence in participation in physical
activity: people living in low income areas are less likely to do regular exercise
‘partly because the environments in which they live are less conducive to it.’206
199 Ms K Jolly, Heart Foundation (Victoria), Transcript of Evidence, 4 August 2011, 60. 200 Prof E de Leeuw, Transcript of Evidence, 7 September 2011, 225. 201 VicHealth, Submission No. 47, 11 July 2011, 7. 202 M Livingston, ‘The social gradient of alcohol availability in Victoria, Australia’, Australian and New Zealand Journal of Public Health, February 2012, 36 (1): 41–47; M Livingston, Using geocoded liquor licensing data in Victoria, 8. 203 A Kavanagh et al, Place does matter for your health, 6. 204 A Kavanagh et al, Place does matter for your health, 8. 205 A Kavanagh et al, Place does matter for your health, 6. 206 R Mitchell and F Popham, ‘Effect of exposure to natural environment on health inequalities’, The Lancet, 8 November 2008, 372 (9650): 1655; see also A Bauman et al, Getting Australia active: towards better practice for the promotion of physical activity, National Public Health Partnership, Melbourne, 2002, 20.
Inquiry into Environmental Design and Public Health in Victoria
34
They are less likely to walk for exercise,207 and are less likely to use neighbourhood
recreational facilities than those living in high SES areas.208 This perpetuates a cycle
where poor health is maintained in the communities most vulnerable to it.
The 2007 National Health Survey: Mental Health showed that Australians of lower
SES exhibit higher rates of mental illness, particularly depression and certain
anxiety disorders.209 This is also true in Victoria: people from lower SES areas
experience a disproportionate amount of mental illness compared to those from
higher SES areas.210
Residents of low SES areas also tend to have higher rates of respiratory infections
from damp and mould. A Victorian Council of Social Service study of Melbourne
rental properties found that 19 percent showed ‘visible and extensive mould.’211
Poor health in low SES areas can be multi‐generational, presenting challenges for
local governments to break patterns of unhealthy behaviour. The City of
Maribyrnong told the Committee of the difficulties of running health programs in
areas of entrenched disadvantage: ‘It has been Council’s experience that trying to
influence individual behaviour change through health promotion programs and
health education without having a built environment to support these efforts will
have only a marginal impact.’212 Mr Nick Matteo, Manager of Community Planning
and Advocacy at the City of Maribyrnong, further described some of these
frustrations in changing unhealthy patterns within their community:
One of the ongoing challenges we have at council is that we have intergenerational poor health in areas of disadvantage where you have got, based on planning decisions, concentrations of electronic gaming machines, packaged liquor and fast food outlets. All have a cumulative and exponential impact on communities without us having the capacity to balance with fresh food, supermarkets and other things.213
3.6 Ageing population
As in many developed countries, decreasing fertility and increasing life expectancy
rates have created a growing ageing population in Australia.214 Victoria’s ageing
population will impact significantly on already‐rising rates of chronic disease; the
207 CBM Kamphuis et al, ‘Socioeconomic differences in lack of recreational walking among older adults: the role of neighbourhood and individual factors’, International Journal of Behavioral Nutrition and Physical Activity, 2009, 6: 1‐11. 208 B Giles‐Corti and RJ Donovan, ‘Socioeconomic status differences in recreational physical activity levels and real and perceived access to a supportive physical environment’, Preventive Medicine, December 2002, 35 (6): 601‐611. 209 National Survey of Mental Health and Wellbeing: Summary of Results 2007, Australian Bureau of Statistics, 2008, http://bit.ly/rKPfA7 accessed 25 November 2011. 210 Department of Human Services 2006 Victorian Population Health Survey 2005 – Selected findings, Victorian Government, Melbourne, 60; S Begg et al, Burden of disease and injury in Australia 2003, Australian Institute of Health and Welfare, Canberra, 2007, 3‐4, 108‐110. 211 Victorian Council of Social Service, Submission No. 49, 8 July 2011, 9. 212 Maribyrnong City Council, Submission No. 52, July 2011, 3. 213 Mr N Matteo, Maribyrnong City Council, Transcript of Evidence, 6 September 2011, 166. 214 ‘Population by Age and Sex, Australian States and Territories, Jun. 2010’ Australian Bureau of Statistics, 2010, http://bit.ly/5XlX8o accessed 25 November 2011.

Chapter 3: Contributing factors to chronic disease
35
longer people live, the more chronic disease and disability they are likely to
experience.215
In 2001, one in six Victorians were ‘seniors’, aged over 60 years. By 2010, this
increased to one in four,216 and by 2051, around 27 percent of the state’s
population will be aged over 65, equating to between 1.7 and 2.1 million people.217
Over the past two decades, the number of older people aged 85 and over has
increased by 170.6 percent, compared with a total population growth of 30.9
percent over the same period.218
Apart from chronic disease, conditions that often correlate with age such as
dementia (including Alzheimer’s disease, vascular dementia and Parkinson’s
disease), are predicted to rise rapidly. The Department of Health and Ageing
reports that after the age of 65, the likelihood of being diagnosed with dementia
doubles every five years.219 Alzheimer’s disease – which affects between 50 and 70
percent of all dementia sufferers – can develop at any age, but is most common in
Australians over 65.220 Dementia is currently the single greatest cause of disability
in older Australians; 1,600 new cases are diagnosed nationally each week, a figure
projected to rise to 7,400 new diagnoses each week by 2050.221
This has considerable implications for future health service provision, labour force
participation, adequate aged‐care accommodation and the social and emotional
health of older people and their families. On average, a person over the age of 75
will use five times as many healthcare services as a person under that age.222 A
recent Ambulance Victoria report warns that their services are struggling to keep
up with the state’s ageing and population growth, which now ‘accounts for about
25 per cent of the increase in emergency demand.’223
Research suggests that the onset of dementia may be delayed by regular physical
activity and dietary choices.224 Gardening activities, for example, often can have
both physical and cognitive benefits for those living with dementia.225
215 Planning Institute of Australia and VicHealth, ‘Putting health at the centre of planning’, 2, http://bit.ly/IEfjmC accessed 20 September 2011; Heart Foundation (Victoria), Submission No. 55, July 2011, 10; Ms K Jolly, Heart Foundation (Victoria), Transcript of Evidence, 4 August 2011, 63. 216 Planning Institute of Australia and VicHealth, ‘Putting health at the centre of planning’, 2. 217 Council on the Ageing (Victoria), Submission No. 58, 11 July 2011, 2. 218 ‘Population by Age and Sex, Australian States and Territories, Jun 2010’, Australian Bureau of Statistics. 219 ‘Dementia’, Department of Health and Ageing, 2011, http://www.health.gov.au/dementia accessed 22 March 2012; see also Productivity Commission 2005 Economic Implications of an Ageing Australia, Commonwealth of Australia, Canberra, 176‐177. 220 ‘Types of dementia’, Alzheimer’s Australia, http://bit.ly/ImTbkJ accessed 22 March 2012. 221 ‘Statistics: National Facts and Figures 2012’, Alzheimer’s Australia, http://bit.ly/HCprQn accessed 22 March 2012. 222 Department of Health 2011 Metropolitan Health Plan Technical Paper, 46; see also ‘Urgent reform needed so all Australians can Age Well’, media release, Council on the Ageing, 22 December 2011, http://bit.ly/wxM6ow accessed 22 March 2012. 223 Ambulance Victoria 2009 Ambulance Victoria Strategic Plan 2010 – 2012, Draft For Consultation, Ambulance Victoria, Melbourne, 3; see also JA Lowthian et al, ‘The challenges of population ageing: accelerating demand for emergency ambulance services by older patients, 1995–2015’, Medical Journal of Australia, 2011, 194: 574–578. 224 Alzheimer’s Australia 2004 Dementia Research: A Vision for Australia, Canberra, 11, http://bit.ly/HLYpFa accessed 22 March 2012. 225 ‘Dementia‐friendly environments – A guide for residential care: Gardens and outdoor spaces’, VicHealth, 2011, http://bit.ly/Ht1U1G; ‘Gardens – A Joy Forever’, Dementia Care Australia, 2012, http://bit.ly/HLYE30; C Marshall, ‘Flagship dementia care garden sets new standard in patient care’, ABC News, 23 February 2011, http://bit.ly/gIPgZh; B Nogrady, ‘Exercise keeps dementia at bay’, ABC News, 3 September 2008, http://bit.ly/Hzf14F accessed 22 March 2012.

Inquiry into Environmental Design and Public Health in Victoria
36
3.7 Climate change
This is the critical decade. Decisions we make from now to 2020 will determine the severity of climate change our children and grandchildren experience.226
In 2009, medical journal The Lancet devoted a special edition to investigating the
negative health effects of climate change, and suggested strategies to mitigate
them. A summary of the studies concluded:
The threat of climate change has generated a global flood of policy documents, suggested technical fixes, and lifestyle recommendations. One widely held view is that their implementation would, almost without exception, prove socially uncomfortable and economically painful. But as a series of new studies shows, in one domain at least – public health – such a view is ill founded. If properly chosen, action to combat climate change can, of itself, lead to improvements in health.227
Climate change is thought to have contributed to several recent global weather
events, including heatwaves.228 During a Victorian heatwave from 26 January to 1
February 2009, maximum temperatures were 12‐15°C above normal. According to
the subsequent official report, Ambulance Victoria recorded:
a 25 percent increase in total emergency cases and a 46 percent increase over the three hottest days
a 34‐fold increase in cases with direct heat‐related conditions
a 2.8‐fold increase in cardiac arrest cases.229
Of the 374 Victorians who died as a result of the heatwave, the majority were over
75 years old.230 The Victorian government subsequently launched a health
initiative Staying healthy in the heat, to educate Victorians about how to avoid
heat‐related illness, and provided strategies to prepare for, and mitigate against,
the health impacts of heatwaves.231
The 2009 official government report on the heatwave concluded that the threat of
climate change ‘has demonstrated that prolonged extremely high temperatures
are a major hazard for Victorians that we must now expect and continue to
226 ‘The Critical Decade: key messages’, Climate Commission, 2011, http://bit.ly/jxvyxx; see also Department of Health 2011 Victorian Public Health and Wellbeing Plan 2011–2015, 23; Attorney‐General’s Department 2010 Australia to 2050: future challenges, Commonwealth of Australia, Canberra, vii‐xxvi; Victorian Climate Change Act 2010, Preamble, http://bit.ly/HLZiNU accessed 4 November 2011. 227 ‘The health benefits of tackling climate change’, The Lancet, 2009, 1‐8, http://bit.ly/zsco48 accessed 4 November 2011. 228 ‘Sustainable cities and coasts’, Commonwealth Scientific and Industrial Research Organisation, 2011, http://bit.ly/I4QOkj accessed 4 November 2011; Department of Human Services 2009 January 2009 Heatwave in Victoria: an Assessment of Health Impacts, Victorian Government, Melbourne, 15; Doctors for the Environment Australia Inc., Submission No. 51, 11 July 2011, 8; Environment Defenders Office (Victoria) Ltd, Submission No. 10, 29 June 2011, 13; Australian Institute of Landscape Architects, ‘National Policy Statement: Retrofitting Urban Environments’, AILA, Canberra, 2011, 2; A Capon, ‘The view from the city’, World Health Design, July 2011, 8; Heart Foundation (Victoria), Submission No. 55, July 2011, 13; Ms D Parnell, Council on the Ageing (Victoria), Transcript of Evidence, 23 August 2011, 91‐92; S Rahmstorf, ‘Climate Change – State of the Science’, Potsdam Institute for Climate Impact Research, Germany, 2010, http://bit.ly/HCsgAP accessed 3 December 2012; JA Patz et al, ‘Impact of regional climate change on human health’, Nature, 17 November 2005, 438: 310‐317; D Campbell‐Lendrum and C Corvalan, ‘Climate Change and Developing‐Country Cities: Implications For Environmental Health and Equity’, Journal of Urban Health: Bulletin of the New York Academy of Medicine, 2007, 84 (1): i110‐i111. 229 Department of Human Services 2009 January 2009 Heatwave in Victoria, iv. 230 Department of Human Services 2009 January 2009 Heatwave in Victoria, iv; Department of Climate Change and Energy Efficiency 2011 The Critical Decade: Climate Change and Health, Climate Commission Secretariat, Commonwealth of Australia, Canberra, 11. This number represents the excess deaths over what would be expected for that time of year. 231 ‘Staying healthy in the heat’ Department of Health, 2010, http://bit.ly/x3n1AL accessed 4 November 2011.
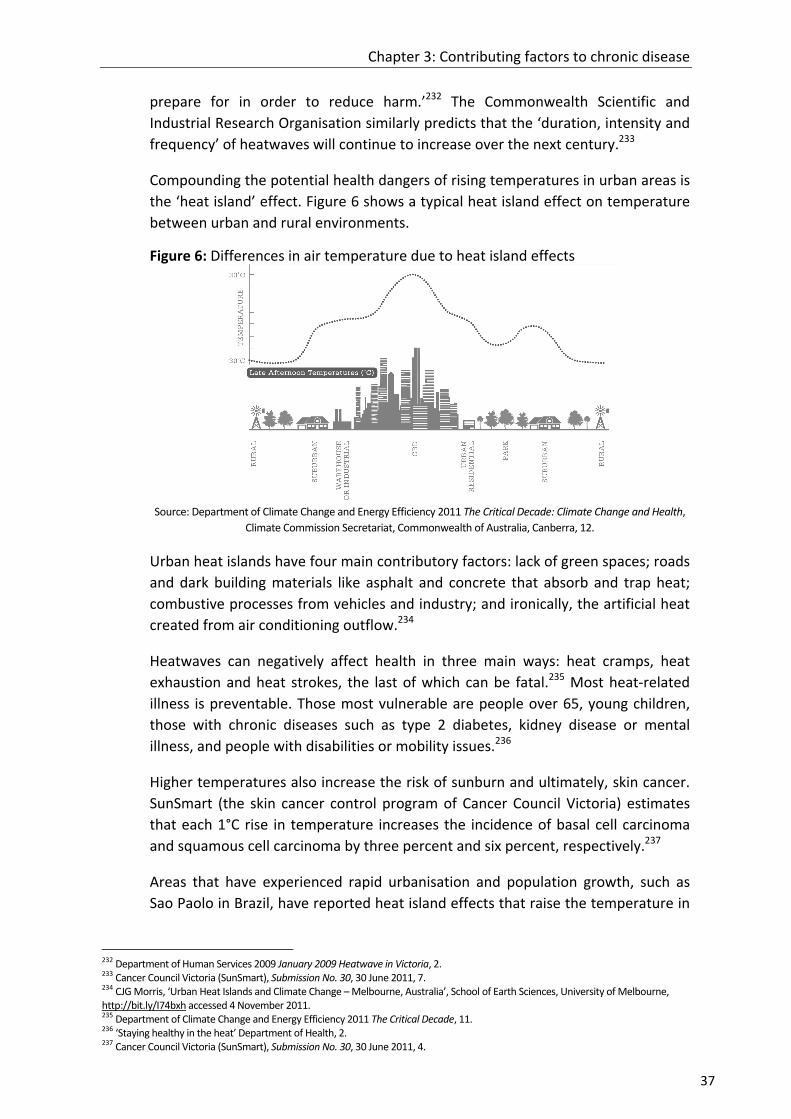
Chapter 3: Contributing factors to chronic disease
37
prepare for in order to reduce harm.’232 The Commonwealth Scientific and
Industrial Research Organisation similarly predicts that the ‘duration, intensity and
frequency’ of heatwaves will continue to increase over the next century.233
Compounding the potential health dangers of rising temperatures in urban areas is
the ‘heat island’ effect. Figure 6 shows a typical heat island effect on temperature
between urban and rural environments.
Figure 6: Differences in air temperature due to heat island effects
Source: Department of Climate Change and Energy Efficiency 2011 The Critical Decade: Climate Change and Health,
Climate Commission Secretariat, Commonwealth of Australia, Canberra, 12.
Urban heat islands have four main contributory factors: lack of green spaces; roads
and dark building materials like asphalt and concrete that absorb and trap heat;
combustive processes from vehicles and industry; and ironically, the artificial heat
created from air conditioning outflow.234
Heatwaves can negatively affect health in three main ways: heat cramps, heat
exhaustion and heat strokes, the last of which can be fatal.235 Most heat‐related
illness is preventable. Those most vulnerable are people over 65, young children,
those with chronic diseases such as type 2 diabetes, kidney disease or mental
illness, and people with disabilities or mobility issues.236
Higher temperatures also increase the risk of sunburn and ultimately, skin cancer.
SunSmart (the skin cancer control program of Cancer Council Victoria) estimates
that each 1°C rise in temperature increases the incidence of basal cell carcinoma
and squamous cell carcinoma by three percent and six percent, respectively.237
Areas that have experienced rapid urbanisation and population growth, such as
Sao Paolo in Brazil, have reported heat island effects that raise the temperature in
232 Department of Human Services 2009 January 2009 Heatwave in Victoria, 2. 233 Cancer Council Victoria (SunSmart), Submission No. 30, 30 June 2011, 7. 234 CJG Morris, ‘Urban Heat Islands and Climate Change – Melbourne, Australia’, School of Earth Sciences, University of Melbourne, http://bit.ly/I74bxh accessed 4 November 2011. 235 Department of Climate Change and Energy Efficiency 2011 The Critical Decade, 11. 236 ‘Staying healthy in the heat’ Department of Health, 2. 237 Cancer Council Victoria (SunSmart), Submission No. 30, 30 June 2011, 4.
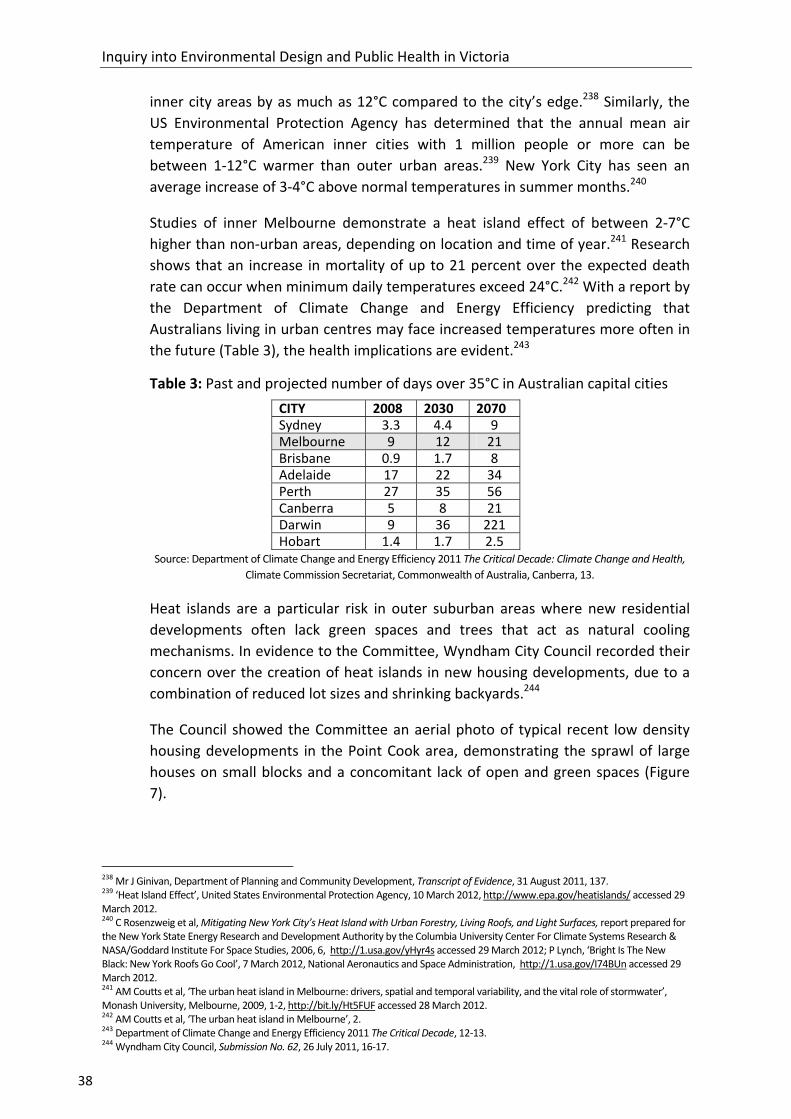
Inquiry into Environmental Design and Public Health in Victoria
38
inner city areas by as much as 12°C compared to the city’s edge.238 Similarly, the
US Environmental Protection Agency has determined that the annual mean air
temperature of American inner cities with 1 million people or more can be
between 1‐12°C warmer than outer urban areas.239 New York City has seen an
average increase of 3‐4°C above normal temperatures in summer months.240
Studies of inner Melbourne demonstrate a heat island effect of between 2‐7°C
higher than non‐urban areas, depending on location and time of year.241 Research
shows that an increase in mortality of up to 21 percent over the expected death
rate can occur when minimum daily temperatures exceed 24°C.242 With a report by
the Department of Climate Change and Energy Efficiency predicting that
Australians living in urban centres may face increased temperatures more often in
the future (Table 3), the health implications are evident.243
Table 3: Past and projected number of days over 35°C in Australian capital cities
CITY 2008 2030 2070 Sydney 3.3 4.4 9 Melbourne 9 12 21 Brisbane 0.9 1.7 8 Adelaide 17 22 34 Perth 27 35 56 Canberra 5 8 21 Darwin 9 36 221 Hobart 1.4 1.7 2.5
Source: Department of Climate Change and Energy Efficiency 2011 The Critical Decade: Climate Change and Health,
Climate Commission Secretariat, Commonwealth of Australia, Canberra, 13.
Heat islands are a particular risk in outer suburban areas where new residential
developments often lack green spaces and trees that act as natural cooling
mechanisms. In evidence to the Committee, Wyndham City Council recorded their
concern over the creation of heat islands in new housing developments, due to a
combination of reduced lot sizes and shrinking backyards.244
The Council showed the Committee an aerial photo of typical recent low density
housing developments in the Point Cook area, demonstrating the sprawl of large
houses on small blocks and a concomitant lack of open and green spaces (Figure
7).
238 Mr J Ginivan, Department of Planning and Community Development, Transcript of Evidence, 31 August 2011, 137. 239 ‘Heat Island Effect’, United States Environmental Protection Agency, 10 March 2012, http://www.epa.gov/heatislands/ accessed 29 March 2012. 240 C Rosenzweig et al, Mitigating New York City’s Heat Island with Urban Forestry, Living Roofs, and Light Surfaces, report prepared for the New York State Energy Research and Development Authority by the Columbia University Center For Climate Systems Research & NASA/Goddard Institute For Space Studies, 2006, 6, http://1.usa.gov/yHyr4s accessed 29 March 2012; P Lynch, ‘Bright Is The New Black: New York Roofs Go Cool’, 7 March 2012, National Aeronautics and Space Administration, http://1.usa.gov/I74BUn accessed 29 March 2012. 241 AM Coutts et al, ‘The urban heat island in Melbourne: drivers, spatial and temporal variability, and the vital role of stormwater’, Monash University, Melbourne, 2009, 1‐2, http://bit.ly/Ht5FUF accessed 28 March 2012. 242 AM Coutts et al, ‘The urban heat island in Melbourne’, 2. 243 Department of Climate Change and Energy Efficiency 2011 The Critical Decade, 12‐13. 244 Wyndham City Council, Submission No. 62, 26 July 2011, 16‐17.

Chapter 3: Contributing factors to chronic disease
39
Figure 7: Aerial view of housing developments in Point Cook, City of Wyndham
Source: Wyndham City Council
A 2011 Victorian Environmental Assessment Council report noted that ‘the urban
heat island effect is likely to increase as urban densification increases in Melbourne
and the climate warms’, increasing the need for adequate green spaces in urban
areas.245
While the potential health impact of poor air quality was outlined in Chapter 2,
there is also a negative synergistic effect between climate change and air pollution.
Greenhouse gas emissions in particular can exacerbate the effects of climate
change. The main causes of this are lack of green spaces and car exhaust. One
study showed that car‐related emissions are responsible for an estimated 80
percent of carbon monoxide, 60 percent of nitrogen oxides, 40 percent of volatile
organic compounds and 30 percent of particulate matter in Melbourne’s air.246 Any
transport modes that reduce car use will slow the impact of climate change,
improve air quality and by extension, reduce chronic disease.247
Car exhaust releases carbon monoxide, carbon dioxide, particulate matter,
nitrogen oxides and hydrocarbons into the atmosphere.248 When exposed to
sunlight and high temperatures, nitrogen oxides and hydrocarbons create surface
ozone, which can contribute to cardiovascular and respiratory illnesses such as
asthma.249 The heatwave experienced in Europe during the summer of 2003, which
the World Health Organization estimates was responsible for 70,000 excess
deaths, was associated with very high ozone levels.250 A 2011 report by the Climate
245 Victorian Environmental Assessment Council 2011, Metropolitan Melbourne Investigation, Final Report, Victorian Government, Melbourne, 26. 246 M Dennekamp and M Carey, ‘Air quality and chronic disease: why action on climate change is also good for health’, NSW Public Health Bulletin, 2010, 21 (5–6): 118. 247 M Dennekamp and M Carey, ‘Air quality and chronic disease’, 115. 248 H Frumkin, ‘Urban Sprawl and Public Health’, Public Health Reports, May‐June 2002, 117: 202. 249 H Frumkin, ‘Urban Sprawl and Public Health’, 202; Doctors for the Environment Australia Inc., Submission No. 51, 11 July 2011, 7; ‘Climate change and health’, World Health Organization, 2010, http://bit.ly/vYagd accessed 4 November 2011. 250 DJ Jacob and DA Winner, ‘Effect of climate change on air quality’, Atmospheric Environment, 2009, 43 (1): 51‐63; see also PA Stott et al, ‘Human contribution to the European heatwave of 2003’, Nature, 2 December 2004, 432: 610‐614; E Black et al, ‘Factors contributing to the summer 2003 European heatwave’, Weather, 2004, 59: 217‐223; ‘Climate change and health’, World Health Organization; D Campbell‐Lendrum and C Corvalan, ‘Climate Change and Developing‐Country Cities’, i111.
Inquiry into Environmental Design and Public Health in Victoria
40
Commission states that levels of both ozone and airborne allergens (such as pollen
which is also increased by high temperatures)251 are likely to rise in the future.252
One study of the European heatwave concluded that ‘Because of climate change,
such heat waves may occur more frequently in the future and may gradually
overshadow the effect of reduced emissions from anthropogenic [human‐
generated] sources’.253 Another similarly determined that ‘the observed
correlation between surface ozone and temperature in polluted regions’ means
that ‘climate change alone will increase summertime surface ozone in polluted
regions by 1–10 ppb [parts‐per‐billion] over the coming decades, with the largest
effects in urban areas and during pollution episodes.’254
Urban planners and developers have an opportunity to play an important role in
mitigating the potential future effects of climate change, such as encouraging
environments that reduce car use and greenhouse gas emissions, installing and
retrofitting energy‐efficient heating and cooling systems in houses, and investing in
more green public spaces to improve air quality and mitigate urban heat islands.
For asthma sufferers, for example, living in an area where there are trees has been
shown to have positive effects by reducing the particulate matter in the air.255
Researchers have argued that a cross‐sectoral approach to health promotion in the
built environment is crucial to mitigating the future effects of climate change on
public health.256
While Victoria has recently experienced a variety of extreme weather events that
impacted on the built environment and public health, such as bushfires, floods and
storms, the Committee did not receive evidence on these particular areas.257
Recommendation 5
That the Victorian Government urgently develops a whole‐of‐government
response to the emerging health problems stemming from poor air quality and the
urban heat island effect in Melbourne. As part of this, the design of residential
communities should prioritise tree planting and green spaces to provide shade,
improve respiratory health and to lower ambient temperatures in summer
months.
251 ‘Climate change and health’, World Health Organization. 252 Department of Climate Change and Energy Efficiency 2011 The Critical Decade, 17‐19. 253 S Solberg et al, ‘European surface ozone in the extreme summer 2003’, Journal of Geophysical Research, 2008, 113 (D7). 254 DJ Jacob and DA Winner, ‘Effect of climate change on air quality’, 51–63. 255 Assoc Prof J Fitzgerald, VicHealth, Transcript of Evidence, 23 August 2011, 84‐85. 256 M Younger et al, ‘The Built Environment, Climate Change, and Health Opportunities for Co‐Benefits’, American Journal of Preventive Medicine, 2008, 35 (5): 517. 257 For further information on such events, see Victorian Floods Review 2011 Review of the 2010–11 Flood Warnings & Response: Final Report, Victorian Government, Melbourne; 2009 Victorian Bushfires Royal Commission 2010 Victorian Bushfires Royal Commission – Final Report Summary, Parliament of Victoria, Melbourne; House of Representatives Standing Committee on Social Policy and Legal Affairs 2012 In the Wake of Disasters: Volume One: The operation of the insurance industry during disaster events, Commonwealth of Australia, Canberra. The Parliament of Victoria’s Environment and Natural Resources Committee is currently undertaking an Inquiry into Flood Mitigation Infrastructure in Victoria, and is due to report in late 2012.

Chapter 4: Urban growth and public health
41
Chapter 4: Urban growth and public health
The United Nations reported in 2007 that for the first time in global history, more
people lived in cities than in rural areas.258 Rapid and increasing urbanisation is
creating ‘mega‐cities’ of over ten million people, with the world’s population
expected to reach nine billion by the mid‐twenty‐first century.
Victoria’s population is growing at a rate of around 1.8 percent annually, with
Melbourne accounting for 79.6 percent of this growth in 2009‐10.259 According to
the Australian Bureau of Statistics, some of the fastest population growth in
Australia is taking place in the outer suburban fringes of Melbourne.260 These areas
are under increasing pressure to provide adequate land, housing and infrastructure
for new residential communities.
Dr Howard Frumkin, a leading US researcher on the built environment and public
health, defines the principal features of urban sprawl as:
... low residential and employment density; separation of distinct land uses such as housing, employment, and retail sales; low connectivity among destinations; weak and dispersed activity centers and downtowns; and heavy reliance on automobiles with few available transportation alternatives.261
Frumkin and others have contributed to an emerging body of literature that links
low density suburban development with poor public health, particularly chronic
disease and obesity.262
This chapter discusses several issues relating to urban development in Victoria,
including the role of housing density in promoting healthier communities; the
challenges of service delivery in rapidly growing outer suburban communities; how
environmental design can reinforce sedentary lifestyles through car dependence
and long commuting times; and the specific health challenges of urban renewal
developments.
4.1 Urban population growth
Melbourne will have a predicted population of five million residents in less than
two decades.263 Figure 8 shows the areas of Victoria experiencing the fastest
population growth, with many in the outer suburban areas of Melbourne. The City
258 AG Capon, ‘The way we live in our cities’, Medical Journal of Australia, 2007, 187: 658. 259 ‘Regional Population Growth, Australia, 2009‐10’, Australian Bureau of Statistics, 2012, http://bit.ly/HAs6IG accessed 20 February 2012. 260 ‘Regional Population Growth, Australia, 2009‐10’, Australian Bureau of Statistics, 2012. 261 H Frumkin, ‘Healthy Places: Exploring the Evidence’, American Journal of Public Health, September 2003, 93 (9): 1454. 262 Heart Foundation (Victoria), Submission No. 55, July 2011, 15; Environment Defenders Office (Victoria) Ltd, Submission No. 10, 29 June 2011, 9‐10; Dr M Beavis, Submission No. 11, 27 June 2011, 2‐3; UWA Centre for the Built Environment and Health, Submission No. 27, 29 June 2011, 1‐2; City of Casey, Submission No. 42, 6 July 2011, 4; Doctors for the Environment Australia Inc., Submission No. 51, 11 July 2011, 5‐6; Prof B Giles‐Corti Transcript of Evidence, 4 August 2011, 12; Ms K Jolly, Heart Foundation (Victoria), Transcript of Evidence, 4 August 2011, 59; Dr M Carey, Doctors for the Environment Australia Inc., Transcript of Evidence, 23 August 2011, 111; Prof E de Leeuw, Transcript of Evidence, 7 September 2011, 225; Assoc Prof C Whitzman, Transcript of Evidence, 7 September 2011, 266. 263 Department of Planning and Community Development 2008 Melbourne 2030: A planning update: Melbourne @ 5 million, Victorian Government, Melbourne, 2.

Inquiry into Environmental Design and Public Health in Victoria
42
of Casey, for example, is expecting its population to double by 2036.264 Every week
Wyndham City Council receives 60 birth notifications, 120 requests for a garbage
service (from new households), and issues 100 building permits.265
Figure 8: Population change in Victoria, 2009‐10
Source: ‘Regional Population Growth, Australia, 2009‐10’, Australian Bureau of Statistics, 2012,
http://bit.ly/HAs6IG accessed 20 February 2012.
The City of Whittlesea is the fourth fastest growing municipality in Australia and
second fastest in Victoria after Wyndham, growing between 10,000 and 15,000
people a year.266 As the City expressed in its submission, ‘The rapidity of growth
and change in the municipality’s established and growth areas means that there is
a critical phase for infrastructure delivery over the next fifteen years, one that will
directly impact upon the health and wellbeing of our communities.’267
Many Victorian regional cities are also predicting significant population growth in
the coming decades.268 Warrnambool’s population, for example, grew by 7,578
people between 1989 and 2009.269 Geelong expects a 1.8 percent population
growth per year to 2026, an estimated increase of 65,010 people from 2010.270
264 City of Casey, Submission No. 42, 6 July 2011, 7. 265 Wyndham City Council, Submission No. 62, 26 July 2011, 4. 266 ‘Regional Population Growth, Australia, 2009‐10’, Australian Bureau of Statistics, 2012; City of Whittlesea, Submission No. 26, 30 June 2011, 6. 267 City of Whittlesea, Submission No. 26, 30 June 2011, 15. 268 ‘Regional Population Growth, Australia, 2009‐10’, Australian Bureau of Statistics, 2012. 269 Warrnambool City Council, Submission No. 13, 30 June 2011, 1. 270 ‘City statistics’, City of Greater Geelong, 2011, http://bit.ly/HIOBfC accessed 20 February 2011.

Chapter 4: Urban growth and public health
43
4.2 Service delivery
The Committee heard that Victoria’s population growth has put significant
pressure on the provision of accommodation, health and community services,
active transport, childcare, schools and other necessary infrastructure. The
Victorian Council of Social Service noted in their submission that housing in outer
suburban regions ‘often is concentrated in areas already struggling with fewer
amenities and employment opportunities, and less public transport provision and
other services.’271
In a public hearing, Mr Griff Davis, General Manager – Advocacy and
Communications at the City of Whittlesea, further elaborated on the challenges of
delivering services in their fast‐growing community:
Some of the social trends that are coming out of our new growth areas are very similar to the trends that we have in some of our existing areas. Things like low retention rates at school, family violence, high gambling, all of that sort of stuff is emerging in those newer areas where effectively you have double income families trying to accommodate those mortgages. So just because they have two incomes as a family and they are moving into the outer suburban areas does not mean they are able to cope any more than those who are on welfare or other low income type support …
The other growth area is over in the western part of our municipality, which is Epping North, and the major development there is the VicUrban Aurora development. That area is a bit slower and is likely to be completely filled with residents in about ten years. We are looking at around 65,000 people in that area as well. Then we have the growth area on top of that where we are expecting another 90,000 people at some point in time, and when we get to around 2030, based on what we know at the moment, those areas will be completed as well, so we will end up with that 300,000 odd population in our municipality. What that means in terms of the community, though, is that without the commensurate increase in service provision and infrastructure provision those people are going to suffer gaps in the ability to access things. Even the basic access requirements for retail shopping, medical services and so forth are going to be very difficult for those people when they are struggling with all of the economic issues of their households, trying to run one or two cars, trying to use roads that effectively are rural roads, not built for the sorts of demands that we are experiencing and, as a consequence, we will find that they will become isolated in terms of what they can do. Instead of being connected and healthy and those sorts of things, they are going to go the other way.272
Geographical isolation and poor public transport provision limit employment
options for many people living in outer suburban and regional areas. The City of
Casey observed that their public transport infrastructure is lagging behind demand,
with residents experiencing long work commutes by car, doing less physical
activity, feeling more socially isolated, and perceiving long distances between their
homes and community and recreational facilities:
271 Victorian Council of Social Service, Submission No. 49, 8 July 2011, 8. 272 Mr G Davis, City of Whittlesea, Transcript of Evidence, 6 September 2011, 212.

Inquiry into Environmental Design and Public Health in Victoria
44
… if a resident wants to travel to a destination outside their precinct they will more than likely need to drive. Firstly, fixed rail services are either not connected to new PSP [Precinct Structure Plan] areas, or in one case are delivered so long after development is complete that initial residents and their families will likely have to wait the best part of a generation to see such services.273
For parents who stay at home to raise children in outer suburban areas and who
may not have access to a car or nearby public transport, the potential social
isolation can have significant impacts on their physical and mental wellbeing.274 As
Ms Rose Durey, Policy and Health Promotion Manager at Women’s Health Victoria,
told the Committee, this can also exacerbate gender divisions of labour:
The separation of residential areas from centres of work, such as the CBD [Central Business District], perpetuates gender stereotypes, with many highly educated and skilled women forced to work in lower skilled jobs closer to home in order to be available to their children. At the same time, men are forced to trade time with their children and families for long commutes and long working hours.275
4.3 Housing density and mixed land use
While there are several definitions of density in urban planning,276 for the purposes
of this report, residential density refers to ‘the number of dwellings per hectare on
land devoted solely to residential development.’277 Many contributors to the
Inquiry observed that housing density is increasingly relevant to whether residents
in a community live in an environment that encourages health and wellbeing.278
Literature reviews confirm this observation, while also suggesting that density
alone does not influence physical activity – rather, density seems to work in
combination with a variety of other factors, such as mixed land use developments
and particular design elements of the built form.279
In Melbourne, the high density residential patterns of the nineteenth century inner
city created an urban environment that was walkable and connected by public
transport. However from the mid‐twentieth century in Australia, the trend has
273 City of Casey, Submission No. 42, 6 July 2011, 10‐11. 274 City of Casey, Submission No. 42, 6 July 2011, 3; Dr M Beavis, Transcript of Evidence, 4 August 2011, 52‐53; Women's Health Victoria, Submission No. 4, 27 June 2011, 2. 275 Ms R Durey, Women’s Health Victoria, Transcript of Evidence, 7 September 2011, 249. 276 A Forsyth, Measuring Density: Working Definitions for Residential Density and Building Intensity, Design Center for American Urban Landscape, College of Architecture and Landscape Architecture, University of Minnesota, 2‐5. 277 Understanding Residential Densities: A Pictorial Handbook of Adelaide Examples, Government of South Australia, 2006, 5, http://bit.ly/wGOyo2 accessed 20 January 2011. 278 UWA Centre for the Built Environment and Health, Submission No. 27, 29 June 2011, 1‐3; Doctors for the Environment Australia Inc., Submission No. 51, 11 July 2011, 5‐7; Environment Defenders Office (Victoria) Ltd, Submission No. 10, 29 June 2011, 8‐9; Dr M Beavis, Submission No. 11, 27 June 2011, 2‐3; Australian Institute of Landscape Architects, Submission No. 12, 27 June 2011, 7; SJB Urban, Submission No. 20, 30 June 2011, 3; Parks Victoria, Submission No. 29, June 2011, 6, 12; City of Boroondara, Submission No. 31, 27 June 2011, 8‐9, 16; City of Casey, Submission No. 42, 6 July 2011, 8, 14‐15; Yarra City Council, Submission No. 45, June 2011, 6; Victorian Council of Social Service, Submission No. 49, 8 July 2011, 4; C McNaughton, Submission No. 53, 11 July 2011, 2; Heart Foundation (Victoria), Submission No. 55, July 2011, 16, 25; Victorian Local Governance Association, Submission No. 56, 13 July 2011, 36; Planning Institute Australia (Victorian Division), Cancer Council Victoria (SunSmart), City of Port Phillip, Physical Activity Australia, Victorian Council of Social Service and Victorian Local Governance Association, Submission No. 59, 13 July 2011, 12, 20‐21; Municipal Association of Victoria, Submission No. 61, July 2011, 13‐14; Wyndham City Council, Submission No. 62, 26 July 2011, 18; Environment Defenders Office (Victoria) Ltd, Submission No. 10, 29 June 2011, 9; City of Melbourne, Submission No. 44, 7 July 2011, 5‐6; City of Ballarat Submission No. 19, 30 June 2011, 2, 5. 279 J Kent et al, Healthy Built Environments: A review of the literature, Healthy Built Environments Program, University of New South Wales, Sydney, 2011, 50‐51.
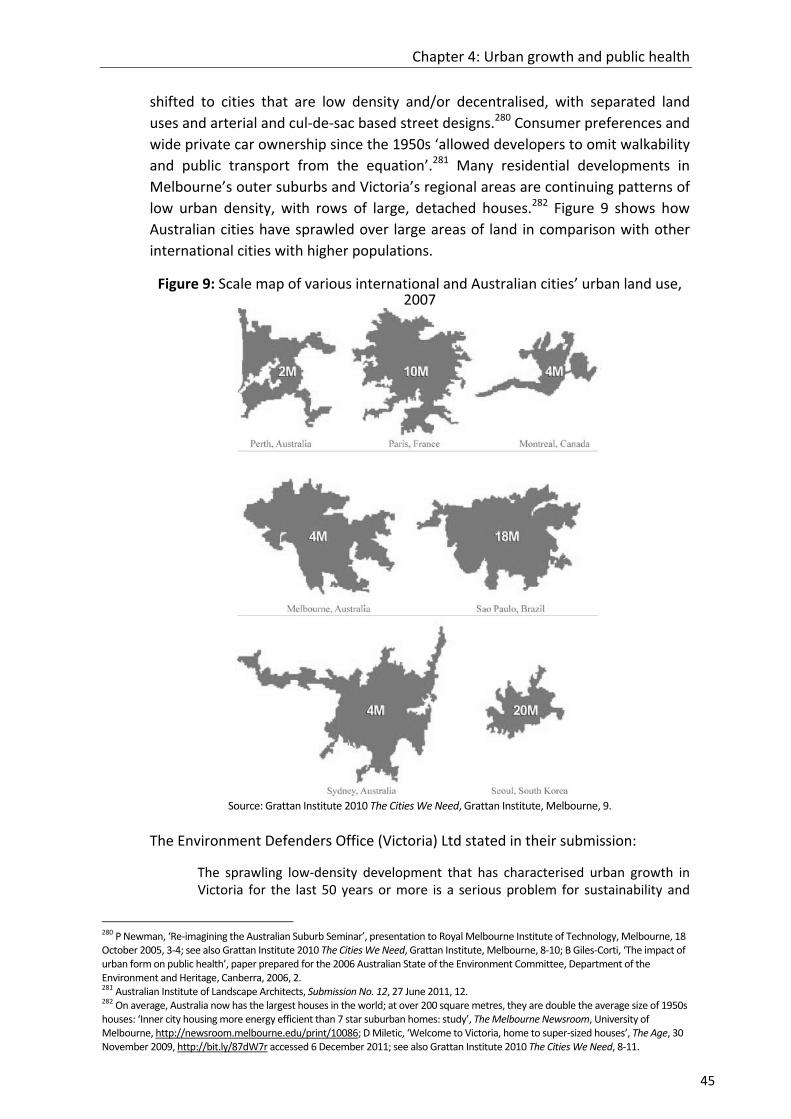
Chapter 4: Urban growth and public health
45
shifted to cities that are low density and/or decentralised, with separated land
uses and arterial and cul‐de‐sac based street designs.280 Consumer preferences and
wide private car ownership since the 1950s ‘allowed developers to omit walkability
and public transport from the equation’.281 Many residential developments in
Melbourne’s outer suburbs and Victoria’s regional areas are continuing patterns of
low urban density, with rows of large, detached houses.282 Figure 9 shows how
Australian cities have sprawled over large areas of land in comparison with other
international cities with higher populations.
Figure 9: Scale map of various international and Australian cities’ urban land use, 2007
Source: Grattan Institute 2010 The Cities We Need, Grattan Institute, Melbourne, 9.
The Environment Defenders Office (Victoria) Ltd stated in their submission:
The sprawling low‐density development that has characterised urban growth in Victoria for the last 50 years or more is a serious problem for sustainability and
280 P Newman, ‘Re‐imagining the Australian Suburb Seminar’, presentation to Royal Melbourne Institute of Technology, Melbourne, 18 October 2005, 3‐4; see also Grattan Institute 2010 The Cities We Need, Grattan Institute, Melbourne, 8‐10; B Giles‐Corti, ‘The impact of urban form on public health’, paper prepared for the 2006 Australian State of the Environment Committee, Department of the Environment and Heritage, Canberra, 2006, 2. 281 Australian Institute of Landscape Architects, Submission No. 12, 27 June 2011, 12. 282 On average, Australia now has the largest houses in the world; at over 200 square metres, they are double the average size of 1950s houses: ‘Inner city housing more energy efficient than 7 star suburban homes: study’, The Melbourne Newsroom, University of Melbourne, http://newsroom.melbourne.edu/print/10086; D Miletic, ‘Welcome to Victoria, home to super‐sized houses’, The Age, 30 November 2009, http://bit.ly/87dW7r accessed 6 December 2011; see also Grattan Institute 2010 The Cities We Need, 8‐11.

Inquiry into Environmental Design and Public Health in Victoria
46
public health. It perpetuates our dependency on private motor vehicle transport, extending the time and distance that Victorians must spend in cars. It also reduces the green wedges and open spaces on the urban fringe, which are important for their biodiversity values and the contribution they can make to public health.283
Discussions of residential density can elicit strong emotions from both the planning
and wider communities. Increasing density ‘is feared by those who imagine ugly
buildings, overshadowed open space, parking problems, and irresponsible
residents’, while those who support it emphasise ‘urbane streetscapes, efficient
infrastructure supply, walkable neighborhoods, and increased housing options.’284
The Committee was informed by the Department of Planning and Community
Development (DPCD) that ‘The density that we aspire to in the growth areas now is
about 15 lots per hectare.’285 However several of the Inquiry’s submissions and
witnesses advocated for housing densities of between 25 and 30 dwellings per
hectare ‘to develop sustainable, walkable neighbourhoods’.286 Urban design
company SJB Urban argued in their submission:
… it is much less expensive, and more efficient, to provide infrastructure for compact, diverse urban areas, than dispersed, low‐density areas. More compact development also results in more efficient usage of infrastructure, including utilities, streets, community spaces, parks and so on.287
Similarly, Professor Billie Giles‐Corti stated to the Committee:
… research shows that we need at least 35 houses per hectare to be able to achieve good mixed‐use development that is supported by public transport. We need more of this sort of housing — that is, the sort of thing you get in inner‐city Melbourne, and much less of this (lower density housing). We talk about affordable housing on the fringe, but the problem with that is that you cannot get enough public transport out there because the densities are low. I notice, looking at the new growth area, that we are trying to get about 15 houses per hectare out there; it will not be enough to support good public transport, which means that people will still be having to drive, while fuel prices are increasing. The estimates by CSIRO are that they could go up to $8 a litre. That is going to put enormous pressure on people living on the fringe in terms of affordable living, not just affordable housing.288
Dr Margaret Beavis observed:
I believe that building sprawling, largely single use, poorly serviced suburbs is indefensible from a public health perspective. We need developments with density of around 26 dwellings per hectare, with mixed use and good provision for active transport – walking, cycling and public transport. Building car dependent suburbs in the name of cheap housing is very false economy – and will create massive liabilities both in health and economic terms for decades to come.289
283 Environment Defenders Office (Victoria) Ltd, Submission No. 10, 29 June 2011, 9. 284 A Forsyth, Measuring Density: Working Definitions, 2. 285 Mr D Hodge, Department of Planning and Community Development, Transcript of Evidence, 31 August 2011, 135. 286 Dr M Beavis, Submission No. 11, 27 June 2011, 2; Warrnambool City Council, Submission No. 13, 30 June 2011, 2. 287 SJB Urban, Submission No. 20, 30 June 2011, 3. 288 Prof B Giles‐Corti, Transcript of Evidence, 4 August 2011, 13. 289 Dr M Beavis, Submission No. 11, 27 June 2011, 3.

Chapter 4: Urban growth and public health
47
As points of comparison, the Metropolitan Plan for Sydney 2036 released in 2010
recommended higher general housing densities in urban areas, but at a density of
25 to 60 dwellings per hectare, over 60 dwellings around larger centres and less
than 25 dwellings only in heritage or physically constrained areas.290 The South
East Queensland Regional Plan 2009‐2031 aims to achieve a minimum net dwelling
yield of 15 dwellings per hectare for new residential development in ‘development
areas’, and densities in principal regional activity centres (outside the Brisbane
CBD) of around 40‐120 dwellings per hectare (net) or greater.291
The low density of housing in many outer Melbourne suburbs is often blamed for
making public transport not viable in these areas. However some commentators
argue that the quality of public transport services is more critical than density in
determining demand, and that strategic planning of public transport networks can
establish it as a competitive alternative to private cars.292 Others suggest that it is
the density and walkability of a precinct immediately around a transport point
(such as a railway station) that makes the most difference to the viability of public
transport, rather than the overall density of a suburb or area.293
The Heart Foundation lists other positive health and environmental benefits to
higher density development in urban areas:
increasing the use of active modes of transport and public transport
improving air quality and reducing traffic congestion
providing more affordable housing closer to amenity
reducing the ecological footprint of cities by decreasing the amount of space required for each person.294
The Committee received evidence that when developed well, higher density can
attract buyers in outer suburban locations.295 Higher density can lead to the
development of local shopping areas, both encouraging a local economy and
providing opportunities for physical activity and social interaction when residents
walk or cycle there.296 The City of Stonnington noted the importance of local retail
areas that ‘function as a true social, economic and physical neighbourhood
centres.’297
290 NSW Department of Planning 2010 Metropolitan Plan for Sydney 2036, NSW Government, Sydney, 106‐107. 291 Department of Infrastructure and Planning 2009 South East Queensland Regional Plan 2009‐2031, Queensland Government, Brisbane, 97. 292 J Dodson et al, ‘The Principles of Public Transport Network Planning: A review of the emerging literature with select examples’, Urban Research Program, Issues Paper 15, Griffith University, Queensland, March 2011, 3; see also Cr G Goodfellow, Wyndham City Council, Transcript of Evidence, 23 August 2011, 123. The Outer Suburban/Interface Services Development Committee is currently undertaking an inquiry on Growing the Suburbs: Infrastructure and Business Development in Outer Suburban Melbourne, and is due to report in late 2012. 293 J Walker, ‘The perils of average density’, Human Transit, 26 September 2010, http://bit.ly/d2Mtaw accessed 6 December 2011. 294 ‘Density and health’, Heart Foundation, http://bit.ly/IEHDoO accessed 6 December 2011. 295 S McPherson, SJB Urban, Transcript of Evidence, 6 September 2011, 153; Prof M Buxton, Transcript of Evidence, 4 October 2011, 307‐308. 296 Municipal Association of Victoria, Submission No. 61, July 2011, 14. 297 City of Stonnington, Submission No. 40, 14 July 2011, 8.

Inquiry into Environmental Design and Public Health in Victoria
48
Professor Michael Buxton explained to the Committee that higher residential
density does not always mean high rise buildings.298 He cited the example of a
recent inner city development in East Perth:
It is not high rise. As Jan Gehl and others say, high rise is the lazy way to get density; that is a much more interesting way to get density. There are 35 lots per hectare, and it is very, very liveable. I guess what I am saying here is that when we look at wellbeing we really have to look at amenity, and I do not think this argument has been developed properly in the literature. Amenity is critical to wellbeing. If we build high rise and the undifferentiated, terrible consolidation models that we are building now without any rhyme or reason or rules or sense to it and on the other hand only build the opposite on the fringe, we are building very poor amenity places.299
Research suggests that residential areas offering a range of accommodation
options – from detached homes to medium‐high apartment complexes and aged
care facilities – help create a diverse mix of people, ages, professions and
consumer behaviours that drive growth and promote positive public health
outcomes.300 This is particularly relevant for Australia’s ageing population as a
diversity of accommodation options allows ‘ageing in place’, where older people
can remain in their neighbourhoods as their needs change.301
Studies show that residents are more likely to walk or cycle for transport when
living in areas of high density, mixed land use, street connectivity and access to a
range of nearby destinations.302 Such destinations might include food stores,
schools, pharmacies, medical centres, childcare facilities, parks, senior citizens
centres and cafés, providing:
… local focal points for people to walk or cycle to within their neighbourhood. Local destinations support mixed use, walkable neighbourhoods and reduce dependence on the car for local short journeys. These destinations also naturally attract a range of people of all ages into the community.303
Psychological health is as important as physical, and studies suggest that higher
density communities are more likely to experience better mental health outcomes:
‘Integrated, mixed and vibrant urban areas provide plentiful opportunity for
informal, interpersonal engagement in the public environment, which is vital for
mental health, and combats social isolation.’304 beyondblue states that health and
wellbeing relates as much to community cohesion as it does to provision of
necessary medical services.305
298 Prof M Buxton, Transcript of Evidence, 4 October 2011, 309. 299 Prof M Buxton, Transcript of Evidence, 4 October 2011, 309. 300 City of Stonnington, Submission No. 40, 14 July 2011, 8; S McPherson, SJB Urban Transcript of Evidence, 6 September 2011, 153. 301 Productivity Commission 2011 Caring for Older Australians, Commonwealth of Australia, Canberra, xvi; Municipal Association of Victoria, Submission No. 61, July 2011, 25. 302 UWA Centre for the Built Environment and Health, Submission No. 27, 29 June 2011, 1; ‘Built Environment’, Heart Foundation, http://bit.ly/z010YL accessed 6 December 2011. 303 Heart Foundation (Victoria), Submission No. 55, July 2011, 16. 304 SJB Urban, Submission No. 20, 30 June 2011, 2. 305 M Townsend and M Ebden, Feel Blue, Touch Green, People and Parks Foundation and Deakin University, Melbourne, 2006, 5.
Chapter 4: Urban growth and public health
49
A range of studies including a 2012 Heart Foundation report point out that the
impact of high density housing on mental health often relates to environmental
stressors provided by the housing’s location, design, and construction. These
include: high noise levels; poor indoor air quality and light; area crime levels;
governance and maintenance of facilities; lack of privacy; enforced or insufficient
social interactions; the floor level upon which people live; and the quality of, and
access to, neighbourhood resources and amenities such as green and other public
open spaces.306
Low quality public housing has been linked with poorer physical and mental health
outcomes for its residents than those in non‐public housing.307 However it is
difficult to prove similar definitive correlations between public housing density and
poor health, as there are several other socio‐economic, cultural and environmental
variables to consider.308
The Committee notes that while housing density appears to be important, there
are many other variables in developing healthy communities. The University of
Western Australia’s Centre for the Built Environment and Health’s submission
states:
In short, there appears to be a threshold: insufficient density is detrimental to health; however, too much density and insufficient attention to building design, the residents, governance and maintenance, its location and the amenity of the local neighbourhood (including public transport, access to public open space, and access to shops and services and recreational opportunities), may also be detrimental to health.309
The Committee heard evidence that as land becomes more valuable, designing for
mixed land use is the best utilisation of public spaces in local neighbourhoods.
Mixed use activity centres provide ‘co‐location of jobs, people and facilities’,310 but
also require a ‘critical mass’ of people within close proximity to patronise them.311
Higher numbers of people using public spaces also increases the feeling of safety in
a community, as well as encouraging feelings of community ownership.312
Recommendation 6
That the Victorian Government, in partnership with universities and relevant
community groups, commissions ongoing research to further develop the evidence
306 A Waters, ‘Do housing conditions impact on health inequalities between Australia’s rich and poor?’ Australian Housing and Urban Research Institute, ANU Research Centre, Canberra, 2001, 16; ‘Affordable Housing & Homelessness’, McAuley Community Services for Women, Melbourne, 2010, 6, http://bit.ly/Hyvt0H accessed 26 March 2011; B Giles‐Corti et al, Increasing density in Australia: maximising the health benefits and minimising harm, National Heart Foundation of Australia, 2012, 7‐16, 53‐55. 307 B Giles‐Corti et al, Increasing density in Australia, 49. 308 A Waters, ‘Do housing conditions impact on health inequalities?’ 2‐3; ‘Health and socioeconomic disadvantage’, Australian Bureau of Statistics, 2010, 1‐5; Guidelines for health housing, World Health Organization, Copenhagen, 1988, 5, http://bit.ly/HMDyhJ accessed 26 March 2012. 309 UWA Centre for the Built Environment and Health, Submission No. 27, 29 June 2011, 2. 310 Department of Infrastructure and Transport 2011 Our Cities, Our Future: A national urban policy for a productive, sustainable and liveable future, Commonwealth of Australia, Canberra, 63; see also Australian Institute of Landscape Architects, Submission No. 12, 27 June 2011, 5. 311 SJB Urban, Submission No. 20, 30 June 2011, 2. 312 SJB Urban, Submission No. 20, 30 June 2011, 2‐3.

Inquiry into Environmental Design and Public Health in Victoria
50
base for the impact of the built environment and urban design on public health
and wellbeing.
Recommendation 7
That the Victorian Government amends the Victoria Planning Provisions to
encourage greater housing density and minimum requirements of open space,
while maintaining choice in the market.
4.4 ‘Affordable housing’ and car dependency
New outer urban housing developments are often marketed in terms of their
‘affordability’. The Committee heard evidence, however, that the affordability
calculation often does not include costs associated with transport or the difficulties
in accessing the necessary amenities to support good community health.
Professor Giles‐Corti described such a scenario to the Committee, where people
‘move into a house where there is nothing and suddenly realise that to live there is
actually quite expensive because they do need to get the extra car and they do have to
drive their children everywhere. In terms of the cost of living it is actually quite
high.’313
Similarly, Professor Anthony Capon of the Australian National University’s National
Centre for Epidemiology and Population Health, stated at a public hearing:
… at the moment we are principally focusing on the cost of getting the housing ready for market. We are not thinking about the long‐term cost of living in that house and the transport task and all of the additional costs that are imposed on the people who will live in those places long‐term.314
Urban expansion can place ‘the economies of the city in one place and the
residential areas in another’.315 An estimated 93 percent of the more than 300,000
people who work in the City of Melbourne come from other municipalities, with
the CBD responsible for employing 57 percent of the working population.316
In growing areas like the City of Wyndham, the majority of its residents must still
travel outside the area for employment. According to a submission from the
Council, inadequate public transport means that residents predominantly use cars
to travel, worsening traffic congestion, air pollution and time poverty. 317
Long work commutes can impact on the free time individuals have for health‐
promoting activities such as regular exercise, outdoor recreation, and accessing
and cooking healthy food.318 One study of people who bought property further
from metropolitan areas and their employment noted that ‘Men and women, with
313 Prof B Giles‐Corti, Transcript of Evidence, 4 August 2011, 19; see also Outer Suburban Interface Services & Development Committee, Inquiry into liveability options in outer suburban Melbourne, corrected transcripts, Parliament of Victoria, Melbourne, 2011, 189. 314 Prof A Capon, ANU National Centre for Epidemiology and Population Health, Transcript of Evidence, 4 August 2011, 33. 315 Prof A Capon, ANU National Centre for Epidemiology and Population Health, Transcript of Evidence, 4 August 2011, 34. 316 ‘2006 City of Melbourne Workers Census Demographic Profile’, City of Melbourne, 2008, 3‐5, http://bit.ly/AmAIZE accessed 5 January 2012. 317 Wyndham City Council, Submission No. 62, 26 July 2011, 10. 318 Assoc Prof J Fitzgerald, VicHealth, Transcript of Evidence, 81‐82.

Chapter 4: Urban growth and public health
51
and without children were looking for ways to “manage” work; many were
struggling to reconcile their suburban dream with their exhausted reality.’319
The typically low density housing developments in outer suburban areas tend to go
hand in hand with high car dependency for their residents. In some outer
Melbourne areas with little or no public transport provision, residents are in a
situation of ‘forced car ownership’, having to travel long distances to work and
community activity centres.320 The cost of owning and running cars often mitigates
the perceived savings of living further from inner city areas. The RACV has
estimated that a Holden Commodore, one of the most popular cars in Victoria,
costs about $12,000 a year to run.321 As Dr Beavis observed, ‘If you put that on
your mortgage, it means that those houses are no longer affordable.’322
In Victoria’s rural regions too, there is often forced car ownership. Cars are owned
at lower‐income levels, yet due to the lack of other transport options are seen as
vital.323 In one study for example, for low income households with a net income of
less than $500 per week, running two cars can represent as much as 50 percent of
earned income. Figure 10 shows the percentage of low income dwellings with two
or more cars, demonstrating that the further the area from the city, the more
reliance on cars for transport.
Figure 10: Percentage of low income dwellings with two or more cars in Melbourne
Source: G Currie and Z Senbergs, ‘Exploring forced car ownership in metropolitan Melbourne’, Australasian Transport
Research Forum, 2007, 7.
319 P Williams et al, Linked up Lives: Putting Together Work, Home and Community in Ten Australian Suburbs, Overview Report, Centre for Work and Life, University of South Australia, Adelaide, 2009, 13. 320 G Currie and Z Senbergs, ‘Exploring forced car ownership in metropolitan Melbourne’, Australasian Transport Research Forum, 2007, 1. 321 D Wood, ‘Pay as you go’, Royalauto, RACV, July 2010, 60‐66. 322 Dr M Beavis, Transcript of Evidence, 4 August 2011, 54. 323 G Currie and Z Senbergs, ‘Exploring forced car ownership’, 4.
Inquiry into Environmental Design and Public Health in Victoria
52
Car dependency can contribute to the creation of obesogenic environments.324
Several studies suggest that people living in areas of urban expansion and high car
dependency are likely to be overweight or obese.325 One US study showed that
each daily hour spent in a car was associated with a six percent increase in the
likelihood of obesity, while each additional kilometre walked per day was
associated with an almost five percent decrease.326 Increased car use means less
time for physical activity or the incidental exercise people receive when using
public transport. Long commutes lead many parents to combine trips and drive
their children to school on the way to and from their work,327 also decreasing
children’s opportunities for daily exercise through walking or cycling to school.
However, car dependency is not always necessarily linked to long distances caused
by urban expansion. Of all trips taken by Victorians across all transport modes, 55
percent are less than five kilometres and 74 percent are less than ten
kilometres.328 Walking or cycling could replace many such short trips taken by car
and provide much‐needed physical activity. However, encouraging people to leave
the car at home and walk or cycle is dependent on providing the necessary walking
and cycling paths and networks. Chapter 7 discusses this in more detail.
4.5 Urban renewal
There are currently several large urban renewal projects planned for inner
Melbourne on brownfield sites (areas of former industrial and commercial
facilities), including Fishermans Bend and E‐Gate. There are also ongoing
developments (such as Docklands) and smaller renewal projects such as the
Bradmill site in the City of Maribyrnong (see case study in Chapter 8).
Victorian governments have invested in several urban renewal and regeneration
projects in recent years. The Neighbourhood Renewal initiative, for example,
aimed to redress social disadvantage in areas of public housing around Melbourne
and regional Victoria. The program included building and improving
accommodation and community infrastructure, and incorporated several health
and wellbeing objectives.329
Soil and groundwater contamination, air and noise pollution, dust and odour are
some of the potential health challenges that come with residential development
on brownfield sites. Adverse health outcomes and conflicts arising from
324 Doctors for the Environment Australia Inc., Submission No. 51, 11 July 2011, 6; R Trubka et al, ‘Gen 85: The cost of urban sprawl – physical activity links to health care costs and productivity’, Environmental Design Guide, April 2010, 2. 325 Planning Institute of Australia 2009 Healthy Spaces and Places: A national guide to designing places for healthy living – An overview, PIA, Australian Local Government Association and the National Heart Foundation of Australia, 1; Planning Institute of Australia 2011 Healthy Spaces and Places, Design Principle – Connectivity and Permeability, PIA, Canberra, 4; see also H Frumkin, ‘Urban Sprawl and Public Health’, 205. 326 LD Frank et al, ‘Obesity relationships with community design, physical activity, and time spent in cars’, American Journal of Preventive Medicine, 2004, 27: 87‐96; H Frumkin, ‘Urban Sprawl and Public Health’, 205. 327 Mr M Hopkins, Department of Transport, Transcript of Evidence, 6 September 2011, 199. 328 Mr M Hopkins, Department of Transport, Transcript of Evidence, 6 September 2011, 198. 329 ‘About Neighbourhood Renewal’, State Government of Victoria, 2010, http://bit.ly/IZdKQn accessed 5 January 2012.

Chapter 4: Urban growth and public health
53
incompatible land uses can often be foreseen and mitigated by ensuring that
environmental issues are fully investigated early in the planning process.
The Committee heard there is considerable scope for Victoria to improve in this
regard. A 2011 Victorian Auditor‐General’s Report estimated that there are around
10,000 contaminated sites in Victoria, any of which ‘may pose imminent or long‐
term risks to human health and the environment.’330 It concluded that a
fragmented, ambiguous planning system and ad hoc applications of a ‘complex
regulatory framework that has evolved to deal with contaminated sites has
significant gaps, and key elements lack clarity. In many cases, this has led to a lack
of accountability and responsibility, and subsequent inaction.’331 The report noted
that the majority of contaminated site issues are dealt with by local councils, who
lack the technical expertise to adequately assess both short‐ and long‐term health
risks, and lack funding to undertake recommended land contamination
assessments and audits.332
One of the report’s case studies illustrated the serious potential health risks of
building residential developments on contaminated land:
Site A is a residential area within the City of Maribyrnong. It includes 22 properties that are known to be built on contaminated land. Maribyrnong City Council first identified the contamination in 1994, but did not report it to the EPA until 1998. Furthermore, 12 of these properties pose a potential health risk to children as contaminant levels exceeded recommended criteria, and a further four pose an actual risk due to children residing at these properties. The remaining six properties are potentially contaminated, with potential health risks.333
The Environment Defenders Office (Victoria) Ltd concurred that the legal and
planning framework for dealing with contaminated land needs significant reform:
This will be crucial if the Government’s policy of urban renewal in places like Fishermans Bend and E‐Gate is to remain safe and successful. At present, the laws that regulate development on potentially contaminated land are complex and fragmented, making it difficult for councils to know with confidence that they are not permitting development on contaminated land. The standards of assessment and remediation that previous industrial land must meet before they can be approved for development must be significantly strengthened, such that councils cannot fail to heed them.334
The Committee also received evidence from Environment Protection Authority
Victoria (EPA (Vic)), advocating for its involvement in a wider range of planning
issues. While EPA (Vic) is a mandatory referral authority for some developments, it
noted that significant health gains could come from involving it in up‐front
strategic planning and design:
330 Victorian Auditor‐General 2011 Managing Contaminated Sites, VAGO, Melbourne, vii. The Victorian Auditor‐General defines contaminated sites as areas of land and groundwater ‘where chemical and metal concentrations exceed those specified in policies and regulations’ (1). 331 Victorian Auditor‐General 2011 Managing Contaminated Sites, vii‐viii. 332 Victorian Auditor‐General 2011 Managing Contaminated Sites, xi‐xii. 333 Victorian Auditor‐General 2011 Managing Contaminated Sites, 21. 334 Environment Defenders Office (Victoria) Ltd, Submission No. 10, 29 June 2011, 11.
Inquiry into Environmental Design and Public Health in Victoria
54
In terms of the kinds of input that we really think is most valuable, it is both at the strategic planning stage and at the specific proposal stage, because it is often in the broad layout of land uses and compatibility of adjoining land uses and thinking through those issues where some gains can be made in terms of avoiding land uses which by their nature are going to always be somewhat difficult where you have a significant industry separated from residents simply by a road, and in some cases that is always going to be difficult and there are opportunities to deal with that at the strategic planning stage and also when we are considering specific development proposals. At this stage there is a portion of those for which EPA is mandated, or the planning system is mandated to refer to EPA for advice, but it is only a small portion of the development proposals, and there is the opportunity for us to look at what is the range of proposals that should come to EPA for advice to assist in making more informed planning decisions.335
The Committee notes that there are specific potential health issues with
brownfield land that must be taken in to consideration when scoping for future
development and that EPA (Vic) should be consulted early in the planning process.
Recommendation 8
As part of its response to the Victorian Auditor‐General’s reports in relation to
contaminated sites, the Victorian Government, together with local government:
undertakes a systematic and coordinated review of its contaminated land sites audit and considers its implications for health and wellbeing
reviews the current legislative framework for developing contaminated land with a view to making it clearer and more consistent.
Recommendation 9
That Environment Protection Authority Victoria plays an increased strategic role at
an early stage in major land use planning decisions.
4.6 Design for older people and the disabled
Several groups gave evidence to the Committee of the importance of considering
the particular needs of older people and the disabled in urban planning and design
– both in the community and at home.336 Urban design that allows all people to
safely move around and engage with neighbourhood public spaces is important for
creating community spirit and diversity, and ensuring that no group is marginalised
or isolated by their environment.337 The Municipal Association of Victoria brought
335 Mr S McConnell, Environment Protection Authority Victoria, Transcript of Evidence, 6 September 2011, 185. 336 Council on the Ageing (Victoria), Submission No. 58, 11 July 2011, 4‐6; Victorian Council of Social Service, Submission No. 49, 8 July 2011, 4, 8‐9; Ms D Parnell, Council on the Ageing (Victoria), Transcript of Evidence, 23 August 2011, 93; City of Boroondara, Submission No. 31, 27 June 2011, 15‐17; City of Stonnington, Submission No. 40, 14 July 2011, 8; VicHealth, Submission No. 47, 11 July 2011, 6‐7; City of Casey, Submission No. 42, 6 July 2011, 14; Doctors for the Environment Australia Inc., Submission No. 51, 11 July 2011, 8; Planning Institute Australia (Victorian Division), Cancer Council Victoria (SunSmart), City of Port Phillip, Physical Activity Australia, Victorian Council of Social Service and Victorian Local Governance Association, Submission No. 59, 13 July 2011, 2; Environment Defenders Office (Victoria) Ltd, Submission No. 10, 29 June 2011, 13; Deakin University’s Centre for Physical Activity and Nutrition Research, Submission No. 16, 30 June 2011, 3; SJB Urban, Submission No. 20, 30 June 2011, 3; I Butterworth, The Relationship Between the Built Environment and Wellbeing: a Literature Review, VicHealth, Melbourne, 2000, ii; Productivity Commission 2011 Caring for Older Australians, xix. 337 Deakin University’s Centre for Physical Activity and Nutrition Research, Submission No. 16, 30 June 2011, 3.

Chapter 4: Urban growth and public health
55
attention to the fact that people living with physical disabilities face significant
challenges relating to urban design, particularly in outer suburban areas.338
Chronic disease – and particularly in the case of older people, osteoarthritis339 –
often limits mobility. Ageing populations will increasingly rely on public transport
as ‘a generation of car lovers forego their private vehicles due to health,
environment or economic reasons.’340 If older people are not living within walking
distance of an accessible and safe public transport system, it may be difficult for
them to shop, join in community activities and maintain an active lifestyle which
would promote health and wellbeing. Research suggests that regular physical
activity can help to delay the onset of dementia in older people.341
The Committee observes that under the previous Victorian government a process
was started to introduce minimum standards for ‘universal design’ features in new
housing. The Victorian Council of Social Service defines these as:
… housing designed to be used by all people to the greatest extent possible. Homes designed to a universal standard are liveable for the majority of the population and accommodate whatever comes along in life easily and inexpensively.342
In 2009, a Visitable and Adaptable Housing Regulatory Impact Statement (RIS)
issued by DPCD proposed four of these features as minimum requirements for
accessible and adaptable housing:
a clear path from the street to a level entry
wider doorways and passages
an entry‐level toilet suitable for people with limited mobility
reinforced bathroom walls to allow grab rails to be fitted inexpensively if needed.343
The RIS noted that 96 percent of new homes built in Victoria lack these basic
accessibility features.344 Taking into account unquantified benefits (such as
reduced hospital stays, better quality homes and ageing in place) and
unquantifiable participation and equity benefits, the RIS claimed that the financial
benefits of mandating these features would outweigh the costs.345
In evidence at a public hearing, Council on the Ageing (Victoria) (COTA (Vic))
informed the Committee that this work was not completed prior to the change of
government, despite bipartisan support. Ms Debra Parnell from COTA (Vic) stated
338 Municipal Association of Victoria, Submission No. 61, July 2011, 19. 339 Dr J Carnie, Department of Health, Transcript of Evidence, 14 September 2011, 283. 340 Municipal Association of Victoria, Submission No. 61, July 2011, 19. 341 EB Larson et al, ‘Exercise Is Associated with Reduced Risk for Incident Dementia among Persons 65 Years of Age and Older’, Annals of Internal Medicine, January 17, 2006, 144 (2): 73‐81. 342 R Nissim, Universal Housing, Universal Benefits: A Victorian Council of Social Service discussion paper on universal housing regulation in Victoria, Victorian Council of Social Service, Melbourne, 2008, 3. 343 Department of Planning and Community Development 2009 Visitable and Adaptable Features in Housing: Regulatory Impact Statement, Victorian Government, Melbourne, 6. 344 Department of Planning and Community Development 2009 Visitable and Adaptable Features in Housing, 8. 345 Department of Planning and Community Development 2009 Visitable and Adaptable Features in Housing, 15.

Inquiry into Environmental Design and Public Health in Victoria
56
that the health of older Victorians and those with disabilities and impaired mobility
would benefit from renewed action on housing standards:
The things that we particularly want to see in place around universal housing is a clear path from the street to a level entry for access to a house, wider doorways and passageways, as you have identified, and that they not be just minimal standards, because we are recognising that wheelchairs, for example, and scooters are becoming larger to accommodate and be more useful for people. So that really needs to be considered — not only how people can get in but how they can manoeuvre around the house. We want a toilet suitable for people with limited mobility and that that be on the entry level so that people visiting the house can also access a suitable toilet. We also want to see reinforced bathroom walls so that houses can be retrofitted at minimal cost later on when people decide they need to have rails or they need other facilities in the house.
At the moment we know that retrofitting houses when people develop mobility issues is so costly that it is prohibitive, which means that people either have to struggle with living in a house that is no longer appropriate or they need to leave that house, which has a whole lot of impacts on them socially and in terms of their health. The other issue, when that happens or when the house becomes no longer appropriate for them, is we know that is one of the reasons that people go into residential care. Because the house is not appropriate, people cannot come in to give them the appropriate services. Often it is not feasible for them to move to a new house because of the value of the asset, how much it costs to move and all those sorts of issues. The other thing that we would also ask for is that there be a provision of an entry‐level shower.
A lot of work was done in relation to these issues. Under the previous government there was, we believe, bipartisan support for these things, and they were just very unfortunate circumstances that these regulations that were proposed were not passed and put into action. We feel it is something that could be done very easily at very minimal cost. I think for new houses it was brought down to be about $500 per new dwelling to put these provisions in. We see this is something that would have a significant impact for a lot of people. It is a very small and easy thing to do but would really impact on thousands of people and their ability to stay in their home and stay connected to their communities.346
The Victorian Universal Housing Alliance argue that retrofitting existing housing
and community facilities to ensure accessibility by all sectors of the community is
more expensive than including it in initial planning, costing ‘government – and
taxpayers – millions of dollars each year in hospital admissions, home care, early
aged care admissions and expensive modifications’.347 For example, one study
showed that providing appropriate and supported housing for older people
delayed their entry into residential care by an average of six years.348
346 Ms D Parnell, Council on the Ageing (Victoria), Transcript of Evidence, 23 August 2011, 93. 347 ‘Victorian Universal Housing Alliance Platform’, Victorian Universal Housing Alliance, 2008, 1, http://bit.ly/AslMzp accessed 30 November 2011. The Victorian Universal Housing Alliance includes Victorian Council of Social Service, the Victorian Local Governance Association, Council on the Ageing (Victoria), the Chronic Illness Alliance, the Housing Resource and Support Service, Cities of Melbourne, Port Phillip and Yarra, Planning Institute of Australia (Victorian Division), and the Wyndham City Council. 348 Council on the Ageing (Victoria), Submission No. 58, 11 July 2011, 5.

Chapter 4: Urban growth and public health
57
Recommendation 10
That the Victorian Government supports the introduction of design standards for
new housing to ensure access for seniors and people with limited mobility.
Recommendation 11
That the Victorian Government works with local government, developers, the
building industry and community groups to ensure that universal design principles
that improve accessibility are applied to all aspects of the built environment,
including the maintenance and retrofitting of existing building stock, roadways,
cycling and pedestrian paths, and public transport infrastructure.
The Committee further recommends that the Department of Planning and
Community Development assesses progress and reports back to the Parliament
annually on measures taken to improve the accessibility of the built environment
in Victoria.

Inquiry into Environmental Design and Public Health in Victoria
58

Chapter 5: Health in planning: legislation, guidelines and policy approaches
59
Chapter 5: Health in planning: legislation, guidelines and policy approaches
By creating a planning system that is health‐focused, and fair and equitable, all people can
be influenced to make healthier decisions and improve their quality of life.349
This chapter discusses the evidence received on Victoria’s planning system,
including planning legislation and subordinate instruments, guidelines and
associated planning policy approaches.
As outlined in previous chapters, there is a well established body of literature
linking the built environment and public health. The principles of creating healthy
urban places are also increasingly well understood and documented; over the last
decade, various practical checklists, toolkits and voluntary guides have become
available for those involved in developing land in Victoria. Examples include the
Heart Foundation’s Healthy by Design350 and the Victorian Government’s
Environments for Health framework.351 Around Australia and overseas,
governments and others are producing similar resources, such as the Department
of Health and Ageing’s Healthy Spaces and Places,352 the New South Wales
Department of Health’s Healthy Urban Development Checklist,353 and the City of
New York’s Active Design Guidelines.354
However the overarching message from participants in this Inquiry is that
voluntary checklists and resources are not enough. Public health must be made a
priority throughout Victorian planning legislation, subordinate instruments and
policy, as part of the state’s response to the health challenges facing Victorians.
The Committee has identified readily achievable opportunities for this in order to
drive ‘on the ground’ change in the way the environment is built or renewed.
5.1 Planning and Environment Act 1987
The Planning and Environment Act 1987 (‘the Act’) articulates the high level
objectives and legislative framework governing the operation of Victoria’s planning
schemes. The stated purpose of the Act is ‘to establish a framework for planning
the use, development and protection of land in Victoria in the present and long‐
term interests of all Victorians.’355
349 Modernising Victoria’s Planning Act – A discussion paper on opportunities to improve the Planning and Environment Act 1987, Obesity Policy Coalition, 2009, 3, http://bit.ly/wUs0Ck accessed 30 November 2011. 350 ‘Healthy by Design, Victoria’, Heart Foundation, http://bit.ly/zYXWwA accessed 30 November 2011 351 Department of Human Services 2001 Environments for Health – Promoting Health and Wellbeing through Built, Social, Economic and Natural Environments, Municipal Public Health Planning Framework, Victorian Government, Melbourne, 2001. 352 ‘Healthy Spaces and Places’, Department of Health and Ageing, http://bit.ly/bjFjxD accessed 12 October 2011. 353 NSW Department of Health 2009 Healthy Urban Development Checklist: A guide for health services when commenting on development policies, plans and proposals, NSW Government, Sydney. 354 Active Design Guidelines: Promoting Physical Activity and Health in Design, City of New York, 2010, http://bit.ly/9d3pQ7 accessed 30 November 2011. 355 Victorian Government, Planning and Environment Act 1987, s. 1.
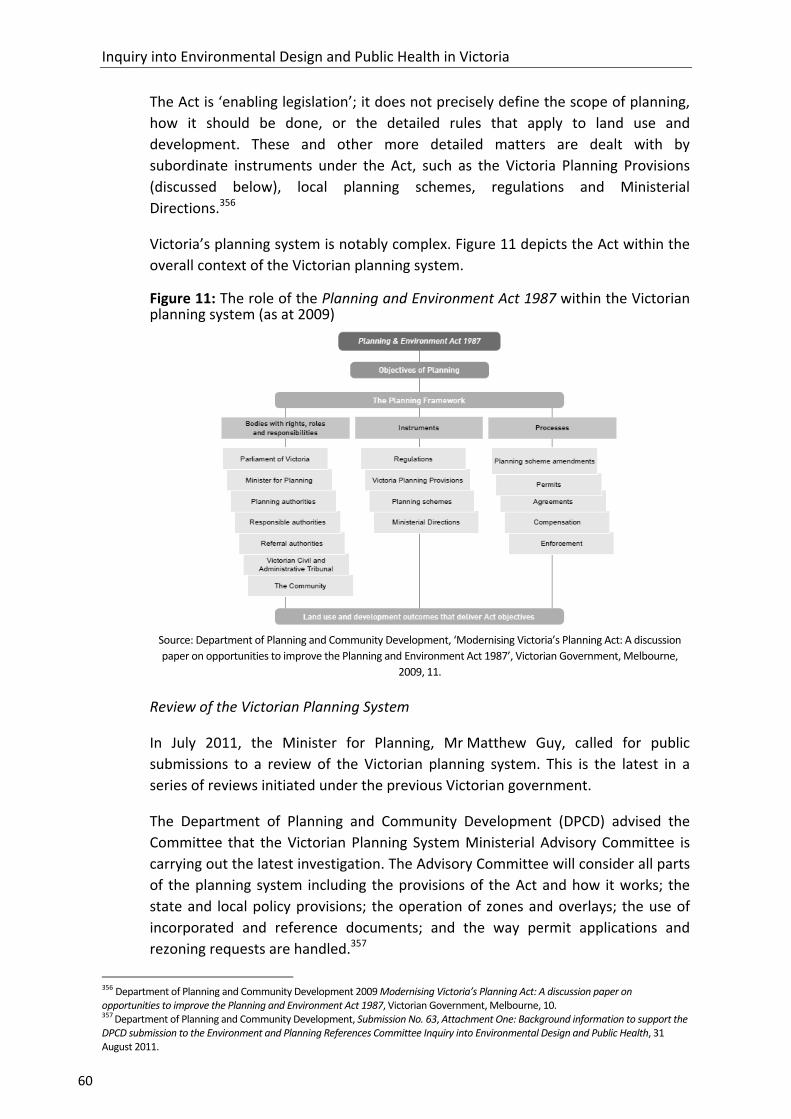
Inquiry into Environmental Design and Public Health in Victoria
60
The Act is ‘enabling legislation’; it does not precisely define the scope of planning,
how it should be done, or the detailed rules that apply to land use and
development. These and other more detailed matters are dealt with by
subordinate instruments under the Act, such as the Victoria Planning Provisions
(discussed below), local planning schemes, regulations and Ministerial
Directions.356
Victoria’s planning system is notably complex. Figure 11 depicts the Act within the
overall context of the Victorian planning system.
Figure 11: The role of the Planning and Environment Act 1987 within the Victorian planning system (as at 2009)
Source: Department of Planning and Community Development, ‘Modernising Victoria’s Planning Act: A discussion
paper on opportunities to improve the Planning and Environment Act 1987’, Victorian Government, Melbourne,
2009, 11.
Review of the Victorian Planning System
In July 2011, the Minister for Planning, Mr Matthew Guy, called for public
submissions to a review of the Victorian planning system. This is the latest in a
series of reviews initiated under the previous Victorian government.
The Department of Planning and Community Development (DPCD) advised the
Committee that the Victorian Planning System Ministerial Advisory Committee is
carrying out the latest investigation. The Advisory Committee will consider all parts
of the planning system including the provisions of the Act and how it works; the
state and local policy provisions; the operation of zones and overlays; the use of
incorporated and reference documents; and the way permit applications and
rezoning requests are handled.357
356 Department of Planning and Community Development 2009 Modernising Victoria’s Planning Act: A discussion paper on opportunities to improve the Planning and Environment Act 1987, Victorian Government, Melbourne, 10. 357 Department of Planning and Community Development, Submission No. 63, Attachment One: Background information to support the DPCD submission to the Environment and Planning References Committee Inquiry into Environmental Design and Public Health, 31 August 2011.

Chapter 5: Health in planning: legislation, guidelines and policy approaches
61
According to the Department’s website (February 2012), the Minister received an
initial summary report and was due to issue a public response by early 2012.358
Due to this timing, the Committee was unable to consider the summary report or
the Minister’s response. The Committee notes that outcomes from the review are
likely to have an important bearing on many of the matters discussed in this
chapter.
Objectives of planning
Section 4(1) of the Act sets out the objectives of planning in Victoria:
a) to provide for the fair, orderly, economic and sustainable use, and development of land;
b) to provide for the protection of natural and man‐made resources and the maintenance of ecological processes and genetic diversity;
c) to secure a pleasant, efficient and safe working, living and recreational environment for all Victorians and visitors to Victoria;
d) to conserve and enhance those buildings, areas or other places which are of scientific, aesthetic, architectural or historical interest, or otherwise of special cultural value;
e) to protect public utilities and other assets and enable the orderly provision and co‐ordination of public utilities and other facilities for the benefit of the community;
f) to facilitate development in accordance with the objectives set out in paragraphs (a), (b), (c), (d) and (e);
g) to balance the present and future interests of all Victorians.
These planning objectives are mandatory considerations in most planning
decisions and processes under the Act: the making and amendment of planning
schemes; the grant or refusal of permits; and the conduct of planning authorities
and responsible authorities.359
5.1.1 Health and wellbeing in the Planning and Environment Act 1987
In a submission to the Committee, DPCD summarised the overall function of
planning in relation to public health and wellbeing:
Planning can play an influential role in land use and development to achieve improved wellbeing for the community. However, its main function is to set the conditions for sustainable development, with a proscribed role with respect to levels of private and public investment, operational and service delivery matters.
For example, in relation to supporting good neighbourhood amenity, planning processes can set the expected outcomes for greenfield suburb development through setting development standards and separating incompatible land uses.
358 ‘Victorian Planning System Ministerial Advisory Committee’, Department of Planning and Community Development, 2012, http://bit.ly/zxFUKl accessed 5 January 2012. 359 Environment Defenders Office (Victoria) Ltd, Submission No. 10, 29 June 2011, 6.

Inquiry into Environmental Design and Public Health in Victoria
62
However the other investments in facilities and influences on behaviour are generally outside the purview of planning.360
Evidence put to the Committee was strongly of the opinion that public health and
wellbeing is an increasingly relevant matter for planning. Submissions and
witnesses concurred that the objectives of planning in Victoria (as stated in the
Act) do not reflect the growing evidence for the links between urban design and
public health and wellbeing.361 It was contended that this leads to planning
outcomes which do not consistently advance public health and wellbeing.
Further on the topic of whether public health should receive attention within the
Act, Hansard recorded the following discussion between Committee Member
Mr Johan Scheffer and Mr John Ginivan from DPCD:
Mr SCHEFFER — Other witnesses have indicated to us that what they would desire would be to have health as an objective in the Planning and Environment Act. They have been pretty clear about that ... The Act is being reviewed. Could you tell us about where that review process is up to and whether a health objective is under consideration for inclusion as an objective in the legislation.
Mr GINIVAN — There is not a specific health objective, in the sense that the objectives of the Act talk more broadly around good social outcomes, good environmental outcomes and good economic outcomes. One of the things that is often interesting in the planning space is, at the end of the day, how does a decision‐maker, a planner in a local government or otherwise, know what it is they are expected to do to deliver the right answer? One of the things that is a challenge in framing a planning Act is keeping it as specific as possible in terms of what are the things that it is actually seeking to do. My sense at the moment is that the Act is very broad in its interpretation. It can be very broad in terms of what it addresses already in the sense of driving the creation of communities, driving the planning for communities. A simple objective that also sorts out health — well, that is part of a social outcome already.
Mr SCHEFFER — I do not think the witnesses have been talking about a simple objective. They have been talking about it being an objective and obviously various subsets or various sections of the legislation stipulating how a health component or a health consideration is built into the legislation. That is what has been put to us, and, really, I think you have probably answered the question that the direction the review is going is of a more general nature, and I will draw from what you have said that health in the ways that I have described it, reflecting what I think other witnesses are telling us, has not thus far been built into the review of the legislation.
Mr GINIVAN — When you look at the planning system more broadly I guess you could say it is generally in the various other policy statements that occur through the Victoria Planning Provisions where you can start to get some greater articulation of what might a health objective actually mean, and it is in there where we have things like we ought to be trying to design communities so that walkability is possible. We could design them so that you can only go everywhere by car, or we can consciously say that if you have at least got the option to walk, there is more of a chance that people will walk, with a consequential benefit. Equally in terms of open space provision, it is in the Victoria Planning Provisions in
360 Department of Planning and Community Development, Submission No. 63, Attachment One, 3. 361 The word ‘health’ appears once in the Act (at s.201 VB (b)).
Chapter 5: Health in planning: legislation, guidelines and policy approaches
63
particular where it articulates that open space ought to be usable and accessible, not simply an afterthought.362
The Committee found strong support for amending the objectives of the Act to
include ‘public health and wellbeing’ (or similar wording).363 From a planning
industry perspective, the Committee heard from Mr Jason Black from the Planning
Institute of Australia (Victorian Division) (PIA (Vic)) on how the formal objectives
set out in the Act influence the decision‐making process:
When the chips are down and we are looking at what we need to do, our starting point is going to be the planning schemes. What does the planning scheme say to us about whatever it is that we are proposing to do in a new community? If our planning schemes are not telling us that the forefront consideration is the community’s health and wellbeing and it is something else, then how can planners and developers be expected to read into it that the community’s health and wellbeing is a priority? … People will say, ‘What would a few words in an Act mean to you anyway?’ Put simply, it is amazing how many times we go to VCAT [Victorian Civil and Administrative Tribunal] and a barrister or a QC [Queen's Counsel] wants to start with, ‘Let’s talk about the objectives of planning’. Maybe they are paid to make the song and dance about that, but that is a really important point, because if the community’s health and wellbeing is the starting point of the objectives of planning, then it is natural that it will flow down to the other elements.364
In 2006 VicHealth and PIA (Vic) conducted research which found that although
most planners felt they had a role in creating a healthier community, only 26
percent considered health and wellbeing issues frequently in their work. Barriers
to considering health and wellbeing issues in planning included that health
outcomes are not specifically included in legislation or highlighted in the planning
scheme.365
The Committee supports the view that an amendment to the objectives of
planning, as set out in the Planning and Environment Act 1987, is a necessary step
to ensuring that health and wellbeing is embedded as a priority within the planning
system.
Recommendation 12
That the Victorian Government amends section 4(1) of the Planning and
Environment Act 1987 to include ‘the promotion of environments that protect and
encourage public health and wellbeing’ (or similar wording) as an objective of
planning in Victoria.
362 Mr J Scheffer and Mr J Ginivan, Department of Planning and Community Development, Transcript of Evidence, 31 August 2011, 143. 363 City of Boroondara, Submission No. 31, 27 June 2011, 18; City of Whitehorse, Submission No. 6, 24 June 2011, 1; City of Stonnington, Submission No. 40, 14 July 2011, 11; City of Casey, Submission No. 42, 6 July 2011, 25; City of Melbourne, Submission No. 44, 7 July 2011, 7‐8; Yarra Ranges Council, Submission No. 41, 20 June 2011, 3. 364 Mr J Black, Planning Institute of Australia (Victorian Division), Transcript of Evidence, 4 October 2011, 292. 365 T Harper, Melbourne 2030 Implementation Audit VicHealth Submission, VicHealth, Melbourne, 2007, 11.
Inquiry into Environmental Design and Public Health in Victoria
64
5.2 Victoria Planning Provisions
The Victoria Planning Provisions (VPP) is a subordinate instrument under Part 1A of
the Act. DPCD describes the VPP as a state‐wide reference document or template
from which all Victorian planning schemes are sourced and constructed. It is not a
planning scheme and does not apply to any land.366
The VPP provides the framework, standard provisions and state planning policy.
The planning authority (usually the local council) must provide the local planning
policy content, including a Municipal Strategic Statement (MSS) and select the
appropriate zones and overlays from the VPP, for inclusion in their planning
scheme.
An amendment to the provisions of the VPP will amend specified planning schemes
which include those provisions. Only the Minister for Planning or any other
Minister, public authority or local council authorised by the Minister, may prepare
an amendment to the VPP. Only the Minister for Planning can approve an
amendment to the VPP.367
5.2.1 Health and wellbeing in the Victoria Planning Provisions
Statements relating to health and wellbeing are fragmented across a range of
different parts of the VPP, including the State Planning Policy Framework (SPPF)
and Clause 56 which deals with ‘Residential Subdivisions’, known as ‘ResCode’.368
The SPPF contains strategic issues of state importance which must be considered
when decisions are made.369 Clause 10.01 emphasises that the SPPF is ‘dynamic
and will be built upon as the government develops and refines policy, and changed
as the needs of the community change.’370
‘Public health’ is not one of the ten themes around which the SPPF is structured
and the word ‘health’ itself appears rarely. However, in a submission, DPCD noted
that each of the themes covers a range of matters which could be directly or
indirectly relevant:
Settlement policy (including open space, and regional settlement development policy)
Environmental and Landscape Values (landscapes and coastal area protection objectives significant open spaces)
Environmental Risks (objectives covering noise abatement, air quality, contaminated and potentially contaminated land, floodplain and wildfire management and water quality)
366 ‘The Framework for Planning Schemes: Victoria Planning Provisions’ Department of Planning and Community Development, 2012, http://bit.ly/sBQCZR accessed 12 October 2011. 367 ‘The Framework for Planning Schemes: Victoria Planning Provisions’, Department of Planning and Community Development. 368 Wyndham City Council, Submission No. 62, 26 July 2011, 21; Mr J Black, Planning Institute of Australia (Victorian Division), Transcript of Evidence, 4 October 2011, 291; Yarra Ranges Council, Submission No. 41, 20 June 2011, 3. 369 ‘The Framework for Planning Schemes: Victoria Planning Provisions’, Department of Planning and Community Development. 370 Victoria Planning Provisions, Clause 10.01.

Chapter 5: Health in planning: legislation, guidelines and policy approaches
65
Natural Resource Management (protection of productive farmland)
Built Environment and Heritage (urban design, neighbourhood and subdivision design, design for safety, cultural identity, neighbourhood character and heritage conservation)
Housing (objectives concerning location of residential development, and housing affordability)
Economic Development (industrial land development, covering appropriate buffer areas between the proposed industrial land and nearby sensitive land uses)
Transport (land use and transport planning and movement networks such as walking and cycling)
Infrastructure (planning for integration of health and education facilities with local and regional communities).371
The Committee notes that there are mentions of health (and goals related to
health such as walkability and liveability) within the SPPF. Clause 15 of the SPPF
(Built Environment and Heritage) contains more detailed directions on matters
such as Urban Design and Urban Design Principles (15.01‐1; 15.01‐2),
Neighbourhood and Subdivision Design (15.01‐3) and Design for Safety (15.01‐4).
The latter sub‐clause directs planning authorities to have regard to the Safer
Design Guidelines, which discuss design features to promote walking, cycling and
more active and accessible public spaces. However, there is no comparable section
in the VPP which addresses public health and wellbeing.
ResCode includes standards relating to Compact and Walkable Neighbourhoods
(‘easy walking distance to activity centres, schools and community facilities, public
open space and public transport’ – 56.03‐1) and Integrated Mobility Objectives (‘an
urban structure where compact and walkable neighbourhoods are clustered to
support larger activity centres on the Principal Public Transport Network in
Metropolitan Melbourne and on the regional public transport network outside
Metropolitan Melbourne’ – 56.06‐1).372
The Australian Institute of Landscape Architects submitted that ResCode does not
provide clear guidance on how urban design could promote health and wellbeing
outcomes:
[Clause 56] was brought in to improve the design of new residential areas. However, its provisions do not actually mention health, and it only infers, which is unacceptable when discussing the planning and design for health needs. A clearer policy mandate will be required if a holistic approach to healthy built environment is to be achieved.373
371 Department of Planning and Community Development, Submission No. 63, Attachment One, 3. 372 Victoria Planning Provisions, Clause 56. 373 Australian Institute of Landscape Architects, Submission No. 12, 27 June 2011, 12.
Inquiry into Environmental Design and Public Health in Victoria
66
In relation to the diffuse references to health spread across the VPP, several
submissions argued that it would be appropriate for the SPPF to address health
and wellbeing in a comprehensive manner.374 Wyndham City Council stated:
There certainly is scope to give these different references a firmer basis by having them refer back to one section within the SPPF. This would assist greatly in organising and crystallising objectives and mechanisms relevant to planning for health within Victorian Planning Schemes. We therefore recommend that any action to improve planning for health include advocacy for a Clause within the SPPF dedicated to Planning for Health. A Planning Policy on Heath could come into the Planning Scheme after the Design for Safety Policy (Clause 15.01‐4) and could be structured similarly to the safety policy.375
Commenting further on the VPP, Mr Jason Black noted at a public hearing:
… if we were to take a well‐let’s‐have‐a‐look at what we have got scenario, there are areas within the Victoria Planning Provisions that do have references to community health and wellbeing and to notions of some of these key priority areas, but it is done almost in an isolated way. It is not embedded in the objectives of planners; it is not embedded in state planning policy and then flowing down. There are elements of ResCode — clause 56, as we call it — that have picked up these themes. There are elements of the precinct structure planning guidelines that have picked up on these themes, but the community’s health and wellbeing is not actually embedded in the starting point to planning in our communities. Our fundamental, real main point is: why is it so?376
The Committee considers that the VPP should provide clear guidance on health
and wellbeing, and further notes that this is in keeping with the Committee’s key
recommendation (above) to amend the objectives of planning within the Act.
Recommendation 13
That the Victorian Government amends the State Planning Policy Framework
within the Victoria Planning Provisions to include a policy on planning for health
and wellbeing. Following from this, clauses throughout the Victoria Planning
Provisions which relate to health and wellbeing should be amended as is necessary
to provide clear and coherent direction for the planning system.
5.3 Health Impact Assessment
Health Impact Assessment (HIA) is a systematic way of identifying the potential
health impacts of a proposed policy, strategy, plan, project or program. It offers
methods and tools to evaluate a proposal’s anticipated effects on the health of a
population and the distribution of those effects within a population.377 Where
appropriate, it will also recommend alternative policy directions and strategies to
mitigate detrimental health impacts.
374 City of Ballarat, Submission No. 19, 30 June 2011, 6; Environment Defenders Office (Victoria) Ltd, Submission No. 10, 29 June 2011, 6; City of Boroondara, Submission No. 31, 27 June 2011, 19; Nillumbik Shire Council, Submission No. 60, 13 July 2011, 5. 375 Wyndham City Council, Submission No. 62, 26 July 2011, 21. 376 Mr J Black, Planning Institute of Australia (Victorian Division), Transcript of Evidence, 4 October 2011, 291. 377 Public Health Advisory Committee 2005 A Guide to Health Impact Assessment: A Policy Tool for New Zealand, 2nd edition, National Health Committee, Wellington (NZ), 7.
Chapter 5: Health in planning: legislation, guidelines and policy approaches
67
HIA is currently part of Victorian health legislation. Section 53 of the Public Health
and Wellbeing Act 2008 empowers the Minister for Health to order a Health
Impact Assessment of the ‘public health and wellbeing impact of a matter.’378 The
Committee was not made aware of the provision having been used, however it
would allow a Minister to require an assessment of, for example, the health
impacts of an outer urban residential development or an urban renewal project.
While the HIA provision of the Health and Wellbeing Act 2008 has not been used,
HIAs have already been conducted in other settings in Victoria, such as in the
previous government’s Neighbourhood Renewal project, in assessing a waste
policy in the Shire of East Gippsland, and to analyse the impact of a walking path in
the community of Leopold near Geelong.379
Internationally, HIA is most commonly employed in environmental, transport and
land use planning decision‐making.380 In a planning context, HIA is a means of
measuring both the qualitative and quantitative impacts of a planning proposal on
society and of ensuring that the long‐term effects of development decisions are
considered.381 A recent review of the use of HIA in the European Union and the US
underscored its applicability to urban planning.382 Similarly, a survey of HIAs
conducted in New Zealand found that of 45 either completed or in progress at the
time of the survey, 16 assessed the impacts of an urban planning or growth
proposal.383
During this Inquiry, the Committee heard strong support from local government
and professionals in the planning and public health fields for mandating HIA in the
Planning and Environment Act 1987.384 Dr Margaret Beavis informed the
Committee that ‘we need health impact assessments. The advantage of health
impact assessments is that developers will start to design for health. They will
realise there are a set of parameters that they need to design within, and they will
realise that this is a priority at government level.’385
Responding to a question from the Chair, Ms Gayle Tierney, on whether HIA would
lead to better development proposals, representatives from the Department of
Health stated:
Dr CARNIE — To my mind any development proposal really should consider what the effects are, whether it is done as a formal health assessment or not. Clearly these are areas that we consider ourselves in terms of what impact various changes in the environment have on health, so it would be something that we would encourage. People should always look at what effect any kinds of
378 Public Health and Wellbeing Act 2008, s.53. 379 C Boyce and V Shelton, Leopold Strategic Footpath Network: Health Impact Assessment, City of Greater Geelong, 2008. 380 R Bhatia, Health Impact Assessment: A Guide for Practice, Human Impact Partners, Oakland CA, 2011. 381 Heart Foundation (Victoria), Submission No. 55, July 2011, 35. 382 National Research Council of the National Academies, Improving Health in the United States: The Role of Health Impact Assessment, National Academies Press, Washington DC, 2011, 92. 383 R Quigley, Presentation to Health in All Policies Conference, Adelaide, April 2010. 384 City of Ballarat, Submission No. 19, 30 June 2011, 5; City of Monash, Submission No. 24, 28 June 2011, 2; City of Whittlesea, Submission No. 26, 30 June 2011, 15; City of Whitehorse, Submission No. 6, 24 June 2011, 2. 385 Dr M Beavis, Transcript of Evidence, 4 August 2011, 51‐52.

Inquiry into Environmental Design and Public Health in Victoria
68
development or any kinds of changes have on health. Do you want to expand on that in terms of health impacts per se?
Mr SINDALL — Graeme may wish to comment on this, but health impact assessment can obviously be quite technically demanding to get right. While we may absolutely want to look at the potential health effects, benefits and others, of development, formal health impact assessment is not something that one goes into lightly.
Mr GILLESPIE — Yes, I think it needs to be pretty well planned and resourced. It would require a trained resource. It also needs to be in the context of a full health impact assessment across all of the determinants of health, rather than the more traditional hazard impact assessment.386
Evidence put to the Committee in support of HIA also expressed two main
qualifications. Firstly, HIAs would be most appropriate for key planning decisions
and larger scale developments where a major population increase is proposed,
such as in growth areas: ‘it would be quite possible to identify the types of
development applications or land use proposals that are likely to have some higher
potential impact on community health and wellbeing outcomes, whether it is a
positive or a negative.’387
Secondly, the tools or methodology used to conduct the assessment need to be
easy to use, fit within existing planning activities and be supported by appropriate
resources and training.388 A variety of HIA tools exist both in Australia and
internationally. The Committee notes that the Heart Foundation’s ‘Design for
Health’ suite is considered by planners to be an excellent example of planning‐
appropriate HIA tools.389 A small number of local governments may already be
adapting existing resources to prepare health or social impact assessments. East
Gippsland Shire Council noted that in the absence of detailed mechanisms for
considering the impacts of planning in the Act, it is developing its own Social
Impact Assessment process.390 HIA need not be a lengthy and drawn out process;
the Committee heard that very effective rapid assessment tools have been
developed in Australia.391
While advocating for the use of HIA, Mr Jason Black cautioned:
… we do not necessarily need to make health impact assessment a new industry in its own right. I think this is where planning over the last few years has got it wrong — that is, we now require social work practice assessments, economic impact assessments and this, that and the other thing, which has effectively bred a new industry that runs side by side with the planning industry where it becomes an anchor to the planning decision‐making process, because it is time consuming and it costs a lot… It does not have to be a whole new industry of people who now do health impact assessments, because that is where we feel that we will start to get
386 Dr J Carnie, Mr C Sindall and Mr G Gillespie, Department of Health, Transcript of Evidence, 14 September 2011, 278. 387 Mr J Black, Planning Institute of Australia (Victorian Division), Transcript of Evidence, 4 October 2011, 293. 388 City of Whitehorse, Submission No. 6, 24 June 2011, 2. 389 Planning Institute Australia (Victorian Division), Cancer Council Victoria (SunSmart), City of Port Phillip, Physical Activity Australia, Victorian Council of Social Service and Victorian Local Governance Association, Submission No. 59, 13 July 2011, 19. 390 East Gippsland Shire Council, Submission No. 57, 15 July 2011, 2. 391 Prof E de Leeuw, Transcript of Evidence, 7 September 2011, 228.

Chapter 5: Health in planning: legislation, guidelines and policy approaches
69
a lot of resistance from not just planners but others within the planning and development industry, so we think it is important to make that distinguishing point.392
The Committee is mindful that HIA is a relatively new form of assessment. There
are few published studies evaluating its use for assessing urban development in
Australia.393 However, interest is increasing and Australian researchers have
contributed substantially to the international body of knowledge on the topic. The
New South Wales Health Impact Assessment Project ran from 2003 to 2009 and
was funded and supported by NSW Health. The project undertook more than 20
HIAs and sought to build the capacity of NSW Health to use the assessment tool.394
In keeping with recommendations made elsewhere in this report, and noting the
existing provision for HIA in the Public Health and Wellbeing Act 2008, the
Committee considers that the inclusion of HIA in the Planning and Environment Act
1987 has the potential to lead to healthier planning outcomes if supported by
appropriate resources.
Recommendation 14
That the Victorian Government amends section 12 of the Planning and
Environment Act 1987 to require planning authorities to conduct a Health Impact
Assessment for key planning decisions, such as major urban developments or
making or amending a planning scheme. The Committee further recommends that:
a suitable and easy to use Health Impact Assessment tool be developed by the Department of Health and the Department of Planning and Community Development, in consultation with the planning industry and local governments
the Department of Health and the Department of Planning and Community Development provide resources and support to local governments to conduct Health Impact Assessments.
5.4 Precinct Structure Plans and Guidelines
Precinct Structure Plans (PSPs) are masterplans or ‘blueprints’ for whole
communities (usually catering for between 10,000 and 30,000 people). PSPs lay
out roads, transport routes, open space networks (including walking and bicycle
paths), shopping centres, schools, local employment provision and housing. They
indicate how issues of biodiversity, cultural heritage, infrastructure provision and
council charges will be managed within a precinct. PSPs are also intended to
engage with a wider context, by providing ‘an up to date approach to address
current global issues such as adapting to climate change, reducing carbon
emissions, rising living costs and pressures of increasing travel distances as our
cities grow.’395
392 Mr J Black, Planning Institute of Australia (Victorian Division), Transcript of Evidence, 4 October 2011, 293. 393 S Furber et al, ‘The Use of Health Impact Assessment to Determine the Potential Impact of an Australian Urban Development Proposal on Health and Well‐being’, Urban Policy & Research, June 2009, 29 (2): 125‐139. 394 ‘New South Wales HIA Project’, HIA Connect, http://bit.ly/roTFe3 accessed 10 October 2011. 395 ‘Precinct Structure Plans’, Growth Areas Authority, http://bit.ly/sYpwDH accessed 10 October 2011.

Inquiry into Environmental Design and Public Health in Victoria
70
The Growth Areas Authority (GAA) is responsible for overseeing the preparation of
all PSPs in Melbourne’s growth areas and advising the Minister for Planning on
their approval.396 PSP are incorporated into the local planning scheme to guide the
use and development of land in the precinct over the long‐term.
In October 2009 the GAA issued guidelines for preparing the various aspects of
PSPs. The PSP Guidelines ‘set out the critical issues to be examined by planners,
developers, service providers and government in the planning for new
communities.’397 PSP Guidelines practice notes also have been published to give
additional direction on the following topics:
contents of PSP
biodiversity
engagement
heritage
roads.
5.4.1 Growth Corridor Plans
In November 2011 the GAA released draft Growth Corridor Plans. These are
intended to be higher level, strategic documents identifying areas for housing,
jobs, transport, town centres, open space and infrastructure. The Plans will provide
direction for PSP and will also be a major input for the forthcoming Melbourne
Metropolitan Strategy (see Section 5.7).398
Due to the timing of their release during the Inquiry, the Committee did not
receive evidence on these draft plans.
5.4.2 Evidence received on PSPs
In submissions to the Inquiry, councils commented on the precinct structure
planning process in general and the PSP Guidelines specifically.399 Wyndham City
Council called for the PSP Guidelines to include a section on ‘Planning for Health’.
This would articulate the major ‘public health infrastructure’ to be shown on a PSP
and assist councils to assess PSP proposals against public health objectives.400
Wyndham City Council and several other submitters also argued that the voluntary
Guidelines contain a list of goals related to health and wellbeing that are ‘nice to
have’ but often watered down or absent in the final development outcomes.401 To
illustrate this, Wyndham City Council’s submission gave the example of the
396 ‘Precinct Structure Plans’, Growth Areas Authority. 397 Growth Areas Authority 2009 Precinct Structure Planning Guidelines – Part One: Overview of Growth Area Planning, Melbourne, 2. 398 ‘Precinct Structure Plans’, Growth Areas Authority. 399 City of Casey, Submission No. 42, 6 July 2011, 10; Wyndham City Council, Submission No. 62, 26 July 2011. 400 Wyndham City Council, Submission No. 62, 26 July 2011, 23. 401 Prof M Buxton, Transcript of Evidence, 4 October 2011, 311; Assoc Prof C Whitzman, Transcript of Evidence, 7 September 2011, 270; Mr J Black, Planning Institute of Australia (Victorian Division), Transcript of Evidence, 4 October 2011, 291.

Chapter 5: Health in planning: legislation, guidelines and policy approaches
71
guidelines relating to pedestrians and cyclists, noting the use of several ‘qualifiers’
(underlined):
In areas of anticipated high pedestrian/cyclist demand and where necessary and appropriate, crossings for these users should be provided across barriers such as railway lines, service easements and watercourses. These should be at a maximum spacing of 400m. Road bridges should be constructed at regular intervals (ideally at about 800 metres spacing and up to a maximum of 1600m spacing) over these barriers.402
In a submission comprehensively reviewing health and wellbeing elements in the
PSP Guidelines, the City of Casey, another growth area council, argued that while
open space and active transport receives attention within the Guidelines, once
again ‘the degree of connectivity delivered, the timing of delivery and the quality
of the services are yet to transpire’.403 In regard to the PSP Guidelines stating that
95 percent of dwellings should be within 400 metres of a local park, the submission
noted:
… the 400 metre walkable catchment is applied purely as a mapping exercise with no consideration given to the impediment to access and safety (such as main road crossings, waterways without bridge connections etc.). Greater consideration is required to ensure these spaces are appropriately planned with local environmental factors given consideration.404
The City of Casey further argued that the provisions in the Guidelines for open
space provision were not consistent with the aspiration for higher population
densities in new growth area communities:
The Precinct Structure Planning Guidelines apply a 10 per cent ratio of open space provision as part of the net developable area of a Precinct Structure Plan. This does not account for localised sporting demand, housing densities and ultimate population numbers which drive demand and usage of these spaces.405
At a public hearing, Mr John Ginivan, representing DPCD, stated that it may be
premature to assess the effectiveness of the guidelines and the Precinct Structure
Planning process. In answer to a question from Committee Member Mr Brian Tee,
referring to the evidence received above on PSP by the Committee, Mr Ginivan
replied:
One of the other things that is going to be interesting in terms of whether councils’ desired plans actually appear on the ground will be to see within five to six years whether the effect of what is in current precinct structure planning rules and guidelines does appear on the ground. It is interesting that in work DPCD has done looking at the density of development delivered on the ground, where the rules changed five or six years ago, it is only in roughly the past 12 months that you start to see the effect of those rule changes coming through in what is being put down as current subdivisions because of the lag.
402 Wyndham City Council, Submission No. 62, 26 July 2011, 6. (Council’s emphasis.) 403 City of Casey, Submission No. 42, 6 July 2011, 10. 404 City of Casey, Submission No. 42, 6 July 2011, 23. 405 City of Casey, Submission No. 42, 6 July 2011, 23.

Inquiry into Environmental Design and Public Health in Victoria
72
I think the expectation we would have is that the precinct structure planning guidelines are quite firm and clear. We would have an expectation that if a precinct structure plan or growth area framework plan is approved, then the fundamental skeleton of what should be on the ground will appear on the ground. We would expect to be starting to see that flow through when the development of that subdivision actually occurs, which might be in three, four, five, six or seven years time from now when it actually hits the ground.406
Monitoring and review of PSPs is addressed in Part 2, Section 5.4 of the Guidelines.
Responsibility for monitoring and reviewing sits with individual councils ‘in
consultation with the GAA and other agencies.’ There is no detail given of how the
monitoring and review is to be conducted nor what, if any, benchmarking is to
occur.407 The GAA has not released any information to suggest it has reviewed PSP
to date (although it should be noted that the first PSPs were approved only in
2006‐07). However, Planning Panels Victoria did conduct a review of PSPs in
August 2010. The interim report noted that the PSP process was still a new model
of growth area planning and concluded:
It is important therefore, that there is consistency in the preparation and implementation of PSPs and associated documentation to ensure that there is certainty in growth area planning. The PSP Guidelines facilitate this consistency. It is important, however, that all stakeholders in the process keep abreast of the issues to ensure that this consistency is achieved all the way through to the final implementation of a PSP.408
The Committee believes it would be timely for the Government to examine
whether the PSP Guidelines appropriately promote health and wellbeing outcomes
in new communities, and whether those plans that have been completed are in
fact achieving the expected development outcomes on the ground.
Recommendation 15
That a review of the effectiveness of Precinct Structure Plans be undertaken, with
a particular emphasis on whether expected outcomes for green and other public
spaces, and walking, cycling and public transport infrastructure, are being
delivered.
Recommendation 16
That the Victorian Government revises the Precinct Structure Planning Guidelines
to:
identify public health and wellbeing as a priority matter for Precinct Structure Plans
provide clear direction on how public health and wellbeing should be advanced within Precinct Structure Plans.
406 Mr J Ginivan, Department of Planning and Community Development, Transcript of Evidence, 31 August 2011, 145. 407 City of Casey, Submission No. 42, 6 July 2011, 23. 408 Planning Panels Victoria 2010 Review of Precinct Structure Plans: 2009‐2010 – Interim Report on Issues Emerging From the PSP Process, Department of Planning and Community Development, Victorian Government, Melbourne, 69.

Chapter 5: Health in planning: legislation, guidelines and policy approaches
73
5.5 Urban Design Charter
In a submission to the Committee, DPCD noted that good practice in Victorian
urban design was supported by the Urban Design Charter. The Charter was
developed by DPCD and launched in 2009 as a commitment by the previous
Victorian Government and others to make cities and towns in Victoria more
liveable through good urban design. The stated purpose of the Charter is ‘to
embed good urban design in development processes across metropolitan and
regional Victoria.’409
The Charter puts forward 12 principles of good urban design:
1) Structure: organise places so their parts relate well to each other
2) Accessibility: provide ease, safety and choice of access for all people
3) Legibility: help people to understand how places work and to find their way around
4) Animation: stimulate activity and a sense of vitality in public places
5) Fit and function: support the intended uses of spaces while also allowing for their adaptability
6) Complementary mixed uses: integrate complementary activities to promote synergies between them
7) Sense of place: recognise and enhance the qualities that give places a valued identity
8) Consistency and variety: balance order and diversity in the interests of appreciating both
9) Continuity and change: maintain a sense of place and time by embracing change yet respecting heritage values
10) Safety: design spaces that minimise risks of personal harm and support safe behaviour
11) Sensory pleasure: create spaces that engage the senses and delight the mind
12) Inclusiveness and interaction: create places where all people are free to encounter each other as equals.
An attachment to the Charter gives further guidance on each of these principles.
The Committee notes that the Charter is voluntary and it may suggest something
about its lack of prominence that local governments in this Inquiry did not cite the
Charter as a reference document for those involved in the planning process.
A submission from the Heart Foundation (Victoria) criticised the absence of health
and wellbeing considerations in the Charter, noting that it is a document which
specifically intends to promote liveability. The submission suggested the Charter
be re‐written to clearly articulate the need for provision of urban environments
that support health and wellbeing and to outline the design principles to realise
409 Department of Planning and Community Development, Submission No. 63, Attachment One, 7.

Inquiry into Environmental Design and Public Health in Victoria
74
this objective.410 The Committee supports this approach, but also believes further
consultation with local government, developers, the Office of the Victorian
Government Architect and the planning industry would be beneficial in clarifying
the Charter’s ongoing role and function.
Recommendation 17
That the Victorian Government reviews the Urban Design Charter to:
strengthen the role and function of the Charter in guiding Victorian urban design
ensure that design objectives which promote health and wellbeing are included in the Charter.
5.6 Planning panels
Under Part 8 of the Act, the Minister may appoint a panel to hear submissions
made about amendments to planning schemes and to make recommendations or
provide advice about whether or not amendments should proceed.411 Planning
panels are administered by Planning Panels Victoria (part of DPCD).
Planning Panels Victoria consists of the Chief Panel Member, six senior panel
members and approximately eighty sessional panel members who ‘provide a
source of expertise on planning, architecture, urban design, engineering,
environment and social planning.’412
The Committee heard discussion on whether planning panels should have access
to public health expertise, particularly where growth area developments are being
assessed. At a public hearing, Mr David Hodge, Acting Deputy Secretary, Planning
and Local Government (representing DPCD), commented on this proposal:
I think that is a good idea. We have professionals in relation to heritage, transport, traffic engineering, open space, architecture and design. There is absolutely no reason why that should not occur, particularly in matters that would relate to public health outcomes.413
Associate Professor John Fitzgerald, Acting Chief Executive Officer of VicHealth,
also confirmed the value of including public health experts in the planning process:
When we go to the Planning Institute of Australia and work with them on collaborative projects at the moment we say to them, ‘Listen, can we get you to put the health into the design on this master planned community down in Cranbourne. Wouldn’t it be good to put in some particular things that make healthy food choices better?’ But then we say, ‘Hang on a minute. We’re going to get a push back from the planners in this place and the planners over there’. Then we say, ‘Hang on. Why are planners making decisions around health?’. And they say, ‘Well, that’s who we’ve got’. And I ask, ‘Why haven’t we got health people on
410 Heart Foundation (Victoria), Submission No. 55, July 2011, 28. 411 Victorian Government, Planning and Environment Act 1987, s.153. 412 ‘Planning Panels Victoria’, Department of Planning and Community Development, 2012, http://bit.ly/HMJ185 accessed 10 October 2011. 413 Mr D Hodge, Department of Planning and Community Development, Transcript of Evidence, 31 August 2011, 143.

Chapter 5: Health in planning: legislation, guidelines and policy approaches
75
the technical panels?’ ‘It’s not part of the guidelines’. So it is a pretty easy fix just to get the conversation up at what is a critical stage in the precinct structure planning process. At a critical point you actually have a conversation between health planners and statutory planners.414
The need to foster the ‘conversation’ between health professionals and town
planners is identified in the literature415 and confirmed in survey evidence
presented by PIA (Vic), which showed that the planning profession currently does
not prioritise public health in the planning process. For their part, health
professionals need to be able to communicate the emerging evidence base to the
planning profession and others involved in land development who will ultimately
execute urban design changes.416 The Australian Medical Association Victoria
stated in a submission that ‘health professionals can make a significant
contribution to the planning processes for built environments.’417
The Committee believes that ensuring a public health perspective is represented
on panels in the planning of growth area communities is a practical suggestion to
improve the analytical rigour of PSPs and to foster the conversation between
health professionals and planning. Further, growth area planning would benefit
from the involvement of health specialists at the strategic level.
Recommendation 18
That Planning Panels Victoria ensures that all panels established as part of the
growth areas Precinct Structure Planning process have a public health specialist as
part of their membership.
Recommendation 19
That the Victorian Government appoints public health specialists (or persons with
appropriate health expertise) to the Boards of the Growth Areas Authority and
Urban Renewal Authority.
5.7 Melbourne Metropolitan Strategy
During the course of this Inquiry the Victorian Government began preparing a new
metropolitan strategy for Melbourne. The 30‐40 year strategy will replace strategic
plans prepared by the previous government (Melbourne 2030 and its successive
iterations). While limited information is available, statements by the Minister and
information on the DPCD website suggest that the new strategy will have a focus
on integrating transport infrastructure with urban growth.418
Released in 2002, Melbourne 2030 was developed through a comprehensive
consultation process, attracting over 1500 public submissions. A major objective of
414 Assoc Prof J Fitzgerald, VicHealth, Transcript of Evidence, 23 August 2011, 81. 415 H Frumkin, ‘Urban Sprawl and Public Health’, Public Health Reports, May‐June 2002, 117: 212. 416 C Hoehner et al, ‘Opportunities for Integrating Public Health and Urban Planning Approaches to Promote Active Community Environments’, American Journal of Health Promotion, 2003, 18 (1): 14‐20. 417 Australian Medical Association Victoria, Submission No. 23, 30 June 2011, 3. 418 ‘A New Melbourne Metropolitan Strategy’, Department of Planning and Community Development, 2011, http://bit.ly/rPPMJv accessed 10 October 2011.

Inquiry into Environmental Design and Public Health in Victoria
76
the plan was to channel a proportion of residential development away from the
fringe of the city and into existing suburban ‘activity centres.’ The plan called for
‘attractive, walkable and diverse communities.’419 Neighbourhoods were to be
designed around public transport and higher density mixed land use centres, and
supported with permeable street layouts and initiatives to promote walking and
cycling to facilities and services.420
Changed population projections led to an update to Melbourne 2030 entitled
Melbourne 2030: A Planning Update – Melbourne @ 5 million, released in
December 2008. Known as ‘Melbourne @ 5 million’, this update contained policy
settings that complemented the earlier plan, including: the commitment to a more
compact city through activity centres and employment corridors; the management
of growth through extensions to the growth areas and a density target of 15
dwellings per hectare; and enhanced links between Melbourne and regional
centres. As a submission from the Heart Foundation (Victoria) pointed out:
These initiatives all have direct impact on determinants for the health and wellbeing of current and future Victorians. However, like Melbourne 2030, Melbourne @ 5 million does not mention the relationship between these interventions and health impacts (positive or otherwise) on people. Words and phrases such as ‘vibrant’, ‘liveable’, ‘environmental consequences’, ‘sustainable options’, ‘landscape and economic values’, ‘resolution of biodiversity and settlement issues’, ‘social objectives’, and ‘lifestyle’ must be framed in the context of their impact on people’s health and wellbeing.421
The Committee believes that the preparation of a new ‘masterplan’ for the city
provides an important opportunity to include public health and wellbeing
considerations at the highest level of planning policy.
Recommendation 20
That the Victorian Government ensures the Melbourne Metropolitan Strategy
includes public health and wellbeing as a key goal supported by measurable
initiatives, such as the provision of walking and cycling infrastructure, public
transport and public open space. The Committee further recommends that the
Strategy provides for a review of implementation every five years.
5.7.1 Case Study: Health in All Policies
The terms of reference ask the Committee to examine the ‘consistency of policy
approaches across the Victorian Government in promoting health through
evidence based environmental planning and design measures.’ In this chapter, the
Committee has outlined several opportunities for achieving a coordinated
approach across the planning and health policy areas.
Health in All Policies (HiAP) is a whole‐of‐government approach to embedding
considerations of health and wellbeing across all South Australian (SA) government 419 Department of Infrastructure 2002 Melbourne 2030 – Planning for sustainable growth, Victorian Government, Melbourne, 3. 420 Department of Infrastructure 2002 Melbourne 2030 – Planning for sustainable growth. 421 Heart Foundation (Victoria), Submission No. 55, July 2011, 39.

Chapter 5: Health in planning: legislation, guidelines and policy approaches
77
departments and policies. The SA Government’s current annual expenditure on
health comprises 30 percent of its overall budget. If current health trends continue
– particularly the rising rates of preventable chronic disease – the Government
estimates that ‘health will consume the entire state government budget in less
than 25 years’.422
HiAP recognises that health and wellbeing is largely influenced by programs and
policy settings managed by government agencies other than the Department of
Health:
… the health and wellbeing of the population is shaped by the broad social, economic and physical factors – collectively called the social determinants of health – most of which are outside the control of the health sector. Housing, transport, education and the environment are all examples of factors that affect health and wellbeing which lie outside of the core function of health systems. The most significant improvements in health and life expectancy over the past 150 years are due to changes in these broader areas, and are not directly attributed to improvements in health care.
The HiAP literature emphasises that health has a major impact on the economy.
Figure 12 illustrates how the social determinants of health are interconnected with
factors leading to economic prosperity.
Figure 12: Health as an economic and social driving force
Source: Department of Health 2010 The South Australian approach to Health in All Policies: background and practical
guide, Government of South Australia, Adelaide, 8.
The SA Department of Health has appointed a HiAP Officer to work with the
Department of Planning and Local Government ‘to develop greater integration of
best practice health principles into planning policies, programs and protocols.’423
Early assessments of the program have been positive and the government is
currently refining the program’s evaluation processes.
422 Department of Health 2010 The South Australian approach to Health in All Policies: background and practical guide, Health in All Polices Unit, Government of South Australia, Adelaide, 9. 423 ‘Health in All Policies, South Australia’, Healthy Spaces and Places, Department of Health and Ageing, 2009, http://bit.ly/HDNCeW accessed 8 December 2011.

Inquiry into Environmental Design and Public Health in Victoria
78
Recommendation 21
That the Victorian Government, recognising that the work of all government
agencies influence health and wellbeing, adopts a whole‐of‐government approach
to health policy‐making, such as the ‘Health in All Policies’ model used by the
South Australian Government and the European Union.
5.8 Municipal Public Health and Wellbeing Plans
Under section 26 of the Public Health and Wellbeing Act 2008, Victorian councils
are required to prepare and annually review Municipal Public Health and
Wellbeing Plans (MPHWPs).424 These plans identify a municipality’s public health
and wellbeing needs based on its health status and social determinants of health.
The plans set out objectives and policy priorities for the promotion and protection
of health and wellbeing.425
The Public Health and Wellbeing Act 2008 requires MPHWPs to be consistent with
both the council plan (prepared under section 125 of the Local Government Act
1989) and the Municipal Strategic Statement (MSS) (prepared under section 12A of
the Planning and Environment Act 1987).426 A council must also have regard to the
State Public Health and Wellbeing Plan when preparing the MPHWP.427 Figure 13
illustrates this:
Figure 13: Relationship between Municipal Strategic Statements and Municipal Public Health and Wellbeing Plans
The MSS plays an important overarching role in the land use planning function of
local governments. It sets the high level strategic direction for all the controls in a
424 Public Health and Wellbeing Act 2008, s. 26. 425 Municipal Association of Victoria, Submission No. 61, 25 July 2011, 9. 426 Public Health and Wellbeing Act 2008, s. 26 (2)(e). 427 Public Health and Wellbeing Act 2008, s. 26 (3).

Chapter 5: Health in planning: legislation, guidelines and policy approaches
79
local planning scheme. Once signed off by the Minister, the MSS informs decision‐
making at a local level by statutory planners and, if necessary, at VCAT.428
The Planning and Environment Act 1987 requires that a MSS must contain (in part):
a) the strategic planning, land use and development objectives of the planning authority; and
b) the strategies for achieving the objectives; and
c) a general explanation of the relationship between those objectives and strategies and the controls on the use and development of land in the planning scheme.429
Several participants in the Inquiry pointed out that there is no requirement for a
council’s MSS – its key planning statement – to be consistent with or take into
account its own Public Health and Wellbeing Plan.430 The MPHWP often stands
alone, and a council’s public health and wellbeing needs, objectives and policies (as
articulated in the MPHWP) are unable to directly influence the local land use
planning system.431 Warrnambool City Council noted that the MPHWP has ‘little
power in ensuring action for health and wellbeing at the local level except through
the goodwill of Council’, whereas ‘the MSS has significant power as the guiding
policy document for urban planning.’432
In practice, very few council MSSs refer to health and wellbeing.433 Mr Jason Black
told the Committee:
… health and wellbeing needs should be included in the visions of all Municipal Strategic Statements which are contained in planning schemes. That is local government’s statement about what is important and what is envisaged within their community. We run these training courses, and we look at a lot of MSSs, or municipal strategic statements, and it is amazing how few of them actually speak about people and the outcome they envisage for people.434
Commenting on the need to strengthen the links between the MSS and the
MPHWP, and therefore between the Planning and Environment Act 1987 and the
Public Health and Wellbeing Act 2008, the City of Casey stated in a submission that
this would benefit planning decision‐making:
Improving in particular, the relationship between the [two Acts] would considerably enhance Council’s ability to apply health and wellbeing objectives in planning. Decision‐making in relation to health and wellbeing outcomes would be
428 Warrnambool City Council, Submission No. 13, 30 June 2011, 3. 429 Victorian Government, Planning and Environment Act 1987, s. 12A. 430 Victoria Council of Social Service, Submission No. 49, 8 July 2011, 3; Heart Foundation (Victoria), Submission No. 55, July 2011, 27; Mr J Black, Planning Institute of Australia (Victorian Division), Transcript of Evidence, 4 October 2011, 292. Note s.27 of the Public Health and Wellbeing Act 2008 allows a Council to apply to the Secretary of the Department to include their public health and wellbeing plan in their Council Plan or a strategic plan. 431 City of Ballarat, Submission No. 19, 30 June 2011, 5; Planning Institute Australia (Victorian Division), Cancer Council Victoria (SunSmart), City of Port Phillip, Physical Activity Australia, Victorian Council of Social Service and Victorian Local Governance Association, Submission No. 59, 13 July 2011, 17; City of Whitehorse, Submission No. 6, 24 June 2011, 1; Yarra Ranges Council, Submission No. 41, 20 June 2011, 4. 432 Warrnambool City Council, Submission No. 13, 30 June 2011, 3‐4. 433 Planning Institute of Australia et al, Submission No. 59, July 2011, 16. 434 Mr J Black, Planning Institute of Australia (Victorian Division), Transcript of Evidence, 4 October 2011, 292.

Inquiry into Environmental Design and Public Health in Victoria
80
significantly improved as the integration of the two Acts would provide Council the statutory weight required to formally refuse planning applications that provide poor health and wellbeing outcomes. Council has been limited in this area thus far as its own policies do not have the statutory weight required to withhold appeal of an application to the Victorian Civil and Administrative Tribunal, nor have the provisions under the planning scheme had enough strength to guide decision making in relation to health and wellbeing. Integration of these two Acts would also ensure that health and wellbeing is considered in more depth during the planning scheme amendment and PSP process.435
The Committee agrees that the links between the two Acts are strengthened by
aligning MPHWPs and MSSs, in order to improve the ability of a council’s public
health agenda to influence local government planning decisions.
Recommendation 22
That the Victorian Government amends section 12A(4) of the Planning and
Environment Act 1987 to require Municipal Strategic Statements to be consistent
with Municipal Public Health and Wellbeing Plans. Following this, the Government
should conduct an audit of Municipal Strategic Statements annually to monitor
compliance with the amendment.
5.9 Environments for Health Municipal Public Health Planning Framework
The Environments for Health Municipal Public Health Planning Framework (known
as ‘Environments for Health’) was introduced in 2001 as a standard reference for
local governments preparing MPHWP. It was reprinted in 2009 and supplemented
with a range of guides for health planners.
The Framework encourages councils to consider four environments that have an
impact on health: the social, built/physical, economic and natural environments.
Section 4.4.2 of the Framework discusses urban planning:
Physical and social environments play major roles in the health of communities. Since a principal focus of the planning profession is the design and creation of sound places for people, planning and public health professionals are intrinsically linked. Urban planning is a form of primary prevention and a contributor to health outcomes.436
A 2009 supplement to the Framework, Urban Design and Health, identifies aspects
of the built environment that influence population health and wellbeing and
suggests resources for local planners.
The Committee received consistent evidence on the effectiveness of Environments
for Health. In general, local government has found it a coherent and useful tool for
435 City of Casey, Submission No. 42, 6 July 2011, 20. 436 ‘Municipal Public Health Planning Framework – Part A’, Department of Health, 2009, http://bit.ly/uEhQ0G accessed 8 December 2011.

Chapter 5: Health in planning: legislation, guidelines and policy approaches
81
undertaking the MPHWP process.437 While many factors within the four health
environments are not solely within the ambit of local government, the
Framework’s ‘systems approach’ to public health is widely seen as a useful way to
conceptualise the issues and discuss them internally (within council) and with
external stakeholders.438
As an example, the City of Boroondara has structured the Boroondara Public
Health and Wellbeing Plan 2009‐13 around the Framework’s four health
environments and has also used the Framework to inform other projects and
plans, such as Creating an Age Friendly Boroondara and the Boroondara Mental
Health and Wellbeing research project.439
Local governments may also choose to build on the Framework by combining it
with other approaches. For example, the Shire of Nillumbik employs a Community
Resilience framework, which it describes as particularly relevant for communities
affected by bushfire and for the ageing community.440
The Committee heard discussion around the level of guidance and support
provided to councils to use Environments for Health. In particular, rural and
regional councils may lack the internal capacity for health and social planning and
may struggle to develop a health and wellbeing agenda, especially as it relates to
urban planning.441
The Committee also notes that a continuing shortage of professional planners in
Victoria is an area of concern. The PIA (Vic)’s 2004 National Inquiry into Planning
Education and Employment found that cities, regional and rural areas are all
suffering from the shortage, and that ‘Local government, as the largest employer
of planners, faces the biggest challenge with recruiting and retaining planners.’442
A 2011 Victorian analysis by the Department of Education, Employment and
Workplace Relations shows that there is still a significant shortage in the planning
profession.443
The Department of Health is able to assist local government with health and
wellbeing planning (the Committee received positive feedback on one such
program).444 In evidence to the Committee, the Department of Health stated:
We have worked closely with the MAV [Municipal Association of Victoria], with councils and through our regional offices with local government. We are
437 City of Whittlesea, Submission No. 26, 30 June 2011, 14; City of Boroondara, Submission No. 31, 27 June 2011, 17‐18; Ms C Hargreaves, Municipal Association of Victoria, Transcript of Evidence, 4 August 2011, 23; Wyndham City Council, Submission No. 62, 26 July 2011, 23; Yarra Ranges Council, Submission No. 41, 20 June 2011, 4; City of Melbourne, Submission, Number 44, 7 July 2011, 4. 438 City of Greater Bendigo, Submission No. 3, 22 June 2011, 5‐6; Wyndham City Council, Submission No. 62, 26 July 2011 23. 439 City of Boroondara, Submission No. 31, 27 June 2011, 17‐18. 440 Nillumbik Shire Council, Submission No. 60, 13 July 2011, 6. 441 Warrnambool City Council, Submission No. 13, 30 June 2011, 4. 442 Planning Institute of Australia 2004 Findings and Recommendations: National Inquiry Into Planning Education and Employment, PIA, Canberra, i; see also Victorian Local Governance Association 2011 Review of Victoria’s Overall Planning System Submission, VLGA, Melbourne, 2, 21, 23. 443 ‘Skill Shortage List Victoria’, Department of Education, Employment and Workplace Relations, 2011, http://bit.ly/I5dGQO accessed 15 March 2012. 444 City of Stonnington, Submission No. 40, 14 July 2011, 11.

Inquiry into Environmental Design and Public Health in Victoria
82
strengthening our ability to build the evidence base and evaluation that can support activities in local councils; for example, by increasing the survey sample size of the Victorian population health survey to enable disaggregation by local government area. We have also established a new centre called CEIPS, which is the Centre of Excellence in Intervention and Prevention Science. It has been created as an independent organisation to provide evaluation and research support for community action on public health and wellbeing. There are a number of other measures in terms of the frameworks and tools we have provided and some workforce development programs. Examples of the resources and guides that have been prepared are available on the website.445
However, Inquiry participants were clear on the need to expand and continually
reinforce this support at the local government level.446 One of the authors of a
2006 evaluation of the Environments for Health Framework informed the
Committee:
One of the things we found was that giving guidance once does not work. You have to keep giving guidance all the time. You have to keep supporting people in doing this. Capacity building really should not be just a one off, a brochure or a book or something that has been given; it should be continuous.447
The Committee heard discussion on the evaluation phase of the health planning
process, with some councils commenting that while the Public Health and
Wellbeing Act 2008 asks for annual evaluations of the MPHWP, there is little
direction on what the evaluation should entail.448 The City of Boroondara, for
example, called for continued support and resources to use indicators to measure
community outcomes in the social, built, economic and natural environments.
In further evidence to the Committee at a public hearing, the Department of
Health confirmed the need to assist councils with the Framework, in particular the
evaluation process:
We have started, in conjunction with one of our regions, to develop some tools to support councils in reviewing. The Act does require that municipal public health and wellbeing plans are reviewed annually, and we are developing some tools to assist councils to do that. I would certainly take on board that there is a lot more to be done, and we need to really know what is being achieved through that process and where it may be necessary to adjust or take stock of what is being achieved so that we can ensure that we are really getting the outcomes that we need.449
The Committee finds that Environments for Health is well regarded and should be
retained. However, it would be timely to re‐evaluate and revise the Framework as
part of ongoing improvement and development.
445 Mr C Sindall, Department of Health, Transcript of Evidence, 14 September 2011, 276. 446 Victorian Healthcare Association, Submission No. 22, 29 June 2011, 5; Yarra Ranges Council, Submission No. 41, 20 June 2011, 4; Prof E de Leeuw, Transcript of Evidence, 7 September 2011, 226. 447 Prof E de Leeuw, Transcript of Evidence, 7 September 2011, 226. 448 City of Boroondara, Submission No. 31, 27 June 2011, 18; East Gippsland Shire Council, Submission No. 57, 15 July 2011, 3. 449 Mr C Sindall, Department of Health, Transcript of Evidence, 14 September 2011, 280.

Chapter 5: Health in planning: legislation, guidelines and policy approaches
83
Recommendation 23
That the Department of Health reviews and updates Environments for Health and
provides ongoing assistance to local government to use the framework in
preparing Municipal Public Health and Wellbeing Plans.
Recommendation 24
That the Department of Health provides guidance to local governments to evaluate
Municipal Public Health and Wellbeing Plans and to benchmark with other
municipalities.
5.9.1 Shade
The Committee received evidence from SunSmart (the skin cancer control program
of Cancer Council Victoria) focusing on the provision of shade as a means of
preventing skin cancer. More than 40,000 cases of skin cancer are diagnosed in
Victoria each year. The cost to the Australian health system is estimated at over
$300 million annually – the most costly burden on the health system of all
cancers.450
In 2009 SunSmart commissioned an audit of MPHWPs. The audit found that fewer
than 20 percent mentioned shade, sun protection or skin cancer. Only 12 of 62
MPHWPs had an action that involved explicit mention of shade, sun or skin cancer,
usually in the background document rather than the Plan.451 Around 45 percent of
people report that finding shade at their local park or playground is difficult and,
according to SunSmart, there is evidence that people in lower socio‐economic
areas have less access to shade.452
The Committee heard that building design and orientation and the layout of
streetscapes can all make a contribution to creating shade and a more attractive
environment for physical activity:
Mr SCHEFFER — You mentioned a range of locations where people are particularly susceptible to —
Ms HEWARD — Getting sunburnt.
Mr SCHEFFER — At parks and sports fixtures and so forth. I want to just come to the urban environment — the streetscape. This is a conversation we have had here previously. We ask for setbacks in upper storeys, which lets more light into the street, and then we put in trees or we put in umbrellas or whatever it is. The options would be not to have setbacks and to use awnings over footpaths like in earlier times, or cantilevered buildings where the upper storeys go in to protect the street and the walking areas from hot sun. Have you had any conversations around alternative streetscape design like that that might make people’s shade access and amenity a bit better?
450 Cancer Council Victoria (SunSmart), Submission No. 30, 30 June 2011, 2. 451 Cancer Council Victoria (SunSmart), Submission No. 30, 30 June 2011, 4. 452 Mr J Scheffer and Ms S Heward, Cancer Council Victoria (SunSmart), Transcript of Evidence, 6 September 2011, 161.
Inquiry into Environmental Design and Public Health in Victoria
84
Ms HEWARD — It is probably fair to say that trying to have a conversation about shade goes nowhere at this point because there is no obligation for shade to even be thought about. If you asking which one we think would be better, really what we know is that aesthetically people will be more physically active where there is shade. They like the look and feel of shade. They know it is not going to be too hot even though it is actually not the heat that burns you; it is UV. But we struggle to even get shade talked about at any point; it is just not a consideration. It is so far down the track that it does not even get discussed.453
The Committee notes that SunSmart has recently developed resources to assist
local government, including a shade policy framework, a statement and set of
actions for incorporation into MPHWP, and a shade audit tool for assessing shade
provision.
The Committee found the case made by SunSmart to be compelling. The lack of
consideration of shade in MPHWPs is concerning and an issue of direct relevance
to this Inquiry. In urban areas the provision of shade – whether from tree canopies
or purposes built structures – is likely to lead to a streetscape that is more inviting
and conducive to physical activity. School premises, parks and sporting facilities are
other locations where shade provision is important in creating a comfortable
environment for recreation and exercise.
Recommendation 25
That the Department of Health works with SunSmart and local governments to
ensure that UV protective shade measures are included in Municipal Public Health
and Wellbeing Plans. This should be followed with regular audits of the Plans to
monitor compliance with the measures.
453 Ms S Heward, Cancer Council Victoria (SunSmart), Transcript of Evidence, 6 September 2011, 162‐163.

Chapter 6: Parks and open spaces
85
Chapter 6: Parks and open spaces
… well‐designed, planned and managed urban green spaces provide significant aesthetic, social, psychological and environmental benefits for all people. It is important that health and wellbeing is enhanced and supported, through providing accessible green spaces in all neighbourhoods.454
Chapters 2 to 4 reviewed the literature linking aspects of urban design to impacts
on public health. This chapter will examine the evidence that one of the most
significant aspects of the built environment to impact positively on health is
provision of parks and other public spaces.455
Since the mid‐nineteenth century, Victorian governments have reserved public
land for parks.456 Melbourne City Council recorded in 1844, ‘It is of vital importance
to the health of the inhabitants that there should be parks [where] the kindliest
feelings of human nature are cherished’.457 The 1954 Melbourne Metropolitan
Planning Scheme stated:
It is now universally recognised that facilities for relaxation and exercise outdoors are an essential part of urban living, and that the provision of these facilities is a responsibility of civic administration.458
Today’s estimated 67,000 hectares of public open space in the Melbourne
metropolitan area are recognised as a key contributor to the city’s popularity and
liveability.459
There is considerable evidence that contact with nature and green spaces can have
multiple positive impacts on a community’s physical, mental and social health.460
One meta‐analysis of more than 120 international studies examining the effect of
outdoor environments on physical and mental health concluded:
Landscapes have the potential to promote mental well‐being through attention restoration, stress reduction, and the evocation of positive emotions; physical well‐being through the promotion of physical activity in daily life as well as leisure time and through walkable environments; and social well‐being through social integration, social engagement and participation, and through social support and security.461
454 beyondblue, Submission No. 9, June 2011, 4. 455 H Frumkin, ‘Healthy Places: Exploring the Evidence’, American Journal of Public Health, September 2003, 93 (9): 1452‐1453. 456 Victorian Environmental Assessment Council 2009 The Contribution of Public Land to Melbourne’s Liveability, Victorian Government, Melbourne, 99. 457 ‘A Garden City’, Public Record Office Victoria, 2012, http://bit.ly/HtxPyN accessed 1 February 2012. 458 Melbourne and Metropolitan Board of Works 1954 Melbourne Metropolitan Planning Scheme 1954: Report, Melbourne, 77, http://bit.ly/HEhD2t accessed 12 October 2011. 459 Victorian Environmental Assessment Council 2011 Metropolitan Melbourne Investigation Final Report, 5. 460 M Townsend and M Ebden, Feel Blue, Touch Green, People and Parks Foundation and Deakin University, Melbourne, 2006, 3; Australian Institute of Landscape Architects, Submission No. 12, 27 June 2011; Parks Victoria, Submission No. 29, June 2011, 5; Australian Institute of Health and Welfare 2011 Health and the environment: a compilation of evidence, AIHW, Canberra, vii‐1; beyondblue, Submission No. 9, June 2011, 4; C Maller et al, Healthy parks, healthy people – The health benefits of contact with nature in a park context, A review of relevant literature, Deakin University and Parks Victoria, Melbourne, 2008, 1. 461 A Abraham et al, ‘Landscape and well‐being: a scoping study on the health‐promoting impact of outdoor environments’, International Journal of Public Health, February 2010, 55(1): 59‐69.

Inquiry into Environmental Design and Public Health in Victoria
86
Parks and open spaces provide places to exercise, to relax away from the pace and
noise of urban living, to build a sense of community, to protect and encourage
biodiversity, and to mitigate the impacts of climate change. Parks Victoria’s
strategy Healthy parks, healthy people states that green spaces:
… can reduce crime, foster psychological wellbeing, reduce stress, boost immunity, enhance productivity, and promote healing. In fact, the positive effects on human health, particularly in urban environments, cannot be over‐stated … contrary to popular thinking, humans may be dependent on nature for psychological, emotional, and spiritual needs that are difficult to satisfy by other means. Findings so far demonstrate that access to nature plays a vital role in human health, wellbeing, and development that has not been fully recognised.462
The Committee received evidence that both public and private open space in
Victoria is decreasing.463 The trend towards smaller suburban backyards was noted
in the Inquiry; as Counsellor Glenn Goodfellow of the City of Wyndham expressed,
‘I can remember as a kid that you would go out into the backyard, climb up a tree
and have fun. That has all gone.’464 This is attributed by many in the development
industry to consumer preference for using outdoor space as an extension of the
house’s living and entertaining areas, larger housing sizes and smaller lots.465
While the average size of new houses in Australia increased substantially from the
mid‐1980s to the mid‐1990s, industry analysis and recent data suggest this may be
reversing. According to CommSec research, the average size of a new house may
have peaked in 2008‐9 at a record 248 square metres; this fell back to around 214
square metres in March 2011.466 Consistent with this, Australia’s biggest listed new
home builder, Stockland, has cut the average size of house and land package plots
by almost 20 percent over the past three years (to 481 square metres).467
Reflecting on the implications for private space of smaller houses and smaller lots,
the Managing Director of Peet Pty Ltd, a leading property group and estate
developer, states that many consumers ‘now don’t want a large backyard which
requires time‐consuming maintenance, but would like landscaped parks and open
spaces nearby.’468
In July 2011 the Minister for Planning, Matthew Guy, announced that single
dwellings on lots smaller than 300 square metres would now be exempt from the
requirement to obtain a planning permit.469 The change aims to make it faster and
462 C Maller et al, Healthy parks, healthy people, 1. 463 Victorian Environmental Assessment Council 2011 Metropolitan Melbourne Investigation Final Report, 1; see also Prof A Capon, ANU National Centre for Epidemiology and Population Health, Transcript of Evidence, 4 August 2011, 35. 464 Cr G Goodfellow, Wyndham City Council, Transcript of Evidence, 23 August 2011, 126. 465 M Kelly, ‘How big is my castle?’ The Australian, 20 November 2010, http://bit.ly/Inz5He accessed 24 November 2011. 466 S Parker, ‘Australian home size looks set to fall’, Real Estate Business, 22 August 2011, http://bit.ly/InzcCG accessed 14 September 2011. 467 M Yardney, ‘The Great Australian Dream is Shrinking’, Property Update, 29 February 2012, http://bit.ly/Inzlpu accessed 1 March 2012. 468 M Yardney, ‘The Great Australian Dream is Shrinking’. 469 M Guy, ‘Red tape reduction to help housing affordability’, media release, Growth Areas Authority, Victorian Government, 14 July 2011, http://bit.ly/HCOD99 accessed 20 March 2011.

Chapter 6: Parks and open spaces
87
simpler for smaller and more diverse housing types to be constructed in certain
areas.470
A 2011 report by the Victorian Environmental Assessment Council warned that
‘Melbourne’s increasing urban density and expansion will negatively impact on the
quantity and quality of Melbourne’s public open space and its remaining
biodiversity values.’471 For many adults and children living and working in highly‐
developed urban areas, public parks may well be the only spaces they have for
contact with nature.472
6.1 Physical benefits
… natural environments offer low‐cost preventative and remedial opportunities for public
health. 473
As discussed in this report, encouraging more Victorians to engage in physical
activity will be a critical part of the state’s response to the challenges of chronic
disease and obesity.
Parks and public spaces provide opportunities for physical exercise, whether
walking, cycling, jogging or participating in organised sport. Research consistently
associates living near to parks and other recreational spaces with higher physical
activity levels for both adults and young people.474 A study of the impact of urban
form on public health by Professor Billie Giles‐Corti showed that the annual
prevalence for 15 out of 24 diseases was lower for populations living in
environments with nearby areas of green space.475 Another study showed that
people are more likely to walk for exercise if they live near attractive, large public
open spaces that encourage a diversity of uses and users.476
Interaction with nature has been shown to help reduce blood pressure and stress
levels,477 and can promote healing in patients suffering from severe trauma,
cancer478 and surgery.479 Trees improves air quality by capturing particulate matter
and air pollutants480 and intercept up to 90 percent of direct sun heat on
470 ‘Small Lot Housing Code: Info Sheet’, Growth Areas Authority, 2011, 1, http://bit.ly/HF29Yv accessed 12 October 2011. 471 Victorian Environmental Assessment Council 2011 Metropolitan Melbourne Investigation Final Report, 1. 472 C Maller et al, Healthy parks, healthy people, 1; M Townsend and and R Weerasuriya, Beyond Blue to Green: The benefits of contact with nature for mental health and well‐being, beyondblue, Melbourne, 2010, 18; Victorian Environmental Assessment Council 2009 The Contribution of Public Land to Melbourne’s Liveability, Victorian Government, Melbourne, 98; Parks Victoria, Submission No. 29, June 2011, 12. 473 The Value of Parks, Parks Forum, 2008, 9. 474 L Shoup and R Ewing, ‘The Economic Benefits of Open Space, Recreation Facilities and Walkable Community Design’, Active Living Research, March 2010, 1‐28. 475 B Giles‐Corti, ‘The impact of urban form on public health’, paper prepared for the 2006 Australian State of the Environment Committee, Department of the Environment and Heritage, Canberra, 2006, 6. 476 B Giles‐Corti et al, ‘Increasing Walking: How Important Is Distance To, Attractiveness, and Size of Public Open Space?’ American Journal of Preventive Medicine, 2005, 28 (2S2): 169. 477 R Mitchell and F Popham, ‘Effect of exposure to natural environment on health inequalities’, The Lancet, 8 November 2008, 372 (9650): 1655. 478 Parks Victoria, Submission No. 29, June 2011, 6. 479 R Mitchell and F Popham, ‘Effect of exposure to natural environment on health inequalities’, 1655. 480 VicHealth, Submission No. 47, 11 July 2011, 9.

Inquiry into Environmental Design and Public Health in Victoria
88
buildings.481 Through its evaporative cooling qualities, a single tree can have the
same impact on reducing ambient temperatures as five room air conditioners,
running 20 hours a day.482 The Australian Institute of Landscape Architects (AILA)
noted in their submission that investing in ‘green infrastructure’ in urban
environments, such as planting gardens on buildings’ roofs, will further help to
reduce heat island effects.483
6.1.1 Case study: Active in Parks program
Under the auspices of Parks Victoria, a unique pilot study promoting the links
between parks and physical wellbeing has begun in Geelong. The Active in Parks
program is the first of its kind in Victoria and involves partnerships between over
20 local and national community, government, education and medical groups.
These include People and Parks Foundation, the General Practitioners Association
of Geelong, the Departments of Health and Planning and Community
Development, Deakin University, the Heart Foundation, the YMCA, the G21
organisation and the Geelong Regional Library Corporation.484 Private health
insurer Medibank Private is the principal sponsor of the program.
The program aims to use the health benefits of parks as a preventative health
tool.485 A range of health professionals including doctors, maternal health nurses
and social workers will ‘prescribe’ park visits to improve the health and wellbeing
of their patients and clients.486
The program features a calendar of community‐wide activities and events, such as
developing community gardens, discovery walks, horse and bike‐riding trails,
sports competitions and outdoor reading programs.487 Parks Victoria hopes this
project will be the model for future similar state‐based programs.
An update in January 2012 suggests that the program has met with some success
among diverse groups such as at‐risk youth, refugees and recent immigrants,
schoolchildren and people suffering from mental illness.488 According to a survey of
173 participants who were referred to the program by General Practitioners:
85 percent stated they will participate in physical activity independently now
participants reported a range of benefits including fresh air, friendship, trying new activities, getting out of the house, getting active and improved mood
481 Australian Institute of Landscape Architects, ‘National Policy Statement: School Landscapes’, AILA, Canberra, 2010, 1. 482 Australian Institute of Landscape Architects, ‘National Policy Statement: School Landscapes’, 1. 483 Australian Institute of Landscape Architects, Submission No. 12, 27 June 2011, 10; City of Stonnington Submission No. 40, 14 July 2011, 4; Deakin University’s Centre for Physical Activity and Nutrition Research, Submission No. 16, 30 June 2011, 1‐3; Northern Alliance for Greenhouse Action, Submission No. 18, 30 June 2011, 2. 484 ‘Geelong's Active in Parks – A Healthy Parks Healthy People program’, Geelong’s Active in Parks, 2012, http://activeinparks.org/ accessed 12 December 2011. 485 Parks Victoria, Submission No. 29, June 2011, 14. 486 ‘Nature the best medicine for Geelong region: innovative trial to prescribe parks for better health’, Geelong’s Active in Parks, 2012, http://activeinparks.org/?p=1274 accessed 10 January 2012. 487 ‘Geelong's Active in Parks – A Healthy Parks Healthy People program’, Geelong’s Active in Parks. 488 ‘Case Studies HPHP active in parks January 2012’, Active in Parks pamphlet, 2012.

Chapter 6: Parks and open spaces
89
participants’ feedback included feelings of increased confidence and enthusiasm; comments included ‘tried things I would never have tried’ and ‘good to take time to exercise, will walk more often’.489
The Committee believes this program provides an innovative model for
encouraging various forms of physical activity in communities around the state.
The use of corporate sponsorship and the engagement with primary health
providers and community groups is particularly noteworthy.
Recommendation 26
That the Victorian Government takes note of the outcomes of Parks Victoria’s
innovative Active in Parks program and identifies opportunities to develop similar
partnerships involving Parks Victoria, the public and private health sectors, local
government and community groups.
6.2 Psychological benefits
While the physical benefits of parks and contact with nature are evident, the
psychological benefits are equally important. Some psychologists believe that
increasing rates of mental illness in Western society can be partially attributed to
people’s increasing alienation from nature through mass urbanisation.490 As
beyondblue’s report Beyond Blue to Green details, recent research has focused on
‘health effects of environmental degradation, with little attention paid to
environmental deprivation.’491 Studies show that ‘ecotherapy’ – interaction with
nature – can aid in alleviating depression and anxiety disorders,492 including
postnatal depression which affects around 15 percent of Australian childbearing
women.493
Parks Victoria gave evidence to the Committee that ‘contact with nature helps
reduce stress and build resilience, enabling people to cope with and recover from
stressful episodes’.494 Some of these benefits include:
[A] place to escape from school, university or workplace stressors or concerns; it provides a refreshing change of scenery; it helps to lift and improve the mood; it lowers levels of anxiety; it lowers levels of stress; there are improvements in the symptoms of depression; and it also promotes endorphins through increased physical activity.495
A comprehensive study conducted by beyondblue and Deakin University showed
that in conjunction with appropriate medical treatment, participants with
depressive or anxiety disorders greatly benefited from exposure to natural
environments in a range of nature‐based community activities, including ‘skill
development, improving social networks, and developing an affinity with the
489 ‘Case Studies HPHP active in parks January 2012’, Active in Parks pamphlet, 2012, 2. 490 B Walsh, ‘“Eco‐Therapy” for Environmental Depression’, Time, 28 July 2009, http://ti.me/1vBrm4 accessed 4 October 2011. 491 M Townsend and R Weerasuriya, Beyond Blue to Green, 2. 492 beyondblue, Submission No. 9, June 2011, 2. 493 The Value of Parks, Parks Forum, 2008, 9. 494 Parks Victoria, Submission No. 29, June 2011, 6. 495 Ms S Pope, beyondblue, Transcript of Evidence, 7 September 2011, 256.
Inquiry into Environmental Design and Public Health in Victoria
90
natural environment’.496 In another study of people suffering from mental illness,
90 percent of subjects who spent time in outdoor environments ‘indicated that
green exercise activities had benefited their mental health, they had greater self
esteem, focus of mind, were more relaxed, more motivated, enjoyed an improved
quality of life, and felt “refreshed and alive”.’497
These findings underpin the popular ‘care‐farming’ initiatives in Europe and the
UK, in which vulnerable groups such as those with mental illness, adults and
children with learning difficulties, at‐risk youth and recovering addicts spend time
on farms and contribute to their daily running.498 Care farming has had limited
implementation in Australia with groups such as at‐risk youth and elderly dementia
sufferers, but has the potential to expand considerably as early pilot programs
have met with success.499
The Committee heard that parks and public spaces also build social capital by
providing opportunities for people to interact, decreasing the social isolation
experienced by many people suffering from mental illness.500 Parks and green
spaces provide opportunities for social gatherings like picnics and barbeques, and
for regular group programs such as environmental education, sports and
conservation activities.501
6.3 Children’s development
Contact with nature is vitally important in children’s physical and mental development, and integrated outdoor educational areas can measurably enhance learning opportunities.502
Apart from the physical activity it can provide, research has demonstrated that
contact with nature helps develop an essential range of children’s cognitive
functions,503 including a sense of identity and autonomy, psychological resilience,
and developing a sense of empathy.504 Daily exposure to green environments can
also help reduce children’s stress, increase their ability to focus and ‘the more
plants, green views and access to natural play areas, the more positive the
496 M Townsend and M Ebden, Feel Blue, Touch Green, 47‐48. 497 The Value of Parks, Parks Forum, 25. 498 K Brown, ‘Care Farms – an overview’, University of Brighton, http://bit.ly/yiAWUx; ‘What is Care Farming?’ Care Farming UK, http://www.carefarminguk.org/ accessed 5 January 2012. 499 ‘Triple Care Farm’, Sir David Martin Foundation, Sydney, 2006, http://bit.ly/Q6AXb; ‘Triple Care Farm graduates celebrate fresh start’, Mission Australia, 2011, http://bit.ly/uwIH5x; J Elliott, ‘Australian First Solely Dedicated Care Farm to Assist People with Dementia’, media release, Department of Health, Victorian Government, 8 December 2008, http://bit.ly/xCCIwO; ‘St Laurence – Our history’, St Laurence, Lara, http://bit.ly/I812gy; ‘Dementia‐friendly environments – a guide for care’, Department of Health, Melbourne, 2011, http://bit.ly/AxRfK8 accessed 5 January 2012; see also Outer Suburban/Interface Services and Development Committee 2010 Inquiry into Sustainable Development of Agribusiness in Outer Suburban Melbourne, Parliament of Victoria, Melbourne, 258‐260. 500 Victorian Council of Social Service, Submission No. 49, 8 July 2011, 6; Victorian Environmental Assessment Council 2009 The Contribution of Public Land to Melbourne’s Liveability, 98. 501 The Value of Parks, Parks Forum, 11. 502 Australian Institute of Landscape Architects, ‘National Policy Statement: School Landscapes’, 1. 503 beyondblue, Submission No. 9, June 2011, 3. 504 Ms S Pope, beyondblue, Transcript of Evidence, 7 September 2011, 256.
Chapter 6: Parks and open spaces
91
results’.505 Conversely, a lack of exposure to nature has been linked to the
development of attention deficit disorders and depression in children.506
This has significant implications for designing children’s educational and childcare
settings:
Children who experience school grounds with well designed, diverse, natural play areas are significantly more physically active, more aware of nutrition, more civil to one another, and more creative. High‐quality landscaping in school grounds is also closely correlated with increased involvement by adults and members of the nearby community.507
AILA has suggested maximising children’s health benefits by building ‘intelligent
school landscapes’ which:
consider outdoor spaces to be as important as the indoors in overall school development
respect the capacity of the school grounds to function as a learning environment as well as a setting for social and recreational activity
maximise opportunities for connection between indoor and outdoor spaces, to enhance learning outcomes
creatively accommodate a broad range of learning and recreational activities, to support a diversity of physical and social needs
are ecologically sustainable, linked to the curriculum and integrated into the school planning processes
employ collaborative, inclusive strategies to allow students, teachers and the local community to participate in the planning, design and management of the school landscape
respect the value of interaction with the natural environment for human health and well‐being
provide a resource for the local community – recreation, sports and social events.508
Even if a child’s home environment does not provide green space, studies show
that children who live near a park are more likely to be active outside school.509 A
US study showed that children who lived near green spaces over a two‐year period
had lower Body Mass Indexes than children who did not, leading the authors to
suggest that ‘Greenness may present a target for environmental approaches to
preventing child obesity.’510
505 Australian Institute of Landscape Architects, ‘National Policy Statement: School Landscapes’, 2. 506 Victorian Environmental Assessment Council 2009 The Contribution of Public Land to Melbourne’s Liveability, 98; Australian Institute of Landscape Architects, ‘National Policy Statement: School Landscapes’, 1. 507 Australian Institute of Landscape Architects, ‘National Policy Statement: School Landscapes’, 2; see also VM Romero, ‘“I will be not a nerd”: Children’s Development, the Built Environment and School Travel’, paper presented at State of Australian Cities Conference, Adelaide, 29 November 2007, 1003. 508 Australian Institute of Landscape Architects, ‘National Policy Statement: School Landscapes’, 1‐2. 509 B Giles‐Corti, Transcript of Evidence, 4 August 2011, 13. 510 JF Bell et al, ‘Neighborhood greenness and 2‐year changes in body mass index of children and youth’, American Journal of Preventive Medicine, December 2008, 35 (6): 547‐553.

Inquiry into Environmental Design and Public Health in Victoria
92
Unfortunately, there has developed a pervasive ‘culture of fear’ among many
Australian parents in allowing their children to play in outdoor areas.511 A
VicHealth study suggested that this stems from a mix of changing social and
cultural factors:
There is certainly a range of qualitative evidence and circumstantial detail suggesting a real restriction to children’s geographical or area‐based range of independent mobility. There is also a reasonable case to be made that initiatives put in place to address community and personal safety have had the unintended consequence of heightening parental caution and increasing vigilance, if not actual fear and anxiety. By far though, the evidence shows there have been substantial changes in Australian family life linked to work, employment, the extension of the lifespan, the lowering of the age range for early childhood education and the need for care outside of the home. These factors, and exerting inexorable forces upon the shape of daily activity and routine, impart clear restrictions on where children can be left unsupervised, who can supervise them, the rules for transferring duty of care, and general tolerance for children having a ‘freer range’ of independent mobility.512
American author Richard Louv coined the phrase ‘nature deficit disorder’ to
describe a phenomenon suffered by children who do not having adequate contact
with the outdoor world, particularly in being prevented from unstructured
independent play:
For this generation, nature is more of an abstraction than a physical reality. Kids today can tell you about the Amazon rainforest, but not about the last time they went into a wood alone. Nature is something to watch from a distance, something to consume. Something very profound has happened in children's relationship to nature … What we're doing instead is instilling in kids a kind of ecophobia. We're overloading them with scenarios of fear and disaster – worry about the ‘environment’ is crushing kids’ relationship with nature.513
6.4 Quality of green and public spaces
While it is important to provide areas of green open space for communities, their
inherent health and wellbeing benefits ‘are largely determined by the quality,
quantity, and accessibility of these green spaces.’514 Studies show that there is
often a relationship between income status and green spaces – in general, the
higher socio‐economic level an area, the better quality parks there will be. A UK
study showed that ‘Populations that are exposed to the greenest environments
also have lowest levels of health inequality related to income deprivation.’515 The
same is true of green space’s positive effects on mental health, where the quality
of the space has more influence than its size.516
511 Australian Medical Association Victoria, Submission No. 23, 30 June 2011, 2; S Zubrick et al, Nothing but fear itself: parental fear as a determinant of child physical activity and independent mobility, VicHealth, Melbourne, 2010, 3‐4. 512 S Zubrick et al, Nothing but fear itself, 3. 513 J Henley, ‘Richard Louv: Let them climb trees’, The Guardian, 5 June 2010, http://bit.ly/96ufdD accessed 10 December 2011; see also Sustainable Population Australia (Victorian branch), Submission No. 48, 1. 514 beyondblue, Submission No. 9, June 2011, 4; Prof B Giles‐Corti, Transcript of Evidence, 4 August 2011, 13‐14. 515 R Mitchell and F Popham, ‘Effect of exposure to natural environment on health inequalities’, 1655. 516 UWA Centre for the Built Environment and Health, Submission No. 27, 29 June 2011, 2.
Chapter 6: Parks and open spaces
93
In Victoria, the amount of open space between low income and high income areas
differs little, but the quality of the spaces and parks in disadvantaged
neighbourhoods is often worse.517 beyondblue informed the Committee that
mental health is better for people from low income groups that have access to
green spaces than those that do not.518
However public spaces do not necessarily have to be ‘green’ to have physical and
psychological benefits – any well‐designed public open space (such as a piazza or
public square) provides a destination to walk or cycle to and provides
opportunities to gather for recreation and build social capital.519 Several
contributors to the Inquiry mentioned the value of non‐traditional spaces
facilitating social interaction, such as urban art installations or interactive play
spaces.520
Quality parks also need not be large, or even permanent. Small ‘pocket parks’ can
be created between built‐up inner urban areas, providing ‘much needed green
space and amenity in areas where open space is limited.’521 Another recent trend is
‘pop‐up parks’, where local councils set up temporary community ‘green’ spaces.
For example, Maribyrnong City Council developed a pop‐up park on Ballarat St,
Yarraville, for the period of February to April 2012. It consisted of ‘large planters,
synthetic turf, tables, chairs and umbrellas to create a stimulating space in the
heart of Yarraville Village for people to come together, relax and enjoy village
life.’522 In another example, San Francisco city permits allow ‘mobile gardens’
housed in large containers to temporarily take over car park spaces and other
urban areas, ‘intended as a shot of mobile nature offering passers‐by visual relief
from asphalt and concrete.’523
The Committee heard evidence that the best quality public green spaces are those
that have multiple uses, providing ‘diversified amenities to cater across ages,
abilities, and time usage to increase participation and promote “affordable
recreation” – where everybody gets to play’.524 Mixed use spaces can benefit a
community in many ways, from providing parks and passive recreation areas to
sports and other community activities, all contributing to ‘building cultural identity
at a local, regional and metropolitan level.’525
517 Deakin University’s Centre for Physical Activity and Nutrition Research, Submission No. 16, 30 June 2011, 2; Centre of the Built Environment and Health, Submission, 3. 518 Ms S Pope, beyondblue, Transcript of Evidence, 7 September 2011, 256. 519 Doctors for the Environment Australia Inc., Submission No. 51, 11 July 2011, 9; Ms S Pope, beyondblue, Transcript of Evidence, 7 September 2011, 257. 520 Ms S Pope, beyondblue, Transcript of Evidence, 7 September 2011, 257; Australian Institute of Landscape Architects, ‘National Policy Statement: Public Art and Landscape’, AILA, Canberra, 2010, 1‐2; City of Boroondara, Submission No. 31, 27 June 2011, 8; City of Stonnington, Submission No. 40, 14 July 2011, 3, 5. 521 City of Stonnington, Submission No. 40, 14 July 2011, 3, 7; see also Heart Foundation (Victoria), Submission No. 55, July 2011, 19. 522 ‘Pop‐Up Park for Yarraville’, Maribyrnong City Council, 26 March 2012, http://bit.ly/xn3gPH accessed 29 March 2012. 523 J King, ‘“Parkmobiles” bring taste of nature to urban S.F.’, San Francisco Chronicle, 2 August 2011, http://bit.ly/nHj3Uy accessed 29 March 2012. 524 Australian Institute of Landscape Architects, Submission No. 12, 27 June 2011, 9. 525 Victorian Environmental Assessment Council 2009 The Contribution of Public Land to Melbourne’s Liveability, 99.

Inquiry into Environmental Design and Public Health in Victoria
94
In their submission, AILA discussed the challenge of providing adequate open
spaces within the current Victorian planning system. The minimum requirements
for facilities such as walking paths, play equipment, seating, shade and trees ‘is
largely discretionary’, resulting in public open spaces that have ‘minimal recreation
opportunities’.526
At a public hearing, Ms Kellie‐Ann Jolly of the Heart Foundation (Victoria) talked
further about the importance of tailoring public spaces to the particular needs of
each community:
The other thing we could do sometimes is to actually ask the community there what they would like from their park. We forget to find out what the community wants, and there are demographic changes over time in suburbs, as we all know. I live in the City of Boroondara, where we have lots of open green space, but sometimes when you go to our local oval nobody is there. It is a wonderful open green space, but nobody is there. I went to a place in Carlton, a small park, but it was packed with people. I was trying to work out what it was that was different about the park we have at the end of our street and the park in Carlton … There is a bocce rink at the Carlton park, and there was a group of Italian people playing bocce. There were children, a barbecue area, kicking a football and a variety of activities and recreational opportunities in that park. The ovals are much the same. You can do things around the edge of the park, and you can provide a variety of different playgrounds and equipment. For older people there are opportunities for them to do things like that, such as croquet, bocce or any of those sorts of things … it is about trying to build that sense of community so that people have a sense that it is their park and not the council’s park.527
Recommendation 27
That the Victorian government establishes targets for the provision of green and open public spaces.
Recommendation 28
That the Victorian Government takes the following steps to ensure high quality
open spaces are available:
amends the Precinct Structure Planning Guidelines to establish minimum requirements for open space, including features such as walking paths, play equipment, adult exercise equipment, seating and shade
provides guidance to local government on appropriate rating tools for assessing the quality of public open space
supports the ongoing maintenance of existing open space and the establishment of green and other public spaces in new residential developments, particularly in high density areas.
526 Australian Institute of Landscape Architects, Submission No. 12, 27 June 2011, 11. 527 Ms K Jolly, Heart Foundation (Victoria), Transcript of Evidence, 4 August 2011, 61.

Chapter 6: Parks and open spaces
95
6.5 Building community
Open public areas, green spaces and sporting facilities are important for building
community and creating opportunities for social connection. As Parks Forum wrote
in their submission, ‘Parks provide settings where families and friends come
together to have fun, celebrate important occasions or just to relax and take time
out. This has immense social value and is part of the “glue” of a healthy society.’528
Dr Rob Grenfell of Parks Victoria similarly commented on the value of open space
in building community spirit:
… just consider the weekend activities in your own local parks from markets, sporting and cultural events, the casual kick of a ball to just simply laying on a rug and looking at the clouds. The essence of a community is the connection with your neighbours, friends and family, and you need open space to do that in.529
The benefits of community‐building in open spaces can be enhanced:
… by urban planning that encourages visual coherence, diversity and attractiveness of houses and other buildings; affords sufficient privacy; ensures residents have easy access to amenities, parks, recreation facilities and a town or neighbourhood centre; offers pedestrian‐friendly spaces; provides streetscapes so that houses have views of the surrounding neighbourhood; encourages open verandas and low fences in order to encourage social interaction; and restricts motor traffic.530
Community gardens are an increasingly popular way to facilitate social interaction,
as well as providing a local source of fresh food.531 Several participants in the
Inquiry argued that master‐planned communities should provide spaces for shared
gardens to build community, increase the physical activity of residents and shore
against food insecurity.532 A comprehensive US study showed:
… community gardens and nearby green space in cities are an important response to needs for nutritious and affordable food, psychological and physiological health, social cohesion, crime prevention, recreation, and life satisfaction, particularly in low‐income communities.533
Mr Nick Matteo, Manager of Community Planning and Advocacy at the
Maribyrnong City Council, commented to the Committee that even small‐scale
community garden projects have value:
Council has now committed to an urban agriculture strategy; we have identified 15 sites across the municipality to develop community gardens. It is really in response to people in high rise developments who do not have a garden who actually want their hands in the soil. It provides a subsidy to low income people. It
528 Parks Forum, Submission No. 7, 30 June 2011, 2. 529 Dr R Grenfell, Parks Victoria, Transcript of Evidence, 7 September 2011, 233. 530 I Butterworth, The Relationship between the Built Environment and Wellbeing: a Literature Review, VicHealth, Melbourne, 2000, iii. 531 Prof E de Leeuw, Transcript of Evidence, 7 September 2011, 225; see also J Kingsley and M Townsend, ‘“Dig In” to Social Capital: Community Gardens as Mechanisms for Growing Urban Social Connectedness’, Urban Policy and Research, 2006, 24 (4): 525‐537. 532 Food Alliance, Submission No. 21, 30 June 2011, 5; Victorian Local Governance Association, Submission No. 56, 13 July 2011, 28; Ms K Jolly, Heart Foundation (Victoria), Transcript of Evidence, 4 August 2011, 60; City of Boroondara, Submission No. 31, 27 June 2011, 11; City of Stonnington, Submission No. 40, 14 July 2011, 4; Yarra City Ranges Council, Submission No. 41, 7. 533 HP Hynes and G Howe, ‘Urban Horticulture in the Contemporary United States: Personal and Community Benefits’, Acta Horticulturae, 2004, 643: 171‐181.
Inquiry into Environmental Design and Public Health in Victoria
96
is not a lot — we cannot have big gardens — but it does contribute to their community development.534
Recommendation 29
That the Victorian Government requires Precinct Structure Plans to ensure the
provision of community space, such as community gardens, in new housing
developments.
6.6 The built environment and crime
… by its very nature a street can be a place of extreme exposure, victimisation and danger or, by contrast, can be a place of shelter, refuge and safe passage.535
Evidence shows that the built environment can influence rates of crime by both
deterring criminal activity and encouraging social interaction by making residents
feel safe in public spaces. As Professor Giles‐Corti stated to the Committee, ‘People
behave better when they live in better environments.’536
Environments that promote social interaction and higher numbers of pedestrians
are more likely to reduce crime. Research shows, for example, that communities
with public green spaces and vegetation experience lower crime than areas
without green spaces.537 One study showed that the more walkable a
neighbourhood, the safer residents feel, ‘endorsing a shift away from low density,
curvilinear suburban developments towards more walkable communities with
access to shops, parks and transit’.538
Although studies suggest that women’s perceived fear of violence can influence
their behaviour more than actual rates of violence, personal safety concerns often
‘limit their ability to fully participate in society in the same way men do.’539 The
2010 Australian Bureau of Statistics General Social Survey showed that only 29
percent of women reported feeling safe walking alone in their local area at night
compared to 68 percent of men, and that for both genders, feelings of safety
decreased with age.540 Safety concerns in using active transport modes are also
more prevalent for ‘women from lower socio‐economic groups and CALD
[culturally and linguistically diverse] backgrounds who tend to live in higher crime
neighbourhoods, work during non‐business hours and typically have fewer
transport options.’541
534 Maribyrnong City Council, Transcript of Evidence, 6 September 2011, 171; see also Victorian Local Governance Association, Submission No. 56, 13 July 2011, 28. 535 Mr J Shinkfield, Australian Institute of Landscape Architects, Transcript of Evidence, 4 August 2011, 3. 536 Prof B Giles Corti, Transcript of Evidence, 4 August 2011, 14. 537 Australian Medical Association Victoria, Submission No. 23, 30 June 2011, 2; Kevin Heinze Centre, Submission No. 5, 23 June 2011, 1‐2; Parks Victoria, Submission No. 29, June 2011, 6. 538 S Foster et al, ‘Neighbourhood design and fear of crime: a social‐ecological examination of the correlates of residents' fear in new suburban housing developments’, Health Place, November 2010, 16 (6): 1156‐1165. 539 Ms R Durey, Women’s Health Victoria, Transcript of Evidence, 7 September 2011, 248; Women’s Health Victoria, Submission No. 4, 27 June 2011, 3. 540 ‘General Social Survey: Summary Results, Australia, 2010: Feelings of Safety’, Australian Bureau of Statistics, 2011, http://bit.ly/xhLXpa accessed 14 September 2012. 541 Women’s Health Victoria, Submission No. 4, 27 June 2011, 3.

Chapter 6: Parks and open spaces
97
Women’s Health Victoria informed the Committee of some environmental design
features that could increase women’s feelings of safety in public, such as ‘locating
bus stops in centres of activity rather than more isolated locations, ensuring
adequate lighting on train platforms, bus stops and streets, and ensuring that
waiting areas are visible to those in the surrounding area rather than blocked by
advertising.’542
542 Women’s Health Victoria, Submission No. 4, 27 June 2011, 3.

Inquiry into Environmental Design and Public Health in Victoria
98
Chapter 7: Active transport
99
Chapter 7: Active transport
More active transport trips mean more health, cleaner air, less traffic congestion and more liveable cities; and, with appropriate road safety policies, fewer road traffic injuries.543
Central to improving the health of all Victorians is encouraging physical activity,
within built environments that support active lifestyles. Employing active transport
modes (defined as walking, cycling and public transport) to move between places is
an important way to increase exercise levels within a community. Apart from their
positive impacts on health, active transport modes have many co‐benefits,
including:
less car use which decreases traffic congestion, lowers greenhouse gas emissions and decreases the use of fossil‐fuel energy sources
reduced air, noise and visual pollution increased social interaction on streets and within neighbourhoods which
builds social capital and a sense of community improved community safety, as ‘peopled’ places are safer places.544
This chapter examines several aspects of active transport: the different modes and
their potential impacts on health and wellbeing; the influence of the built
environment in encouraging or discouraging people to use active transport in daily
travel, such as trips to work and school; and the challenge of providing adequate
active transport networks in Victoria’s rapidly growing outer suburban and regional
areas. It also examines current strategies to increase active transport, particularly
through investment into infrastructure and improving road safety.
7.1 Walking
The relationship between transport and liveability needs to include recognition of the importance of shifting towards increased walking and cycling.545
Walking is the most popular physical activity in Australia.546 While a walking trip
begins with an origin and a destination, the Committee heard that whether people
choose to walk ‘depends on those two things being relatively close together, the
environment between them, the walking environment, and whether you have
somewhere pleasant that offers a pleasant experience to walk through.’547 Here
the connection between urban planning facilitating or being an obstacle to walking
becomes crucial.
‘Walkability’ is a term used to gauge how comfortable and easy an environment is
to walk in. It includes the provision of footpaths, safe traffic conditions, land use
patterns and aesthetics. The Heart Foundation has devised a checklist that
543 J Garrard, Submission to the 2011 Victorian Speed Limit Review On behalf of the Safe Speed Interest Group, Safe Speed Interest Group, Melbourne, 2011, 6. The Safe Speed Interest Group (SSIG) comprises a group of bodies including Heart Foundation (Victoria), the Cities of Yarra, Port Phillip, Darebin and Baw Baw Shires, Victoria Walks and Deakin University. 544 J Garrard, Safe speed: promoting safe walking and cycling by reducing traffic speed, Safe Speed Interest Group, Melbourne, 2008, 4; J Garrard, Active transport: Children and young people: An overview of recent evidence, VicHealth, Melbourne, 2009, 8. 545 Parks Victoria, Submission No. 29, June 2011, 14. 546 Ms K Jolly, Heart Foundation (Victoria), Transcript of Evidence, 4 August 2011, 58. 547 Mr M Hopkins, Department of Transport, Transcript of Evidence, 6 September 2011, 200.

Inquiry into Environmental Design and Public Health in Victoria
100
assesses the walkability of an environment based on four main areas: walker
friendliness; comfort; safety; and convenience and connectedness.548 Studies
undertaken by the Heart Foundation have shown that there are three particular
elements of the built environment that encourage people to walk for both
transport and recreation. They are:
mixed‐use land planning to provide a variety of, and proximity to, local destinations, including public transport
higher residential densities to encourage the building of local shops, services and public transport
open street connectivity and pedestrian‐friendly street layouts between homes, shops and workplaces, focusing on grid‐based street patterns and avoiding crossing major roads.549
Similarly, a comprehensive review of studies examining neighbourhood
environmental characteristics and physical activity among children concluded that
the strongest correlations were walkability, traffic speed/volume, access/proximity
to recreational facilities, land use mix, and residential density. For adolescents the
most important associations were land use mix and residential density.550
Incidental unstructured exercise is just as beneficial as planned physical activity,
such as walking to local shops rather than driving, or taking one’s dog to the
park.551 Walking for recreation is also associated with the attractiveness or
aesthetics of the neighbourhood environment, and the convenience of facilities.552
The Department of Transport informed the Committee that while infrastructure is
most important for increasing rates of cycling, community design is more
significant for walking: ‘In other words, if I am cycling, what I care about most is
what is under the wheels; if I am walking, what I care about more is what is around
me — do I feel safe and is this a pleasant environment to walk in?’553
At a public hearing, Dr Margaret Beavis explained to the Committee that local
destinations are integral in encouraging people to walk within their
neighbourhood. One Sydney‐based study found that people were more likely to
walk if there was a bus stop, a milk bar, a newsagent or a postbox within 400
metres. They were more likely to walk up to 1500 metres for schools, train stations
and shopping centres. There was also a cumulative effect – each separate feature
within 400 metres added around 12 minutes of personal exercise a fortnight, while
each additional feature within 1500 metres added 11 minutes a fortnight.554
548 ‘Neighbourhood Walkability Checklist – How walkable is your community?’ Heart Foundation, 2011, 4, http://bit.ly/Ai33NN accessed 9 January 2012. 549 K Jolly, ‘Environmental Design and Public Health, A Heart Foundation Perspective’, Heart Foundation (Victoria) presentation, 2011, slide 5, http://www.planning.org.au/documents/item/2956 accessed 22 October 2011. 550 D Ding et al, ‘Neighborhood environment and physical activity among youth: a review’, American Journal of Preventive Medicine, October 2011, 41 (4): 442‐455. 551 National Heart Foundation of Australia 2011 Creating Healthy Neighbourhoods – Consumer preferences for healthy development, National Heart Foundation, 2. 552 K Jolly, ‘Environmental Design and Public Health, A Heart Foundation Perspective’, slide 5. 553 Mr M Hopkins, Department of Transport, Transcript of Evidence, 6 September 2011, 203. 554 Dr M Beavis, Transcript of Evidence, 4 August 2011, 51.

Chapter 7: Active transport
101
Recent Victorian statistics by the Department of Transport (Figure 14) show that as
distances approach two kilometres, people are less likely to walk and more likely to
use a car.
Figure 14: Proportion of people walking for all trips less than two kilometres in metropolitan Melbourne
Source: Department of Transport 2010 The Pedestrian Access Strategy – A strategy to increase walking for transport
in Victoria, Victorian Government, Melbourne, 19.
There has been considerable research conducted on which street layouts are most
conducive to neighbourhood walking. While cul‐de‐sacs are often valued for their
perceived protection from busy traffic and crime,555 they can inhibit an area’s
walkability by restricting street connectivity and therefore increasing travel times.
At a public hearing, Ms Kellie‐Ann Jolly of the Heart Foundation (Victoria) discussed
the importance of street connectivity for promoting active transport:
Ms JOLLY — Some of our older residential — what do you call them? — estates, I suppose, have very much the cul‐de‐sac look and feel about them with no connectivity. That was very much not thinking about being able to make a walking or cycling trip easier; it was more about it being okay for the car … We have to flip it a bit and look at it from a walking and cycling perspective first and then perhaps from a car perspective second. I think that is the issue.
In some of the European countries we were talking about it is far more difficult to get in the car, whereas here it is actually easier for a lot of people. There are more barriers and obstacles to walking and cycling than there are to getting in the car … We are probably talking about these short trips being the things we can work on first, not the long trips from home to work. It is more about the local trips.556
Other submissions to the Committee recommended a grid layout as the optimum
design for walkability and connectivity: ‘A grid layout is really important. All these
555 M Ingram, The Grid versus the Cul‐de‐sac: An Evaluation of the Satisfaction of Residents with Street Patterns in Recent Cairns City Residential Subdivisions, unpublished Honours thesis, School of Earth and Environmental Sciences, James Cook University, October 2010, ii. 556 Ms K Jolly, Heart Foundation (Victoria), Transcript of Evidence, 4 August 2011, 68.

Inquiry into Environmental Design and Public Health in Victoria
102
dead end streets make it very hard to walk from point A to point B.’557 In one
Cairns‐based study comparing three types of street designs (grid, cul‐de‐sac or
loops), those living in streets within a grid pattern ‘displayed the highest levels of
overall satisfaction with their street pattern as well as pedestrian
walkability/connectivity and safety for pedestrians and children at play.’558
Several contributors to the Inquiry emphasised the importance of planning for
well‐connected pedestrian and cycling networks to encourage physical activity,
decrease car dependence and link local destinations such as shops, schools and
homes. In Figure 15, Wyndham City Council provides an example of a poorly
connected pathway terminating on a road shoulder.
Figure 15: An example of a lack of pathway connectivity in Wyndham
Source: Wyndham City Council
The Committee notes that the Department of Transport developed a Pedestrian
Access Strategy (2010) under the previous state government. The strategy aimed
to increase walking through investment in infrastructure, planning and design,
safety and behaviour change programs.559 Evidence presented by the Heart
Foundation (Victoria) stated that the strategy recognised the value of encouraging
more people to walk (particularly for short trips) and it could be adopted and
supported by the current government with appropriate investment.560 The
Committee further notes that a Pedestrian Access Strategy could provide guidance
to local governments in developing local active transport plans.
Recommendation 30
That the Victorian Government implements the Victorian Pedestrian Access
Strategy 2010.
557 Dr M Beavis, Transcript of Evidence, 4 August 2011, 51; see also Heart Foundation (Victoria), Submission No. 55, July 2011, 17, 42; Municipal Association of Victoria, Submission No. 61, July 2011, 24; City of Whittlesea, Submission No. 26, 30 June 2011, 9. 558 M Ingram, The Grid versus the Cul‐de‐sac, ii. 559 Department of Transport 2010 The Pedestrian Access Strategy – A strategy to increase walking for transport in Victoria, Victorian Government, Melbourne, 5. 560 Heart Foundation (Victoria), Submission No. 55, July 2011, 27‐28.

Chapter 7: Active transport
103
7.2 Cycling
The key to increasing bike riding is better bicycle infrastructure.561
Research shows that cycling for transport benefits health and wellbeing through
increased physical activity and social interaction, and helps the environment by
decreasing car use and air and noise pollution.562 On average, rates of cycling for
transport have increased in Melbourne over recent years.563 Plans have been in
place to accommodate more metropolitan and regional arterial cycling
infrastructure such as the former VicRoads strategies Principal Bicycle Network and
Municipal Bicycle Networks.564
However there is considerable scope for increasing cycling rates in Victoria.
Despite 60 percent of Melbourne’s residents having access to a bicycle, only 20
percent ride a bicycle weekly, and only 40 percent ride yearly.565 International
meta‐analyses of relevant research suggest, for example, that when distances to
access high frequency public transport services are under ten kilometres, many
people are willing to cycle rather than use a car.566 One study’s authors concluded:
… almost all cities adopting comprehensive packages of interventions experienced large increases in the number of bicycle trips and share of people bicycling … Substantial increases in bicycling require an integrated package of many different, complementary interventions, including infrastructure provision and pro‐bicycle programs, supportive land use planning, and restrictions on car use.567
Like many aspects of the built environment, early planning and investment in
infrastructure are key to creating environments that encourage cycling. It is much
more expensive to retrofit cycling facilities into existing suburbs, yet cycling is a
cost effective preventative health measure, and ‘can bring about a widespread
increase in physical activity and social inclusion at a relatively low cost compared
to the cost of a hospital bed.’568
561 Bicycle Network Victoria 2011 BiXE 2011, The Bicycle Expenditure Index for Local Government, 2011‐2012 Financial Year, BNV, Melbourne, 7. 562 A Bauman et al, ‘Getting Australia moving: Barriers, facilitators and interventions to get more Australians physically active through cycling’, Department of Health and Ageing and Cycling Promotion Fund, Melbourne, 2008, i‐iv; Dr M Beavis, Submission No. 11, 27 June 2011, 1; UWA Centre for the Built Environment and Health, Submission No. 27, 29 June 2011, 1; City of Boroondara, Submission No. 31, 27 June 2011, 6; Obesity Policy Coalition, Submission No. 32, 30 June 2011, 1; B Giles‐Corti et al, ‘The co‐benefits for health of investing in active transportation’, NSW Public Health Bulletin, 2010, 21 (5–6): 123; Yarra Ranges Council, Submission No. 41, 20 June 2011, 2‐3; C Maller et al, Healthy parks, healthy people – The health benefits of contact with nature in a park context, A review of relevant literature, Deakin University and Parks Victoria, Melbourne, 2008, 18; M Dennekamp and M Carey, ‘Air quality and chronic disease: why action on climate change is also good for health’, NSW Public Health Bulletin, 2010, 21 (5–6): 115‐119; A Bauman et al, Getting Australia active: towards better practice for the promotion of physical activity, National Public Health Partnership, Melbourne, 2002, 15; B Giles‐Corti, ‘The impact of urban form on public health’, paper prepared for the 2006 Australian State of the Environment Committee, Department of the Environment and Heritage, Canberra, 2006, 1, 4; Environment Defenders Office (Victoria) Ltd, Submission No. 10, 29 June 2011, 8‐9, 12. 563 Infrastructure Australia, ‘Cycling Infrastructure for Australian Cities, Background Paper’, 2009, 14, http://bit.ly/wBnIz0 accessed 3 November 2011. 564 ‘Principal Bicycle Network (PBN)’, VicRoads, 2011, http://bit.ly/xRh4vU; ‘Municipal Bicycle Networks (MBNs)’, VicRoads, 2010, http://bit.ly/zkEIf2 accessed 14 March 2012. 565 Bicycle Victoria, Submission No. 46, 6 July 2011, 1‐2. 566 J Pucher et al, ‘Infrastructure, programs, and policies to increase bicycling: An international review’, Preventive Medicine, 2010, 50: S106–S125. 567 J Pucher et al, ‘Infrastructure, programs, and policies to increase bicycling’, S106. 568 Bicycle Victoria, Submission No. 46, 6 July 2011, 3.

Inquiry into Environmental Design and Public Health in Victoria
104
In some western European countries, up to 30 percent of journeys are made by
bicycle, compared to Australian rates of less than two percent.569 Research shows
that countries within the Organisation for Economic Co‐operation and
Development with high cycling participation rates also have lower levels of adult
obesity.570
Mr Garry Brennan, head of Public Affairs at Bicycle Victoria (now Bicycle Network
Victoria), told the Committee that historically in urban planning, ‘Bike
infrastructure was an add on; it was an option … Infrastructure gets you riders, but
where does the infrastructure come from? It comes from commitment and the
investment.’571
Bicycle Victoria also observed that while government commitment to building
cycling infrastructure has increased over time, it is still insufficient to retrofit
adequate networks in established suburbs. Other planning obstacles can prevent
the establishment of cycling networks, such as:
… the difficulty in providing cycle routes along disused railway land. Another is the lack or clarity about management of public land along rivers or other corridors along which cycling routes can pass. And in new suburbs there is a lack of consistent planning guidance that would allow provision of a cycling network that would allow everyone to ride and enjoy the health benefits that come with it.572
They stated, ‘If we don’t provide places to ride then efforts to encourage riding will
be fruitless – it’s a bit like encouraging people to swim and providing swimming
lessons but not providing a pool’.573
A 2011 report studying the cycling infrastructure expenditure of 98 Australian local
government area councils, the Bicycle Expenditure Index (BiXE), showed that
Melbourne ranked comparatively poorly among Australia’s eight state capitals
(Table 4).
Table 4: Average local government area council expenditure on cycling infrastructure per resident, by Australian capital city
City Average expenditure on cycling infrastructure per resident 1. Sydney $62.34 2. Perth $46.63 3. Adelaide $34.21 4. Canberra $26.77 5. Brisbane $19.78 6. Melbourne $12.43 7. Darwin $4.04 8. Hobart $1.00
Source: Bicycle Network Victoria 2011 BiXE 2011, The Bicycle Expenditure Index for Local Government, 2011‐2012
Financial Year, BNV, Melbourne, 51.
569 Infrastructure Australia 2009 Cycling Infrastructure for Australian Cities, 4. 570 Infrastructure Australia 2009 Cycling Infrastructure for Australian Cities, 7. 571 Mr G Brennan, Bicycle Victoria, Transcript of Evidence, 4 August 2011, 41. 572 Bicycle Victoria, Submission No. 46, 6 July 2011, 3 (of cover letter). 573 Bicycle Victoria, Submission No. 46, 6 July 2011, 1.

Chapter 7: Active transport
105
There was also variation within Melbourne: in 2011, 54 percent of 79 councils met
or exceeded the recommended threshold of $5 per resident, an improvement from
2010 (52 percent), but less than 2009 (62 percent).574 Figure 16 shows the councils
whose cycling infrastructure expenditure is below the $5 per resident threshold.
Several are in Melbourne’s outer suburban areas, a notable exception being the
City of Wyndham, whose BiXE rating for 2011 was $14.92 per resident.575 As an
international comparison, the report noted that in Copenhagen, known as a
bicycle‐friendly city, the government spends approximately $A100 per resident on
cycling infrastructure.576
Figure 16: Local council areas of Melbourne which fall below the $5 per resident threshold for cycling infrastructure expenditure
Source: Bicycle Network Victoria 2011 BiXE 2011, The Bicycle Expenditure Index for Local Government, 2011‐2012
Financial Year, BNV, Melbourne, 13.
A contemporary example of successful urban planning for cycling is in Bogota,
Colombia, a city with a population of approximately nine million people.577 The
CicloRuta program aims ‘to establish a more sustainable and healthy transport
system’; a shift away from cars to cycling as the preferred method of transport,
complemented by improved bus systems.578 Completed between 1998 and 2007,
300 kilometres of bicycle lanes were built to crisscross the city, arranged into
hierarchical networks to maximise connectivity.579 Coupled with measures to limit
vehicles during peak times, bicycle use has increased an estimated five‐fold and car
use has decreased by 40 percent.580
574 BiXE’, Bicycle Network Victoria, 17 November 2011; BiXE 2011, The Bicycle Expenditure Index for Local Government, 2011‐2012, 6. 575 BiXE 2011, The Bicycle Expenditure Index for Local Government, 2011‐2012, 34. 576 BiXE 2011, The Bicycle Expenditure Index for Local Government, 2011‐2012, 10. 577 Planning Institute Australia (Victorian Division), Cancer Council Victoria (SunSmart), City of Port Phillip, Physical Activity Australia, Victorian Council of Social Service and Victorian Local Governance Association, Submission No. 59, 13 July 2011, 5, 19; ‘Colombia’, Departamento Administrativo Nacional de Estadistica (National Bureau of Statistics), Republica de Columbia, 2011, http://bit.ly/HCj6Gu accessed 3 December 2011. 578 Infrastructure Australia 2009 Cycling Infrastructure for Australian Cities, 4. 579 Infrastructure Australia 2009 Cycling Infrastructure for Australian Cities, 17. 580 Planning Institute of Australia (Victorian Division) et al, Submission No. 59, 13 July 2011, 19.

Inquiry into Environmental Design and Public Health in Victoria
106
Recommendation 31
That the Victorian Government:
reviews cycling infrastructure, with a particular focus on improving provision for Melbourne’s outer suburbs and Victoria’s regional cities
sets measurable targets and promotes activities such as the Ride2School Program to increase cycling participation, and reviews targets on an annual basis.
7.3 Public transport
Mass transit is good for people, good for the environment and good for business.581
Using public transport increases incidental exercise in a community and there is
also a synergistic effect: ‘high levels of public transport generate active transport,
which means people actually walk more.’582 There is an increasing body of
evidence related to public transport and physical activity, and which environmental
interventions can help to increase it. Research shows that elements of the built
environment that promote transport‐related physical activity include housing
density levels, street connectivity and mixed land use.583
Victorians who use public transport are likely to have spent around 30 minutes or
more walking each day.584 Table 5 shows the results of a Bus Association Victoria
study which found that people travelling by private transport only receive an
average of eight minutes exercise per day.
Table 5: Average daily minutes of walking and cycling for transport by transport mode
Transport modes used Average daily minutes of walking and cycling for transport
Public transport (all users) 41 minutes Public transport, no private transport 47 minutes
Private transport only (cars, taxis and/or motorcycle) 8 minutes Overall Melbourne average 15 minutes
Source: ‘Public Transport Use a Ticket to Health’, Bus Association Victoria, Melbourne, 2010, 1.
As with walking and cycling, there are co‐benefits when people use public
transport to travel, including less car‐based pollution and thus better air quality,
less traffic congestion and increased opportunities for social interaction.
The Heart Foundation (Victoria) commented on the disparity in public transport
provision in outer suburbs compared to inner metropolitan areas:
581 AG Capon, ‘The way we live in our cities’, Medical Journal of Australia, 2007, 187: 659. 582 Mr B Forrest, Wyndham City Council, Transcript of Evidence, 23 August 2011, 122; ‘Public Transport Use a Ticket to Health’, Bus Association Victoria, Melbourne, 2010, 1, http://bit.ly/AmwSJp accessed 4 October 2011; House of Representatives Standing Committee on Health and Ageing 2009 Weighing it up: Obesity in Australia, Commonwealth of Australia, Canberra, 82; Cycling Promotion Fund 2011 Riding a Bike for Transport – 2011 Survey Findings, Cycling Promotion Fund and the National Heart Foundation, Melbourne, 6; Department of Transport 2009 Victorian Cycling Strategy, Melbourne, 5; M Younger et al, ‘The Built Environment, Climate Change, and Health – Opportunities for Co‐Benefits’, American Journal of Preventive Medicine 2008; 35 (5): 518‐20. 583 HM Badland and GM Schofield, ‘Transport, urban design, and physical activity: an evidence‐based update’, Transportation Research Part D: Transport and Environment, 2005, 10 (3): 177‐196. 584 Mr M Hopkins, Department of Transport Transcript of Evidence, 6 September 2011, 200.

Chapter 7: Active transport
107
The difference in access to trains, trams and buses for residents in the outer suburbs of Melbourne compared to residents in middle and inner suburbs has been described as not so much a tale of two cities as an encounter between different planets … Car dependency and poor access to infrastructure and services are characteristics of many new growth area suburbs where housing estates have been developed and public transport has not followed.585
The Committee heard that a lack of communication between various public and
private stakeholders can be a common problem in providing active transport
infrastructure in new housing developments. In a public hearing, Mr Nigel Higgins,
General Manager of Sustainable Development at Maribyrnong City Council,
discussed this problem with Committee member Mr Brian Tee:
Mr HIGGINS — I think in terms of bringing together public transport walkability and access, we might have the development before us, but if VicRoads or the Department of Transport have not got their program aligned, then it means that public transport and those walkability issues cannot go in at the same time. If there are 200 houses coming in now, there may be no network except for immediately going to a private car‐based transport solution when you are away from the existing public transport network. In helping broker a transport solution then, whilst you are trying to consider a growth corridor or something at the same time, that is probably where the state government could assist in giving a direction — that is, before we say yes and green‐light all of that development out there. I think that is an age‐old issue; there is nothing new about that.
Mr TEE — It is about bringing infrastructure to the table as part of the development process, rather than afterwards as an afterthought, so it is an up‐front issue rather than a back‐end issue?
Mr HIGGINS — That is right. You might have a likely five year program, so that developers can be aware of it and be forewarned about how they can link into that.586
In outer suburbs where residents often commute long distances to their
workplace, planning a system based on people driving short distances to reach
public transport networks often does not work. One study showed that ‘Once in
the car, many do not want to leave it, and they do not like the time and effort it
takes to put together multiple forms of transport that often involve parking a car
and retrieving it.’587
A recent example of the lack of public transport provision in a new planned
community is the Aurora housing development at Epping North, marketed by
VicUrban (now Places Victoria) as ‘an award winning master planned community
designed for a better lifestyle in a well connected location and environment’.588
Original plans provided for public transport stops to be placed within 400 metres
of 80 percent of houses in the development. Five years on, several bus stops have
been built, but only one is currently used. The Department of Transport has said
585 Heart Foundation (Victoria), Submission No. 55, July 2011, 15. 586 Mr N Higgins, Maribyrnong City Council, Transcript of Evidence, 6 September 2011, 172. 587 P Williams et al, Linked up Lives: Putting Together Work, Home and Community in Ten Australian Suburbs, Overview Report, Centre for Work and Life, University of South Australia, 2009, 16. 588 ‘Features and Benefits of Aurora’, Places Victoria, 2012, http://bit.ly/rL6UNN accessed 10 January 2012.

Inquiry into Environmental Design and Public Health in Victoria
108
there is no funding for public transport in this area and blamed the developers,
claiming that ‘New shelters in Epping North were installed without consultation
with the Department of Transport and don’t necessarily reflect future public
transport routes.’589 Places Victoria countered that the Department agreed to the
original plans. A promised rail link extension on the Epping line also has failed to
materialise, meaning that residents are forced to use cars for much of their
travel.590 This somewhat belies Aurora’s current claim of being Places Victoria’s
8,000 house ‘flagship sustainable housing development’ and that ‘Most amenities,
infrastructure and community services will be available within a walkable
catchment of 200‐800 m[etres]’.591
Research also shows that the quality and speed of public transport influences
travel mode choice.592 People will walk further to faster and more frequent
transport, particularly train services. In Melbourne, half of train travellers walk
more than 800 metres to a train station. This may also be influenced by the fact
that rail services might be the only viable transport mode for those commuting to
the city.593
Inadequate provision of public transport impacts on those in the community who
are less mobile, such as Victoria’s increasing ageing population. The Council on the
Ageing (Victoria) told the Committee that as many older people rely solely on
public transport to move around, its provision is essential to ensuring older
people’s ongoing social inclusion in the community.594
Parents with young children also can face barriers in accessing public transport.
Women’s Health Victoria noted that ‘This is the situation for many women living in
new outer suburban communities as the growth of these areas has not been
matched by the provision of public transport infrastructure.’ Current public
transport infrastructure often does not allow for pram accessibility, resulting ‘in
women being less physically active, limiting their access to services, social
networks and community participation.’595
589 A Carey, ‘Epping hell: estate residents “betrayed” by promises’, Sydney Morning Herald, 15 December 2011, http://bit.ly/yZTBYP accessed 10 January 2012. 590 ‘A Carey, ‘Epping hell: estate residents “betrayed”’. 591 ‘Aurora, VicUrban's Urban Growth Development in Epping North’, Places Victoria, 2012, http://bit.ly/xQN0iu accessed 10 January 2012. 592 J Walker, ‘Basics: walking to transit’, Human Transit, 24 April 2011, http://bit.ly/hq2WJu accessed 10 January 2012. 593 A Davies, ‘How Far Do We Walk to the Station?’ The Urbanist, 2 November 2011, http://bit.ly/H2Qqnx accessed 10 January 2012. 594 Council on the Ageing (Victoria), Submission No. 58, 11 July 2011, 7. 595 Women’s Health Victoria, Submission No. 4, 27 June 2011, 2.
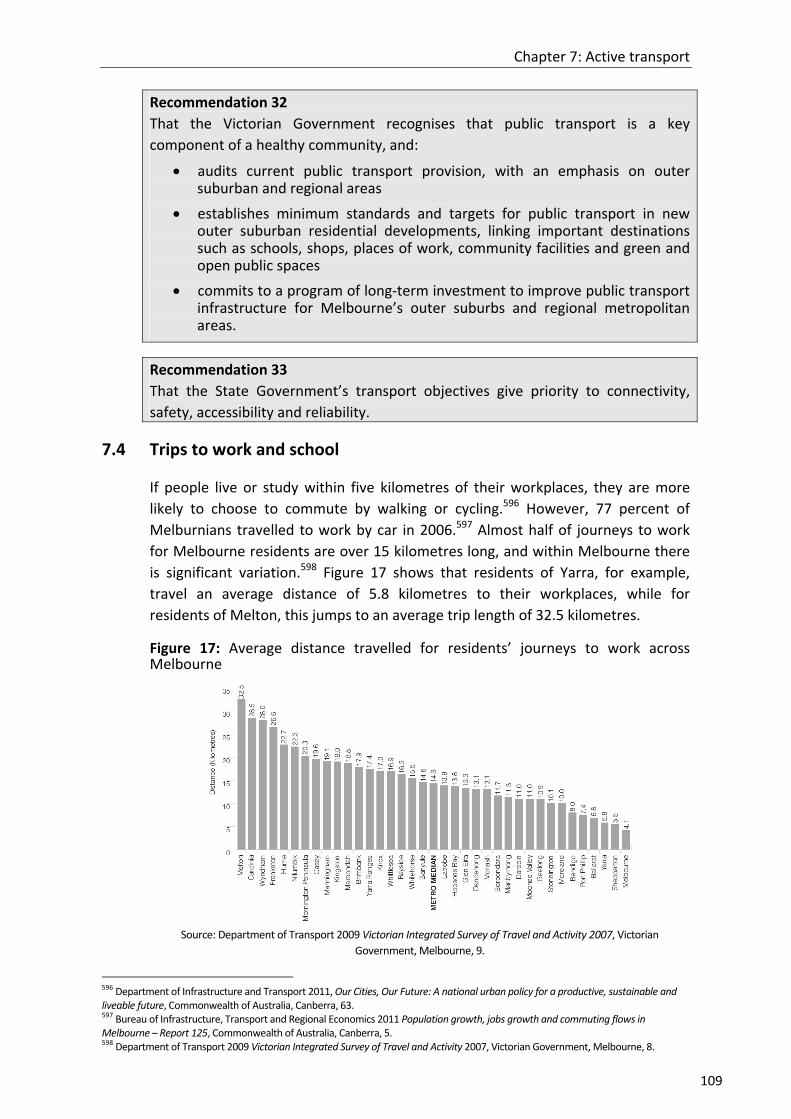
Chapter 7: Active transport
109
Recommendation 32
That the Victorian Government recognises that public transport is a key
component of a healthy community, and:
audits current public transport provision, with an emphasis on outer suburban and regional areas
establishes minimum standards and targets for public transport in new outer suburban residential developments, linking important destinations such as schools, shops, places of work, community facilities and green and open public spaces
commits to a program of long‐term investment to improve public transport infrastructure for Melbourne’s outer suburbs and regional metropolitan areas.
Recommendation 33
That the State Government’s transport objectives give priority to connectivity,
safety, accessibility and reliability.
7.4 Trips to work and school
If people live or study within five kilometres of their workplaces, they are more
likely to choose to commute by walking or cycling.596 However, 77 percent of
Melburnians travelled to work by car in 2006.597 Almost half of journeys to work
for Melbourne residents are over 15 kilometres long, and within Melbourne there
is significant variation.598 Figure 17 shows that residents of Yarra, for example,
travel an average distance of 5.8 kilometres to their workplaces, while for
residents of Melton, this jumps to an average trip length of 32.5 kilometres.
Figure 17: Average distance travelled for residents’ journeys to work across Melbourne
Source: Department of Transport 2009 Victorian Integrated Survey of Travel and Activity 2007, Victorian
Government, Melbourne, 9.
596 Department of Infrastructure and Transport 2011, Our Cities, Our Future: A national urban policy for a productive, sustainable and liveable future, Commonwealth of Australia, Canberra, 63. 597 Bureau of Infrastructure, Transport and Regional Economics 2011 Population growth, jobs growth and commuting flows in Melbourne – Report 125, Commonwealth of Australia, Canberra, 5. 598 Department of Transport 2009 Victorian Integrated Survey of Travel and Activity 2007, Victorian Government, Melbourne, 8.

Inquiry into Environmental Design and Public Health in Victoria
110
The number of people in Melbourne commuting over 30 kilometres to and from
work is predicted to increase.599 A recent report from the Bureau of Infrastructure,
Transport and Regional Economics found Melbourne's urban sprawl has continued
while employment continues to be concentrated in the inner suburbs, and that the
costs of congestion will double by 2020.600 Accordingly, planning and implementing
strategies to both increase active transport and decrease cars on Melbourne’s
roads is vital.
One way for children and teenagers to get daily exercise is by walking or cycling to
school. Studies show that countries with high rates of active travel also have
children who are generally more active than Australian children,601 and that
children who walk or cycle to school are also more likely to use active travel modes
to other neighbourhood destinations.602 However in Victoria, ‘transport policy is
dominated by a focus on the fast and efficient movement of motorised vehicles.’603
At a public hearing, Dr Vivian Romero told the Committee that walking to and from
school is an important way for children to gain first hand experience and
knowledge of the neighbourhood in which they live.604 Encouraging children to use
active transport is also ‘a more equitable and inclusive form of physical activity
promotion than organised sport and exercise programs.’605
Almost 80 percent of Australian families live within five kilometres of their
children’s schools.606 However, rates of children walking or cycling to school have
decreased dramatically in recent decades.607 In 1970, over 55 percent of children
and young people walked or cycled to school or university. By 1994, this dropped
to 22.2 percent, while journeys to educational institutions by car increased from
14.3 percent to 55.3 percent. A similar shift occurred in Victoria over this time
period: walking to school fell from 35.4 percent to 15.9 percent, cycling to school
from 20.3 percent to 7.9 percent, and car travel increased from 16.5 percent to
43.9 percent.608 A 2012 study by the Heart Foundation and Cycling Promotion Fund
showed that 60 percent of surveyed Australian parents drive their children to
school.609 The most common reason for this is concerns over road safety, discussed
further at 7.5 below.
599 Bureau of Infrastructure, Transport and Regional Economics 2011 Population growth, jobs growth, 9, 319, 333, 340. 600 J Dowling and R Sexton, ‘Jobs lose pace with city sprawl’, The Age, 10 November 2011, http://bit.ly/vPhQKk accessed 11 November 2011. 601 J Garrard, Active transport: Children and young people, 3. 602 J Garrard, Active transport: Children and young people, 4. 603 D Tucker and J Stone, ‘Active Transport To School: A Study Of Political Barriers In Glen Eira’, Faculty of Architecture, Building and Planning, University of Melbourne, 2011, 1. 604 VM Romero, ‘“I will be not a nerd”: Children’s Development, the Built Environment and School Travel’, paper presented at State of Australian Cities Conference, Adelaide, 29 November 2007, 997. 605 J Garrard, Active transport: Children and young people, 2. 606 J Garrard, Active transport: Children and young people, 16. 607 VM Romero, ‘“I will be not a nerd”’, 997. 608 J Garrard, Active transport: Children and young people, 9. 609 Heart Foundation 2012 Active Travel to School: 2012 Survey Findings, Heart Foundation and Cycling Promotion Fund, 2.

Chapter 7: Active transport
111
During the morning peak period, approximately 17 percent of all car trips in
Melbourne are made by parents driving children to school.610 According to the
Department of Transport, around 70 percent of Victorian primary school children
are driven to school, in both metropolitan and regional areas.611 Figure 18 shows
walking trips to Victorian primary, secondary and tertiary institutions by
proportion of people walking.
Figure 18: Walking trips to Victorian primary, secondary and tertiary institutions by proportion of people walking
Source: Department of Transport 2010 The Pedestrian Access Strategy – A strategy to increase walking for transport
in Victoria, Victorian Government, Melbourne, 21.
Within Melbourne, recent data shows that over 60 percent of primary school
students are driven to school even though 44 percent of these trips are less than
two kilometres.612 In one example in Essendon, studies showed that in 1974, 25
percent of children were driven to school. By 2005, this figure had jumped to 89
percent.613
Apart from increasing children’s physical activity, reducing these car trips would
also greatly improve traffic congestion, commuting times and air quality.614
Recommendation 34
That the Victorian Government continues to support initiatives which aim to
increase the number of children walking and cycling to school, particularly in outer
suburban and regional Victoria, and calls on the State Government to reinstate the
Walking School Bus Program.
610 J Garrard, Active transport: Children and young people, 8. 611 Department of Transport 2009 Victorian Integrated Survey of Travel and Activity 2007, 9. 612 Department of Transport 2010 The Pedestrian Access Strategy, 21. 613 B Peddie and C Somerville, ‘Travel Behaviour Change through School Travel Planning: Mode Shift and Community Engagement – Results from 33 Schools in Victoria’, Department of Infrastructure, Victorian Government, Melbourne, 2005, 1. 614 J Garrard, Active transport: Children and young people, 8.

Inquiry into Environmental Design and Public Health in Victoria
112
7.5 Road safety
In spite of the multi‐modal nature of personal mobility in Victoria, there is a tendency for transport and road safety policies to focus on the needs of motorists and to overlook the needs of other road user groups for safe, convenient, non‐motorised personal mobility.615
The Committee noted that Victorians’ negative perceptions of road safety were
often given as an explanation for why more people did not use active transport for
travel. Several contributors to the Inquiry discussed the potential benefits of
‘traffic calming’ measures to increase both walking and cycling in a community,
particularly in terms of physical safety.616 In their submission, Deakin University’s
Centre for Physical Activity and Nutrition Research reported that their research
discovered:
… physical infrastructure designed to calm traffic is important for children’s and adolescents’ physical activity. In particular the presence of speed humps, traffic/pedestrian lights and intersections is associated with increased physical activity.617
A recent national survey by the Cycling Promotion Fund and the National Heart
Foundation found that while more than 62 percent of Australians want to cycle
more in their daily lives, there are several perceived barriers, including:
unsafe road conditions (46 percent)
speed/volume of traffic (42 percent)
feel unsafe riding (41 percent)
lack of bicycle lanes/trails (35 percent).618
Bicycle Victoria similarly told the Committee that concerns over road safety were a
major deterrent to more Victorians taking up cycling: ‘[Cycling] would benefit
public health and congestion and the greenhouse effect — all those sorts of things
— if people were able to. They are unable to because they are scared.’619
There are statistics to support such concerns: Victorian data shows that
‘pedestrians and cyclists are increasingly over‐represented in road transport
serious casualties’ and rates of fatalities and serious injuries are increasing.620
615 J Garrard, Submission to the 2011 Victorian Speed Limit Review, 6. 616 Deakin University’s Centre for Physical Activity and Nutrition Research, Submission No. 16, 30 June 2011, 1‐3; J Garrard, Active transport: Children and young people, 16; VicHealth 2011 Streets Ahead 2008–2011, Program evaluation report, Victorian Government, Melbourne, 2; Assoc Prof C Whitzman, Transcript of Evidence, 7 September 2011, 266; Ms R Carlisle, Heart Foundation (Victoria), Transcript of Evidence, 4 August 2011, 67; VicHealth, Submission No. 47, 11 July 2011, 13; Heart Foundation (Victoria), Submission No. 55, July 2011, 17; Municipal Association of Victoria, Submission No. 61, July 2011, 24; C McNaughton, Submission No. 53, 11 July 2011, 3; City of Boroondara, Submission No. 31, 27 June 2011, 15; City of Ballarat Submission No. 19, 30 June 2011, 2; see also R Ewing and E Dumbaugh, ‘The Built Environment and Traffic Safety – A Review of Empirical Evidence’, Journal of Planning Literature, May 2009, 23 (4): 347‐367. 617 Deakin University’s Centre for Physical Activity and Nutrition Research, Submission No. 16, 30 June 2011, 1. 618 ‘Two in three blame unsafe roads for staying off their bikes’, media release, Cycling Promotion Fund, 1 June 2011, http://bit.ly/Aw35v4 accessed 10 November 2011. 619 Mr B Sbeghen, Bicycle Victoria, Transcript of Evidence, 4 August 2011, 46; see also Infrastructure Australia 2009 Cycling Infrastructure for Australian Cities, 12; Department of Infrastructure and Transport 2011, Our Cities, Our Future: A national urban policy, 63. 620 J Garrard, Submission to the 2011 Victorian Speed Limit Review, 5, 8.
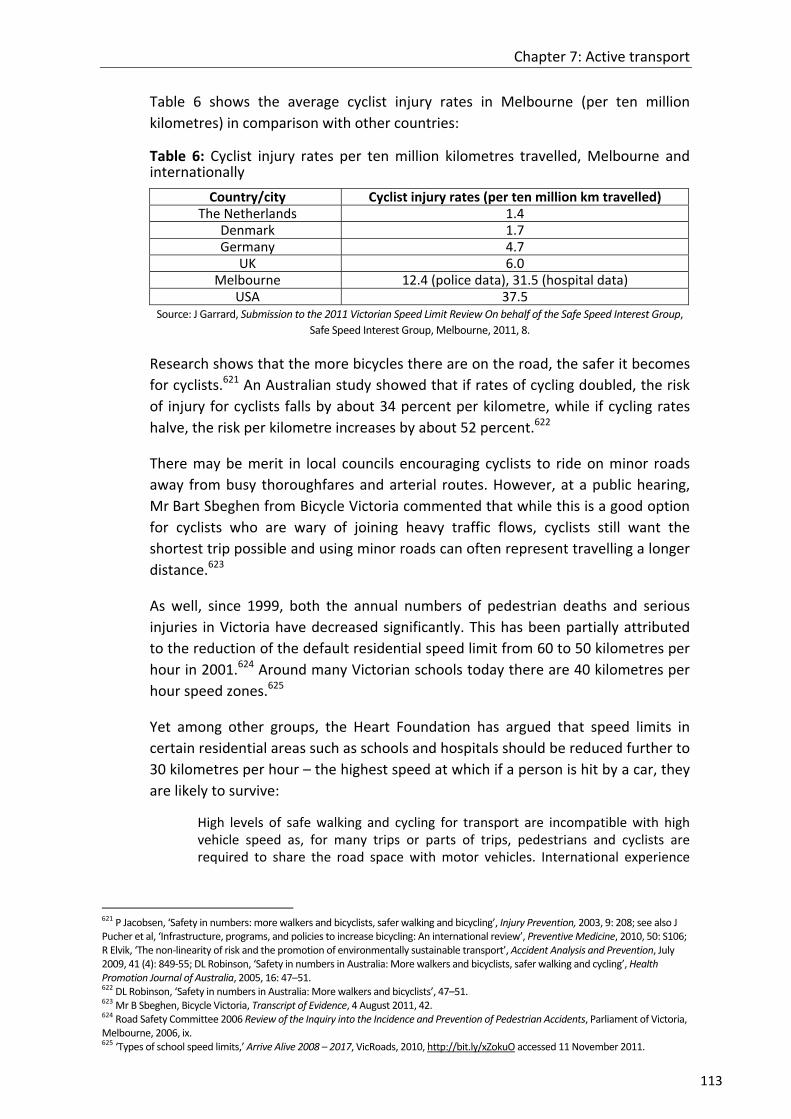
Chapter 7: Active transport
113
Table 6 shows the average cyclist injury rates in Melbourne (per ten million
kilometres) in comparison with other countries:
Table 6: Cyclist injury rates per ten million kilometres travelled, Melbourne and internationally
Country/city Cyclist injury rates (per ten million km travelled) The Netherlands 1.4
Denmark 1.7 Germany 4.7
UK 6.0 Melbourne 12.4 (police data), 31.5 (hospital data)
USA 37.5 Source: J Garrard, Submission to the 2011 Victorian Speed Limit Review On behalf of the Safe Speed Interest Group,
Safe Speed Interest Group, Melbourne, 2011, 8.
Research shows that the more bicycles there are on the road, the safer it becomes
for cyclists.621 An Australian study showed that if rates of cycling doubled, the risk
of injury for cyclists falls by about 34 percent per kilometre, while if cycling rates
halve, the risk per kilometre increases by about 52 percent.622
There may be merit in local councils encouraging cyclists to ride on minor roads
away from busy thoroughfares and arterial routes. However, at a public hearing,
Mr Bart Sbeghen from Bicycle Victoria commented that while this is a good option
for cyclists who are wary of joining heavy traffic flows, cyclists still want the
shortest trip possible and using minor roads can often represent travelling a longer
distance.623
As well, since 1999, both the annual numbers of pedestrian deaths and serious
injuries in Victoria have decreased significantly. This has been partially attributed
to the reduction of the default residential speed limit from 60 to 50 kilometres per
hour in 2001.624 Around many Victorian schools today there are 40 kilometres per
hour speed zones.625
Yet among other groups, the Heart Foundation has argued that speed limits in
certain residential areas such as schools and hospitals should be reduced further to
30 kilometres per hour – the highest speed at which if a person is hit by a car, they
are likely to survive:
High levels of safe walking and cycling for transport are incompatible with high vehicle speed as, for many trips or parts of trips, pedestrians and cyclists are required to share the road space with motor vehicles. International experience
621 P Jacobsen, ‘Safety in numbers: more walkers and bicyclists, safer walking and bicycling’, Injury Prevention, 2003, 9: 208; see also J Pucher et al, ‘Infrastructure, programs, and policies to increase bicycling: An international review’, Preventive Medicine, 2010, 50: S106; R Elvik, ‘The non‐linearity of risk and the promotion of environmentally sustainable transport’, Accident Analysis and Prevention, July 2009, 41 (4): 849‐55; DL Robinson, ‘Safety in numbers in Australia: More walkers and bicyclists, safer walking and cycling’, Health Promotion Journal of Australia, 2005, 16: 47–51. 622 DL Robinson, ‘Safety in numbers in Australia: More walkers and bicyclists’, 47–51. 623 Mr B Sbeghen, Bicycle Victoria, Transcript of Evidence, 4 August 2011, 42. 624 Road Safety Committee 2006 Review of the Inquiry into the Incidence and Prevention of Pedestrian Accidents, Parliament of Victoria, Melbourne, 2006, ix. 625 ‘Types of school speed limits,’ Arrive Alive 2008 – 2017, VicRoads, 2010, http://bit.ly/xZokuO accessed 11 November 2011.

Inquiry into Environmental Design and Public Health in Victoria
114
suggests that speed reduction is not the only change needed to increase safe active transport, but it is a key component.626
In a submission to the 2011 Victorian Speed Limit Review, the Safe Speed Interest
Group (SSIG) argued that a 30 kilometres per hour speed limit is optimal for mixed
road use and to encourage more walking and cycling.627 The SSIG criticised the
Australian Transport Council‘s National Road Safety Strategy 2011‐2020 on several
points, including:
The strategy is based on the assumption that road safety primarily revolves around vehicles, and does not place firm emphasis on the equitable distribution of road safety for all road users, particularly pedestrians and cyclists.
There is little or no mention of health and wellbeing in the consideration, development or suggested application of safety contingencies. Accident, injury and fatality are very important considerations, but so too is the health benefit of increased levels of active transport which can be stifled by unsafe roads. Road safety must include concern for community health and wellbeing in regard to speed, vehicle emissions, safe and amenable urban design, strategic traffic calming and transport planning which includes infrastructure considerations and safety provisions for pedestrians, cyclists and connectivity to public transport.628
The SSIG state that the main public resistance to speed reductions – higher
commuting times – is ‘perceived rather than actual’ and not borne out by studies:
Evidence indicates that increases in vehicle travel time due to lower speed limits and the associated costs, are substantially overstated. Small travel time benefits e.g. 9 seconds/km, come at a substantial cost in terms of the health and wellbeing of individuals and communities.629
As shown in Table 7, contrary to popular public opinion, Australia’s average speed
limits are higher than many others in the developed world.
Table 7: European and Australasian speed limits by road type
Road type Europe (mainly) Australasia (mainly) School areas 30 km/h 40 km/h
Residential areas 30 km/h 50‐60 km/h Built‐up areas 60 km/h 70‐80 km/h Urban roads 60‐70 km/h 80 km/h or higher Rural roads 80‐90 km/h 100 km/h Motor roads 100 km/h 100 km/h Motorways 120 km/h 110 km/h
Source: J Garrard, Safe speed: promoting safe walking and cycling by reducing traffic speed, Safe Speed Interest
Group, Melbourne, 2008, 21.
A number of European and Asian cities have successfully prioritised active
transport over car use through urban planning in residential areas and activity
626 J Garrard, ‘Safe speed: promoting safe walking and cycling by reducing traffic speed’, 4; see also Ms R Carlisle, Heart Foundation (Victoria), Transcript of Evidence, 4 August 2011, 67; C McNaughton, Submission No. 53, 11 July 2011, 3. 627 ‘Promoting safe walking and cycling by reducing traffic speed – Summary of the Safe Speed Interest Group research review’, Healthy Spaces and Places, 2008, 1, http://bit.ly/wBCNwJ accessed 11 November 2011. 628 ‘Promoting safe walking and cycling by reducing traffic speed’, 3. 629 ‘Promoting safe walking and cycling by reducing traffic speed’, 4.

Chapter 7: Active transport
115
centres. Reduced speed limits of 30 kilometres per hour or less have been
considered a key factor in reducing crash injury rates.630
In principle, many Victorian parents and children support the idea of walking or
cycling to school.631 However, one of the main reason parents drive their children
to school is due to increasing concerns over traffic conditions and road safety.632
Conversely, one study showed that walking to school was more common for
children in neighbourhoods with high walkability characteristics such as high street
connectivity and low traffic volume, and less likely in neighbourhoods with high
connectivity but high traffic volume.633
VicHealth’s 2009 report Towards active and independently mobile children
reported that the majority of primary school parents saw ‘road safety as a barrier
to their children’s physical activity in the community.’634 A 2012 survey similarly
showed that 80 of surveyed parents feared for the safety of their children in traffic
when travelling to school, and felt that there were too few bike paths.635
Perversely, this has created a situation where due to the resulting increase in
traffic around school areas, ‘parents drive their children to school to protect them
from the adverse traffic conditions created by other parents driving their children
to school.’636 This is contrary to research that shows Australian children are nearly
twice as likely to be killed as a car passenger than as a pedestrian, and over four
times more likely to be killed as a car passenger than as a cyclist.637
The VicHealth report also revealed that only 29 percent of parents thought speed
limits in their local communities should be reduced to 30 kilometres per hour to
make the environment safer for children.638 The Committee notes that further
Australian research needs to be done to understand the effects of lowering speed
limits on encouraging active transport.639
Recommendation 35
That the case for the lowering of speed limits to 30 kilometres per hour for school,
residential and other appropriate areas be considered by current or future speed
limit reviews undertaken by VicRoads, in consultation with the Victoria Police and
other stakeholders.
630 J Garrard, Submission to the 2011 Victorian Speed Limit Review, 6. 631 J Garrard, Submission to the 2011 Victorian Speed Limit Review, 6. 632 A Timperio et al, ‘Perceptions of local neighbourhood environments and their relationship to childhood overweight and obesity’, International Journal of Obesity, February 2005, 29 (2): 170‐175; Department of Transport 2010 The Pedestrian Access Strategy, 21; A Timperio et al, ‘Personal, Family, Social, and Environmental Correlates of Active Commuting to School’, American Journal of Preventive Medicine, January 2006, 30 (1): 45‐51. 633 B Giles‐Corti et al, ‘School site and the potential to walk to school: the impact of street connectivity and traffic exposure in school neighborhoods’, Health Place, March 2011, 17 (2): 545‐50. 634 VicHealth 2011 Towards active and independently mobile children, 10; see also UWA Centre for the Built Environment and Health, Submission No. 27, 29 June 2011. 635 Heart Foundation 2012 Active Travel To School: 2012 Survey Findings, 2. 636 J Garrard, Taking action on obesogenic environments, 12. 637 J Garrard, Active transport: Children and young people, 4. 638 VicHealth 2011 Towards active and independently mobile children, 11. 639 J Garrard, ‘Safe speed: promoting safe walking and cycling by reducing traffic speed’, 6; J Garrard, Submission to the 2011 Victorian Speed Limit Review, 2.

Inquiry into Environmental Design and Public Health in Victoria
116
7.6 Active transport and outer suburban and regional areas
Previous chapters have outlined some of the potential problems relating to the
built environment and public health in outer suburban and regional areas. These
include: higher rates of chronic disease and population growth than inner
metropolitan areas; sprawling low density housing; fewer locally‐based economic
and employment opportunities; fewer active transport networks and high car
dependency; fewer green and open public spaces; less access to fresh and
nutritious food; and social isolation.
The Committee also heard that the areas of Victoria that are growing fastest in
both population and rates of chronic disease are those least likely to have
adequate active transport infrastructure. The Municipal Association of Victoria
noted in its submission that a number of municipalities in Melbourne’s urban
fringe:
… sustain a legacy of poor planning decisions made 30 to 40 years ago and a lack of infrastructure investment which have rendered their communities without access to reliable public transport, and walking proximity to local parks, shops or services which are typically enjoyed by inner suburbs and more urban areas.640
Similarly, the City of Casey discussed their ‘history of infrastructure lag’, resulting in
‘the lack of an integrated public transport network which resulted in our
community becoming largely car dependent.’641 Several contributors to the Inquiry
recommended more government funding to build or upgrade safe and accessible
public transport networks, pedestrian‐ and child‐friendly walkable environments,
and comprehensive cycling infrastructure.642
While urban expansion is often blamed for Victorians’ decreasing physical activity
levels, research shows that it is more complicated. An analysis of the relevant
literature by researchers at the University of New South Wales’ Healthy Built
Environments Program concluded that ‘it is the poor accessibility and increased
distances between land uses characteristic of “sprawl”, rather than sprawl as a
tangible concept, that discourages physical activity.’643
The further residents live from inner metropolitan areas, the less likely they are to
use active transport for travel. Figure 19 shows the relationship between distance
640 Municipal Association of Victoria, Submission No. 61, July 2011, 7. 641 City of Casey, Submission No. 42, 6 July 2011, 3. 642 Deakin University’s Centre for Physical Activity and Nutrition Research, Submission No. 16, 30 June 2011, 3; Prof E de Leeuw Submission No. 1, 6 June 2011, 2; Women's Health Victoria Submission No. 4, 27 June 2011, 2; Whitehorse City Council, Submission No. 6, 24 June 2011, 2; Dr M Beavis, Submission No. 11, 27 June 2011, 1‐2; City of Whittlesea, Submission No. 26, 30 June 2011, 13; UWA Centre for the Built Environment and Health, Submission No. 27, 29 June 2011, 1; City of Boroondara, Submission No. 31, 27 June 2011, 14; City of Stonnington, Submission No. 40, 14 July 2011, 7‐8; City of Casey, Submission No. 42, 6 July 2011, 3, 8, 10‐11; Yarra City Council, Submission No. 45, June 2011, 3; Victorian Council of Social Service, Submission No. 49, 8 July 2011, 4, 6; Doctors for the Environment Australia Inc., Submission No. 51, 11 July 2011, 7; Heart Foundation (Victoria), Submission No. 55, July 2011, 14‐16; Planning Institute Australia (Victorian Division), Cancer Council Victoria (SunSmart), City of Port Phillip, Physical Activity Australia, Victorian Council of Social Service and Victorian Local Governance Association, Submission No. 59, 13 July 2011, 12; Municipal Association of Victoria, Submission No. 61, July 2011, 24; Wyndham City Council, Submission No. 62, 26 July 2011, 4; City of Ballarat Submission No. 19, 30 June 2011, 7; City of Greater Bendigo, Submission No. 3, 22 June 2011, 8. 643 The Built Environment and Getting People Active, Healthy Built Environments Program, University of New South Wales, Sydney 2012, 49.

Chapter 7: Active transport
117
from the Central Business District and the average minutes per day residents walk
or cycle for transport.
Figure 19: Average minutes per day Melbourne residents spend walking or cycling for transport
Source: ‘Public Transport Use a Ticket to Health’, Bus Association Victoria, Melbourne, 2010, 2.
Bicycle Victoria detailed their concerns with the lack of cycling provision in
Melbourne’s outer suburbs, where ‘cycling for transport is nearly non existent’,644
and in regional Victoria where there is poor network connectivity between homes,
schools and community centres.645 Cycling rates in these areas are accordingly low
– less than one percent of all trips.646 As well, the increased distances many people
living in outer suburban areas have to travel combined with ‘Complex daily
routines and schedules mean that non‐car modes of transport, such as walking and
cycling, are less practical.’647
Bicycle Victoria’s BiXE research among regional councils showed great variation in
cycling infrastructure expenditure. In 2011, the council with the highest BiXE was
the Shire of Surf Coast ($26.32 per resident) and the City of Wangaratta ($15.83 per
resident), while the lowest were the Shires of South Gippsland ($5.74 per resident)
and East Gippsland ($5.42 per resident).648
The Committee notes that there is scope for substantial increases in walking and
cycling participation in regional cities. Associate Professor Trevor Budge told the
Committee that far from being ill‐equipped for active transport provision, regional
centres are often ideally suited to it:
644 Bicycle Victoria, Submission No. 46, 6 July 2011, 1. 645 Bicycle Victoria, Submission No. 46, 6 July 2011, 1. 646 Bicycle Victoria, Submission to Outer Suburban/Interface Services & Development Committee, 13 May 2011, 1, http://bit.ly/HDWKVp accessed 13 October 2011. 647 VicHealth, Submission No. 47, 11 July 2011, 5. 648 BiXE 2011, The Bicycle Expenditure Index for Local Government, 2011‐2012, 43‐46.

Inquiry into Environmental Design and Public Health in Victoria
118
What is happening in our regional centres? … The distances between community facilities and where people live and their places of employment are getting larger … I will use the example of where I live, in Bendigo. I can jump in the car at my place in Bendigo and drive to just about anywhere else in the city in 10 minutes … [The] problem is that with populations of 50,000 to 100,000 people, the car is incredibly convenient. We have public transport usage rates in our regional cities of between about 0.5 percent and three percent. The idea of people walking is almost an anathema. I will use an anecdote to illustrate this. A colleague of mine who works at the Mildura campus of La Trobe University lives about 20 minutes walk from the campus. Recently he has taken to walking every morning. He has had a number of comments from other people he knows in the city of Mildura, who have said to him, ‘Have you lost your licence?’ This is reflective of the situation in these regional cities, which by the way are almost all dead flat. They are absolutely set up for walking and cycling, and yet the levels of walking and cycling are lower.649
7.6.1 Case study: Corio Norlane
The Committee received a presentation from the Corio Norlane Development
Advisory Board (CNDAB), comprising a group of government, community and
private sector stakeholders.
The Corio Norlane area is six kilometres north of central Geelong and divided into
four sections: Central Norlane, Cloverdale, Norlane and Rosewall. In the past, the
Corio Norlane community has experienced ‘high levels of disadvantage across
many of the commonly used socio‐economic indices’.650 The community has high
rates of obesity, type 2 diabetes (6.76 percent incidence compared to the Victorian
rate of 4.04 percent)651 and high unemployment.652
Recent community and local government efforts have identified several
opportunities for urban redevelopment and renewal in the area, articulated in
CNDAB’s Healthy Community Plan 2009‐2013.653 The Plan was guided by the World
Health Organization’s Healthy Cities framework, part of a worldwide project which
‘promotes local authorities as key stakeholders to deliver planning objectives
based on health and wellbeing outcomes.’654
The Plan ‘provides a long term strategy for the continued and coordinated whole
of government and community approach to reduce the level of disadvantage that
exists in Corio Norlane.’655 Much of this involves increasing areas of park and public
open space, improving street connectivity and increasing provision of active
transport.
649 Assoc Prof T Budge, Transcript of Evidence, 4 October 2011, 301. 650 Corio Norlane Development Advisory Board 2009 Healthy Community Plan 2009‐2013, ii, http://bit.ly/yP676c accessed 6 December 2011. 651 ‘Analysis of Health Priorities – Health & Wellbeing’, Corio Norlane Development Advisory Board, 2009, http://bit.ly/HY6J1f accessed 6 December 2011. 652 J McGovern, Corio Norlane Development Advisory Board, Transcript of Evidence, 7 September 2011, 244. 653 Corio Norlane Development Advisory Board 2009 Healthy Community Plan, ii. 654 City of Casey, Submission No. 42, 6 July 2011, 25; Corio Norlane Development Advisory Board 2009 Healthy Community Plan, 2‐3. 655 ‘Healthy Community Plan’, Corio Norlane Development Advisory Board, 2009, http://bit.ly/ILJrlB accessed 6 December 2011.

Chapter 7: Active transport
119
Ms Gabrielle Nagle, a CNDAB representative, told the Committee that in order to
start redressing the ‘longstanding intergenerational disadvantage’ of the area:
… the community has advised that transport access and appropriate open space is definitely necessary to improve community wellbeing as well as to enhance public health in that particular area … there needs to be an increased connection of walking and cycling paths throughout Corio Norlane ... There is only transport that goes north and south, not east and west, so there are some significant physical barriers and safety issues for the community to travel around in that particular area.656
At a public hearing, Mr David Hodge of the Department of Planning and
Community Development, referred to the area as an example of poor urban
planning regarding street connectivity:
… there are reasonably good guidelines that talk about connectivity, about the distance that people should be able to walk from a major transport route and about how they should be able to walk in a direct line … The best or worst example in Victoria would probably be in Geelong or Corio, where you have to go and buy a carton of milk, and as the crow flies it is about 300 metres, but you actually have to drive 2.5 kilometres to get around there.657
Professor Evelyne de Leeuw, a resident of Geelong, commented on the lack of
open spaces in the area:
You see in parts of Melbourne that the management of environments and health issues is done really well. On the other hand if you look at Norlane in Corio, Geelong, for instance, which is where I live, in spite of massive investment over the years it does not seem to manage this really well. There are all sorts of issues that drive that problem and the failure to actually do something about it … in the suburbs of, say, Norlane and Corio, we have to take people out of their suburb to find the spaces for them to interact with because they are just not there.658
656 Ms G Nagle, Corio Norlane Development Advisory Board, Transcript of Evidence, 7 September 2011, 240. 657 Mr D Hodge, Department of Planning and Community Development, Transcript of Evidence, 31 August 2011, 145‐146; see also Prof E de Leeuw, Transcript of Evidence, 7 September 2011, 224. 658 Prof E de Leeuw, Transcript of Evidence, 7 September 2011, 224, 235‐236.

Inquiry into Environmental Design and Public Health in Victoria
120
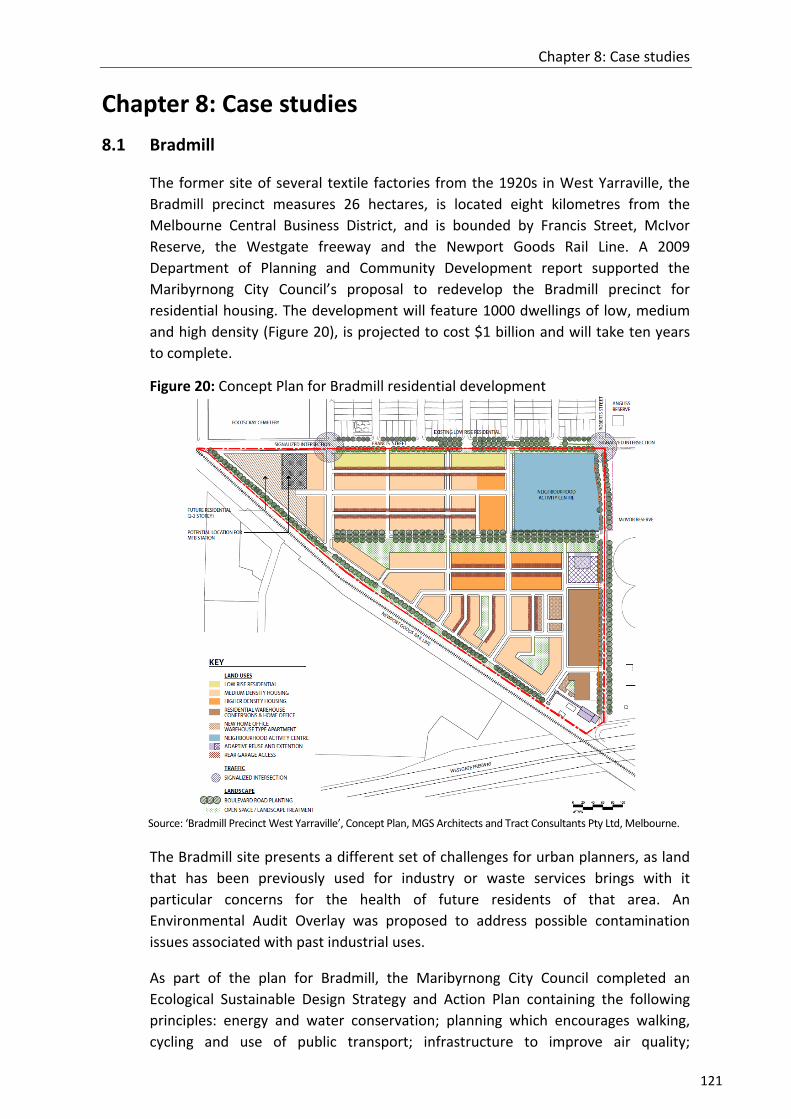
Chapter 8: Case studies
121
Chapter 8: Case studies
8.1 Bradmill
The former site of several textile factories from the 1920s in West Yarraville, the
Bradmill precinct measures 26 hectares, is located eight kilometres from the
Melbourne Central Business District, and is bounded by Francis Street, McIvor
Reserve, the Westgate freeway and the Newport Goods Rail Line. A 2009
Department of Planning and Community Development report supported the
Maribyrnong City Council’s proposal to redevelop the Bradmill precinct for
residential housing. The development will feature 1000 dwellings of low, medium
and high density (Figure 20), is projected to cost $1 billion and will take ten years
to complete.
Figure 20: Concept Plan for Bradmill residential development
Source: ‘Bradmill Precinct West Yarraville’, Concept Plan, MGS Architects and Tract Consultants Pty Ltd, Melbourne.
The Bradmill site presents a different set of challenges for urban planners, as land
that has been previously used for industry or waste services brings with it
particular concerns for the health of future residents of that area. An
Environmental Audit Overlay was proposed to address possible contamination
issues associated with past industrial uses.
As part of the plan for Bradmill, the Maribyrnong City Council completed an
Ecological Sustainable Design Strategy and Action Plan containing the following
principles: energy and water conservation; planning which encourages walking,
cycling and use of public transport; infrastructure to improve air quality;

Inquiry into Environmental Design and Public Health in Victoria
122
encouraging recycling of waste materials; and landscaping which provides for
natural habitat and green spaces.659
On 4 October 2011, members of the Committee visited the Bradmill development,
and learned of health‐related issues that have been raised. In a submission to
council, the Department of Innovation, Industry and Regional Development
expressed concerns about the loss of employment opportunities, increased traffic
congestion, and the potential noise pollution caused by the Newport freight rail
track, used by trains all night.660 Residents’ concerns focused on potential traffic
congestion, particularly on Francis Street, and pollution and noise from trucks.661
Environment Protection Authority Victoria noted that the development’s close
proximity to the Brooklyn Industrial Estate had the potential to cause odour, dust
and noise problems, which have been the sources of previous complaints from
Yarraville residents.662
8.2 Armstrong Creek
Armstrong Creek, a new residential development in the City of Greater Geelong, is
the largest contiguous urban development in Victoria. The development is
expected to take 25 years to complete and will provide approximately 22,000
residential homes for 55,000 people. A target of creating 22,000 new local jobs
also has been set, with a focus on high technology industries and developing links
with Deakin University.663 According to the project’s scoping documents, achieving
this will require a ‘quality urban offer’ to attract and retain skilled workers.664
On 18 October 2011, members of the Committee undertook a visit with the
assistance of the City of Geelong to the site of the planned ‘Warralily’ residential
community at Armstrong Creek (Figure 21).665 The Committee was informed that
Warralily emphasises integrating sustainable eco‐friendly housing with green
spaces, local community shopping and recreational facilities, and provision of
active transport networks.666
659 ‘Schedule 7 To The Development Plan Overlay’, Maribyrnong Planning Scheme, in A Robertson, Maribyrnong Planning Scheme Amendment C63: Bradmill Precinct, Report of the Panel, Tract Consultants Pty Ltd, 2009, Melbourne, 7. 660 B Ryan, ‘Fears for development of Yarraville's Bradmill site’, Maribyrnong Leader, 2 June 2009, http://bit.ly/w7GRe3 accessed 14 September 2011; A Robertson, Maribyrnong Planning Scheme Amendment C63, 9, 20. 661 A Robertson, Maribyrnong Planning Scheme Amendment C63, 5. 662 B Ryan, ‘Fears for development of Yarraville's Bradmill site’; A Robertson, Maribyrnong Planning Scheme Amendment C63, 29‐30. 663 ‘About Armstrong Creek’, City of Greater Geelong, 2011, http://bit.ly/xbfgpr accessed 20 November 2011. 664 City of Greater Geelong 2010 Armstrong Creek Urban Growth Plan, Volume 1, City of Greater Geelong, 2010, 64. 665 ‘Greater Geelong Planning Scheme Amendment C214 East Precinct Development Contributions Plan Exhibition’, City of Greater Geelong, 2011, http://bit.ly/IrPLxc accessed 2 October 2011. 666 ‘About the Warralily Armstrong Creek Development’, Warralily Armstrong Creek, 2010, http://bit.ly/HMG8ut accessed 2 October 2011.
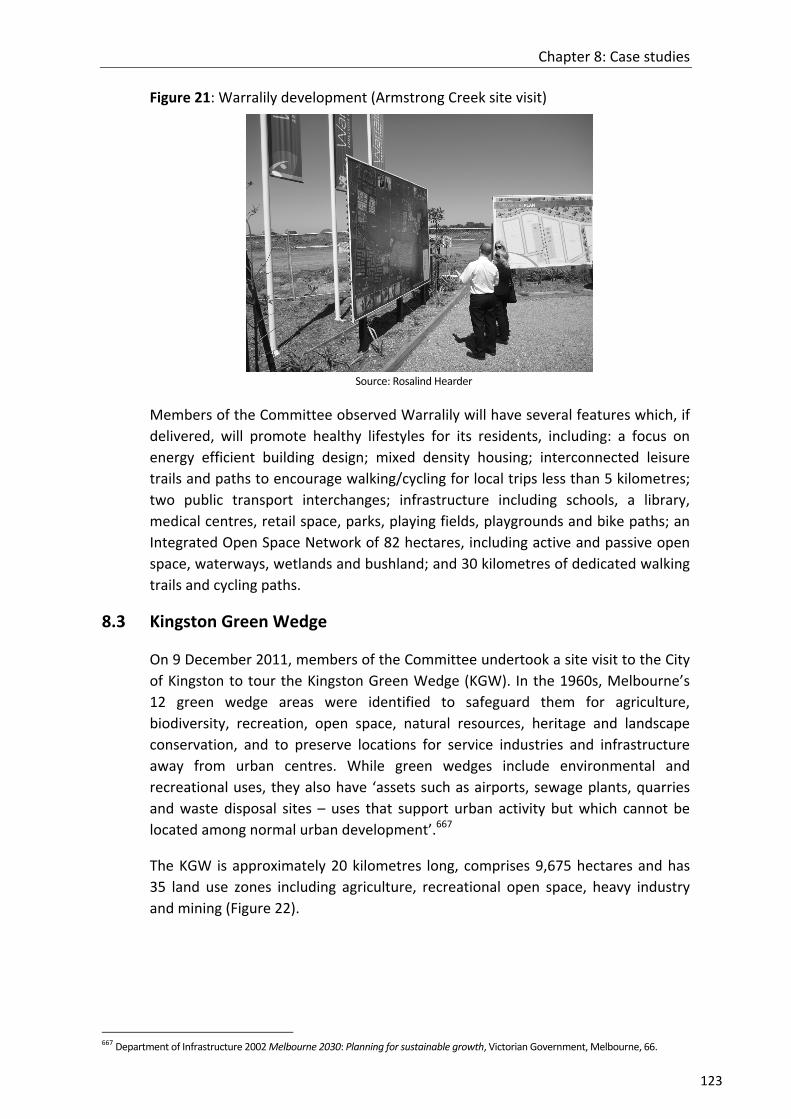
Chapter 8: Case studies
123
Figure 21: Warralily development (Armstrong Creek site visit)
Source: Rosalind Hearder
Members of the Committee observed Warralily will have several features which, if
delivered, will promote healthy lifestyles for its residents, including: a focus on
energy efficient building design; mixed density housing; interconnected leisure
trails and paths to encourage walking/cycling for local trips less than 5 kilometres;
two public transport interchanges; infrastructure including schools, a library,
medical centres, retail space, parks, playing fields, playgrounds and bike paths; an
Integrated Open Space Network of 82 hectares, including active and passive open
space, waterways, wetlands and bushland; and 30 kilometres of dedicated walking
trails and cycling paths.
8.3 Kingston Green Wedge
On 9 December 2011, members of the Committee undertook a site visit to the City
of Kingston to tour the Kingston Green Wedge (KGW). In the 1960s, Melbourne’s
12 green wedge areas were identified to safeguard them for agriculture,
biodiversity, recreation, open space, natural resources, heritage and landscape
conservation, and to preserve locations for service industries and infrastructure
away from urban centres. While green wedges include environmental and
recreational uses, they also have ‘assets such as airports, sewage plants, quarries
and waste disposal sites – uses that support urban activity but which cannot be
located among normal urban development’.667
The KGW is approximately 20 kilometres long, comprises 9,675 hectares and has
35 land use zones including agriculture, recreational open space, heavy industry
and mining (Figure 22).
667 Department of Infrastructure 2002 Melbourne 2030: Planning for sustainable growth, Victorian Government, Melbourne, 66.

Inquiry into Environmental Design and Public Health in Victoria
124
Figure 22: An aerial view of the Kingston Green Wedge area
Source: Department of Planning and Community Development 2010 Creating a Shared Vision for a Sustainable
Kingston Green Wedge, Victorian Government, Melbourne, 6.
On their tour, members of the Committee observed current uses of the KGW (such
as landfill and waste management services, and other private and industrial land
uses) and were alerted to the potential for transferring some of these uses into
public open space. This includes creating a ‘Chain of Parks’ by linking walking and
cycling trails through the KGW from Karkorook Park to Braeside Park.668 The Chain
of Parks concept aims to ‘create a series of connected parks that will provide high
quality open space and a wide range of passive and active recreation facilities for
both the local community and the wider south‐east region.’669
8.4 Selandra Rise
Selandra Rise is a housing development demonstration project between industry,
government and the private sector, represented by the Planning Institute of
Australia (Victorian Division) (PIA (Vic)), the Growth Areas Authority, the City of
Casey, VicHealth and developer Stockland. A 115‐hectare location in Melbourne’s
south‐eastern suburbs (in the City of Casey), Selandra Rise is the first urban
development of its kind to incorporate health considerations at each stage of
planning: ‘a greenfield development which has been specifically planned to
enhance the health and wellbeing of its residents.’670
Apart from a range of accommodation options, plans feature provision of a retail
town centre, primary and secondary schools, health and childcare services, an
aged care facility, interconnected walking tracks, bike paths and streets, 13
hectares of open space, a proposed community garden, parklands within 300
metres of every home, a sporting district and playgrounds.671 Construction will
668 City of Kingston 2011 Kingston Green Wedge Plan, Draft Plan for Consultation, Melbourne, vi‐ix. 669 Department of Planning and Community Development 2010 Creating A Shared Vision For A Sustainable Kingston Green Wedge, Victorian Government, Melbourne, 4. 670 Planning Institute of Australia (Victorian Division), Submission No. 39, 4 July 2011, 4. 671 ‘About Selandra Rise’, Stockland Corporation Limited, 2012, http://bit.ly/At6mY5 accessed 16 January 2012.

Chapter 8: Case studies
125
begin in 2012 and the suburb will house approximately 4000 residents when
completed.672
According to PIA (Vic), the project highlights the fact that in current planning
processes, considerations of health and wellbeing are an optional extra.673 Six key
planning priorities have been identified: social inclusion, physical activity, food,
childhood health, safety and mental health.674
Monitoring and evaluation will have an important role in the project. VicHealth has
appointed a Research Practice Fellow to ‘track those latent, emergent, planned
and accidental living health outcomes, from the first stages of community
development to the time of community establishment.’675
PIA (Vic) informed the Committee that the Selandra Rise project has many
objectives in terms of embedding health principles in urban design:
It particularly undertakes to include some important and specific health design features such as accessibility to food and children’s play, which are not legislated for or included in the PSP guidelines … The envisaged benefits of such a project are numerous. The first is the opportunity for planners and developers to observe any improved health outcomes for residents. The second is the opportunity to undertake research to provide quantifiable evidence that such planning initiatives result in positive health outcomes … Another important outcome of this project is the anticipated market demand for ‘healthy‐planned’ communities. This demand will create a financial incentive for the private sector to incorporate health and wellbeing when planning and developing new communities, and demonstrates how planning for health can be integrated into a viable business model.676
The Committee looks forward to the evaluation of the Selandra Rise project in
terms of its health and wellbeing outcomes.
Recommendation 36
That the Victorian Government takes note of the Selandra Rise project with a view to:
ensuring key lessons and quantifiable evidence arising from the project regarding health and wellbeing are widely disseminated and inform policy development
encouraging collaborations in residential development between community, private and government bodies.
Committee Room 3 May 2012
672 VicHealth 2011 VicHealth year in review 2010‐2011, Victorian Government, Melbourne, 38. 673 Planning Institute of Australia (Victorian Division), Submission No. 39, 4 July 2011, 6. 674 Planning Institute of Australia (Victorian Division), Submission No. 39, 4 July 2011, 5. 675 VicHealth, Submission No. 47, 11 July 2011, 14‐15; see also ‘Rise and shine: Selandra Rise development breaks new ground’, media release, Growth Areas Authority, 19 September 2011, http://bit.ly/w5wQCM accessed 16 January 2012; VicHealth 2011 VicHealth year in review 2010‐2011, 39. 676 Planning Institute Australia (Victorian Division), Cancer Council Victoria (SunSmart), City of Port Phillip, Physical Activity Australia, Victorian Council of Social Service and Victorian Local Governance Association, Submission No. 59, 13 July 2011, 13‐14.

Inquiry into Environmental Design and Public Health in Victoria
126

Appendix A: Submissions received
127
Appendix A: Submissions received
1. Professor Evelyne de Leeuw
2. Dr Vivian Romero
3. City of Greater Bendigo
4. Women’s Health Victoria
5. The Kevin Heinze Centre
6. City of Whitehorse
7. Parks Forum
8. Commonwealth Scientific and Industrial Research Organisation
9. beyondblue
10. Environment Defenders Office (Victoria) Ltd
11. Dr Margaret Beavis
12. Australian Institute of Landscape Architects
13. City of Warrnambool
14. Healthy Built Environments Program, University of New South Wales
15. Australian Department of Infrastructure and Transport
16. School of Exercise and Nutrition Sciences, Deakin University
17. Faculty of Health, Deakin University Medical School
18. Northern Alliance for Greenhouse Action
19. City of Ballarat
20. SJB Urban
21. Food Alliance
22. Victorian Healthcare Association
23. Australian Medical Association Victoria
24. City of Monash
25. Arup
26. City of Whittlesea
27. Centre of the Built Environment and Health, University of Western Australia
28. Professor Anthony Capon
29. Parks Victoria
30. Cancer Council Victoria (SunSmart)
31. City of Boroondara
32. Obesity Policy Coalition
33. Alcohol Policy Coalition
34. Mr Alex MacLeod
35. Astronomical Society of Victoria
36. Cardinia Ratepayers Association
37. City of Moreland
38. Ms Angela Williams
39. Planning Institute of Australia (Victorian Division)
40. City of Stonnington
41. Shire of Yarra Ranges
42. City of Casey
43. Dental Health Services Victoria

Inquiry into Environmental Design and Public Health in Victoria
128
44. City of Melbourne
45. City of Yarra
46. Bicycle Victoria (now Bicycle Network Victoria)
47. VicHealth (Victorian Health Promotion Foundation)
48. Sustainable Population Australia
49. Victorian Council of Social Service
50. Protectors of Public Land Victoria Inc.
51. Doctors for the Environment
52. City of Maribyrnong
53. Ms Catherine McNaughton
54. Environment Protection Authority Victoria
55. Heart Foundation (Victoria)
56. Victorian Local Governance Association
57. Shire of East Gippsland
58. Council on the Ageing (Victoria)
59. Joint Submission by Cancer Council Victoria (SunSmart), City of Port Phillip,
Planning Institute of Australia (Victorian Division), Physical Activity Australia,
Victorian Council of Social Service and Victorian Local Governance Association
60. Nillumbik Shire Council
61. Municipal Association of Victoria
62. Wyndham City Council
63. Department of Planning and Community Development

Appendix B: List of witnesses
129
Appendix B: List of witnesses
Thursday 4 August 2011
Australian Institute of Landscape Architects Mr Scott Graham, President Ms Pru Smith, Chair, Environment Committee Mr Robert Cooper, National Councillor Ms Deborah Kuh, Environment Committee Mr Jon Shinkfield, Advocacy and Urban Design Committee
McCaughey Centre, University of Melbourne Professor Billie Giles‐Corti, Director
Municipal Association of Victoria Ms Clare Hargreaves, Manager, Social Policy Ms Jan Black, Policy Adviser
Professor Anthony Capon
Bicycle Victoria (now Bicycle Network Victoria) Mr Bart Sbeghen, Manager, Healthy Suburbs Mr Garry Brennan, Public Affairs
Dr Margaret Beavis
Heart Foundation (Victoria) Ms Kellie‐Ann Jolly, Director, Cardiovascular Health Programs Ms Rachel Carlisle, Active Living Manager
Tuesday 23 August 2011
Environment Defenders Office (Victoria) Ltd Ms Nicola Rivers, Law Reform Director Mr Michael Power, Law Reform
VicHealth (Victorian Health Promotion Foundation) Associate Professor John Fitzgerald, Acting Chief Executive Officer
Council on the Ageing (Victoria) Ms Janet Wood, President Ms Debra Parnell, Manager, Policy
Food Alliance Dr Rachel Carey, Research Fellow Ms Kathy McConell, Coordinator
Doctors for the Environment Dr Eugenie Kayak, Victorian Chair Dr Marion Carey, Senior Research Fellow, Monash Sustainability Institute, Monash University
City of Wyndham Cr Glenn Goodfellow Cr Marcel Mahfoud Mr Bill Forrest, Director of Advocacy Ms Lucy Midolo, Social Planning Coordinator

Inquiry into Environmental Design and Public Health in Victoria
130
Wednesday 31 August 2011
Department of Planning and Community Development Mr David Hodge, Acting Deputy Secretary, Planning and Local Government Mr John Ginivan, Acting Executive Director, Planning Policy and Reform
Tuesday 6 September 2011
SJB Urban Mr Simon McPherson, Director
Cancer Council Victoria (SunSmart) Ms Sue Heward, Manager Ms Dimity Gannon, Community and Sports Coordinator
City of Maribyrnong Mr Nigel Higgins, General Manager, Sustainable Development Mr Nick Matteo, Manager, Community Planning and Advocacy
Dr Vivian Romero
Environment Protection Authority Victoria Mr John Merritt, Chief Executive Officer Mr Stuart McConnell, Director, Future Focus
Department of Transport Mr Robert Pearce, Deputy General Counsel, Commercial Branch Mr Michael Hopkins, Executive Director, Policy and Communications Division Ms Fiona Calvert, Director, Strategy and Resource Efficiency, Policy Branch
City of Whittlesea Mr Russell Hopkins, Director, Community Services Mr Griff Davis, General Manager, Advocacy and Communications Mr Frank Hanson, Team Leader, Urban Design
Wednesday 7 September 2011
Professor Evelyne de Leeuw
Parks Victoria Ms Fiona Horsley, Manager, Livability Strategy Dr Rob Grenfell, Strategic Health Adviser
Corio Norlane Development Advisory Board Ms Gabrielle Nagle, Executive Ms Joan McGovern, Executive
Women's Health Victoria Ms Rita Butera, Executive Director Ms Rose Durey, Policy and Health Promotion Manager
beyondblue Ms Suzanne Pope, Director, Research and Planning Ms Carolyn Nikoloski, Policy and Projects Officer
Associate Professor Carolyn Whitzman, Urban Planning, University of Melbourne

Appendix B: List of witnesses
131
Wednesday 14 September 2011
Department of Health Mr Colin Sindall, Acting Director, Prevention and Population Health Dr John Carnie, Chief Health Officer Mr Graeme Gillespie, Manager, Environmental Health
Tuesday 4 October 2011
Planning Institute of Australia (Victorian Division) Mr Stuart Worn, Executive Officer Ms Simone Stevenson, Senior Policy and Project Officer Mr Jason Black, Project Director, Planning for Health and Wellbeing Project
Associate Professor Trevor Budge
Professor Michael Buxton

Inquiry into Environmental Design and Public Health in Victoria
132
Appendix C: List of site visits
4 October 2011
City of Maribyrnong
City of Melbourne
18 October 2011
City of Wyndham
City of Greater Geelong
9 December 2011
City of Kingston

Appendix D: Extracts of the proceedings
133
Appendix D: Extracts of the proceedings
Legislative Council Standing Order 23.27(5) requires the Committee to include in its report all divisions on a question relating to the adoption of the draft report. All Members have a deliberative vote. In the event of an equality of votes, the Chair also has a casting vote. The Committee divided on the following questions during consideration of this Report, with the result of the divisions detailed below. Questions agreed to without division are not recorded in these extracts.
18 April 2012
Recommendation 12
That the Victorian Government amends section 4(1) of the Planning and Environment Act 1987 to include ‘the promotion of environments that protect and encourage public health and wellbeing’ (or similar wording) as an objective of planning in Victoria.
Mrs Peulich moved, That the word ‘amends’ be omitted with the view of inserting in its place ‘considers amending’ and that after ‘1987’ the following words be inserted ‘or other appropriate mechanisms’.
The Committee divided.
Ayes 3 Noes 4 Mr Elsbury Mr Ondarchie Mrs Peulich
Ms Pennicuik Mr Scheffer Mr Tee Ms Tierney
Amendment negatived.
Mr Scheffer moved, That Recommendation 12 stand part of the Report.
The Committee divided.
Ayes 4 Noes 3 Ms Pennicuik Mr Scheffer Mr Tee Ms Tierney
Mr Elsbury Mr Ondarchie Mrs Peulich
Recommendation agreed to.
Recommendation 14
That the Victorian Government amends section 12 of the Planning and Environment Act 1987 to require planning authorities to conduct a Health Impact Assessment for key planning decisions, such as major urban developments or making or amending a planning scheme. The Committee further recommends that:
a suitable and easy to use Health Impact Assessment tool be developed by the Department of Health and the Department of Planning and Community Development, in consultation with the planning industry and local governments

Inquiry into Environmental Design and Public Health in Victoria
134
the Department of Health provide resources and support to local governments to conduct Health Impact Assessments.
Ms Pennicuik moved, That in the second dot point, after the word ‘Health’ the following words be inserted ‘and the Department of Planning and Community Development’.
The Committee divided.
Ayes 4 Noes 3 Ms Pennicuik Mr Scheffer Mr Tee Ms Tierney
Mr Elsbury Mr Ondarchie Mrs Peulich
Amendment agreed to.
Mrs Peulich moved, That the word ‘amends’ be omitted with the view of inserting in its place ‘considers amending’, and that the words ‘or making or amending a planning scheme’ and the second dot point be omitted.
The Committee divided.
Ayes 3 Noes 4 Mr Elsbury Mr Ondarchie Mrs Peulich
Ms Pennicuik Mr Scheffer Mr Tee Ms Tierney
Amendment negatived.
Ms Pennicuik moved, That Recommendation 14 as amended stand part of the Report.
The Committee divided.
Ayes 4 Noes 3 Ms Pennicuik Mr Scheffer Mr Tee Ms Tierney
Mr Elsbury Mr Ondarchie Mrs Peulich
Recommendation agreed to.
Recommendation 22
That the Victorian Government amends section 12A(4) of the Planning and Environment Act 1987 to require Municipal Strategic Statements to be consistent with Municipal Public Health and Wellbeing Plans. Following this, the Government should audit Municipal Strategic Statements within the next 12 months to monitor compliance with the amendment.
Ms Pennicuik moved, That the last sentence be omitted with the view of inserting in its place ‘Following this, the Government should conduct an audit of Municipal Strategic Statements annually to monitor compliance with the amendment’.
The Committee divided.
Ayes 4 Noes 3 Ms Pennicuik Mr Scheffer Mr Tee Ms Tierney
Mr Elsbury Mr Ondarchie Mrs Peulich
Amendment agreed to.

Appendix D: Extracts of the proceedings
135
Mr Elsbury moved, That Recommendation 22 be omitted with the view of inserting in its place the following ‘That the Victorian Government encourage local governments to develop Municipal Strategic Statements which are consistent with Municipal Public Health and Wellbeing Plans by working with local governments to develop synergy.’
The Committee divided.
Ayes 3 Noes 4 Mr Elsbury Mr Ondarchie Mrs Peulich
Ms Pennicuik Mr Scheffer Mr Tee Ms Tierney
Amendment negatived.
Mrs Peulich moved, That the last sentence be omitted.
The Committee divided.
Ayes 3 Noes 4 Mr Elsbury Mr Ondarchie Mrs Peulich
Ms Pennicuik Mr Scheffer Mr Tee Ms Tierney
Amendment negatived.
Mr Scheffer moved, That Recommendation 22 as amended stand part of the Report.
The Committee divided.
Ayes 4 Noes 3 Ms Pennicuik Mr Scheffer Mr Tee Ms Tierney
Mr Elsbury Mr Ondarchie Mrs Peulich
Recommendation agreed to.
Recommendation 24
That the Department of Health provides guidance to local governments to evaluate Municipal Public Health and Wellbeing Plans and to benchmark with other municipalities.
Mrs Peulich moved, That the words ‘and to benchmark with other municipalities’ be omitted.
The Committee divided.
Ayes 3 Noes 4 Mr Elsbury Mr Ondarchie Mrs Peulich
Ms Pennicuik Mr Scheffer Mr Tee Ms Tierney
Amendment negatived.
Recommendation 25
That the Department of Health works with SunSmart and local governments to ensure that UV protective shade measures are included in Municipal Public Health

Inquiry into Environmental Design and Public Health in Victoria
136
and Wellbeing Plans. This should be followed with regular audits of the Plans to monitor compliance.
Mr Elsbury moved, That the last sentence be omitted.
The Committee divided.
Ayes 3 Noes 4 Mr Elsbury Mr Ondarchie Mrs Peulich
Ms Pennicuik Mr Scheffer Mr Tee Ms Tierney
Amendment negatived.
Ms Pennicuik moved, That after the word ‘compliance’ the following be inserted ‘with the measures’.
The Committee divided.
Ayes 4 Noes 3 Ms Pennicuik Mr Scheffer Mr Tee Ms Tierney
Mr Elsbury Mr Ondarchie Mrs Peulich
Amendment agreed to.
Recommendation 7
That the Victorian Government amends the Victoria Planning Provisions to require growth area residential developments to achieve housing densities substantially higher than the current average density minimum of 15 dwellings per net developable hectare.
Mrs Peulich moved, That the word ‘amends’ be omitted with the view of inserting in its place ‘considers amending’ and that all words after ‘housing’ be omitted with the view of inserting in its place ‘sizes and densities to meet the needs of population growth and diverse community needs’.
The Committee divided.
Ayes 3 Noes 4 Mr Elsbury Mr Ondarchie Mrs Peulich
Ms Pennicuik Mr Scheffer Mr Tee Ms Tierney
Amendment negatived.
Mr Elsbury moved, That all words after ‘Provisions’ be omitted with the view of inserting in their place ‘to encourage greater housing density and minimum requirements of open space, while maintaining choice in the market’.
The Committee divided.
Ayes 5 Noes 2 Mr Elsbury Mr Ondarchie Mr Scheffer Mr Tee Ms Tierney
Ms Pennicuik Mrs Peulich
Amendment agreed to.

Appendix D: Extracts of the proceedings
137
Ms Pennicuik moved, That Recommendation 7 be omitted with the view of inserting in its place the following ‘That the Victorian Government amends the Victoria Planning Provisions to require growth area residential developments to achieve housing densities substantially higher than the current average density minimum of 15 dwellings per net developable hectare along with minimum requirements for public open space.’
The Committee divided.
Ayes 1 Noes 6 Ms Pennicuik
Mr Elsbury Mr Ondarchie Mrs Peulich Mr Scheffer Mr Tee Ms Tierney
Amendment negatived.
Mr Elsbury moved, That Recommendation 7 as amended stand part of the Report.
The Committee divided.
Ayes 5 Noes 2 Mr Elsbury Mr Ondarchie Mr Scheffer Mr Tee Ms Tierney
Ms Pennicuik Mrs Peulich
Recommendation agreed to.
Recommendation 16
That the Victorian Government revises the Precinct Structure Planning Guidelines to:
identify public health and wellbeing as a priority matter for Precinct Structure Plans
provide clear direction on how public health and wellbeing should be advanced within Precinct Structure Plans.
Mr Elsbury moved, That Recommendation 17 stand part of the Report.
The Committee divided.
Ayes 6 Noes 1 Mr Elsbury Mr Scheffer Ms Pennicuik Mrs Peulich Mr Tee Ms Tierney
Mr Ondarchie
Recommendation agreed to.
Recommendation 18
That Planning Panels Victoria ensures that all panels established as part of the growth areas Precinct Structure Planning process have a public health specialist as part of their membership.

Inquiry into Environmental Design and Public Health in Victoria
138
Mrs Peulich moved, That the after the word ‘have’ the following be inserted ‘access to the expert knowledge of’.
The Committee divided.
Ayes 3 Noes 4 Mr Elsbury Mr Ondarchie Mrs Peulich
Ms Pennicuik Mr Scheffer Mr Tee Ms Tierney
Amendment negatived.
Ms Pennicuik moved, That Recommendation 18 stand part of the Report.
The Committee divided.
Ayes 4 Noes 3 Ms Pennicuik Mr Scheffer Mr Tee Ms Tierney
Mr Elsbury Mr Ondarchie Mrs Peulich
Recommendation agreed to.
2 May 2012
Recommendation 21
That the Victorian Government, recognising that the work of all government agencies influence health and wellbeing, adopts a ‘whole‐of‐government’ approach to health policy‐making, such as the ‘Health in All Policies’ model used by the South Australian Government and the European Union.
Mr Elsbury moved, That all words after ‘policy‐making’ be omitted.
The Committee divided.
Ayes 4 Noes 4 Mr Elsbury Mrs Kronberg Mr Ondarchie Mrs Peulich
Ms Pennicuik Mr Scheffer Mr Tee Ms Tierney
There being an equality of votes, the Chair gave her casting vote for the Noes.
Amendment negatived.
Mr Scheffer moved, That Recommendation 21 stand part of the Report.
The Committee divided.
Ayes 4 Noes 4 Ms Pennicuik Mr Scheffer Mr Tee Ms Tierney
Mr Elsbury Mrs Kronberg Mr Ondarchie Mrs Peulich
There being an equality of votes, the Chair gave her casting vote for the Ayes.
Recommendation agreed to.

Appendix D: Extracts of the proceedings
139
Recommendation 9
That Environment Protection Authority Victoria is given a strategic role at an early stage in major land use planning decisions.
Mrs Kronberg moved, That Recommendation 9 stand part of the Report.
The Committee divided.
Ayes 6 Noes 2 Mr Elsbury Ms Pennicuik Mrs Peulich Mr Scheffer Mr Tee Ms Tierney
Mrs Kronberg Mr Ondarchie
Recommendation agreed to.
Recommendation 17
That the Victorian Government reviews the Urban Design Charter to:
strengthen the role and function of the Charter in guiding Victorian urban design
ensure that design objectives which promote health and wellbeing are included in the Charter.
Mr Elsbury moved, That the first dot point be omitted.
The Committee divided.
Ayes 4 Noes 4 Mr Elsbury Mrs Kronberg Mr Ondarchie Mrs Peulich
Ms Pennicuik Mr Scheffer Mr Tee Ms Tierney
There being an equality of votes, the Chair gave her casting vote for the Noes.
Amendment negatived.
Mrs Peulich moved, That the second dot point be omitted with a view of inserting in its place ‘ensure the inclusion in the Charter design objectives which promote health and wellbeing.’
The Committee divided.
Ayes 4 Noes 4 Mr Elsbury Mrs Kronberg Mr Ondarchie Mrs Peulich
Ms Pennicuik Mr Scheffer Mr Tee Ms Tierney
There being an equality of votes, the Chair gave her casting vote for the Noes.
Amendment negatived.
Ms Pennicuik moved, That Recommendation 17 stand part of the Report.
The Committee divided.
Inquiry into Environmental Design and Public Health in Victoria
140
Ayes 4 Noes 4 Ms Pennicuik Mr Scheffer Mr Tee Ms Tierney
Mr Elsbury Mrs Kronberg Mr Ondarchie Mrs Peulich
There being an equality of votes, the Chair gave her casting vote for the Ayes.
Recommendation agreed to.
Recommendation 19
That the Victorian Government appoints public health specialists (or persons with appropriate health expertise) to the Boards of the Growth Areas Authority and Urban Renewal Authority.
Mrs Peulich moved, That the word ‘appoints’ be omitted with a view of inserting in its place ‘considers appointing’ and that the words ‘specialists (or persons’ be omitted with a view of inserting in its place ‘specialist (or person’.
The Committee divided.
Ayes 4 Noes 4 Mr Elsbury Mrs Kronberg Mr Ondarchie Mrs Peulich
Ms Pennicuik Mr Scheffer Mr Tee Ms Tierney
There being an equality of votes, the Chair gave her casting vote for the Noes.
Amendment negatived.
Ms Pennicuik moved, That Recommendation 19 stand part of the Report.
The Committee divided.
Ayes 4 Noes 4 Ms Pennicuik Mr Scheffer Mr Tee Ms Tierney
Mr Elsbury Mrs Kronberg Mr Ondarchie Mrs Peulich
There being an equality of votes, the Chair gave her casting vote for the Ayes.
Recommendation agreed to.
Recommendation 8
That the Victorian Government:
undertakes a systematic and coordinated audit of contaminated land sites and reviews the implications for health and wellbeing
reviews the current legislative framework for developing contaminated land with a view to making it clearer and more consistent.
Ms Pennicuik moved, That after the word ‘Government’ the following be inserted ‘as part of its response to the Victorian Auditor‐General’s reports in relation to contaminated sites’.
The Committee divided.

Appendix D: Extracts of the proceedings
141
Ayes 4 Noes 4 Ms Pennicuik Mr Scheffer Mr Tee Ms Tierney
Mr Elsbury Mrs Kronberg Mr Ondarchie Mrs Peulich
There being an equality of votes, the Chair gave her casting vote for the Ayes.
Amendment agreed to.
Mrs Peulich moved, That the amended paragraph be omitted with a view of inserting in its place ‘As part of its response to the Victorian Auditor‐General’s reports in relation to contaminated sites, the Victorian Government, together with local government’ and that in the first dot point the word ‘audit’ be omitted with a view of inserting in its place the word ‘review’ and the words ‘and reviews’ be omitted with a view of inserting in their place ‘audit and considers’.
The Committee divided.
Ayes 5 Noes 3 Mr Elsbury Mrs Kronberg Mr Ondarchie Ms Pennicuik Mrs Peulich
Mr Scheffer Mr Tee Ms Tierney
Amendment agreed to.
Recommendation 5
That the Department of Planning and Community Development and the Department of Health urgently develop a joint response to the emerging health problems stemming from poor air quality and the urban heat island effect in Melbourne. As part of this, the design of residential communities should prioritise tree planting and green spaces to provide shade, improve respiratory health and to lower ambient temperatures in summer months.
Mrs Peulich moved, That all words after ‘Melbourne’ be omitted with a view to inserting in their place ‘As part of this, the design of residential communities and commercial precincts should place importance on tree planting, the provision of shade structures (such as awnings and shade sails) and green spaces to improve respiratory health and to lower ambient temperatures in summer months.
Furthermore, State Government planning policies recognise the need for a balance between housing density and exacerbating the urban heat island effect.’
The Committee divided.
Ayes 4 Noes 4 Mr Elsbury Mrs Kronberg Mr Ondarchie Mrs Peulich
Ms Pennicuik Mr Scheffer Mr Tee Ms Tierney
There being an equality of votes, the Chair gave her casting vote for the Noes.
Amendment negatived.
Ms Pennicuik moved, That the words ‘That the Department of Planning and Community Development and the Department of Health urgently develop a joint response to the’ be omitted with a view of inserting in their place ‘That the Victorian Government urgently develops a whole‐of‐government response to the’.

Inquiry into Environmental Design and Public Health in Victoria
142
The Committee divided.
Ayes 4 Noes 4 Ms Pennicuik Mr Scheffer Mr Tee Ms Tierney
Mr Elsbury Mrs Kronberg Mr Ondarchie Mrs Peulich
There being an equality of votes, the Chair gave her casting vote for the Ayes.
Amendment agreed to.
Ms Pennicuik moved, That Recommendation 5 as amended stand part of the Report.
The Committee divided.
Ayes 4 Noes 4 Ms Pennicuik Mr Scheffer Mr Tee Ms Tierney
Mr Elsbury Mrs Kronberg Mr Ondarchie Mrs Peulich
There being an equality of votes, the Chair gave her casting vote for the Ayes.
Recommendation agreed to.
Recommendation 1
That the Victorian Government:
commissions further research into the cumulative health and wellbeing impacts of the density of fast food outlets on a community
assists local governments to map all food outlets within a local government area
develops a local government planning mechanism that can be used to limit the oversupply of fast food outlets in communities.
Mr Elsbury moved, That the following be inserted after dot point 1 as a new dot point ‘That the same research be carried out in supermarkets to assess the high fat, high sugar and high salt foods, which are made available as a comparison to fresh food and healthy easy meal options.’
The Committee divided.
Ayes 4 Noes 4 Mr Elsbury Mrs Kronberg Mr Ondarchie Mrs Peulich
Ms Pennicuik Mr Scheffer Mr Tee Ms Tierney
There being an equality of votes, the Chair gave her casting vote for the Noes.
Amendment negatived.
Ms Pennicuik moved, That in the first dot point the words ‘commissions further’ be omitted with a view of inserting in their place ‘works with VicHealth to commission further Victorian’.
The Committee divided.

Appendix D: Extracts of the proceedings
143
Ayes 4 Noes 4 Ms Pennicuik Mr Scheffer Mr Tee Ms Tierney
Mr Elsbury Mrs Kronberg Mr Ondarchie Mrs Peulich
There being an equality of votes, the Chair gave her casting vote for the Ayes.
Amendment agreed to.
Mr Tee moved, That the third dot point be omitted with a view of inserting in its place ‘develops a planning mechanism that can be used by local councils to limit the oversupply of fast food outlets in communities.’
The Committee divided.
Ayes 4 Noes 4 Ms Pennicuik Mr Scheffer Mr Tee Ms Tierney
Mr Elsbury Mrs Kronberg Mr Ondarchie Mrs Peulich
There being an equality of votes, the Chair gave her casting vote for the Ayes.
Amendment agreed to.
Mrs Peulich moved, That the amended dot point three be omitted with a view of inserting in its place ‘develops a plan to facilitate the supply of healthy food choices to its community.’
The Committee divided.
Ayes 4 Noes 4 Mr Elsbury Mrs Kronberg Mr Ondarchie Mrs Peulich
Ms Pennicuik Mr Scheffer Mr Tee Ms Tierney
There being an equality of votes, the Chair gave her casting vote for the Noes.
Amendment negatived.
Mrs Peulich moved, That Recommendation 1 be broken into four parts numbered Recommendation 1.1, 1.2, 1.3 and 1.4, and that each one will be put separately.
The Committee divided.
Ayes 4 Noes 4 Mr Elsbury Mrs Kronberg Mr Ondarchie Mrs Peulich
Ms Pennicuik Mr Scheffer Mr Tee Ms Tierney
There being an equality of votes, the Chair gave her casting vote for the Noes.
Procedural motion negatived.
Ms Pennicuik moved, That Recommendation 1 as amended stand part of the Report.
The Committee divided.
Ayes 4 Noes 4 Ms Pennicuik Mr Scheffer Mr Tee Ms Tierney
Mr Elsbury Mrs Kronberg Mr Ondarchie Mrs Peulich

Inquiry into Environmental Design and Public Health in Victoria
144
There being an equality of votes, the Chair gave her casting vote for the Ayes.
Recommendation agreed to.
Recommendation 2
That the Victorian Government conducts a review into the economic, environmental and social importance of the food system and its consequences for public health.
Ms Pennicuik moved, That the words ‘food system’ be omitted with a view of inserting in their place ‘food production and distribution in Victoria’.
The Committee divided.
Ayes 4 Noes 4 Ms Pennicuik Mr Scheffer Mr Tee Ms Tierney
Mr Elsbury Mrs Kronberg Mr Ondarchie Mrs Peulich
There being an equality of votes, the Chair gave her casting vote for the Ayes.
Amendment agreed to.
Ms Pennicuik moved, That Recommendation 2 as amended stand part of the Report.
The Committee divided.
Ayes 4 Noes 4 Ms Pennicuik Mr Scheffer Mr Tee Ms Tierney
Mr Elsbury Mrs Kronberg Mr Ondarchie Mrs Peulich
There being an equality of votes, the Chair gave her casting vote for the Ayes.
Recommendation agreed to.
Recommendation 4
That the Victorian Government:
commissions further research into the cumulative health and wellbeing impacts of the density of packaged liquor outlets on a community
continues to strengthen planning mechanisms to allow local government to regulate the number of packaged liquor outlets in particular areas.
Ms Pennicuik moved, That in the first dot point before the word ‘commissions’ the following be inserted ‘works with VicHealth to’ and that after the word ‘further’ the following be inserted ‘Victorian’.
The Committee divided.
Ayes 4 Noes 4 Ms Pennicuik Mr Scheffer Mr Tee Ms Tierney
Mr Elsbury Mrs Kronberg Mr Ondarchie Mrs Peulich
There being an equality of votes, the Chair gave her casting vote for the Ayes.
Appendix D: Extracts of the proceedings
145
Amendment agreed to.
Mr Tee moved, That in the second dot point the words ‘continues to strengthen’ be omitted with a view of inserting in their place ‘strengthens’ and that the word ‘number’ be omitted with a view of inserting in its place ‘oversupply’.
The Committee divided.
Ayes 4 Noes 4 Ms Pennicuik Mr Scheffer Mr Tee Ms Tierney
Mr Elsbury Mrs Kronberg Mr Ondarchie Mrs Peulich
There being an equality of votes, the Chair gave her casting vote for the Ayes.
Amendment agreed to.
Mrs Peulich moved, That the amended Recommendation be omitted with a view of inserting in its place the following: ‘That the Victorian Government:
commissions further research into the cumulative health and wellbeing impacts of the density of packaged liquor outlets on a community and volume of liquor sold with a view to developing policies which reduce alcohol related harm
be congratulated for strengthening the planning mechanisms to allow local government to regulate the number of packaged liquor outlets in particular areas, especially given that Labor did not act on this over its 11 years in office.’
The Committee divided.
Ayes 4 Noes 4 Mr Elsbury Mrs Kronberg Mr Ondarchie Mrs Peulich
Ms Pennicuik Mr Scheffer Mr Tee Ms Tierney
There being an equality of votes, the Chair gave her casting vote for the Noes.
Amendment negatived.
Ms Pennicuik moved, That Recommendation 4 as amended stand part of the Report.
The Committee divided.
Ayes 4 Noes 4 Ms Pennicuik Mr Scheffer Mr Tee Ms Tierney
Mr Elsbury Mrs Kronberg Mr Ondarchie Mrs Peulich
There being an equality of votes, the Chair gave her casting vote for the Ayes.
Recommendation agreed to.
Recommendation 10
That the Victorian Government supports the introduction of visitable and adaptable design standards for new housing to ensure access for seniors and people with limited mobility.
Mr Tee moved, That the words ‘visitable and adaptable’ be omitted.
Inquiry into Environmental Design and Public Health in Victoria
146
The Committee divided.
Ayes 4 Noes 4 Ms Pennicuik Mr Scheffer Mr Tee Ms Tierney
Mr Elsbury Mrs Kronberg Mr Ondarchie Mrs Peulich
There being an equality of votes, the Chair gave her casting vote for the Ayes.
Amendment agreed to.
Mrs Peulich moved, That the recommendation be omitted with a view of inserting in its place the following ‘That the Victorian Government supports the introduction of visitable and adaptable design standards for a portion of new housing estates to ensure access for seniors and people with limited mobility.’
The Committee divided.
Ayes 4 Noes 4 Mr Elsbury Mrs Kronberg Mr Ondarchie Mrs Peulich
Ms Pennicuik Mr Scheffer Mr Tee Ms Tierney
There being an equality of votes, the Chair gave her casting vote for the Noes.
Amendment negatived.
Mr Tee moved, That Recommendation 10 as amended stand part of the Report.
The Committee divided.
Ayes 4 Noes 4 Ms Pennicuik Mr Scheffer Mr Tee Ms Tierney
Mr Elsbury Mrs Kronberg Mr Ondarchie Mrs Peulich
There being an equality of votes, the Chair gave her casting vote for the Ayes.
Recommendation agreed to.
Recommendation 11
That the Victorian Government works with local government, developers, the building industry and community groups to ensure that universal design principles that improve accessibility are applied to all aspects of the built environment, including the maintenance and retrofitting of existing building stock, roadways, cycling and pedestrian paths, and public transport infrastructure.
The Committee further recommends that, within 12 months, the Department of Planning and Community Development assesses progress and reports back to the Parliament annually on measures taken to improve the accessibility of the built environment in Victoria.
Mr Tee moved, That in the second paragraph the words ‘within 12 months’ be omitted.
The Committee divided.

Appendix D: Extracts of the proceedings
147
Ayes 4 Noes 4 Ms Pennicuik Mr Scheffer Mr Tee Ms Tierney
Mr Elsbury Mrs Kronberg Mr Ondarchie Mrs Peulich
There being an equality of votes, the Chair gave her casting vote for the Ayes.
Amendment agreed to.
Mr Peulich moved, That in the first paragraph the words ‘to ensure that’ be omitted with a view of inserting in their place ‘to examine the appropriate application of’.
The Committee divided.
Ayes 4 Noes 4 Mr Elsbury Mrs Kronberg Mr Ondarchie Mrs Peulich
Ms Pennicuik Mr Scheffer Mr Tee Ms Tierney
There being an equality of votes, the Chair gave her casting vote for the Noes.
Amendment negatived.
Mr Scheffer moved, That Recommendation 11 as amended stand part of the Report.
The Committee divided.
Ayes 4 Noes 4 Ms Pennicuik Mr Scheffer Mr Tee Ms Tierney
Mr Elsbury Mrs Kronberg Mr Ondarchie Mrs Peulich
There being an equality of votes, the Chair gave her casting vote for the Ayes.
Recommendation agreed to.
Recommendation 28
That the Victorian Government takes the following steps to ensure high quality open spaces are available:
amends the Precinct Structure Planning Guidelines to establish minimum requirements for open space, including features such as walking paths, play equipment, adult exercise equipment, seating and shade
provides guidance to local government on appropriate rating tools for assessing the quality of public open space
supports the ongoing maintenance of existing open space and funds green and other public spaces in new residential developments, particularly in high density areas.
Mrs Peulich moved, That in the first dot point the word ‘new’ be added before ‘Precinct’, and the words ‘minimum requirements’ be omitted with a view of inserting in their place ‘targets’, and in the third dot point the word ‘funds’ be omitted with a view of inserting in its place ‘the establishment of’.
The Committee divided.

Inquiry into Environmental Design and Public Health in Victoria
148
Ayes 4 Noes 4 Mr Elsbury Mrs Kronberg Mr Ondarchie Mrs Peulich
Ms Pennicuik Mr Scheffer Mr Tee Ms Tierney
There being an equality of votes, the Chair gave her casting vote for the Noes.
Amendment negatived.
Mr Tee moved, That the third dot point be omitted with a view of inserting the following in its place ‘supports the ongoing maintenance of existing open space and the establishment of green and other public spaces in new residential developments, particularly in high density areas’.
The Committee divided.
Ayes 7 Noes 1 Mr Elsbury Mr Ondarchie Ms Pennicuik Mrs Peulich Mr Scheffer Mr Tee Ms Tierney
Mrs Kronberg
Recommendation agreed to.
Mr Tee moved, That Recommendation 28 as amended stand part of the Report.
The Committee divided.
Ayes 4 Noes 4 Ms Pennicuik Mr Scheffer Mr Tee Ms Tierney
Mr Elsbury Mrs Kronberg Mr Ondarchie Mrs Peulich
There being an equality of votes, the Chair gave her casting vote for the Ayes.
Recommendation agreed to.
Recommendation 32
That the Victorian Government recognises that public transport is a key component of a healthy community, and:
audits current public transport provision, with an emphasis on outer suburban and regional areas
establishes minimum standards and targets for public transport in new outer suburban residential developments, linking important destinations such as schools, shops, places of work, community facilities and green and open public spaces
commits to a program of long‐term investment to improve public transport infrastructure for Melbourne’s outer suburbs and regional metropolitan areas.
Mrs Peulich moved, That the first paragraph be omitted with a view of inserting in its place the following ‘That the recently tabled Victorian Auditor General’s report Public Transport Performance (February 2012) on the failure of the previous government to provide necessary public transport infrastructure to meet Victoria’s population growth be noted.’ And in the second dot point the

Appendix D: Extracts of the proceedings
149
words ‘minimum standards and targets’ be omitted with a view of inserting in their place ‘objectives’ and that the following be added at the end of the third dot point ‘as recently recommended by the Victorian Auditor General following adverse findings of the Victorian Labor government’s failure to adequately invest in public transport to keep pace with population growth.’
The Committee divided.
Ayes 3 Noes 4 Mr Elsbury Mr Ondarchie Mrs Peulich
Ms Pennicuik Mr Scheffer Mr Tee Ms Tierney
Amendment negatived.
Mr Scheffer moved, That Recommendation 32 as amended stand part of the Report.
The Committee divided.
Ayes 4 Noes 3 Ms Pennicuik Mr Scheffer Mr Tee Ms Tierney
Mr Elsbury Mr Ondarchie Mrs Peulich
Recommendation agreed to.
3 May 2012
Recommendation 35
That the Victorian Government considers introducing 30 kilometres per hour speed limits in school and residential areas.
Mrs Peulich moved, That Recommendation 35 be omitted with the view of inserting in its place: ‘That the case for the lowering of speed limits for school and other areas be considered by current or future speed limit reviews undertaken by VicRoads in consultation with the Victoria Police and other stakeholders.’
The Committee divided.
Ayes 4 Noes 4 Mr Elsbury Mrs Kronberg Mr Ondarchie Mrs Peulich
Ms Pennicuik Mr Scheffer Mr Tee Ms Tierney
There being an equality of votes, the Chair gave her casting vote for the Noes.
Amendment negatived.
Mr Tee moved, That Recommendation 35 be omitted with the view of inserting in its place: ‘That the case for the lowering of speed limits to 30 kilometres per hour for school, residential and other appropriate areas be considered by current or future speed limit reviews undertaken by VicRoads in consultation with the Victoria Police and other stakeholders.’
The Committee divided.

Inquiry into Environmental Design and Public Health in Victoria
150
Ayes 4 Noes 4 Ms Pennicuik Mr Scheffer Mr Tee Ms Tierney
Mr Elsbury Mrs Kronberg Mr Ondarchie Mrs Peulich
There being an equality of votes, the Chair gave her casting vote for the Ayes.
Recommendation agreed to.
Recommendation 33
That the Department of Transport ensures that public transport networks are safe and accessible for all sections of the community.
Ms Pennicuik moved, That Recommendation 33 be omitted with the view of inserting in its place: ‘That the Department of Transport ensures that public transport networks are connected, safe, reliable and accessible for all sections of the community.’
The Committee divided.
Ayes 1 Noes 7 Ms Pennicuik Mr Elsbury
Mrs Kronberg Mr Ondarchie Mrs Peulich Mr Scheffer Mr Tee Ms Tierney
Amendment negatived.
Chapter 3
Mr Tee moved, That Chapter 3, including recommendations 1 to 5, stand part of the Report.
The Committee divided.
Ayes 4 Noes 3 Ms Pennicuik Mr Scheffer Mr Tee Ms Tierney
Mr Elsbury Mr Ondarchie Mrs Peulich
Question agreed to.
Chapter 4
Mr Scheffer moved, That Chapter 4, including recommendations 6 to 11, stand part of the Report.
The Committee divided.
Ayes 4 Noes 3 Ms Pennicuik Mr Scheffer Mr Tee Ms Tierney
Mr Elsbury Mr Ondarchie Mrs Peulich
Question agreed to.

Appendix D: Extracts of the proceedings
151
Chapter 5
Mr Tee moved, That Chapter 5, including recommendations 12 to 25, stand part of the Report.
The Committee divided.
Ayes 4 Noes 3 Ms Pennicuik Mr Scheffer Mr Tee Ms Tierney
Mr Elsbury Mr Ondarchie Mrs Peulich
Question agreed to.
Chapter 6
Ms Pennicuik moved, That Chapter 6, including recommendations 26 to 29, stand part of the Report.
The Committee divided.
Ayes 6 Noes 1 Mr Elsbury Ms Pennicuik Mrs Peulich Mr Scheffer Mr Tee Ms Tierney
Mr Ondarchie
Question agreed to.
Chapter 7
Ms Pennicuik moved, That Chapter 7, including recommendations 30 to 35, stand part of the Report.
The Committee divided.
Ayes 4 Noes 3 Ms Pennicuik Mr Scheffer Mr Tee Ms Tierney
Mr Elsbury Mr Ondarchie Mrs Peulich
Question agreed to.
Chapter 8
Mr Scheffer moved, That Chapter 8, including recommendation 36, stand part of the Report.
The Committee divided.
Ayes 4 Noes 3 Ms Pennicuik Mr Scheffer Mr Tee Ms Tierney
Mr Elsbury Mr Ondarchie Mrs Peulich
Question agreed to.

Inquiry into Environmental Design and Public Health in Victoria
152
Executive Summary
Mr Tee moved, That the Executive Summary stand part of the Report.
The Committee divided.
Ayes 4 Noes 2 Ms Pennicuik Mr Scheffer Mr Tee Ms Tierney
Mr Elsbury Mr Ondarchie
Question agreed to.
Bibliography
153
Bibliography
2009 Victorian Bushfires Royal Commission 2010 Victorian Bushfires Royal Commission – Final Report Summary, Parliament of Victoria, Melbourne.
Abraham A, Sommerhalder K and Abel T, ‘Landscape and well‐being: a scoping study on the health‐promoting impact of outdoor environments’, International Journal of Public Health, February 2010, 55 (1): 59‐69.
Active Healthy Communities, ‘Limit Access to Fast Foods’, Queensland Government and Heart Foundation, http://bit.ly/JmbPF1
Albrechtsen, J, ‘Our kids are covered in bubble wrap’, The Australian, 28 December 2011, http://bit.ly/zc5Msa
Alzheimer’s Australia, ‘Types of dementia’, http://bit.ly/ImTbkJ
_______ 2011 Dementia across Australia: 2011‐2050, report prepared by Deloitte Access Economics Pty Ltd, Canberra.
_______ ‘Statistics: National Facts and Figures 2012’, http://bit.ly/HCprQn
Ambulance Victoria 2009 Ambulance Victoria Strategic Plan 2010 – 2012, Draft for Consultation, Ambulance Victoria, Melbourne.
Asthma Foundation, ‘Causes’, http://bit.ly/HNiawI
_______ ‘Children and asthma’, http://bit.ly/IiJB3F
Asthma Foundation of Victoria, ‘Asthma Facts’, 2012, http://bit.ly/r4Eviw
_______ ‘Asthma the Basics’, 2012, http://bit.ly/I1d1j4
Attorney‐General’s Department 2010 Australia to 2050: future challenges, Commonwealth of Australia, Canberra.
Auchincloss AH, Diez Roux AV, Mujahid MS, Shen M, Bertoni AG and Carnethon MR, ‘Neighborhood Resources for Physical Activity and Healthy Foods and Incidence of Type 2 Diabetes Mellitus: The Multi‐Ethnic Study of Atherosclerosis’, Archives of Internal Medicine, 12 October 2009, 169 (18): 1698–1704.
Australian Bureau of Statistics 2001 Measuring Wellbeing: Frameworks for Australian Social Statistics, ABS, Canberra.
_______ 2008 National Survey of Mental Health and Wellbeing: Summary of Results 2007, http://bit.ly/rKPfA7
_______ ‘Population by Age and Sex, Australian States and Territories, Jun 2010’, 2010, http://bit.ly/5XlX8o
_______ ‘Health and socioeconomic disadvantage’, 2010, http://bit.ly/JAaXSD
_______ ‘General Social Survey: Summary Results, Australia, 2010: Feelings of Safety’, 2011, http://bit.ly/xhLXpa
_______ ‘Heart diseases decrease over a decade’, media release, 2012, http://bit.ly/Iq3HqA
_______ ‘Regional Population Growth, Australia, 2009‐10’, 2012, http://bit.ly/HAs6IG
Australian Chronic Disease Prevention Alliance, ‘Alcohol and Chronic Disease Prevention: Position Statement’, http://bit.ly/IN7tXg
_______ Submission to Senate Standing Committee on Community Affairs, 2007, http://bit.ly/wRjrb2
Australian Institute of Health and Welfare 2003 Population Health Monitoring and Surveillance: Question Development Background Paper: Cardiovascular Disease in Australia, CATI Technical Reference Group and National Public Health Partnership, Canberra.
_______ 2009 Chronic disease and participation in work, AIHW, Canberra.
_______ 2010 Australia’s health 2010, AIHW, Canberra.
_______ ‘About chronic disease’, 2011, http://bit.ly/IuCkr7
_______ 2011 Health and the environment: a compilation of evidence, AIHW, Canberra.
_______ 2011 Health expenditure Australia 2009‐10, AIHW, Canberra.
_______ 2011 Mental health services – in brief 2011, AIHW, Canberra.

Inquiry into Environmental Design and Public Health in Victoria
154
_______ ‘Overweight and obesity’, 2011, http://bit.ly/teaZjy
Australian Institute of Landscape Architects, ‘National Policy Statement: School Landscapes’, AILA, Canberra, 2010.
_______ ‘National Policy Statement: Retrofitting Urban Environments’, AILA, Canberra, 2011.
Australian Medical Association, Alcohol Use and Harms in Australia (2009) – Information paper, 2009, http://ama.com.au/node/4762
Badland HM and Schofield GM, ‘Transport, urban design, and physical activity: an evidence‐based update’, Transportation Research Part D: Transport and Environment, 2005, 10 (3): 177‐196.
Baillieu T, ‘Coalition Government gives communities a say on bottle shops’, media release, Department of Premier and Cabinet, Victorian Government, 1 April 2011, http://bit.ly/ACGOGm
Baker IDI Heart and Diabetes Institute 2012 Diabetes: the silent pandemic and its impact on Australia, Baker IDI Heart and Diabetes Institute, Melbourne.
Banerjee T and Loukaitou‐Sideris A (eds), Companion to Urban Design, Taylor & Francis, Oxon, 2011.
Banks G, ‘Health costs and policy in an ageing Australia’, Health Policy Oration 2008, Menzies Centre for Health Policy, John Curtin School of Medical Research, ANU, Canberra, 26 June 2008.
Bassuk SS and Manson JE, 'Epidemiological evidence for the role of physical activity in reducing risk of type 2 diabetes and cardiovascular disease', Journal of Applied Physiology, 2005, 99: 1193‐1204.
Bauman A, Bellew B, Vita P, Brown W and Owen N, Getting Australia active: towards better practice for the promotion of physical activity, National Public Health Partnership, Melbourne, 2002.
Bauman AE and Bull FC, ‘Environmental Correlates of Physical Activity And Walking in Adults and Children: A Review of Reviews’, review undertaken for National Institute of Health and Clinical Excellence, London, 2007.
Bauman A, Rissel C, Garrard J, Ker I, Speidel R and Fishman E, Cycling: Getting Australia Moving: Barriers, facilitators and interventions to get more Australians physically active through cycling, Cycling Promotion Fund, Melbourne, 2008.
Begg S, Vos T, Barker B, Stevenson C, Stanley L and Lopez A, Burden of disease and injury in Australia 2003, Australian Institute of Health and Welfare, Canberra, 2007.
Bell JF, Wilson JS and Liu GC, ‘Neighborhood greenness and 2‐year changes in body mass index of children and youth’, American Journal of Preventive Medicine, December 2008, 35 (6): 547‐553.
Better Health Channel, ‘Healthy living’, 2012, http://bit.ly/pVOVqL
beyondblue, ‘Chronic physical illness and depression, Fact sheet 23’, 2012.
Bhatia R, Health Impact Assessment: A Guide for Practice, Human Impact Partners, Oakland CA, 2011.
Bicycle Network Victoria 2011 BiXE 2011, The Bicycle Expenditure Index for Local Government, 2011‐2012 Financial Year, BNV, Melbourne.
Bicycle Victoria, Submission to Outer Suburban/Interface Services & Development Committee, 13 May 2011, http://bit.ly/HDWKVp
Black E, Blackburn M, Harrison G, Hoskins B and Methven J, ‘Factors contributing to the summer 2003 European heatwave’, Weather, 2004, 59: 217–223.
Bodor JN, Rose D, Farley TA, Swalm C and Scott SK, ‘Neighbourhood fruit and vegetable availability and consumption: the role of small food stores in an urban environment’, Public Health Nutrition, April 2008, 11 (4): 413‐420.
Boyce C and Shelton V, Leopold Strategic Footpath Network: Health Impact Assessment, City of Greater Geelong, 2008.
‘Bradmill Precinct West Yarraville’, Concept Plan, MGS Architects and Tract Consultants, Melbourne.
Brown K, ‘Care Farms – an overview’, University of Brighton, http://bit.ly/yiAWUx
Bureau of Infrastructure, Transport and Regional Economics 2011 Population growth, jobs growth and commuting flows in Melbourne – Report 125, Commonwealth of Australia, Canberra.
Bus Association Victoria, ‘Public Transport Use a Ticket to Health’, 2010, http://bit.ly/AmwSJp
Butterworth I, The Relationship between the Built Environment and Wellbeing: a Literature Review, VicHealth, Melbourne, 2000.

Bibliography
155
Buxton M, Alvarez A, Butt A, Farrell S and O’Neill D, Planning Sustainable Futures For Melbourne’s Peri‐Urban Region, School of Global Studies, Social Science and Planning, Royal Melbourne Institute of Technology, 2008.
Caldwell, A, ‘“Lifestyle” diseases the world's biggest killer’, ABC News, 28 April 2011, http://bit.ly/IfwJa2
Cameron AJ, Welborn TA, Zimmet PZ, Dunstan DW, Owen N, Salmon J, Dalton M, Jolley D and Shaw JE, ‘Overweight and obesity in Australia: the 1999–2000 Australian Diabetes, Obesity and Lifestyle Study (AusDiab)’, Medical Journal of Australia, 2003, 178 (9): 427‐432.
Campbell‐Lendrum D and Corvalan C, ‘Climate Change and Developing‐Country Cities: Implications For Environmental Health and Equity’, Journal of Urban Health: Bulletin of the New York Academy of Medicine, 2007, 84 (1): i110‐i111.
Cancer Council New South Wales 2008 The Shade Handbook, Sydney.
Capon A, ‘The view from the city’, World Health Design, July 2011, 4: 6‐9.
Capon AG, ‘The way we live in our cities’, Medical Journal of Australia, 2007, 187: 658‐661.
Care Farming UK, ‘What is Care Farming?’ http://www.carefarminguk.org/
Carey A, ‘Epping hell: estate residents “betrayed” by promises’, Sydney Morning Herald, 15 December 2011, http://bit.ly/yZTBYP
Carey R and McConell K, A Resilient Fruit and Vegetable Supply for a Healthy Victoria: Working together to secure the future, Food Alliance, Melbourne, 2011.
Centre for Health through Action on Social Exclusion, Evaluation of the Environments for Health Framework, Final Report, Faculty of Health, Medicine, Nursing and Behavioural Sciences, Deakin University and the Program Evaluation Unit, School of Population Health, University of Melbourne, 2006.
Chikritzhs T, Catalano P, Pascal R and Henrickson N, Predicting alcohol‐related harms from licensed outlet density: a feasibility study, Monograph Series No. 28. National Drug Law Enforcement Research Fund, Hobart, 2007.
City of Ballarat, ‘Fact Sheet 1 – healthy, safe & inclusive communities’, http://bit.ly/IdQTWh
City of Greater Geelong 2010 Armstrong Creek Urban Growth Plan, Volume 1, City of Greater Geelong, 2010.
_______ ‘About Armstrong Creek’, 2011, http://bit.ly/xbfgpr
_______ ‘City statistics’, 2011, http://bit.ly/HIOBfC
_______ ‘Greater Geelong Planning Scheme Amendment C214 East Precinct Development Contributions Plan Exhibition’, 2011, http://bit.ly/IrPLxc
_______ ‘Case Studies HPHP active in parks January 2012’, Active in Parks pamphlet, Geelong, 2012.
City of Kingston 2011 Kingston Green Wedge Plan, Draft Plan for Consultation, Melbourne.
City of Melbourne, ‘2006 City of Melbourne Workers Census Demographic Profile’, 2008, http://bit.ly/AmAIZE
City of New York, Active Design Guidelines: Promoting Physical Activity and Health in Design, 2010, http://bit.ly/9d3pQ7
Clark R, Armstrong R and Waters E, Local government and obesity prevention: An evidence resource. Interventions to prevent obesity in early years settings; tackling food insecurity and built environment changes to support physical activity, CO‐OPS Secretariat, Deakin University, Melbourne, 2010.
Climate Commission, ‘The Critical Decade: key messages’, 2011, http://bit.ly/jxvyxx
Commonwealth Scientific and Industrial Research Organisation, ‘Sustainable cities and coasts’, 2011, http://bit.ly/I4QOkj
Corio Norlane Development Advisory Board 2009 Healthy Community Plan 2009‐2013, http://bit.ly/yP676c
_______ ‘Analysis of Health Priorities – Health & Wellbeing’, 2009, http://bit.ly/HY6J1f
_______ ‘Healthy Community Plan’, 2009, http://bit.ly/ILJrlB
Council on the Ageing, ‘Urgent reform needed so all Australians can Age Well’, media release, 22 December 2011, http://bit.ly/wxM6ow
Inquiry into Environmental Design and Public Health in Victoria
156
Coutts AM, Beringer J, Jimi S and Tapper NJ, ‘The urban heat island in Melbourne: drivers, spatial and temporal variability, and the vital role of stormwater’, Monash University, Melbourne, 2009.
Cunningham GO and Michael YL, ‘Concepts Guiding the Study of the Impact of the Built Environment on Physical Activity for Older Adults: A Review of the Literature’, American Journal of Health Promotion, July‐August 2004, 18 (6): 435–443.
Currie G and Senbergs Z, ‘Exploring forced car ownership in metropolitan Melbourne’, Australasian Transport Research Forum, 2007.
Cycling Promotion Fund 2011 Riding a Bike for Transport – 2011 Survey Findings, Cycling Promotion Fund and the National Heart Foundation, Melbourne.
_______ ‘Two in three blame unsafe roads for staying off their bikes’, media release, 1 June 2011, http://bit.ly/Aw35v4
Davies A, ‘How Far Do We Walk to the Station?’ The Urbanist, 2 November 2011, http://bit.ly/H2Qqnx
Dementia Care Australia, ‘Gardens – A Joy Forever’, 2012, http://bit.ly/HLYE30
Dennekamp M and Carey M, ‘Air quality and chronic disease: why action on climate change is also good for health’, NSW Public Health Bulletin, 2010, 21 (5–6): 151‐161.
Departamento Administrativo Nacional de Estadistica (National Bureau of Statistics), Republica de Columbia, ‘Colombia’, 2011, http://bit.ly/HCj6Gu
Department of Climate Change and Energy Efficiency 2011 The Critical Decade: Climate Change and Health, Climate Commission Secretariat, Commonwealth of Australia, Canberra.
Department of Education, Employment and Workplace Relations, ‘Skill Shortage List Victoria’, 2011, http://bit.ly/I5dGQO
Department of Health, ‘Cardiovascular health: National Health Priority Areas background paper’, 2006, http://bit.ly/wgzEfW
_______ 2008 Restoring the balance – Victoria’s alcohol action plan 2008–2013, Victorian Government, Melbourne.
_______ 2008 Victoria’s Alcohol Action Plan 2008–2013, Ministerial Taskforce on Alcohol and Public Safety, Victorian Government, Melbourne.
_______ ‘Asthma in children’, 2008, http://bit.ly/IDgZiN
_______ ‘Municipal Public Health Planning Framework – Part A’, 2009, http://bit.ly/uEhQ0G
_______ ‘Staying healthy in the heat’ 2010, http://bit.ly/x3n1AL
_______ 2011 Metropolitan Health Plan Technical Paper, Victorian Government, Melbourne.
_______ 2011 Victorian Health Priorities Framework 2012–2022: Metropolitan Health Plan, Victorian Government, Melbourne.
_______ 2011 Victorian Public Health and Wellbeing Plan 2011–2015, Prevention and Population Health Branch, Victorian Government, Melbourne.
_______ 2011 Improving the physical health of people with severe mental illness: No mental health without physical health, Ministerial Advisory Committee on Mental Health, Victorian Government, Melbourne.
_______ ‘Dementia‐friendly environments – a guide for care’, 2011, http://bit.ly/AxRfK8
_______ ‘Tobacco reforms’, 2012, http://bit.ly/HrMfyk
_______ Whole of Government Victorian Alcohol and Drug Strategy, http://bit.ly/xODaLg
Department of Health 2010 The South Australian approach to Health in All Policies: background and practical guide, Health in All Polices Unit, Government of South Australia, Adelaide.
Department of Health and Ageing 2005 Food for health: Dietary Guidelines for Australians – A guide to healthy eating, Department of Health and Ageing and the National Health and Medical Research Council, Commonwealth of Australia, Canberra.
_______ ‘Previous Campaigns’, 2007, http://bit.ly/HwoEQI
_______ ‘Factsheet – Fruit and Vegetable Serves’, 2008, http://bit.ly/9Cg2O1
_______ ‘Health in All Policies, South Australia’, Healthy Spaces and Places, 2009, http://bit.ly/HDNCeW

Bibliography
157
_______ 2010 National Mental Health Report 2010: Summary of 15 Years of reform in Australia’s Mental Health Services under the National Mental Health Strategy 1993‐2008, Commonwealth of Australia, Canberra.
_______ ‘Promoting Healthy Weight: About Overweight and Obesity’, 2009, http://bit.ly/HFdVC4
_______ ‘The National Alcohol Strategy 2006–2011’, 2011, http://bit.ly/J2VODO
_______ ‘Cardiovascular disease’, 2011, http://bit.ly/HyY3Tj
_______ ‘Chronic disease’, 2011, http://bit.ly/IdgFKn
_______ ‘Dementia’, 2011, http://bit.ly/I8jTZC
_______ ‘Related departmental websites’, 2011, http://bit.ly/HYKcUA
_______ ‘Kids – “Go for your life”’, 2012, http://bit.ly/dDh6nv
_______ ‘Quitnow’, 2012, http://bit.ly/kpWKII
_______ ‘Healthy Spaces and Places’, http://bit.ly/bjFjxD
Department of Human Services 2001 Environments for Health – Promoting Health and Wellbeing through Built, Social, Economic and Natural Environments, Municipal Public Health Planning Framework, Victorian Government, Melbourne.
_______ ‘New tobacco laws: Workplaces’, 2005, http://bit.ly/HFHQHu
_______ 2006 Victorian Population Health Survey 2005 – Selected findings, Victorian Government, Melbourne.
_______ 2008 Revised Chronic Disease Management Program Guidelines for Primary Care Partnerships and Primary Health Care Services, Victorian Government, Melbourne.
_______ 2009 January 2009 Heatwave in Victoria: an Assessment of Health Impacts, Victorian Government, Melbourne.
Department of Infrastructure 2002 Melbourne 2030: Planning for sustainable growth, Victorian Government, Melbourne.
Department of Infrastructure and Planning 2009 South East Queensland Regional Plan 2009‐2031, Queensland Government, Brisbane.
Department of Infrastructure and Transport 2010 Our Cities – building a productive, sustainable and liveable future, Discussion paper, Commonwealth of Australia, Canberra.
_______ 2011 Our Cities – The challenge of change, Background and research paper, Commonwealth of Australia, Canberra.
_______ 2011 Our Cities, Our Future: A national urban policy for a productive, sustainable and liveable future, Commonwealth of Australia, Canberra.
Department of Planning and Community Development 2008 Melbourne 2030: A planning update: Melbourne @ 5 million, Victorian Government, Melbourne.
_______ 2009 Modernising Victoria’s Planning Act: A discussion paper on opportunities to improve the Planning and Environment Act 1987, Victorian Government, Melbourne.
_______ 2009 Visitable and Adaptable Features in Housing: Regulatory Impact Statement, Victorian Government, Melbourne.
_______ 2010 Creating A Shared Vision For A Sustainable Kingston Green Wedge, Victorian Government, Melbourne.
_______ ‘Victoria Planning Provisions’, 2010, http://bit.ly/HLFsDt
_______ ‘A New Melbourne Metropolitan Strategy’, 2011, http://bit.ly/rPPMJv
_______ ‘Planning approval now required for packaged liquor outlets’, 2011, http://bit.ly/yJNr2M
_______ ‘Planning Panels Victoria’, 2012, http://bit.ly/HMJ185
_______ ‘The Framework for Planning Schemes: Victoria Planning Provisions’ 2012, http://bit.ly/sBQCZR
_______ ‘Victorian Planning System Ministerial Advisory Committee’, 2012, http://bit.ly/zxFUKl
Inquiry into Environmental Design and Public Health in Victoria
158
Department of Sustainability, Environment, Water, Population and Communities 2001 Air toxics and indoor air quality in Australia: State of knowledge report, Environment Australia, Commonwealth of Australia, Canberra.
Department of Transport 2009 Victorian Cycling Strategy, Victorian Government, Melbourne.
_______ 2009 Victorian Integrated Survey of Travel and Activity 2007, Victorian Government, Melbourne.
_______ 2010 The Pedestrian Access Strategy – A strategy to increase walking for transport in Victoria, Victorian Government, Melbourne.
Diabetes Australia, ‘Diabetes in Australia’, 2012, http://bit.ly/wXoO6C
Diabetes Australia – Vic, ‘What is type 2 diabetes?’ 2008, http://bit.ly/HGVvjJ
Ding D, Sallis JF, Kerr J, Lee S and Rosenberg DE, ‘Neighborhood environment and physical activity among youth: a review’, American Journal of Preventive Medicine, October 2011, 41 (4): 442‐455.
Dodson J, Mees P, Stone S and Burke M, ‘The Principles of Public Transport Network Planning: A review of the emerging literature with select examples’, Urban Research Program, Issues Paper 15, Griffith University, Queensland, 2011.
Donnelly N, Poynton S, Weatherburn D, Bamford E and Nottage J, ‘Liquor outlet concentrations and alcohol‐related neighbourhood problems’, Alcohol Studies Bulletin, NSW Bureau of Crime Statistics and Research, April 2006, 8: 1‐16.
Donovan J, Larsen K and McWhinnie J, Food‐sensitive planning and urban design: A conceptual framework for achieving a sustainable and healthy food system, Heart Foundation (Victoria), Melbourne, 2011.
Dowling J and Sexton R, ‘Jobs lose pace with city sprawl’, The Age, 10 November 2011, http://bit.ly/vPhQKk
Ebbeling CB, Pawlak DB and Ludwig DS, ‘Childhood obesity: public‐health crisis, common sense cure’, The Lancet, 2002, 360: 473–82.
Eid J, Overman H, Puga D and Turner M, ‘Fat City: The Relationship between Urban Sprawl and Obesity’, Centre for Economic Performance Discussion Paper No 758, London School of Economics and Political Science, November 2006, 1‐23.
Elliott J, ‘Australian First Solely Dedicated Care Farm to Assist People with Dementia’, media release, Department of Health, Victorian Government, 8 December 2008, http://bit.ly/xCCIwO
Elvik R, ‘The non‐linearity of risk and the promotion of environmentally sustainable transport’, Accident Analysis and Prevention, July 2009, 41 (4): 849‐55.
Environment Protection Authority Victoria, ‘Ambient air pollution and hospital admissions’, 2006, http://bit.ly/HGW6lq
_______ ‘Melbourne's air quality’, 2007, http://bit.ly/HPsR1f
_______ ‘What Is Air Pollution?’ http://bit.ly/jHLeZF
Evans M, Chikritzhs T, Allsop S and Rechichi V, Responsible Takeaway Alcohol Hours Bill 2010 – A Submission by the National Drug Research Institute, National Drug Research Institute, Curtin University of Technology, Perth.
Ewing R, Schmid T, Killingsworth R, Zlot A and Raudenbush S, ‘Relationship between urban sprawl and physical activity, obesity, and morbidity’, American Journal of Health Promotion, September‐October 2003, 18 (1): 47‐57.
Ewing R and Dumbaugh E, ‘The Built Environment and Traffic Safety – A Review of Empirical Evidence’, Journal of Planning Literature, May 2009, 23 (4): 347‐367.
Ferguson A, ‘Melbourne judged world's most liveable city’, Sydney Morning Herald, 30 August 2011, http://bit.ly/nlHEoV
Food Standards Australia & New Zealand, 2012, http://www.foodstandards.gov.au/
Forsyth A, Measuring Density: Working Definitions for Residential Density and Building Intensity, Design Center for American Urban Landscape, College of Architecture and Landscape Architecture, University of Minnesota.
Foster S, Giles‐Corti B and Knuiman M, ‘Neighbourhood design and fear of crime: a social‐ecological examination of the correlates of residents' fear in new suburban housing developments’, Health Place, November 2010, 16 (6): 1156‐1165.
Bibliography
159
Frank LD, Andresen MA and Schmid TL, ‘Obesity relationships with community design, physical activity, and time spent in cars’, American Journal of Preventive Medicine, 2004, 27 (2): 87‐96.
Fraser LK, Edwards KL, Cade J and Clarke GP, ‘The geography of Fast Food outlets: a review’, International Journal of Environmental Research and Public Health, May 2010, 7 (5): 2290–2308.
Frumkin H, ‘Urban Sprawl and Public Health’, Public Health Reports, May‐June 2002, 117: 201‐217.
_______ ‘Healthy Places: Exploring the Evidence’, American Journal of Public Health, September 2003, 93 (9): 1451–1456.
Furber S, Tranter D, Harris‐Roxas B, Dews C, Gray E, Goldie A, Wallace C, Mayne D and Thackway S, ‘The Use of Health Impact Assessment to Determine the Potential Impact of an Australian Urban Development Proposal on Health and Well‐being’, Urban Policy & Research, June 2009, 29 (2): 125‐139.
Garden FL and Jalaludin BB, ‘Impact of Urban Sprawl on Overweight, Obesity, and Physical Activity in Sydney, Australia’, Journal of Urban Health, January 2009, 86 (1): 19‐30.
Garrard J, Safe speed: promoting safe walking and cycling by reducing traffic speed, Safe Speed Interest Group, Melbourne, 2008.
_______ Active transport: Children and young people: An overview of recent evidence, VicHealth, Melbourne, 2009.
_______ Taking action on obesogenic environments – Building a culture of active, connected communities, National Preventative Health Taskforce, Canberra, 2009.
_______ Greaves S and Ellison A, ‘Cycling injuries in Australia: road safety's blind spot?’ Journal of the Australasian College of Road Safety, 2010, 21 (3): 37‐43.
_______ Submission to the 2011 Victorian Speed Limit Review On behalf of the Safe Speed Interest Group, Safe Speed Interest Group, Melbourne, 2011.
Geelong’s Active in Parks, ‘Geelong's Active in Parks – A Healthy Parks Healthy People program’, 2012, http://activeinparks.org/
_______ ‘Nature the best medicine for Geelong region: innovative trial to prescribe parks for better health’, 2012, http://activeinparks.org/?p=1274
General Practice Victoria, ‘Commonwealth Commitments to Primary Health Care in Victoria – Background Paper’, 2008, http://bit.ly/IykQh3
Giles‐Corti B, ‘The impact of urban form on public health’, paper prepared for the 2006 Australian State of the Environment Committee, Department of the Environment and Heritage, Canberra, 2006.
Giles‐Corti B, Broomhall MH, Knuiman M, Collins C, Douglas K, Ng K, Lange A and Donovan RJ, ‘Increasing Walking: How Important Is Distance To, Attractiveness, and Size of Public Open Space?’ American Journal of Preventive Medicine, 2005, 28 (2S2): 169‐176.
Giles‐Corti B and Donovan RJ, ‘Socioeconomic status differences in recreational physical activity levels and real and perceived access to a supportive physical environment’, Preventive Medicine, December 2002, 35 (6): 601‐611.
Giles‐Corti B, Foster S, Shilton T and Falconer R, ‘The co‐benefits for health of investing in active transportation’, NSW Public Health Bulletin, 2010, 21 (5–6): 122‐127.
Giles‐Corti B, Macintyre S, Clarkson JP, Pikora T and Donovan RJ, ‘Environmental and lifestyle factors associated with overweight and obesity in Perth, Australia’, American Journal of Health Promotion, September‐October 2003, 18 (1): 93‐102.
Giles‐Corti B, Ryan K and Foster S, Increasing density in Australia: maximising the health benefits and minimising harm, National Heart Foundation of Australia, 2012.
Giles‐Corti B, Wood G, Pikora T, Learnihan V, Bulsara M, Van Niel K, Timperio A, McCormack G and Villanueva K, ‘School site and the potential to walk to school: the impact of street connectivity and traffic exposure in school neighborhoods’, Health Place, March 2011, 17 (2): 545‐50.
Glover JD, Hetzel DMA and Tennant SK, ‘The socioeconomic gradient and chronic illness and associated risk factors in Australia’, Australia and New Zealand Health Policy, 2004, 1 (8).
Goss J, Projection of Australian health care expenditure by disease, 2003 to 2033, Australian Institute of Health and Welfare, Canberra, 2008.
Government of South Australia, Understanding Residential Densities: A Pictorial Handbook of Adelaide Examples, 2006, 5, http://bit.ly/wGOyo2
Grattan Institute 2010 The Cities We Need, Grattan Institute, Melbourne.

Inquiry into Environmental Design and Public Health in Victoria
160
Growth Areas Authority 2009 Precinct Structure Planning Guidelines – Part One: Overview of Growth Area Planning, Victorian Government, Melbourne.
_______ ‘Precinct Structure Plans’, http://bit.ly/sYpwDH
_______ ‘Rise and shine: Selandra Rise development breaks new ground’, media release, 2011, http://bit.ly/w5wQCM
_______ ‘Small Lot Housing Code: Info Sheet’, 2011, http://bit.ly/HF29Yv
Gruenewald PJ and Remer L, ‘Changes in Outlet Densities Affect Violence Rates’, Alcoholism: Clinical and Experimental Research, July 2006, 30 (7): 1184–1193.
Guy M, ‘Red tape reduction to help housing affordability’, media release, Growth Areas Authority, Victorian Government, 2011, http://bit.ly/HCOD99
Harper T, Melbourne 2030 Implementation Audit VicHealth Submission, VicHealth, Melbourne, 2007.
‘Health’, E‐melbourne: the Encyclopaedia of Melbourne Online, School of Historical Studies, University of Melbourne, 2010, http://bit.ly/ycbShT
Health Insite, ‘Causes of Asthma’, 2012, http://bit.ly/aWk9tu
Healthy Built Environments Program, HBEP literature review – Executive Summary, University of New South Wales, Sydney, 2012.
_______ HBEP literature review – The Built Environment and Providing Healthy Food Options, University of New South Wales, Sydney, 2012.
_______ The Built Environment and Getting People Active, University of New South Wales, Sydney, 2012.
Healthy Spaces and Places, ‘Promoting safe walking and cycling by reducing traffic speed – Summary of the Safe Speed Interest Group research review’, 2008, http://bit.ly/wBCNwJ
Heart Foundation, ‘Heart, Stroke and Vascular Diseases – Australian Facts 2004’, 2004, http://bit.ly/A58PmZ
_______ ‘Neighbourhood Walkability Checklist – How walkable is your community?’ 2011, http://bit.ly/Ai33NN
_______ 2011 Creating Healthy Neighbourhoods – Consumer preferences for healthy development.
_______ 2012 Active Travel to School: 2012 Survey Findings, Heart Foundation and Cycling Promotion Fund.
_______ An Australian vision for active transport, http://bit.ly/yLD4lr
_______ ‘Built Environment’, http://bit.ly/z010YL
_______ ‘Data and Statistics’, http://bit.ly/I13RDs
_______ ‘Density and health’, http://bit.ly/IEHDoO
_______ ‘Healthy by Design, Victoria’, http://bit.ly/zYXWwA
Henley J, ‘Richard Louv: Let them climb trees’, The Guardian, 5 June 2010, http://bit.ly/96ufdD
HIA Connect, ‘New South Wales HIA Project’, http://bit.ly/roTFe3
Hoehner CM, Brennan LK, Brownson RC, Handy SL and Killingsworth R, ‘Opportunities for Integrating Public Health and Urban Planning Approaches to Promote Active Community Environments’, American Journal of Health Promotion, 2003, 18 (1): 14‐20.
House of Representatives Standing Committee on Health and Ageing 2009 Weighing it up: Obesity in Australia, Commonwealth of Australia, Canberra.
House of Representatives Standing Committee on Social Policy and Legal Affairs 2012 In the Wake of Disasters: Volume One: The operation of the insurance industry during disaster events, Commonwealth of Australia, Canberra.
Hynes HP and Howe G, ‘Urban Horticulture in the Contemporary United States: Personal and Community Benefits’, Acta Horticulturae, 2004, 643: 171‐181.
Iaria M, ‘Diabetes levels double in decade’, The Age, 8 November 2011, http://bit.ly/sfO4Mz
Infrastructure Australia 2010 State of Australian Cities 2010, Major Cities Unit, Commonwealth of Australia, Canberra.
_______ ‘Cycling Infrastructure for Australian Cities, Background Paper’, 2009, http://bit.ly/wBnIz0
Bibliography
161
Ingram M, The Grid versus the Cul‐de‐sac: An Evaluation of the Satisfaction of Residents with Street Patterns in Recent Cairns City Residential Subdivisions, unpublished Honours thesis, School of Earth and Environmental Sciences, James Cook University, Queensland, 2010.
Jacob DJ and Winner DA, ‘Effect of climate change on air quality’, Atmospheric Environment, 2009, 43 (1): 51‐63.
Jacobsen P, ‘Safety in numbers: more walkers and bicyclists, safer walking and bicycling’, Injury Prevention, 2003, 9: 205‐209.
Jolly K, ‘Environmental Design and Public Health, A Heart Foundation Perspective’, Heart Foundation (Victoria) presentation, 2011, http://bit.ly/HMeXLE
Kamphuis CBM, van Lenthe FJ, Giskes K, Huisman M, Brug J and Mackenbach JP, ‘Socioeconomic differences in lack of recreational walking among older adults: the role of neighbourhood and individual factors’, International Journal of Behavioral Nutrition and Physical Activity, 2009, 6: 1‐11.
Kavanagh A, Thornton L, Tattam A, Thomas L, Jolley D and Turrell G, Place does matter for your health: A report of the Victorian Lifestyle and Neighbourhood Environment Study, University of Melbourne, 2007.
Kelly M, ‘How big is my castle?’ The Australian, 20 November 2010, http://bit.ly/Inz5He
Kelly‐Schwartz AC, ‘Is Sprawl Unhealthy? A Multilevel Analysis of the Relationship of Metropolitan Sprawl to the Health of Individuals’, Journal of Planning Education and Research, 2004, 24 (2): 184‐196.
Kent J, Thompson SM and Jalaludin B, Healthy Built Environments: A review of the literature, Healthy Built Environments Program, University of New South Wales, Sydney, 2011.
King J, ‘“Parkmobiles” bring taste of nature to urban S.F.’, San Francisco Chronicle, 2 August 2011, http://bit.ly/nHj3Uy
Kingsley J and Townsend M, ‘“Dig In” to Social Capital: Community Gardens as Mechanisms for Growing Urban Social Connectedness’, Urban Policy and Research, 2006, 24 (4): 525‐537.
Lake A, Townshend TG and Alvanides S (eds), Obesogenic environments: Complexities, perceptions and objective measures, Wiley‐Blackwell, UK, 2010.
Larson EB, Wang L, Bowen JD, McCormick WC, Teri L, Crane P and Kukull W, ‘Exercise Is Associated with Reduced Risk for Incident Dementia among Persons 65 Years of Age and Older’, Annals of Internal Medicine, 17 January 2006, 144 (2): 73‐81.
Larson NI, Story MT and Nelson MC, ‘Neighborhood environments: disparities in access to healthy foods in the U.S.’, American Journal of Preventive Medicine, January 2009, 36 (1): 74‐81.
Li F, Harmer P, Cardinal BJ, Bosworth M and Johnson‐Shelton D, ‘Obesity and the built environment: does the density of neighborhood fast‐food outlets matter?’ American Journal of Health Promotion, January‐February 2009, 23 (3): 203‐209.
Livingston M, Association between increased density of alcohol outlets and harmful outcomes, presentation, Turning Point Alcohol and Drug Centre, University of Melbourne, http://bit.ly/z23zqu
_______ Using geocoded liquor licensing data in Victoria – The socioeconomic distribution of alcohol availability in Victoria, VicHealth, Melbourne, 2011.
_______ ‘Alcohol outlet density and harm: Comparing the impacts on violence and chronic harms’, Drug and Alcohol Review, September 2011, 30 (5): 515–523.
_______ ‘The social gradient of alcohol availability in Victoria, Australia’, Australian and New Zealand Journal of Public Health, February 2012, 36 (1): 41–47.
Livingston M, Matthews S, Barratt MJ, Lloyd B and Room R, ‘Diverging trends in alcohol consumption and alcohol‐related harm in Victoria’, Australian and New Zealand Journal of Public Health, 2010, 34 (4): 368‐373.
Lopez R, ‘Urban Sprawl and Risk for Being Overweight or Obese’, American Journal of Public Health, September 2004, 94 (9): 1574–1579.
Lovasi GS, Hutson MA, Guerra M and Neckerman KM, ‘Built Environments and Obesity in Disadvantaged Populations’, Epidemiologic Reviews, 2009, 31: 7‐20.
Lowthian JA, Jolley DJ, Curtis AJ, Currell A, Cameron PA, Stoelwinder JU and McNeil JJ, ‘The challenges of population ageing: accelerating demand for emergency ambulance services by older patients, 1995–2015’, Medical Journal of Australia, 2011, 194: 574–578.
Lynch P, ‘Bright Is The New Black: New York Roofs Go Cool’, 7 March 2012, National Aeronautics and Space Administration, http://1.usa.gov/I74BUn

Inquiry into Environmental Design and Public Health in Victoria
162
Maddock J, ‘The relationship between obesity and the prevalence of fast food restaurants: state‐level analysis’, American Journal of Health Promotion, November‐December 2004, 19 (2): 137‐43.
Maller C, Townsend M, St Leger L, Henderson‐Wilson C, Pryor A, Prosser L and Moore M, Healthy parks, healthy people – The health benefits of contact with nature in a park context, A review of relevant literature, Deakin University and Parks Victoria, Melbourne, 2008.
Malone K, ‘The bubble‐wrap generation: children growing up in walled gardens’, Environmental Education Research, September 2007, 13 (4): 513‐527.
Maribyrnong City Council, ‘Pop‐Up Park for Yarraville’, 2012, http://bit.ly/xn3gPH
Marshall C, ‘Flagship dementia care garden sets new standard in patient care’, ABC News, 23 February 2011, http://bit.ly/gIPgZh
Maziak W, Ward KD and Stockton MB, ‘Childhood obesity: are we missing the big picture?’ Obesity Reviews, 2007, 9: 35‐42.
McAuley Community Services for Women, ‘Affordable Housing & Homelessness’, Melbourne, 2010, 6, http://bit.ly/Hyvt0H
McCormack GR and Shiell A, ‘In search of causality: a systematic review of the relationship between the built environment and physical activity among adults’, International Journal of Behavioral Nutrition and Physical Activity, 13 November 2011, 8 (125).
Melbourne and Metropolitan Board of Works 1954 Melbourne Metropolitan Planning Scheme 1954: Report, Melbourne, http://bit.ly/HEhD2t
Miletic D, ‘Welcome to Victoria, home to super‐sized houses’, The Age, 30 November 2009, http://bit.ly/87dW7r
Mission Australia, ‘Triple Care Farm graduates celebrate fresh start’, 2011, http://bit.ly/uwIH5x
Mitchell R and Popham F, ‘Effect of exposure to natural environment on health inequalities’, The Lancet, 8 November 2008, 372 (9650): 1655‐1660.
Morris CJG, ‘Urban Heat Islands and Climate Change – Melbourne, Australia’, School of Earth Sciences, University of Melbourne, http://bit.ly/I74bxh
Narayan KMV, ‘The Diabetes Pandemic: Looking for the Silver Lining’, Clinical Diabetes, 2005, 23 (2): 51‐52.
National Drug Research Institute 2007 Restrictions on the Sale and Supply of Alcohol: Evidence and Outcomes, National Drug Research Institute, Curtin University of Technology, Perth, 2007.
National Health and Medical Research Council, ‘Cardiovascular disease’, 2011, http://bit.ly/rrSNyC
_______ ‘About the Guidelines’, Eat for Health, 2012 http://bit.ly/uPHrD9
National Preventative Health Taskforce 2009 Technical Report 1 – Obesity in Australia: a need for urgent action, report prepared by the Obesity Working Group, Commonwealth of Australia, Canberra.
National Public Health Partnership 2009 Australia: The Healthiest Country By 2020, Technical Report 3: Preventing alcohol‐related harm in Australia: a window of opportunity, report prepared for the National Preventative Health Taskforce by the Alcohol Working Group, Commonwealth of Australia, Canberra.
National Research Council of the National Academies, Improving Health in the United States: The Role of Health Impact Assessment, National Academies Press, Washington DC, 2011.
National Rural Health Alliance, ‘Fact Sheet 18: Mental health in rural Australia’, 2009, http://bit.ly/cbJnGH
Nepal B, Ranmuthugala G, Brown L and Budge M, ‘Modelling costs of dementia in Australia: evidence, gaps, and needs’, Australian Health Review, August 2008, 32 (3): 479‐487.
Newman P, ‘Re‐imagining the Australian Suburb Seminar’, presentation to Royal Melbourne Institute of Technology, Melbourne, 18 October 2005.
Newman P and Kenworthy JR, Sustainability and Cities: overcoming automobile dependence, Island Press, Washington DC, 1999.
Newman P and Kenworthy JR, ‘The Ten Myths of Automobile Dependence’, World Transport Policy & Practice, 2000, (6) 1: 15–25.
Nissim R, Universal Housing, Universal Benefits: A Victorian Council of Social Service discussion paper on universal housing regulation in Victoria, Victorian Council of Social Service, Melbourne, 2008.

Bibliography
163
Nogrady B, ‘Exercise keeps dementia at bay’, ABC News, 3 September 2008, http://bit.ly/Hzf14F
NSW Department of Health 2009 Healthy Urban Development Checklist: A guide for health services when commenting on development policies, plans and proposals, NSW Government, Sydney.
NSW Department of Planning 2010 Metropolitan Plan for Sydney 2036, NSW Government, Sydney.
Obesity Policy Coalition, ‘Modernising Victoria’s Planning Act – A discussion paper on opportunities to improve the Planning and Environment Act 1987’, Melbourne, 2009.
Organisation for Economic Co‐operation and Development, ‘Obesity and the Economics of Prevention: Fit not Fat – Australia Key Facts’, http://bit.ly/wQMx0n
Outer Suburban/Interface Services and Development Committee 2010 Inquiry into Sustainable Development of Agribusiness in Outer Suburban Melbourne, Parliament of Victoria, Melbourne.
_______ 2011 Inquiry into liveability options in outer suburban Melbourne, corrected transcripts, Parliament of Victoria, Melbourne.
Owen N, Cerin E, Leslie E, duToit L, Coffee N, Frank LD, Bauman AE, Hugo G, Saelens BE and Sallis JF, ‘Neighborhood walkability and the walking behavior of Australian adults’, American Journal of Preventive Medicine, November 2007, 33 (5): 387‐95.
Parker S, ‘Australian home size looks set to fall’, Real Estate Business, 22 August 2011, http://bit.ly/InzcCG
Parliament of Victoria 2010 Legislative Council of Victoria Standing Orders, Parliament of Victoria, Melbourne.
Patz JA, Campbell‐Lendrum D, Holloway T and Foley JA, ‘Impact of regional climate change on human health’, Nature, 17 November 2005, 438: 310‐317.
Pearce J, Blakely T, Witten K and Bartie P, ‘Neighborhood deprivation and access to fast‐food retailing: a national study’, American Journal of Preventive Medicine, May 2007, 32 (5): 375‐82.
Peddie B and Somerville C, ‘Travel Behaviour Change through School Travel Planning: Mode Shift and Community Engagement – Results from 33 Schools in Victoria’, Department of Infrastructure, Victorian Government, Melbourne, 2005.
Pikora TJ, Giles‐Corti B, Knuiman MW, Bull FC, Jamrozik K and Donovan RJ, ‘Neighborhood environmental factors correlated with walking near home: Using SPACES’, Medicine & Science in Sports & Exercise, April 2006, 38 (4): 708‐14.
Places Victoria, ‘Aurora, VicUrban's Urban Growth Development in Epping North’, 2012, http://bit.ly/xQN0iu
Places Victoria, ‘Features and Benefits of Aurora’, 2012, http://bit.ly/rL6UNN
Planning Institute of Australia 2004 Findings and Recommendations: National Inquiry into Planning Education and Employment, PIA, Canberra.
_______ 2009 Healthy Spaces and Places: A national guide to designing places for healthy living – An overview, PIA, Australian Local Government Association and the National Heart Foundation of Australia.
_______ 2011 Healthy Spaces and Places, Design Principle – Connectivity and Permeability, PIA, Canberra.
Planning Institute of Australia and VicHealth, ‘Putting health at the centre of planning’, http://bit.ly/IEfjmC
Planning Panels Victoria 2010 Review of Precinct Structure Plans: 2009‐2010 – Interim Report on Issues Emerging From the PSP Process, Department of Planning and Community Development, Victorian Government, Melbourne.
Productivity Commission 2005 Economic Implications of an Ageing Australia, Commonwealth of Australia, Canberra.
_______ 2011 Caring for Older Australians, Commonwealth of Australia, Canberra.
Public Health Advisory Committee 2005 A Guide to Health Impact Assessment: A Policy Tool for New Zealand, 2nd edition, National Health Committee, Wellington (NZ).
Public Record Office Victoria, ‘A Garden City’, 2012, http://bit.ly/HtxPyN
Pucher J, Dill J and Handy S, ‘Infrastructure, programs, and policies to increase bicycling: An international review’, Preventive Medicine, 2010, 50: S106–S125.
Inquiry into Environmental Design and Public Health in Victoria
164
Quigley R, Presentation to Health in All Policies Conference, Adelaide, 2010.
Quit Victoria, ‘Smoking rates in Victoria’, 2012, http://bit.ly/IykdnG
Rahmstorf S, ‘Climate Change – State of the Science’, Potsdam Institute for Climate Impact Research, Germany, 2010, http://bit.ly/HCsgAP
Regional Development Victoria, ‘Regional Development Victoria, Application Guidelines – Farmers’ Markets Support Program’, http://bit.ly/xpZGoF
Road Safety Committee 2006 Review of the Inquiry into the Incidence and Prevention of Pedestrian Accidents, Parliament of Victoria, Melbourne.
Robertson A, Maribyrnong Planning Scheme Amendment C63: Bradmill Precinct, Report of the Panel, Tract Consultants Pty Ltd, 2009, Melbourne.
Robinson DL, ‘Safety in numbers in Australia: More walkers and bicyclists, safer walking and cycling’, Health Promotion Journal of Australia, 2005, 16: 47–51.
Romero VM, ‘“I will be not a nerd”: Children’s Development, the Built Environment and School Travel’, paper presented at State of Australian Cities Conference, Adelaide, 2007.
Rosenzweig C, Solecki WD and Slosberg RB, Mitigating New York City’s Heat Island with Urban Forestry, Living Roofs, and Light Surfaces, report prepared for the New York State Energy Research and Development Authority by the Columbia University Center For Climate Systems Research & NASA/Goddard Institute For Space Studies, New York, 2006.
Ryan B, ‘Fears for development of Yarraville's Bradmill site’, Maribyrnong Leader, 2 June 2009, http://bit.ly/w7GRe3
Saelens B and Handy S, ‘Built environment correlates of walking: a review’, Medicine and Science in Sports and Exercise, 2008, 40: S550–S566.
Saelens BE and Sallis JF, ‘Neighborhood walkability and the walking behavior of Australian adults’, American Journal of Preventive Medicine, November 2007, 33 (5): 387‐395.
Sharkey JR, Johnson CM, Dean WR and Horel SA, ‘Focusing on fast food restaurants alone underestimates the relationship between neighborhood deprivation and exposure to fast food in a large rural area’, Nutrition Journal, 2011, 10: 10.
Shoup L and Ewing R, ‘The Economic Benefits of Open Space, Recreation Facilities and Walkable Community Design’, Active Living Research, March 2010, 1‐28.
Simmons D, McKenzie A, Eaton S, Cox N, Khan MA, Shaw J and Zimmet P, ‘Choice and availability of takeaway and restaurant food is not related to the prevalence of adult obesity in rural communities in Australia’, International Journal of Obesity, June 2005, 29 (6): 703‐710.
Sir David Martin Foundation, ‘Triple Care Farm’, Sydney, 2006, http://bit.ly/Q6AXb
Solberg S, Hov Ø, Søvde A, Isaksen ISA, Coddeville P, De Backer H, Forster C, Orsolini Y and Uhse K, ‘European surface ozone in the extreme summer 2003’, Journal of Geophysical Research, 2008, 113 (D7).
St Laurence, ‘St Laurence – Our history’, Lara, http://bit.ly/I812gy
Stockland Corporation Limited, ‘About Selandra Rise’, 2012, http://bit.ly/At6mY5
Stott PA, Stone DA and Allen MR, ‘Human contribution to the European heatwave of 2003’, Nature, 2 December 2004, 432: 610‐614.
‘The diabetes pandemic’, The Lancet, 9 July 2011, 378 (9786): 99.
‘The health benefits of tackling climate change’, The Lancet, 2009, http://bit.ly/zsco48
Thompson S, ‘A planner’s perspective on the health impacts of urban settings’, NSW Public Health Bulletin, 2007, 18: 157‐160.
Timperio AF, Ball K, Roberts R, Andrianopoulos N and Crawford DA, ‘Children's takeaway and fast‐food intakes: associations with the neighbourhood food environment’, Public Health Nutrition, October 2009, 12 (10): 1960‐1964.
Timperio A, Ball K, Salmon J, Roberts R, Giles‐Corti B, Simmons D, Baur LA and Crawford D, ‘Personal, Family, Social, and Environmental Correlates of Active Commuting to School’, American Journal of Preventive Medicine, January 2006, 30 (1): 45‐51.
Timperio A, Jeffery RW, Crawford D, Roberts R, Giles‐Corti B and Ball K, ‘Neighbourhood physical activity environments and adiposity in children and mothers: a three‐year longitudinal study’, International Journal of Behavioral Nutrition and Physical Activity, 2010, 7 (18): 1‐8.

Bibliography
165
Timperio A, Salmon J, Telford A and Crawford D, ‘Perceptions of local neighbourhood environments and their relationship to childhood overweight and obesity’, International Journal of Obesity, February 2005, 29 (2): 170‐175.
Townsend M and Ebden M, Feel Blue, Touch Green, People and Parks Foundation and Deakin University, Melbourne, 2006.
Townsend M and Weerasuriya R, Beyond Blue to Green: The benefits of contact with nature for mental health and well‐being, beyondblue, Melbourne, 2010.
Trubka R, Newman P and Bilsborough D, ‘Gen 85: The cost of urban sprawl – physical activity links to health care costs and productivity’, Environmental Design Guide, April 2010, 1‐8.
Tucker D and Stone J, ‘Active Transport to School: A Study of Political Barriers in Glen Eira’, Faculty of Architecture, Building and Planning, University of Melbourne, 2011.
Ungar M, Too Safe For Their Own Good: How risk and responsibility help teens thrive, Allen and Unwin, Sydney, 2008.
United States Environmental Protection Agency, ‘Heat Island Effect’, 10 March 2012, http://www.epa.gov/heatislands/
University of Melbourne, ‘Inner city housing more energy efficient than 7 star suburban homes: study’, The Melbourne Newsroom, http://bit.ly/JkV7X1
Velarde MD, Fry G and Tveit M, ‘Health effects of viewing landscapes – Landscape types in environmental psychology’, Urban Forestry & Urban Greening, 2007, 6: 199–212.
VicHealth 2011 Streets Ahead 2008–2011 Program evaluation report, Victorian Government, Melbourne.
_______ 2011 Towards active and independently mobile children – Survey review, Victorian Government, Melbourne.
_______ 2011 VicHealth year in review 2010‐2011, Victorian Government, Melbourne.
_______ ‘Dementia‐friendly environments – A guide for residential care: Gardens and outdoor spaces’, 2011, http://bit.ly/Ht1U1G
_______ ‘Food security’, http://bit.ly/Hr8nKp
_______ ‘Overweight and obesity’, http://bit.ly/wzSQWO
_______ ‘Quit campaign’, http://bit.ly/HuafFz
VicRoads, ‘Municipal Bicycle Networks (MBNs)’, 2010, http://bit.ly/zkEIf2
_______ ‘Types of school speed limits’, 2010, http://bit.ly/xZokuO
_______ ‘Principal Bicycle Network (PBN)’, 2011, http://bit.ly/xRh4vU
Victorian Auditor‐General 2011 Managing Contaminated Sites, VAGO, Melbourne.
Victorian Climate Change Act 2010, Preamble, http://bit.ly/HLZiNU
Victorian Council of Social Service, ‘Victorian Universal Housing Alliance Platform’, 2008, http://bit.ly/I8mVNv
Victorian Environmental Assessment Council 2009 The Contribution of Public Land to Melbourne’s Liveability, Victorian Government, Melbourne.
_______ 2011 Metropolitan Melbourne Investigation, Final Report, Victorian Government, Melbourne.
Victorian Floods Review 2011 Review of the 2010–11 Flood Warnings & Response: Final Report, Victorian Government, Melbourne.
Victorian Government, Planning and Environment Act 1987.
_______ ‘About Neighbourhood Renewal’, 2010, http://bit.ly/IZdKQn
Victorian Local Governance Association 2011 Review of Victoria’s Overall Planning System Submission, VLGA, Melbourne.
Walker J, ‘The perils of average density’, Human Transit, 26 September 2010, http://bit.ly/d2Mtaw
Walker J, ‘Basics: walking to transit’, Human Transit, 24 April 2011, http://bit.ly/hq2WJu
Walsh B, ‘“Eco‐Therapy” for Environmental Depression’, Time, 28 July 2009, http://ti.me/1vBrm4
Walsh P, ‘Coalition delivers $2 million to enhance Victoria's popular farmers' markets’, media release, Minister for Agriculture and Food Security, Victorian Government, 9 July 2011, http://bit.ly/yXWOSE

Inquiry into Environmental Design and Public Health in Victoria
166
Warralily Armstrong Creek, ‘About the Warralily Armstrong Creek Development’, 2010, http://bit.ly/HMG8ut
Waters A, ‘Do housing conditions impact on health inequalities between Australia’s rich and poor?’ Australian Housing and Urban Research Institute, ANU Research Centre, Canberra, 2001.
Wilkins R, Warren D, Hahn M and Houng B, Families, Incomes and Jobs, A Statistical Report on Waves 1 to 7 of the Household, Income and Labour Dynamics in Australia Survey, Melbourne Institute of Applied Economic and Social Research, University of Melbourne, 2010.
Williams P, Pocock B and Bridge K, Linked up Lives: Putting Together Work, Home and Community in Ten Australian Suburbs, Overview Report, Centre for Work and Life, University of South Australia, Adelaide, 2009.
Wong K, ‘Fast Food Linked to Obesity, Diabetes’, Scientific American, 3 January 2005, http://bit.ly/91PHyH
Wood D, ‘Pay as you go’, Royalauto, RACV, July 2010, 60‐66.
World Health Organization, Guidelines for health housing, Copenhagen, 1988, http://bit.ly/HMDyhJ
_______ 1998 Health Promotion Glossary, Division of Health Promotion, Education and Communications, Geneva.
_______ ‘Noncommunicable diseases now biggest killers’, 2008, http://bit.ly/cIN9Ly
_______ 2010 Why urban health matters – 1000 cities, 1000 lives, 2, http://bit.ly/eGOTX0
_______ 2010 Hidden cities: unmasking and overcoming health inequities in urban settings, United Nations Human Settlements Programme, Geneva.
_______ ‘Climate change and health’, 2010, http://bit.ly/vYagd
_______ ‘Food Security’, 2012, http://bit.ly/dzdsS4
Yardney M, ‘The Great Australian Dream is Shrinking’, Property Update, 29 February 2012, http://bit.ly/Inzlpu
Younger M, Morrow‐Almeida HR, Vindigni SM and Dannenberg AL, ‘The Built Environment, Climate Change, and Health Opportunities for Co‐Benefits’, American Journal of Preventive Medicine, 2008, 35 (5): 517‐526.
Zick C, Smith KR, Fan JX, Brown BB, Yamada I and Kowaleski‐Jones L, ‘Running to the store? The relationship between neighborhood environments and the risk of obesity’, Social Science & Medicine, November 2009, 69 (10): 1493‐1500.
Zubrick SR, Wood L, Villanueva K, Wood G, Giles‐Corti B and Christian H, Nothing but fear itself: parental fear as a determinant of child physical activity and independent mobility, VicHealth, Melbourne, 2010.

Minority Report
167
Minority Report
Planning and Environment References Committee of the Legislative Council
Minority Report – 15 May 2012
Submitted By:
Mrs Inga Peulich, MLC for South Eastern Metropolitan Region (Deputy Chair)
Mr Andrew Elsbury, MLC for Western Metropolitan Region
Mr Craig Ondarchie, MLC for Northern Metropolitan Region
Mrs Jan Kronberg, MLC for Eastern Metropolitan Region
This Minority Report for this exceptionally important inquiry into Environmental Design
and Public Health policies in Victoria was inspired by what can only be described as a
frustrating experience where more than half of the recommendations of the majority
report, either in whole or in part, were passed on the casting vote of the Labor Chair, Ms
Gayle Tierney.
Notwithstanding the merit of most of the ideas brought to the committee by Government
MPs who frequently expressed concern about loosely worded and or imprecise motions,
or recommendations which have not been fully considered in terms of their cost impacts
or shifts of resources, or the practical implications for the government of the day, non‐
Government Members were uncompromising even where compromise may have
generated better quality motions supported in a bi partisan spirit.
“Appendix D: Extracts of Proceedings” shows evidence of more than 50 divisions over
recommendations with more than 50% of the motions carried on the casting vote of the
Labor Chair, Ms Gayle Tierney. The non‐Government MPs’ strong disregard for any
bipartisanship and unyielding focus on a not to be missed opportunity to pursue a narrow
and ideological agenda and to embed political trip wires into recommendations, rather
than pursue good policy and beneficial outcomes, was a very significant cause for concern
and food for thought when considering about the future of our Upper House committee
system.
This was most evident in recommendations relevant to the Planning and the Transport
portfolios , policy areas where Labor’s own policies and performance were widely
criticised and ultimately rejected at the 2010 state election, in part reflecting the
composition of the committee which included the Labor Shadow Minister for Planning, Mr
Brian Tee and Greens MP, Ms Sue Pennicuik.
Of greatest concern to the authors of this Minority Report were the following:
Opposition and non‐Government MPs support for recommendations and initiatives which their previous Labor Government failed to deliver or fund when in Government;

Inquiry into Environmental Design and Public Health in Victoria
168
Labor MPs , supported by Greens MP Ms Sue Pennicuik, were prepared to adopt and pursue, in an uncompromising fashion, specific recommendations which are neither costed and nor tested with key stakeholders on whom they would have a substantial negative impact. Given the blow out in the costs of Labor’s major projects and program implementation ( which have been reported on by various Victorian Auditor General reports since the 2010 State election) the authors of this Minority Report were surprised that Labor MPs in particular had not been more cautious to learn from past mistakes.
Many of the recommendations on which the committee divided would see substantial increase in central regulation, adding significantly to costs and shifting precious taxpayer funds away from delivering good policy, programs and outcomes to recommendations which would need to be supported by a burgeoning bureaucracy more focussed on central control for its own sake. This is best exemplified by the number of annual audits called for in a number of the recommendations contained in the majority report. It is regrettable that this is more a reflection of the obsession by Labor MPs’ objective to embed political trip wires into government processes rather than producing recommendations that can deliver beneficial outcomes for Victorians and Victorian communities.
Several of the recommendations of the Majority report are evidently more inspired by a narrow ideology rather than logic or genuine interest in better health outcomes for the community. The recommendations about fast food and liquor are cases in point.
Difficult political issues, such as those confronted the committee following a visit to the so called “Kingston Green Wedge” were conveniently sanitised and simply left without any meaningful comment or recommendation. This silence is a matter of concern given that previous 10 years of Labor inaction on this issue which continues to see thousands of affected residents still suffering negative impact on their health and amenity. Labor and Greens MPs, who were initially reluctant to visit the site, were unmoved by the consequences of Labor’s Green Wedge legislation imposed over an atypical and non‐conforming area which suffers from land use conflicts locked into place by Labor’s legislation.
In closing, Government MPs have been prepared to support good recommendations
which are sensible, and have high likelihood of generating beneficial outcomes. It is,
however a disappointment that such an important inquiry has been so compromised by
the narrow ideological and political interests of the Labor/Green members of this
committee, and that there was such reluctance to find middle ground to ensure that the
recommendations were supported by all political parties. It is regrettable that many of
the recommendations demonstrate poor policy making, resulting from inadequately
considered and politically motivated recommendations which would undoubtedly result in
many negative consequences for Victorians and Victorians families.
Lastly, Government MPs would also like to thank the committee staff for their work and all
of the submitters and witnesses to what should have been an important blue print for
Environmental Design and Public Health policies in Victoria.
Mrs Inga Peulich (Deputy Chair) MLC for South Eastern Metropolitan Region Mr Craig Ondarchie MLC for Northern Metropolitan Region
Mr Andrew Elsbury MLC for Western Metropolitan Region Mrs Jan Kronberg MLC for Eastern Metropolitan Region