input-output modeling control of the departure · pdf fileinput-output modeling and control of...
TRANSCRIPT

V
99-4299
INPUT-OUTPUT MODELING AND CONTROL OF THE DEPARTURE PROCESS OF CONGESTED AIRPORTS
Nicolas Pujet*, Bertrand Delcairet, Eric Ferod Massachusetts Institute of Technology
Abstract A simple queueing model of busy air-
port departure operations is proposed. This model is calibrated and validated using available runway configuration and traffic data. The model is then used to evaluate preliminary control schemes aimed at alleviating departure traffic con- gestion on the airport surface. The po- tential impact of these control strategies on direct operating costs, environmental costs and overall delay is quantified and discussed.
Introduction
The continuing growth of air traffic around the world is resulting in increasing congestion and delays. Av- erage block times between busy city pairs in the US. are constantly increasing (for example, the average gate-to-gate time from Boston airport to Washing- ton National airport increased by 20% from 1973 to 1994 [l]). The major bottleneck of the U.S. Na- tional Airspace System (NAS) appears to be the air- ports. In less than ideal weather conditions, arrival and departure capacity can be dramatically reduced, while the airlines are often reluctant or unable to re- duce the demand by cancelling flights. The reduced departure capacity can result in very long taxi-out times at peak hours, as the departing aircraft wait in a queue before being allowed to take off. These
‘Research Assistant, Department of Aeronautics and As- tronautics, MIT Room 35-217, 77 Massachusetts Avenue, Cambridge MA 02139. Email: pujetOmit.edu
t Research Assistant, Department of Aeronautics and As- tronautics, MIT. Email: ,delcaireQmit.edu
t Associate Professor, Department of Aeronautics and As- tronautics, MIT Room 35-417, 77 Massachusetts Avenue, Cambridge MA 02139. Email: feronOmit.edu
OCopyright 01999 by MIT. Published by the American Institute of Aeronautics and Astronautics, Inc. with permis- sion.
very long taxi-out times not only increase the direct operating costs for the affected flights, but also re- sult in increased noise and pollutant emissions on the surface of the airports.
It appears therefore desirable to develop mecha- nisms to reduce these departure queues. The high financial and political cost of increasing airport ca- pacity by adding new runways make a strong case for researching operational improvements to the ex- isting system. This paper develops and validates an input-output model of the current departure process at a busy airport, and uses this model to estimate the feasibility and the benefits of departure control mechanisms which aim at reducing departure queues in low capacity conditions.
Many relevant airport models have been devel- oped and described in the literature. Highly de- tailed (or “microscopic”) models such as SIMMOD or TAAM [2], reproduce in great detail the layout of an airport and the operating rules and dynamics of every gate, taxiway and runway for every aircraft type. These models are useful to test procedural changes in routing aircraft on the taxiway system. The downside of these models is the difficulty and high-cost of obtaining statistically significant valida- tion data for all the elements of the airport under many different configurations, and to carry out an exhaustive validation from these data. It is there- fore difficult to obtain from these models quick and reliable estimates of the benefits of new operations concepts at the scale of the airport over a long period of time.
Other models, such as the Approximate Network Delays model (A.N.D.) [21[31, take an aggregate (or “macroscopic”) perspective of capacity and demand at an airport over the course of the day and provide estimates of delays. These models allow to study the propagation of delays at the scale of the NAS, but their macroscopic view of the airports does not cap- ture enough details of individual airport operations
I American Institute of Aeronautics and Astronautics
https://ntrs.nasa.gov/search.jsp?R=20030067994 2018-05-08T10:35:49+00:00Z
to study taxi-out time reduction schemes. This paper takes an intermediate modeling ap-
proach, in which input-output models of the airport terminal, taxiway and runway systems are put to- gether to obtain a “mesoscopic” airport model. The airport terminal system and the runway system are modeled as queueing servers, and a stochastic distri- bution is derived for the travel time on the taxiway system from the terminal to the runway queue. This model captures the departure process in enough de- tail to estimate the effectiveness of departure control schemes in reducing taxi-out times, while remain- ing simple enough to allow a rapid calibration and validation in each runway configuration. A similar modeling approach was used by Shumsky to develop deterministic models which forecast takeoff times of flights from major airports [4H51. Some of these mod- els represent the runway system as a queueing server whose capacity is constant over 10 minute intervals. In these models, aircraft reach the runway queue at the end of a nominal travel time on the taxiway sys- tem. Shumsky also observed a relationship between airfield congestion and airport departure rate which is the basis of a simple departure control strategy evaluated in this paper. The mesoscopic modeling approach was also followed by Hebert L6], who devel- oped a model of the departure process at LaGuardia airport, based on five days of data, to predict depar- ture delays. In this model, the departure demand is a non-homogeneous Poisson process, and taxi-out times are modeled as the sum of a nominal travel time to the runway queue and a runway service time. The runway is modeled as a multi-stage Markov pro- cess in which service completions follow an Erlang-6 distribution. The runway server can also become absent after a departure, and the absence time dis- tribution is Erlang-9.
The contributions of the present paper are to pro- vide a model of an airport departure process that is thoroughly validated over a year of operational data and to use this model to quantify the effects of departure process control. This work differs from previous publications by the following characteris- tics:
the stochastic model of the airport developed in this paper accounts for such explanatory m i - ables as runway configurations and airline ter- minal location.
in each runway configuration, the following model parameters are calibrated using one year of historical data:
- distribution of travel time from the termi- nals to the departure runways
- departure runway service rate
in each runway configuration, the following model outputs are validated using a different year of data:
- distribution of the number of aircraft on the taxiway system,
- distributions of taxi-out times in light, moderate and heavy traffic conditions
- distribution of achieved departure rate
departure control schemes are proposed and tested on the departure process model. The reduction of runway queueing times achieved by these control schemes is translated into re- ductions in direct operating costs and pollutant emissions.
the departure demand used to test the depar- ture control schemes is taken from historical de- mand records to accurately represent “schedule bunching” (e.g. many flights are scheduled at round times for marketing reasons).
The paper is structured as follows: section 1 intro- duces the ASQP and PRAS datasets that were used to validate the model and served as a baseline for the testing of new departure process control laws. Sec- tion 2 describes in detail the structure on the model and the calibration and validation process. Section 3 introduces simple departure process control schemes and estimates their benefits via computer simula- tions.
1 Data sources
1.1 Airline Service Quality Perfor- mance (ASQP) database
The Airline Service Quality Performance (ASQP) data are collected by the Department of Transporta- tion in order to calculate on-time performance statis- tics for the 10 main domestic airlines. The data sets include all the flights flown by the following ten airlines: Alaska, American, America West, Conti- nental, Delta, Northwest, Southwest, TWA, United, and U S . Airways.
2 American Institute of Aeronautics and Astronautics

For every flight recorded, the data set contains operational information such as:
- scheduled and actual gate departure time - actual takeoff time and landing time - scheduled and actual gate arrival time.
ASQP data sets are made available to the public monthly (with a 2 month delay). The monthly files include around 400,000 flights. For all airlines ex- cept Southwest, the “actual” data are automatically reported through the ACARS (Automatic Commu- nications And Reporting System) data link system. For instance, the gate departure time is recorded when the aircraft brakes are released. These data were validated in the case of Boston Logan airport [l] and it was found that although the brake release sig- nal may differ from the actual start of the pushback procedure, recorded times were very close to the ob- served ones.
Actual take-off times have been made publicly available only since January 1995. Taxi-out time is defined in this paper as the time between actual pushback and takeoff. At Boston Logan airport, aircraft are constantly under the control of the Air- port Control Tower between these two events, while, in the case of some larger hub airports, they are handed off from the airline ramp controllers to the Airport Control Tower at an unknown time. The de- parture process at an airport such as Boston Logan is thus expected to display less variability. It is also important to mention that since a single company, ARINC, receives these data in real-time, it would be relatively easy to feed them in real time into a control facility.
Note that ASQP data only take into account do- mestic jet operations of the ten major airlines, even though the turboprop operations of regional airlines can account for as much as 45% of the landing and take-off operations at an airport like Boston Logan. It is assumed in this paper that a useful model of the jet aircraft departure process can still be iden- tified and validated, even though the turboprops do compete for the same taxiways and runways, espe- cially in low-capacity configurations. However, the methods presented here could easily be made more accurate by considering more complete datasets as they become available. In particular, the uncertain- ties that were observed throughout the study of the departure process could be significantly reduced if more data on turboprop operations were available.
1.2 Preferential Runway Assignment System (PRAS) database
The mix of runways that are in use at an airport at any given time is called the “runway configuration”. Consider for instance the layout of Boston Logan airport shown on figure 1.
Figure 1: Layout of Boston Logan International Air- port
Different departure and arrival runways are used depending on weather conditions and airspace or noise abatement procedures:
0 In good weather, parallel visual approaches may be used on runways 4L and 4R to achieve a high landing rate, while departures take place on runway 4R and on the intersecting runway 9 to achieve a high departure rate.
0 In bad weather, and if the winds are strong, only one runway (for instance runway 33L) may be available for takeoff and landings. In such configurations, the departure and landing ca- pacities of the airport are greatly decreased.
Figure 1 clearly shows that the travel time of a flight from its gate to the runway threshold will vary significantly with the position of the gate in the ter- minal and the position of the runway on the airport
3 American Institute of Aeronautics and Astronautics

surface. The runway configuration is therefore an important factor in the airport taxiing operations.
Runway configurations are chosen by the airport tower controllers along the course of the day as the weat her evolves. Unfortunately, historical runway configuration data are usually recorded only manu- ally in logbooks and are archived for a limited time. However, to monitor noise abatement procedures, the Massachusetts Port Authority has implemented a Preferential Runway Assignment System (PRAS) which keeps a digital log of runway configurations within the Boston Logan control tower. This pa- per will therefore concentrate on Boston Logan air- port, but the identification and control methods it introduces could be used at any other airports where configuration data would be available.
The PRAS runway configuration data show that Boston Logan airport usually operates in high- capacity configurations (for 81% of the departure operations, the estimated departure capacity[7]) of the configuration was above 44 aircraft per hour. However, the impact of low-capacity configurations is still important since they are associated with de- parture delays and very long taxi-out times.
2 Model Calibration and Validation
Subsection 2.1 outlines the structure of the model. Subsection 2.2 explains in detail the calibration pro- cess of each element of the model, and presents com- parisons of model outputs with historical data. Sub- section 2.3 presents model validation results.
2.1 Model Structure
A schematic of the model is shown on figure 2. The evolution of the system is modeled over diqcrete 1-minute time periods: t = 1,2 , ...
Runway queue w Figure 2: Structure of the departure process model for current operations
the number of pushback requests during period t. the number of aircraft which are cleared to push back by the airport tower controllers during time period t. the number of pushbacks actually taking place during period t. the number of departing aircraft on the taxiway system at the beginning of period t. the number of aircraft reaching the runway queue during period t. the number of aircraft left waiting in the departure queue on the taxiways at the end of period t (note that this queue may in some cases be spread between several departure runways) the capacity of the departure runways during period t. the number of take-off during period t.
The dynamics of the model are as follows:
0 Airport Tower control action: C(t ) is determined by the airport tower con- trollers, and can take into account:
- the current traffic conditions on the air-
- the current requests R(t). - the forecasts of future departure demand
port surface.
and capacity.
It is assumed here that aircraft push back imme- diately after receiving their clearance, so that P(t ) = C(t).
0 navel time: The arrivals at the runway queue A ( t ) are re- lated to pushbacks P(t) through travel times in the following way:
Pft--7)
-7ZO k=I
where V(t - T, k, T ) is an indicator random vari- able which takes the value 1 if the k-th airplane pushing back at time t - T has travel time T to the runway queue.
4 American Institute of Aeronautics and Astronautics
0 Runway queue: The runway queue satisfies the following bal- ance equation:
0 Takeoff: The achieved take-off rate is limited by the run- way capacity RC(t) and by the number RQ(t) of aircraft available for takeoff:
T ( t ) = min([R&(t - 1) + A(t ) ] , RC( t ) ) (3)
In addition, the “taxiway loading” parameter N ( t ) satisfies the following balance equation:
N ( t ) = N ( t - 1) + P(t - 1) - T(t - 1) (4)
2.2 Model Calibration The purpose of the calibration is to observe histori- cal inputs and outputs of the systems and to deduce “best” values for the model parameters.
2.2.1 Pushback requests and clearances
Figure 2 shows that the input of the model is the number of pushback requests R(t). However this in- put is not captured in the ASQP data. Indeed, the OAG (Official Airline Guide) only reflects the sched- uled departure times but does not account for inter- nal airline events or decisions which could delay the request for pushback of a flight. In addition, the con- trol action of the airport tower controllers between the requests for pushback and the actual pushbacks are not observed. Consequently, the model identi- fication presented in this paper focuses on the mo- tion phase of the departure process, i.e. the part of the model between P( t ) and T ( t ) . Hence, the in- put used for model calibration is now the number of pushbacks P ( t ) during period t , which is the number of actual departures recorded during period t in the ASQP data.
2.2.2 Travel time from terminals to runway
The travel time from the terminals to the runway is not directly observed in the ASQP data. Indeed the taxi-out times listed in the ASQP dataset are mea- sured from pushback to takeoff, and are therefore the sum of the travel time to the runway queue and the runway queueing time.
Observations of ASQP taxi-out times at off-peak hours, when N ( t ) is very low, give a good indication of travel time, since this will usually correspond to periods with little or no runway queue.
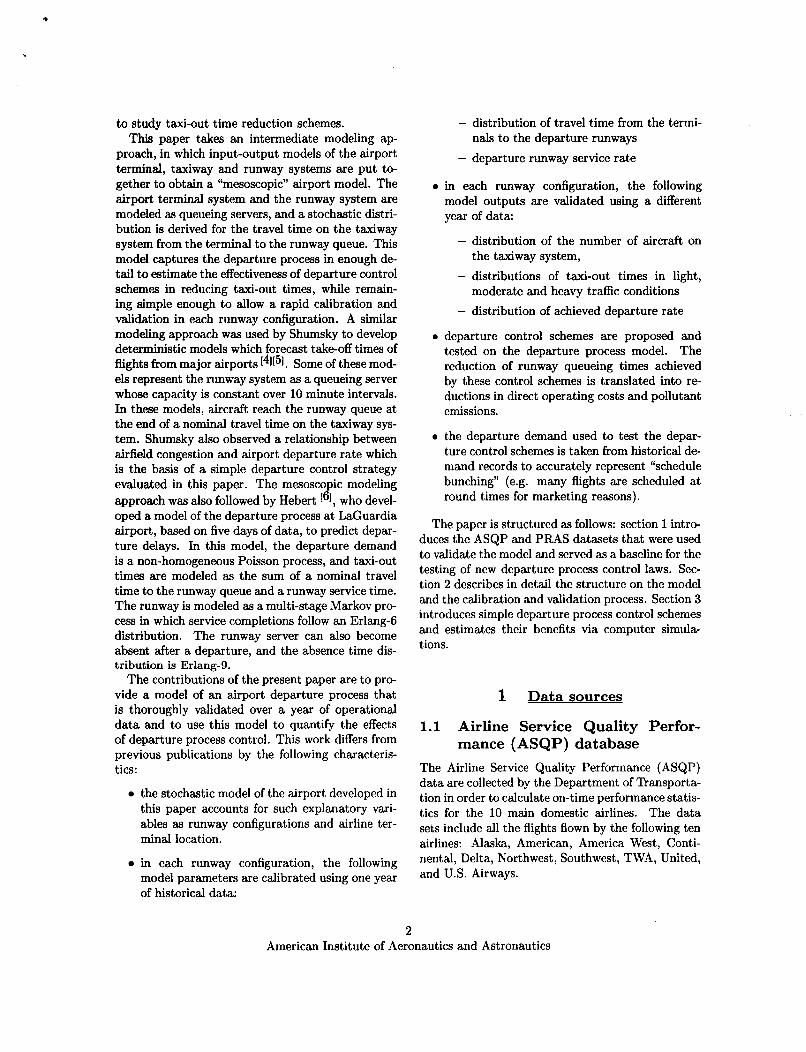
For an aircraft I C , define N p ~ ( k ) to be the value of N when aircraft IC pushes back (i.e. the number of departing aircraft on the taxiway system when aircraft k pushes back). Figure 3 shows a typical distribution of the ASQP taxi-out times for aircraft such that NPB 5 2. Note that this travel time in- cludes the takeoff roll and initial climb until the time when the ACARS takeoff message is sent.
O ’ t I ’L\
Figure 3: Selection of a Gaussian distribution to match a light traffic taxi-out distribution
The variability in these distributions arises from several factors:
0 variability in the duration of the actual push-
0 variability in turboprop operations taking place
back and the engine start
concurrently
0 different flights from the same airline can be as- signed different departure runways or different taxi routes to the same runway
0 taxi speed can be affected by visibility and air- craft types
0 aircraft bound to certain destinations receive their weight and balance numbers later than others and thus take longer to enter the run- way queue
In this paper, these factors are modeled as stochastic uncertainty. Gaussian-like probability
5 American Institute of Aeronautics and Astronautics
mass functions are fitted to the observed distribu- tions to obtain a reasonable model of travel time for low values of N . For instance, a Gaussian distribu- tion with mean 9 minutes and standard deviation 2.3 minutes was selected for the airline shown on figure 3.
A simple estimate of the taxi-out time is then:
7 = 7trouel + 7queue ( 5 )
where: rtraUel = travel time following the light traffic dis-
rqueue = queueing time at the runway. Note that this model will slightly overestimate the
taxi-out time when N is large, because it does not take into account the fact that as the runway queue grows, the travel time Ttravel to reach it decreases.
tributions described above.
2.2.3 Departure runway service process
The dynamics of runway systems have been the object of numerous studies and publications [81[gl. However, discrete event departure runway models which consider each takeoff individually remain dif- ficult to identify and validate. Indeed, while there are some data available on the output of the run- way system (e.g. ASQP take-off times), there are few or no objective and statistically significant data available on its inputs:
times at which aircraft join a runway queue
runway crossings by taxiing or landing aircraft
landings on departure runways
0 landings on intersecting runways
0 take-off of turboprop aircraft
Thus an analysis of inter-departure times cannot precisely distinguish whether a longer than average service time is due to a momentarily empty runway queue or to a server absence (such as a landing or runway crossing).
The analysis of ASQP take-off data is further com- plicated by the poor time resolution of the dataset (the one minute time increments are comparable to typical runway service times).
The approach that is taken in this study is to identify periods of time when the runway queue was unlikely to be empty, and to consider that the his- togram of take-off rates over these periods of time
is a good approximation of the theoretical depar- ture runway service rate distribution. This approach would be easy to implement if the runway queue length RQ(t) could be directly observed. But since no runway queue length data are currently available, the number N ( t ) of departing aircraft on the taxi- way system is used instead. It will be shown that the value of N ( t ) is indeed a good predictor of the departure runway loading over some period of time after t .
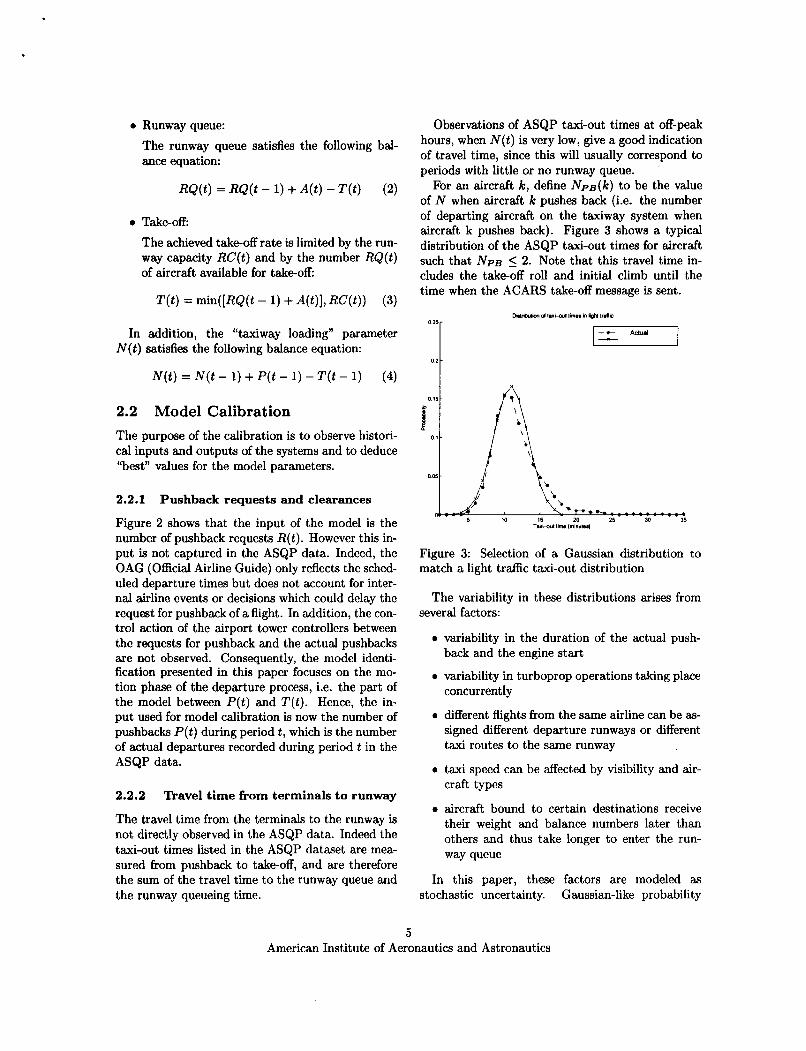
Define F,,(t) to be the “moving average’’ of take off rate, Le. the average of take-off rate over the time periods ( t - n, ..., t , .. ., t + n). A normalized correla- tion plot of N ( t ) and F5(t) under configuration 8 is shown on figure 4 (i.e. figure 4 shows the value of
Figure 4: Configuration 8: N ( t ) is well correlated with T 5 ( t + 6 )
The maximum correlation occurs for dt = 6 , i.e. between N ( t ) and p5(t + 6) . This means that N ( t ) predicts best the number off takeoff over the time periods (t + 1, t + 2, ..., t + 11). (Note that this is consistent with the travel times, which are typically around 8 to 15 minutes at Boston Logan airport). Figure 5 presents histograms of ps(t + 6 ) for differ- ent values of N ( t ) for configuration 8 in 1996 (depar- tures on runways 9-4L-4R and landings on runways 4R-4L). This is a high capacity, good-weather con- figuration that is used often throughout the year at Boston Logan. It accounted for 24.4% of all push- backs in 1996.
6 American Institute of Aeronautics and Astronautics

Figure 5: Evolution of 5?5(t + 6) as N ( t ) varies (con- figuration 8)
As N increases, the take-off rate increases at first, and then saturates for N M 8. This phenomenon had been described in an aggregate manner (i.e. con- sidering all the runway configurations together) by Shumsky [41[51.
The departure runway system model used in this paper is shown on figure 6.
Robability
I* 0 C Capacity
(aircraft per minue)
Figure 6: Probability mass function of the depar- ture capacity of the runway system model' over one minute
It is based on the server absence concept. For each time period, there is a probability p that the runway system is not available for takeoff. If the runway system is available however, its capacity is c aircraft over one time period (i.e. one minute). Paragraph 2.2.4 will demonstrate that even such a simple model of a complex multi-runway system can reproduce quite precisely the dynamics of the depar- ture process .
Note that in this model during each time period the runway capacity is the result of a Bernouilli trial[lOl (with success if the runway system is avail- able for takeoff).
Hence the departure capacity T,,(t) over the (2n+ 1) time periods (t - n, ..., t, ..., t + n) follows the bi- nomial distribution: for 0 5 k 5 2n + 1 ,
The parameters p and c are chosen, for each con- figuration, so that the probability distribution in (6) matches the observed histograms of 5?5(t+6) for high N ( t ) . For example, for configuration 8 table 1 shows that the values p = 0.5 and c = 0.9 give a good match.
Actual Model
Table 1: Actual and model values of T5(t+6) for high N ( t ) under configuration 8 ( p = 0.5 and c = 0.9)
2.2.4 Comparison of model output with
A computer simulation of the model described above was used to compare key model outputs with ASQP historical data. Each computer simulation run cov- ers all the time periods in 1996 when the selected configuration was used.
Since the model will be used to evaluate queueing delays and test methods to reduce these delays, it should provide good estimates of:
historical data
0 how many aircraft are waiting in runway queues
0 how long these aircraft wait in runway queues
(i.e. RQ(t))
@e. T ~ ~ ~ ~ ~ )
Since these values are not directly captured in the ASQP data, the model is evaluated instead on how well it predicts:
0 how many aircraft are on the taxiway system
0 how long taxi-out times 7 are, for various values
when flights push back (i.e. N P B )
of NPB
7 American Institute of Aeronautics and Astronautics
2.2.4.a High-capacity conffguration Figures 7, 8, 9 and table 2 show comparison re-
sults for configuration number 8 (departures on run- ways 9 and 4R, arrivals on runways 4R and 4L). This configuration was in use for about 88200 minutes in 1996 (i.e. about 1470 hours), and represented 21500 pushbacks (which represents 24.4% of the total).
figure 7 shows the "actual" distribution of NPB that was observed in the ASQP database over 1996, along with the "simulated" distribution of NPB averaged over 10 runs of the simulation. Table 2 presents the first two moments of the observed and simulated distributions.
0011- 0 0 1 - oca- 0 1
0.02 - [\ \ \ -
0 4 \ \
OW 0-1
\\ p
Figure 7: Actual and computer simulation model distributions of NPB in configuration 8
002 O M
Table 2: Comparison of actual and simulated NPB distributions for configuration 8
t
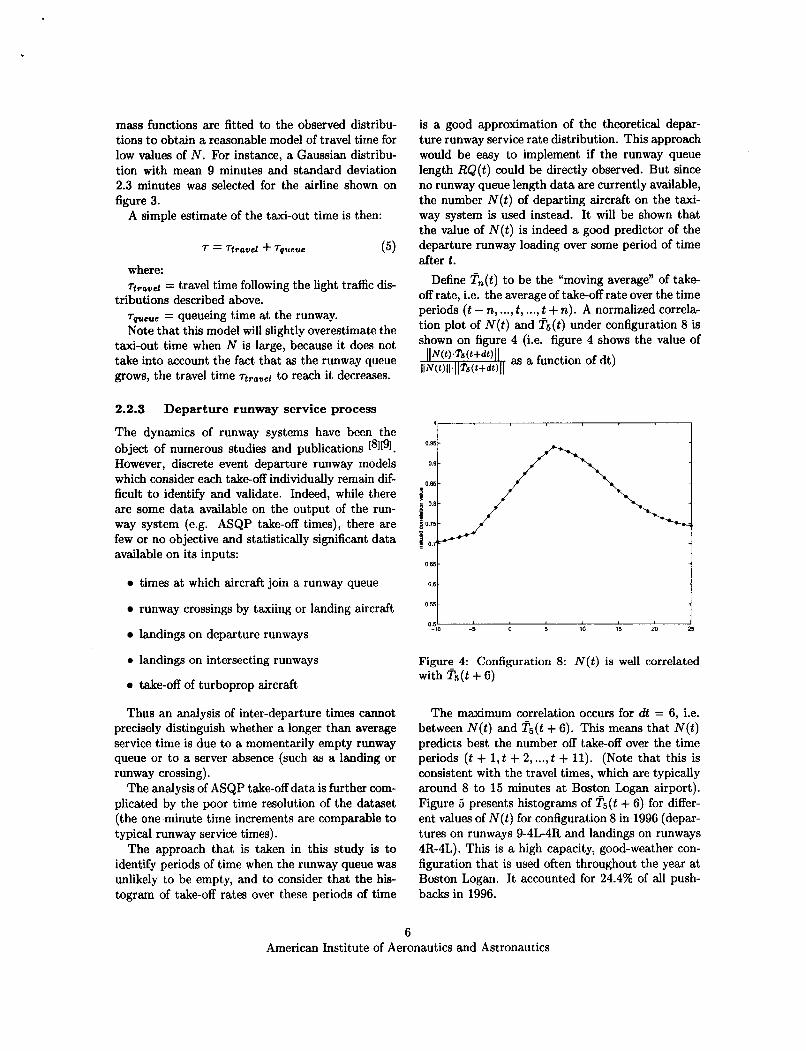
0 figure 8 presents the moving average of take- off rate T;(t + 6) as a function of N ( t ) . The curves represent the mean of the distribution of T;(t + 6) for each N ( t ) , and the vertical bars extend one standard deviation above and below the mean. The dashed lines are the observations from ASQP, while the solid lines are simulation results. The fit is very good, which means that the model reproduces very well the relationship between departures and N .
"0 2 4 8 8 10 12
Figure 8: Moving average of takeoff rate T;(t + 6) as a function of N ( t ) for configuration 8
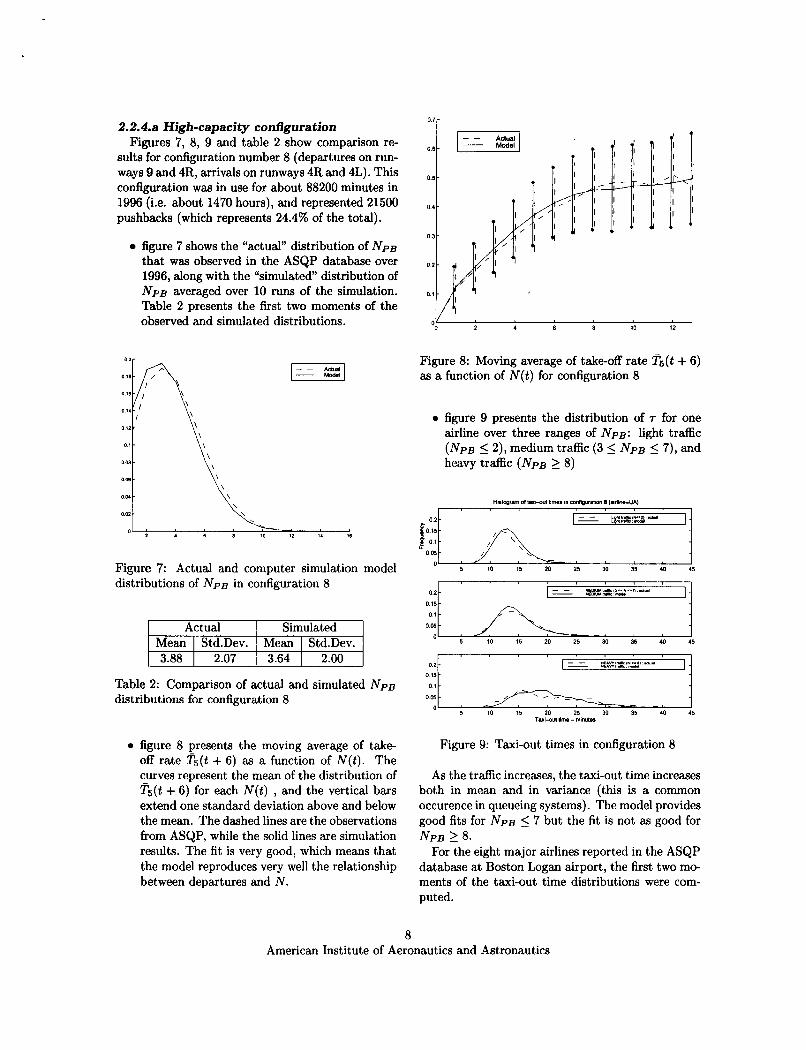
0 figure 9 presents the distribution of r for one airline over three ranges of NPB: light traffic (NPB 5 2), medium traffic (3 5 NPB 5 7), and heavy traffic (NPB 2 8)
0' ' ' 1 I 5 10 15 20 25 30 35 40 45
O:: 5 10 15 20 25 30 35 40 45
0 1
005
0 /
5 10 15 20 25 30 35 40 45 TUI-OYI bme - mi&
Figure 9: Taxi-out times in configuration 8
As the traffic increases, the taxi-out time increases both in mean and in variance (this is a common occurence in queueing systems). The model provides good fits for NPB 5 7 but the fit is not as good for
For the eight major airlines reported in the ASQP database at Boston Logan airport, the first two mo- ments of the taxi-out time distributions were com- puted.
NPB 2 8.
8 American Institute of Aeronautics and Astronautics

Almost all of the mean errors were found to be quite small (well under lo%), but some mean er- rors were as high as 20%. For airlines with rela- tively few operations, this could reflect a small s a - ple with little statistical significance. Another ex- planation is that some airlines are subject to special constraints which are not included in our model (for instance, pushback and arrival operations are com- plex and highly coupled in an area of terminals B and C called the “horseshoe” [l]). The model tends to underestimate the standard deviation of the taxi- out distributions. This reflects the simple structure of the model, which does not fully account for some secondary factors: rare events (e.g. Ground Delay Programs), airspace constraints, differences in air- craft types, etc.
0 2 -
0 1 5 -
O I -
2.2.4.b Low-capacity configuration Figures 10, 11, 12 and table 3 show comparison
results for configuration number 9, which is a lower capacity configuration (departures on runways 9 and 4R, and arrivals on 4R only). Configuration 9 was in use for 21800 minutes in 1996 (i.e. about 360 hours), and represented 3340 pushbacks (which rep- resents 3.9% of the total). Since it is a low capacity configuration, it contributes significantly to runway queueing and thus noise and pollutant emissions.
”‘r
HEAW traffic (N >= 8) actual . HEAW traffic model
_ _
0 12
0 5 -
0 4 5 -
0 4 -
0 3 5 -
0 3 -
0 25 -
0 2 -
figure 10 shows the “actual” distributions of NPB over 1996 along with the “simulated” dis- tributions (averaged over 10 simulation runs). Table 3 presents the first two moments of the actual and simulated distributions.
figure 11 presents the moving average of take- off rate p5(t + 6) as a function of N ( t ) . Again the match is quite good, which means that the model reproduces very well the relationship be- tween departures and N.
1; I , 0 2 4 6 8 I O I2
Figure 11: Moving average of take-off rate p5(t + 6) as a function of N ( t ) for configuration 9
0 figure 12 present the distribution of T over three ranges of NPB .
I ’ ‘ I
‘3 Lighl baffic (N<=2) actual Llphlbaffic model
_ _
- 1 ..I L - iil/ 0 05 * .’,- I - - , ‘
5 10 15 20 25 30 35 40 45
2 4 (I 8 I O 12 I 4 I6
Figure 10: Actual and computer simulation model distributions of NPB in configuration 9
Actual Simulated Mean Std.Dev. Mean Std.Dev.
Table 3: Npg distributions for configuration 9 Figure 12: Taxi-out times in configuration 9
9 American Institute of Aeronautics and Astronautics
Again, it appears that as NPB increases, the taxi- out time increases both in mean and in variance. In this low-capacity configuration, the variance in taxi-out time becomes very large for large values of N p g . Possible explanations include:
0 2 -
015-
0 1 -
transient queueing: if the demand on the de- parture runway temporarily exceeds the re- duced departure capacity, long queues can form quickly at the runway, causing a large increase in taxi-out time.
unmodeled weather-related factors such as Ground Delay Programs.
HEAW traMc (N >= 8) adual . H E A W I M c madel
For the eight major airlines reported in the ASQP database at Boston Logan airport, the first two moments of the taxi-out time distributions were again computed. The mean errors were found to be slightly larger than in the case of configuration 8, mostly because of the increased variability of opera- tions under low-capacity, bad weather scenarios. In addition, the samples are about 7 times smaller than in the case of configuration 8 (because configuration 9 is not used as often) which could explain some of the high mean errors.
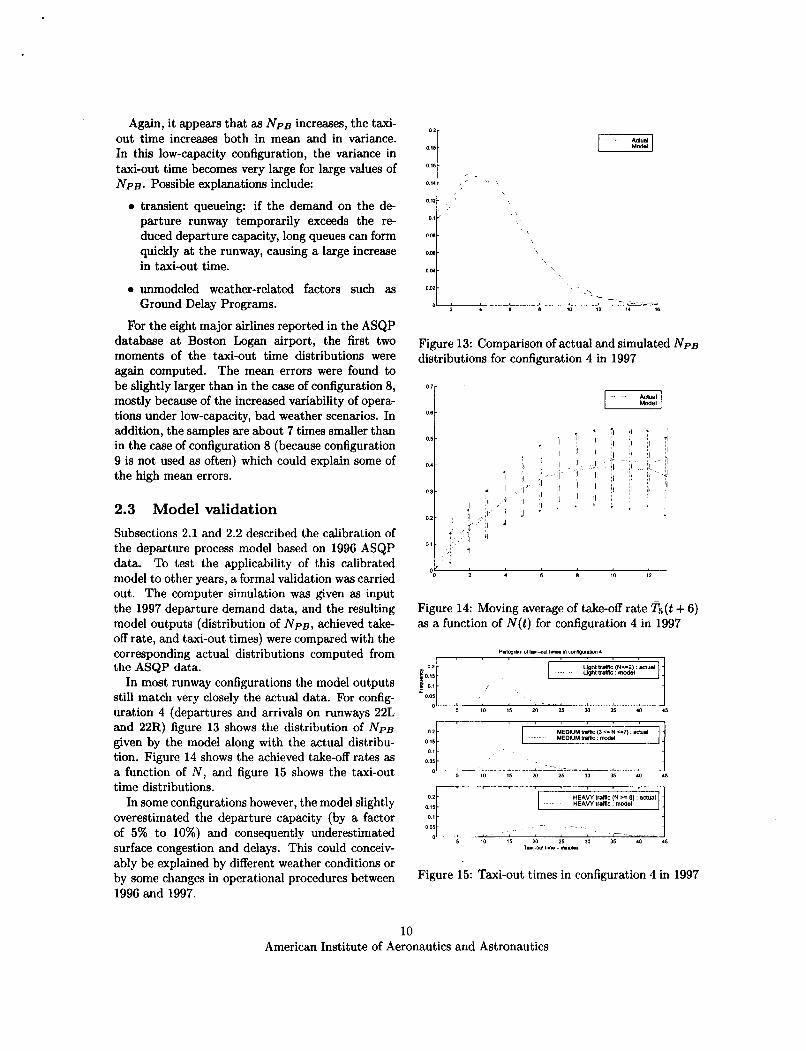
2.3 Model validation Subsections 2.1 and 2.2 described the calibration of the departure process model based on 1996 ASQP data. To test the applicability of this calibrated model to other years, a formal validation was carried out. The computer simulation was given as input the 1997 departure demand data, and the resulting model outputs (distribution of NPB, achieved take- off rate, and taxi-out times) were compared with the corresponding actual distributions computed from the ASQP data.
In most runway configurations the model outputs still match very closely the actual data. For config- uration 4 (departures and arrivals on runways 22L and 22R) figure 13 shows the distribution of NPB given by the model along with the actual distribu- tion. Figure 14 shows the achieved take-off rates as a function of N , and figure 15 shows the taxi-out time distributions.
In some configurations however, the model slightly overestimated the departure capacity (by a factor of 5% to 10%) and consequently underestimated surface congestion and delays. This could conceiv- ably be explained by different weather conditions or by some changes in operational procedures between 1996 and 1997.
0 02
O:t , , , , ' , ; - - , - _ , 2 . I I 10 12 1. $8
Figure 13: Comparison of actual and simulated NPB distributions for configuration 4 in 1997
O B
'I , 2 4 B 8 10 12
Figure 14: Moving average of take-off rate Ts(t + 6) as a function of N ( t ) for configuration 4 in 1997
-1
0 1 5 4 10 15 M 25 30 35 40 45
Figure 15: Taxi-out times in configuration 4 in 1997
10 American Institute of Aeronautics and Astronautics

3 Control of the DeDarture Process
File1
I $/min. in Queue I
2 1 4 1 9 Subsection 3.1 introduces the two major incentives for reducing runway queueing times:
- _ _ ~ Flight crew
Maintenance 0 reductions in direct operating costs
0 reductions in environmental costs.
-
6 12 20 5 9 25
Subsection 3.2 considers some of the constraints that must be taken into account in the formulation of departure process control schemes.
Subsection 3.3 presents the results of the quanti- tative evaluation of simple departure process control schemes. This evaluation was conducted using the model developed in this paper.
type Medium
3.1 Motivation: Cost of runway
3.1.1 Direct operating costs
U S . airlines are required to report Direct Operating Costs (DOC) data to the Department of Transporta- tion ("Form 41"[111). Even though these data can be affected by variability in accounting methods, they provide reasonable estimates of DOC.
The major components of DOC are fuel costs, crew costs and maintenance costs. Note that marginal crew and maintenance costs are difficult to estimate because of the complex overhead costs that are associated with these components of airline oper- ations. Estimated DOC values are shown on tables 4 and 5 for three different aircraft types: medium jets (e.g. Boeing 737), large jets (e.g. Boeing 757 and 767) and heavy jets (e.g. DC-10 and Boeing 747). These estimates are based on 1992 and 1995 data [13[131) and are averaged over all major U.S. airlines.
queueing vs gate delays
jet operations 65
%/min. at gate
Large
Flight crew Maintenance 0 0
Total 2.5 4.5 6
30
Table 4: DOC estimates at the gate
Heavy
Table 5 shows that the DOC of each minute of runway queueing time is between $13 and $54 (de- pending on the aircraft type), while table 4 shows that the DOC for a minute of delay at the gate is
5
Total I 13 I 25 I 54 1 Table 5: DOC estimates in runway queue
between $2.5 and $6. Hence a gate holding depar- ture control scheme which would transform runway queueing time into gate delays could realize DOC savings of $10.5 to $48 for each minute of delay, depending on the aircraft type. Table 6 shows an estimate of the jet aircraft departure t r d c mix at Boston Logan (this estimate was obtained from En- hanced Traffic Management System (ETMS) data collected in June 1998). Combining the data in ta- bles 4,5 and 6 yields an average cost saving of $15.4 for each minute of runway queueing time transferred to the gates.
I Jet aircraft I % of Boston 1
Table 6: Mix of jet aircraft departure operations at Boston Logan in June 1998 (from ETMS data)
3.1.2 Environmental costs
Airports are sensitive areas in terms of pollu- tion. The residents of nearby neighborhoods suffer from noise and pollutants generated by the airport. Among the pollutants emitted by aircraft are [141:
- Nitrogen oxides (NO,) , which play a role in acid rains and are precursors of particulate matter (which reduce visibility) and low-level ozone (a highly reac- tive gas which is a component of smog and affects human pulmonary and respiratory health).
- Unburnt hydrocarbons (HC), carbon monoxide (CO) and Particulate Matter (PM), especially at low engine power settings such as in taxi-out mode.
- Sulfur oxides (SO,), which play a role in acid rain.
Note that aircraft engine typically contribute 45% of the combustion pollutants emissions at an airport, while ground access vehicles contribute another 45%
11 American Institute of Aeronautics and Astronautics

and Ground Support Equipment (GSE) and Auxil- iary Power Unit (APU) usage contribute only 10%. Hence, there is a strong incentive to reduce aircraft engine emissions at the airport. A study for the Washington state Department of Ecology estimated that departure runway queueing is responsible for a significant part of aircraft pollutant emissions at the Seattle-Tacoma airport, and that in particular it accounts for approximately 20% of N O , emissions, 50% of SO, emissions and 40% of P M emissions.
Table 7 shows engine emission characteristics for common aircraft and engine types, at the idle power setting that is typically used during the runway queueing [15] [16]. This table can be used to es- timate the environmental cost of jets queueing on the airport taxiways. The last row shows the aver- age emissions for one minute of jet aircraft runway queueing at Boston Logan airport, based on the per- centage of jet operations flown by each aircraft type (as found in the in the Enhanced Traffic Manage- ment System (ETMS) database in June 1998).
Aircraft/engine Emissions (g/min) HC I CO I NOx
I I
B-727 / JT8D I 74.30 I 336.73 I 69.06 I
Table 7: Jet engine aircraft emissions
3.2 Guiding principles for control concepts
Many airport surface operations control schemes have been envisioned, but few have emphasized es- sential human factors considerations (in particu- lar, important lessons were drawn from the De- parture Sequencing Engineering and Development Model program (DSEDM)[l]). Airport operations are almost entirely monitored and controlled by hu- man operators. Workflow and workload constraints should be considered whenever the feasibility of a
new airport control scheme is evaluated. Any ma- jor change to the airport control procedures would be difficult to study in-situ. Indeed controllers are unlikely to accept any new procedures before they feel it has been proven that they not only work bet- ter than the current ones in all circumstances, but also maintain or improve safety and do not generate excessive workload or radical changes in controller roles and training.
For example, control schemes centered on se- quencing should take into account the fact that air- craft sequencing might require more real-time obser- vations of the position of the aircraft on the taxiway system than are currently captured, and more inter- ventions of the controllers to ensure the sequence is realized at the runway threshold (indeed establish- ing the sequence through pushback clearances alone is not enough due to large uncertainties in pushback and taxi times [l]). These additional observations and interventions entail additional workload for all airport controllers.
Thus it appears that the only control schemes which can bring immediate benefits are the ones which don’t require changing the airport control sys- tem extensively but rather help controllers take bet- ter decisions in their current work process. The “gate holding” schemes evaluated in subsection 3.3 meet this criterion. They consist in holding selected aircraft at their gates (before clearing them for push- back) in order to prevent the development of long runway queues (a conceptual discussion of gate hold- ing as a means to reduce runway queueing time ap- pears in an MIT white paper[l7I).
3.3 Quantitative evaluation of depar- ture process control schemes
A complete evaluation of a “gate holding” control concept should consider how it would interact with the current Airport Tower control actions. However a conservative performance evaluation of such a con- trol scheme can be obtained if it is implemented as a simple gate queue immediately downstream from the Airport Tower controllers (i.e. it is assumed that Airport Tower control actions remain the same). Figure 16 presents the resulting “evaluation” model.
Note that since it is assumed that the Airport Tower control actions are unaffected by the imple- mentation of the gate queue downstream, C(t) is still simply the number of actual pushbacks recorded during period t in the ASQP data.
12 American Institute of Aeronautics and Astronautics

Figure 16: Structure of the departure process model for control scheme evaluation
Define:
GQ(4 = the number of aircraft which have been cleared by the airport tower controllers at or before period t but are still being held at the gate by at the end of period t.
In addition to following the equations (1) through (3) with the parameters determined in section 2, the evaluation model follows the gate queue balance equation:
GQ(t) = GQ(t - 1)+ C( t ) - P(t) (7) The number P(t) of aircraft which are released
from the gate queue and push back during period t is governed by the specific gate holding algorithm that is to be evaluated. Paragraphs 3.3.1 and 3.3.2 present examples of such gate holding algorithms.
3.3.1 Quantitative evaluation of a feedback gate holding scheme
An easily applicable gate holding scheme can be in- ferred from the departure dynamics shown on fig- ure 8 and 11. It appears on these figures that the throughput of the runway does not improve much when N becomes larger than a saturation value Nsat (e.g. Nsat M 6 in configuration 9). Indeed N > Nsat typically corresponds to periods when the runway queue is not empty and thus when the runway is operating at maximum capacity. Allowing N to be- come larger than Nsat results in more aircraft in queue at the runway with little increase in through- put. These observations suggest a control scheme in which aircraft are held at their gates whenever N exceeds some threshold value N,. This amounts to controlling the number of pushbacks P ( t ) by setting:
P(t ) = min( max(N,(t)-N(t),O) , GQ(t-l)+C(t) )
This control scheme would be easily implemented by human controllers at an airport like Boston Lo- gan, since N(t) can be observed in the tower as the
(8)
number of flight strips on the ground controller’s rack. It could also be part of a larger scale concep tual control architecture as described in some pre- liminary studies [181[191. Figure 17 shows the effect of the control scheme for different values of N,, un- der configuration 9. It was obtained through sim- ulation using the model shown on figure 16. The simulation was run for all the time periods of 1996 when configuration 9 was in effect, using the actual departure demand found in the ASQP database but implementing the control scheme expressed by (8). The gate holding delay and runway queueing time of each flight were recorded. The total gate delay and runway queueing time over all these flights is shown on figure 17.
Figure 17: Effect of holding aircraft at the gates when N 2 N, in configuration 9, using actual 1996 demand data (averaged over 10 simulation runs)
As Nc becomes smaller than Nsat, the runway is “starved” and the reduction in runway throughput causes an increase in total delay. But for N , 2 Naat, this control scheme simply replaces runway queue- ing time with gate delay with little impact on run- way throughput. Naturally, gate delay is less costly than runway queueing time, mostly because the air- craft engines are not running while the aircraft is at the gate (see subsection 3.1). The control law was found to have similar effects in other runway configurations. Table 8 presents results obtained for a set of six runway configurations which together represented 82% of the operations at Boston Logan airport in 1996. For each configuration, the value of N, was chosen in such a way that the total queueing time would not increase by more than about 5%.
13 American Institute of Aeronautics and Astronautics

The table shows that the control law is most ef- fective in low capacity configurations (i.e. when the demand would cause the airport to operate at values of N significantly above the saturation value Nsat if no control law was applied). The overall reduction in runway queueing time over these six configurations is 7.1%, and the increase in total queueing time is only 3.2%. The effects on pollutant emissions are :
0 1650 kg reduction in unburnt HC emissions
0 8020 kg reduction in CO emissions
0 1290 kg reduction in NO, emissions
The net savings in Direct Operating Costs can be computed from tables 4, 5, 6 and 8 and amount to approximately $280,000. Note that these estimates apply to 82% of the jet traffic at the airport. Higher figures would be obtained if all the jet traffic was taken into account, and if turboprop operations were included in the model (since they represent as much as 45% of departure operations in Boston Logan). Adopting a more aggressive control law (by reducing N,) would result in larger reductions in pollutant emissions, but may result in lower Direct Operating Cost savings due to the increase in total queueing time it would introduce.
Note finally that if all the runway queueing time occuring in these six runway configurations could be eliminated (as opposed to only 7.1% in the discus- sion above), the effect on pollutant emissions over a year would be of the order of:
a 23.4 ton reduction in unburnt HC emissions
0 a 114 ton reduction in CO emissions
a 18.3 ton reduction in NO, emissions
There is therefore a significant incentive to obtain more data and refine departure process modeling and control laws, in order to realize a larger part of these potential pollutant emissions reductions.
The gate holding control scheme introduced in this section could have two major undesirable side effects:
0 Gate shortage: some airlines might not have enough gate capacity at the airport to accom- modate aircraft being held at the gates by the control law. This gate shortage would become more severe for lower values of the control law
parameter N,, as more and more aircraft would be held at the gate. However, simulation runs showed that at Boston Logan in 1996, the values of Nc used in table 8 would not cause significant gate shortage for most airlines. The last column of table 9 shows how much time an airline would need one additional gate to accommodate all of its aircraft. Over these six selected configura- tions which cover 82% of the 1996 traffic, an air- line would on average run out of gate capacity and require an additional gate only 144 minutes over the whole year. It is moreover conceivable that airlines could slightly modify their gate al- location procedures to alleviate this shortage.
0 On-time performance statistics: the gate hold- ing controls scheme would affect the perceived on-time performance (by delaying pushbacks) and the actual on-time performance (by intro- ducing some departure delay into the system) of the airlines. Columns 5 and 6 in table 9 show that for these values of the control law pa- rameter N,, on average only 2.2% of the push- backs would be delayed by more than 5 minutes, so that the impact on airline on-time statistics would be quite small.
3.3.2 Quantitative evaluation of a predictor- based gate holding scheme
The control scheme described in paragraph 3.3.1 re lies exclusively on the observation of the current state of the airport (in particular N ( t ) , the num- ber of departing aircraft on the taxiway system). It does not take into account future departure demand, or the future evolution of the runway departure ca- pacity (e.g. due to predictable changes in the arrival rate). A control scheme which would use estimates of future departure demand and runway capacity in addition to the current state of the airport should result in an additional reduction in runway queueing times.
Subparagraphs 3.3.2.a and 3.3.2.b consider the availability of data on future departure demand and runway capacity. Subparagraph 3.3.2.c presents a control scheme architecture, based on departure slot allocation, which would take advantage of these data. Subparagraph 3.3.2.d presents initial results obtained by applying a simple departure slot alloca- tion algorithm to Boston Logan.
14 American Institute of Aeronautics and Astronautics

Table 8: Results of the control law for selected configurations at Boston Logan, using actual 1996 demand data (values are averaged over 10 simulation runs)
Table 9: Impact of the control law on on-time performance and gate utilization, for selected configurations at Boston Logan, using actual 1996 demand data (values are averaged over 10 simulation runs)
15 American Institute of Aeronautics and Astronautics

3.3.2.a Departure demand information In current operations, the only future departure
demand information available to the FAA Air Traf- fic Control Tower (ATCT) is the Flight Information Management System (FIMS) maintained by the air- lines to inform their passengers of planned departure times. FIMS is not always accurate since it does not instantly reflect some sources of potential departure delays:
0 late inbound resources (aircraft, crew, flight at- tendants)
0 departure holds to allow passenger connections
0 delays in preparing the aircraft for departure (passenger boarding, baggage and cargo load- ing, catering, etc.)
0 aircraft mechanical problems currently under investigation (“flights on decision”)
It is however a good indication of future demand on a short time scale.
It can be envisioned that more departure demand information will become available in the future. In- deed, since the early days of the FAA - Airlines Data Exchange (FADE) program, significant progress has been made in the definition and implementation of Collaborative Decision-Making (CDM) procedures, which allow the airlines and the FAA to exchange more accurate information on future departure de- mand in the context of Ground Delay Programs (GDP). Departure demand could then be predicted more accurately on longer time scales.
3.3.2.b Runway capacity information The departure capacity of a runway system can
be directly affected by many factors, including: - weather conditions - departure airspace constraints - arrivals
The weather conditions can usually be forecasted with satisfying accuracy 30 minutes in the future (except in drifting fog conditions). Airspace con- straints also vary slowly and are quite predictable.
In current operations, the future arrivals at an airport are not known with good accuracy, due to uncertainties in the timing of aircraft descent pro- files and approach paths. However, the new Center- TRACON Automation System (CTAS) has been
shown to improve significantly the accuracy of ar- rival time predictions [201[211. It appears possible to predict future arrivals up to 15 minutes in advance with an accuracy of 30 seconds.
3.3.2.c Slot allocation architecture The concept of landing slot allocation is used
extensively at major congested airports such as Chicago O’Hare and London Heathrow, and at smaller airports in case of Ground Delay Programs. The same concept can be applied to departure oper- ations. However, a strict application of the concept would require airport tower controllers to actively control taxiing aircraft to ensure that they arrive in the correct order and at the correct times to com- ply with the slot allocation. This would make the testing and implementation of the concept difficult and costly. In order to minimize disruptions to the current controller work processes, the slot alloca- tion process could be limited to determining opti- mal pushback times. Aircraft would be held at the gate until a desired pushback time which should take them to the runway in time for their take-off slot. After pushback, controllers would not be required to ensure that aircraft are exactly complying with the slot allocation. The price to pay for this sim- plicity is an increased vulnerability to uncertainties in taxi times.
Define H to be the time horizon for predictions and slot allocations. Based on subparagraphs 3.3.2.a and 3.3.2.b, a reasonable value for H would be 20 minutes. A simple departure slot control architec- ture could be used to implement the concept:
0 Step l a . Prediction of departure runway ca- pacity: the future departure runway capacity is predicted over ( t , t + H ) taking into account weather, airspace constraints, arrivals, etc. as outlined in subparagraph 3.3.2.a.
0 Step l b . Prediction of runway arrival times: the times at which currently taxiing aircmft will arrive at the runway are estimated, and the remaining departure runway capacity is com- puted.
0 Step l c . Prediction of departure demand: based on the published schedule and updates from the airline control centers, a “departure pool” con- sisting of the aircmft which will request a de- parture over ( t , t + H ) is estimated.
16 American Institute of Aeronautics and Astronautics

0 Step 2. Take-ofl slot allocation: an algorithm allocates the available departure runway capac- ity to aircraft in the departure pool. The algo- rithm should try t o minimize runway queueing times while respecting some key constraints (e.g. in general, a n aircraft cannot leave its gate be- fore ats published departure t ime) and fairness rules (e.g. first come first served).
0 Step 3. Selection of pushback times: a pushback t ime is selected f o r each aircraft in the depar- ture pool which has been assigned a slot, taking into account the t ime it will take f o r the air- craft to reach the runway under current airport conditions.
Notes:
the slot allocation algorithm should take into account the uncertainty arising in the runway departure capacity and demand predictions.
the selected pushback times should also take into account the uncertainty in the travel time to the runway.
the control points in the departure process are currently the object of detailed studies[lgI.
3.3.2.d SJo t a JJoca tion algorithm Many algorithms (or combinations thereof) can
be used to optimize the slot allocation process, in- cluding: - Heuristics - Mathematical programming - Dynamic programming (DP) or approximate DP
A simple heuristic was used to obtain a conserva- tive estimate of potential benefits of the departure slot allocation concept. This heuristic is an imple- mentation of the architecture described in subpara- graph 3.3.2.c.
0 Step la: the predicted departure runway capac- ity is taken to be constant over ( t , t + H ) and equal t o the average capacity observed in this configuration under high taxiway loading (e.g under configuration 9, figure 11 shows that the average departure capacity under high taxiway loading is around 0.35 aircraft/minute).
0 Step lb: the runway arrival time of each taxiing aircraft is estimated b y adding to its pushback time the average travel time f o r its airline in this particular runway configuration (see para- graph 2.2.2).
0 Step IC: future departure requests are assumed to be known exactly over ( t , t + H ) .
0 Step 2. The slot allocation algorithm spreads the departure demand t o ensure that the pre- dicted runway queue over (t,t + H ) does not exceed a target runway buffer RQ,. Slots are allocated according to the following variation of the first come first served rule: out of all the aircraft in the departure pool which could be as- signed to a take-off slot, the aircraft that is ac- tually assigned is the one with the earliest de- parture request time.
In initial computer simulation tests, the heuristic departure slot allocation algorithm described above did not perform as well as the simple state-feedback gate holding scheme introduced in paragraph 3.3.1.
The relatively poor performance of the predictor- based algorithm can be attributed to the large uncer- tainties in travel times and departure capacity. The introduction of additional airport operations data into the model (such as arrivals and turboprop op- erations) should reduce these uncertainties and im- prove the performance of slot allocation algorithms.
Conclusion
In this paper, we have considered the problem of modeling the departure process at a busy airport for the purpose of alleviating surface congestion. Our experimental investigation has allowed us to p r e vide a simple, yet extensively validated dynamical queueing model of the departure process. Prelimi- nary investigations show that active control strate- gies on this model can reduce congestion on the airport surface using aircraft gate holding. These strategies allow a reduction in direct operating costs and environmental costs without increasing total de- lay significantly. Their implementation would be compatible with the current airport operations and human control structure. Further research will com- bine aircraft departure control with arrivals control, with the intent to improve the overall airport effi- ciency. Further efficiency will also be gained by re- ducing model uncertainties and investigating more advanced control laws.
17 American Institute of Aeronautics and Astronautics

Acknowledgments
This research was supported by the FAA, NASA (grant NAG-2-1128) and a gift from Honeywell. The authors would like to thank Boston Logan airport tower controllers and airline station managers for
[lo] A.W. Drake. findamentals of Applied Proba- bility Theory. McGraw-Hill, Inc., 1967.
[I11 Website of the Bureau of Transportation Statistics / Office of Airline Information. http://www.bts.gov/oai/sources/.
the they provided‘ This paper [12] R.W. Simpson. Air Traffic Control. Lecture Notes, 1994. benefited from discussions with Prof.
R.J. Hansman and J.P. Clarke at MIT. A. Odoni,
[13] R.W. Simpson and P. Belobaba. Air trans- . .
portation economics. Lecture Notes, 1996. References [l] B. Delcaire and E. Feron. “Dealing with airport
congestion: Development of tactical tools for the departure flows from a large airport”. Tech- nical report, International Center for Air Trans- portation, Massachusetts Institute of Technol- ogy, 1998.
[2] A. Odoni et ai. “Existing and required mod- eling capabilities for evaluating ATM systems and concepts, 1997”. Final Report, Modeling Research under NASAIAATT.
[3] K. Malone. Dynamic Queueing Systems: Behavior and Approximations for Individual Queues and Networks. PhD thesis, Mas- sachusetts Institute of Technology, 1993.
[4] R.A. Shumsky. Dynamic Statistical Models for the Prediction of Aircmft Take-Off Times. PhD thesis, Massachusetts Institute of Technology, 1995.
[5] R.A. Shumsky. “Real-time forecasts of aircraft departure queues”. Air Rafic Control Quar- terly, 5 (4) :28 1-308, 1997.
[6] J.E. Hebert and D.C. Dietz. “Modeling and analysis of an airport departure process”. Jour- nal of Aircraft, 34(1):47, 1997.
[A H. Idris. Observations at Boston Logan inter- national airport.
[8] E. Gilbo. Airport capacity: Representation, es- timation, optimization. IEEE Trans. Control
[14] United States Environmental Protection Agency. Indicators of the environmental impacts of transportation, 1996. EPA 230-R- 96-009.
[15] International Civil Aviation Organization. ICAO engine exhaust emissions data bank, 1995. DOC 9646-ANl943.
[16] United States Environmental Protection Agency. Adopted aircraft engine emission standards, 1997. EPA 420-F-97-010.
[17] E. Feron, R.J. Hansman, A.R. Odoni, R. Barocio Cots, B. Delcaire, X. Feng, W.D. Hall, H.R. Idris, A. Muharremoglu, and N. Pujet. “The Departure Planner: A conceptual discussion”, 1997. Available at http://snipe.mit .edu/dp/whitepaper.pdf.
[18] H. Idris et al. “Observtkions of depar- ture processes at Logan Airport to support the development of departure planning tools”. In Proceedings of the ATM-98 International Air h f i c Management R&D seminar, 1998. http://atm-seminar- 98.eurocontrol.fr/finalpapers/track2/idrisl.pdf.
[19] I. Anagnostakis et al. “A conceptual design of the Departure Planner”, 1999. In preparation.
[20] R. Zelenka, R. Beatty, and S. Engelland. “Pre- liminary results of the impact of CTAS informa- tion on Airline Operational Control”. In Pro- ceedings of the 1998 AIAA Guidance, Naviga- tion and Control Conference, 1998.
Systems Technology, 1:144-154, 1993. [21] K.T. Mueller and J.E. Robinson. “Final Ap-
[9] M.A. Stamatopoulos, K.G. Zographos, and proach Spacing Tool (FAST) velocity accuracy A.R. Odoni. “An analytical model for runway performance analysis”. In Proceedings of the system capacity analysis”. In Proceedings of 1998 AIAA Guidance, Navigation and Control the IFAC International hnsportat ion Sympo- Conference, 1998. sium, Chanea, Greece, 1997.
18 American Institute of Aeronautics and Astronautics