inpex business strategy and two lng projects - ichtys and ... · and two lng pjtproject inpex cor...
TRANSCRIPT

INPEX Busind T LNG P j tand Two LNG Project
INPEX COR
July 3
ness Strategy t I hth d Ab dits ‐ Ichthys and Abadi
RPORATION
, 2009
AgeAge
Mid‐to‐long Term B
Gas Market
Ichthys LNG ProjecIchthys LNG Projec
Ab dAbadi LNG Project
1
endaenda
Business Strategies
ctct
t

CautionaryCautionary
This presentation includes forward lookingThis presentation includes forward‐lookingexpectations of the Company. Such forwardcurrent assumptions and judgments of the
tl il bl t it d i l kcurrently available to it, and involves knowother factors. Such risks, uncertainties and performance, achievements or financial pofuture results, performance, achievements by such forward‐looking information. Suchinclude, without limitation:include, without limitation:
Price volatility and change in demand
Foreign exchange rate volatility
Change in costs and other expenses perand production
The Company undertakes no obligation toThe Company undertakes no obligation to of information in this presentation (includidate of this presentation.
2
y Statementy Statement
g information that reflects the plan andg information that reflects the plan and d‐looking information is based on the Company in light of the information
d k i k t i ti dwn and unknown risk, uncertainties, and other factors may cause the Company’s sition to be materially different from any or financial position expressed or implied h risks, uncertainties and other factors
in crude oil and natural gas
rtaining to the exploration, development
publicly update or revise the disclosurepublicly update or revise the disclosure ing forward‐looking information) after the
Mid‐to‐long Term Bi o o g e
Katsujir
Director ExecutivDirector, Executiv
Business Strategiesu i e a egie
ro Kida
ve Vice Presidentve Vice President

Awareness of The BuAwareness of The Bu
Recent international financial crisis an
Risks of rapidly and drastically fluctu
Increasing priority of natural gas in re
I i l i t titi fIncreasingly intense competition for rinternational oil and gas companies a
Rising technical and economic hurdleareas
To replace reserves is necessary, but d
Escalated exploration and productionEscalated exploration and productionschedule delay
The international business environindustry has been increasingly sev
Stable demand for natural gas/LN
4
Stable demand for natural gas/LN
usiness Environmentusiness Environment
nd a decrease in energy demandgy
uating oil and gas prices
esponse to environmental issues
i l th jresources, mainly, among the major and the state enterprises in China and India
es as project sites shift towards frontier
difficult to implement
n costs and increased risks of productionn costs and increased risks of production
nment surrounding the upstream vere and uncertain
NG in the long termNG in the long term
Our StOur St
Strong reserve/resource ba
Large‐scale LNG projects a
Gas supply chain
Strong financial positionStrong financial position
Financial scheme by goverFinancial scheme by goverinstitutions in Japan
5
rengthrength
ase
as an operator
nmental financialnmental financial

Strong Reserve/Strong Reserve/
5,000
3,500
4,000
4,500
2,000
2,500
3,000
MMBOE
1 598
484 484
1 114 1 114500
1,000
1,500
2,000 1,598
1,114 1,114
0
500
Proved
Developed
Reserves
Proved
Undeveloped
Reserves
Proved
Reserves
6
* Proved reserve volumes are based on the reserves report (preliminary) by DeGolye
reserves report (preliminary) by DeGolyer and MacNaughton applying SPE/WPC/A
reserves and probable reserves by SPE‐PRMS after deduction of proved reserves by
** Reserve Life = Proved (+Probable) Reserves as of March 31, 2009 / Production for the
/Resource Base/Resource Base
3,348
4,774
Reserve Life**(RP Ratio)
Gas1,823(44%)
Possible Reserves+
Contingent Resources
3,176 3,176
32.3years
1 114
484
10.8years
Liquids2,651(56%)
1,114
Probable
Reserves
Proved +
Probable
Reserves
years
er and MacNaughton applying SEC regulations. Probable reserve volumes are based on the
AAPG/SPEE guideline (SPE‐PRMS) approved in March 2007. The volumes are the sum of proved
SEC regulations. Volumes attributable to the equity method affiliates are included.
e year ended March 31, 2009 (RP Ratio: Reserve Production Ratio)
Mid‐to‐Long Term Objectid F dand Fundamen
Mid‐to‐Long Term Objectiv
Raise the daily production level upequivalent) by 2020, and establish aupstream company with global com
g j
upstream company with global com
Maintain RRR to be over 100% in m
E bli h l h i i hEstablish a gas supply chain with tgas remaining as our core businessother fortes besides oil and natural
Maintain financial health, empowevalue
Sustainable expansion of our upst
Fundamenta
p p
Establishment of a gas supply chagas business
7
Evolvement into a company that o
ives for Corporate Growth t l St t intal Strategies
ves for Corporate Growth
p to 800,000 to 1 million barrels (crude oil a firm position as a global independent mpetitiveness
p
mpetitiveness
mid‐to‐long term
h b i f il d lthe upstream business of oil and natural s, as well as evolve into a company with l gas, supplying diversified energiesg pp y g g
er corporate vitality, and increase corporate
tream business
al Strategies
ain and proactive expansion of the
offers diversified forms of energy

Net Production* VNet Production V
Frade Oil Field+4 Thousand BOED (Started in Jun. 2009)
h G
900
1000Tangguh LNG+6 Thousand BOED (Started LNG producexpected to ship 1st cargo soon)Van Gogh Oil Field
700
800+4 Thousand BOED (Expected to start in O
Year ended March 31, 2009‐2011 CAGR: 6.9%
452454424
462500
600
an
d B
OE
D)
405 424
300
400
(Th
ou
sa
36%
4%
100
2006%
46%
0Mar. '09 Mar. '10(E) Mar. '11(E) Mar. '12(E) Mar. '13(E)
8%
8
Japan Asia/Oceania Eurasia Mi
* The production volume of crude oil and natural gas under the production sharing c
Note: Assuming oil prices (Brent) of $52.5 in the year ending March 31, 2010 and $6
Volume ProjectionVolume Projection
Long term production target
(800‐1 000 thousand BOED)
ction in Jun. 2009 and
(800‐1,000 thousand BOED)
Oct.‐Dec. 2009)New Projects
454 Kashagan Oil Field
43%
5%
Existing Projects
(Expected to start in 2012)
Ichthys LNG Project
(Expected to start in 2015)
35%
11%
(Expected to start in 2015)
Abadi LNG Project
(Expected to start in 2016)
Mar. '14(E)
6%
2020
iddle East/Africa Americas
contracts entered into by INPEX Group corresponds to the net economic take of our group.
60 in the March 31, 2011 or later in the light of the recent market conditions.
Gas Ma
Katsujir
Director ExecutivDirector, Executiv
Marketa e
ro Kida
ve Vice Presidentve Vice President
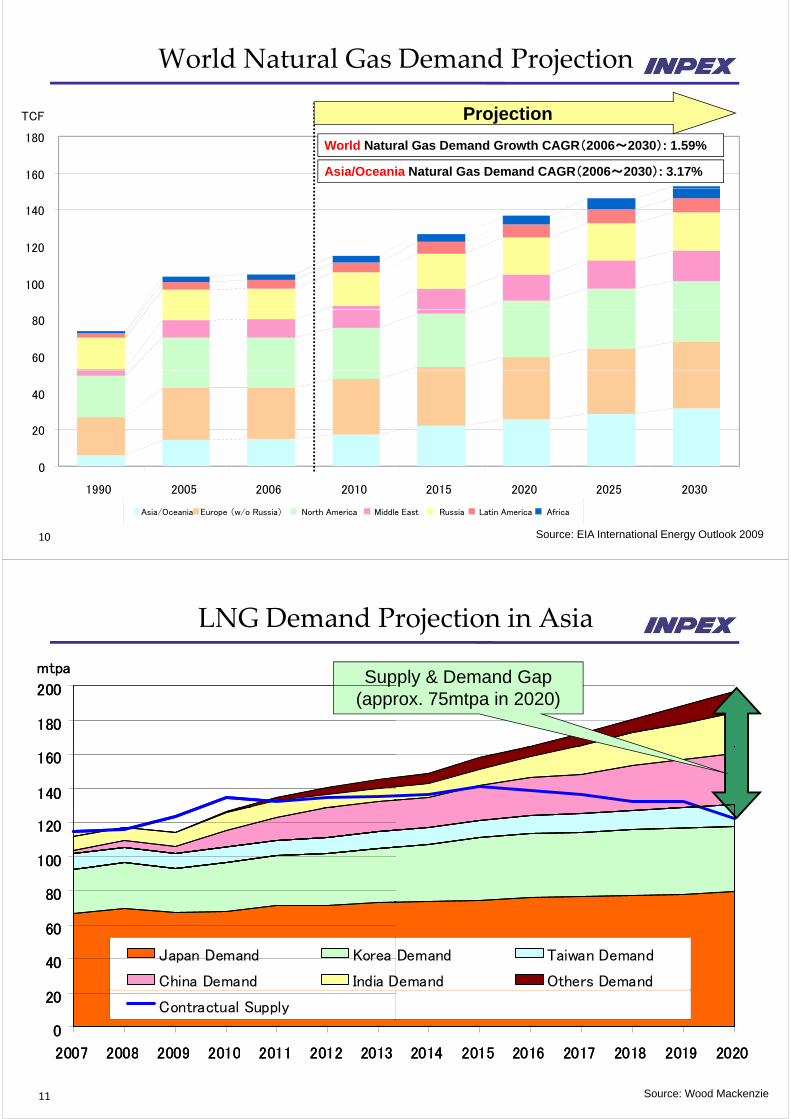
World Natural Gas
TCF
World Natural Gas
160
180World Natur
Asia/Oceani
120
140
100
120
60
80
20
40
0
20
1990 2005 2006 2010
10
1990 2005 2006 2010
Asia/Oceania Europe (w/o Russia) North America Middle
Demand ProjectionDemand Projection
Projection
ral Gas Demand Growth CAGR(2006~2030): 1.59%
ia Natural Gas Demand CAGR(2006~2030): 3.17%
2015 2020 2025 20302015 2020 2025 2030
Source: EIA International Energy Outlook 2009
e East Russia Latin America Africa
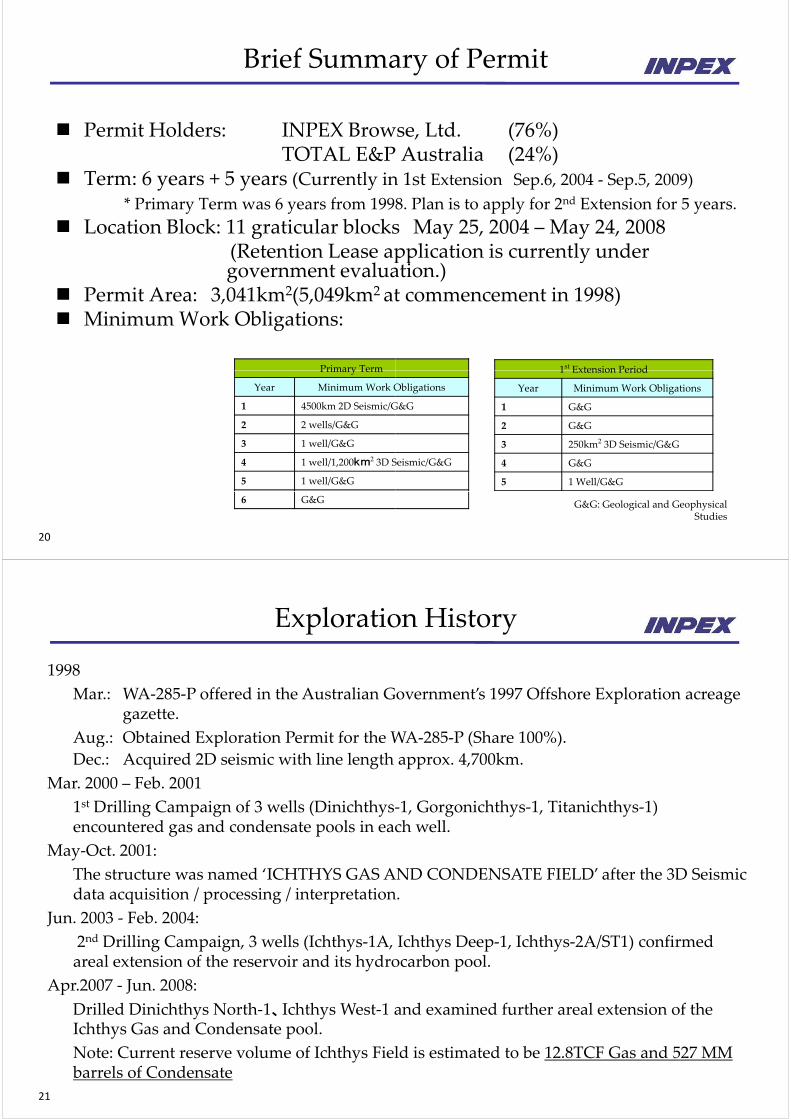
LNG Demand Pr
200
mtpa
200
mtpa
LNG Demand Pr
Sup
180
200
180
200 (appr
140
160
140
160
100
120
100
120
60
80
60
80
40
60
Japan Demand Korea
China Demand India D40
60
Japan Demand Korea
China Demand India D
0
20
2007 2008 2009 2010 2011 2012 2013
Contractual Supply
0
20
2007 2008 2009 2010 2011 2012 2013
Contractual Supply
11
2007 2008 2009 2010 2011 2012 20132007 2008 2009 2010 2011 2012 2013
rojection in Asiarojection in Asia
pply & Demand Gaprox. 75mtpa in 2020)
Demand Taiwan Demand
Demand Others Demand
Demand Taiwan Demand
Demand Others Demand
2014 2015 2016 2017 2018 2019 20202014 2015 2016 2017 2018 2019 20202014 2015 2016 2017 2018 2019 20202014 2015 2016 2017 2018 2019 2020
Source: Wood Mackenzie

Asia Pacific New & ExpaAsia Pacific New & Expa
Startup from mid-2010s onward
Area Project
< Australia>Australia-Pacific LNGGorgon
GLNGGladstone LNGGladstone LNG
IchthysPluto ExpansionQC LNGQC LNG
< Other Asia Pacific Area>AbadiDonggi Senoro LNGPNG LNGPNG LNG
Sakhalin Expansion
Total
12
Total
anded LNG Projectsanded LNG Projects
( )Capacity (mtpa)
7.015.0
3.51 51.5
8.44.87 47.4
4.52.06 36.3
4.8
65 2
Source: Wood Mackenzie
65.2
LNG Mi th Middl Ein the Middle Ea
New LNG Supply for European & North America
Kitimat LNG
Skikda Rebuild
Arzew LNG (GL3-Z)
Libya
NLNVenezuela LNG
Eq
Bra
Libya
Peru LNG
Eq
A
13
LNG Market LNG Flow New &
Market t & th Atl tiast & the Atlantic
an Market
Shtokman
a Exp.Damietta Exp.
Qatargas-3
NG VII Plusquatorial Guinea LNG 2
ass LNG
a Exp. Qatargas-3
Qatargas-4
Rasgas-3
quatorial Guinea LNG 2
Angola LNG
& expanded LNG Projects in the Middle East & the Atlantic

LNG Supply & DLNG Supply & D
90
mtpa
Suppl
70
80(approx
60
70
40
50
30
10
20
Contracted Supply (assumption) LNG Demand
0
2007 2008 2009 2010 2011 2012 2013
14
Demand in JapanDemand in Japan
y & Demand Gapx. 25mtpa in 2020)
2014 2015 2016 2017 2018 2019 2020
Source: Wood Mackenzie
LNG PriceLNG Price
Asian LNG Prices are generally lig y
Indonesian LNG Prices are linked
There is a time lag between the mThere is a time lag between the mprices: LNG prices are normally lthe date of LNG sale.
LNG Price
LNG Price
Crude Oil Parit
LNG Pric
15
P(LNG Price) = A(Slope)×I
e Formulae Formula
inked to JCC (Japan Crude Cocktail)( p )
d to ICP (Indonesian Crude Price)
movement of crude oil and LNGmovement of crude oil and LNG linked to JCC a few months before
ty
ce Formula
Crude Oil Price
Index(ex. JCC) + B(constant)

Gas MaGas Ma
El d C GJapanese Electric and City Gabuyers because of their longst
d t bl fi i l t tusers and stable financial statuJapanese domestic gas marketinfrastructures consisting of Ninfrastructures consisting of NTerminal and pipeline networalso taken into considerationalso taken into consideration.
Long‐term LNG SPAs still havf kPacific LNG Market.
INPEX leads the marketing acI E ea e a e i g aprojects. Generally LNG is maproject partners, unlike equity
16
p j p q y
arketingarketing
C f bls Companies are favorable tanding track records as LNG
I dditi l tus. In addition, supply to t by utilizing our gas Naoetsu LNG ReceivingNaoetsu LNG Receiving rks and other Asian markets are
ve been predominant in Asia‐
ctivities for its operator LNG i i ie o i ope a oarketed to buyers jointly by y lifting in oil sales.y g
Ichthys LNI y
Se
Director ManagiDirector, Managi
Senior General Manage
NG Projectoje
iya Ito
ing Executive Officering Executive Officer
er, Ichthys Project Division

Ichthys ProjeIchthys Proje
WA‐285‐PIchthys Field
18
ect Locationect LocationAbadi
WA‐285‐P Ichthys FieldWA 285 P Ichthys Field and Adjacent Area
Extent of IcExtent of Ic
OmiyaOmiya
MMMM
MitakaMitaka NakanoNakanoT hikT hik
FussaFussaIkebukuroIkebukuro
MitakaMitaka NakanoNakanoSS
ShibuyaShibuya
TachikawaTachikawa
HachiojiHachioji
NoboritoNoborito
KawaKawa
MachidaMachida
k hk h
19
YokohamaYokohama
chthys Fieldchthys Field
Long side: approx. 40km
KashiwaKashiwaMinamikoshigayaMinamikoshigaya
Short side: approx. 15km+Area: approx. 600km2
M t dM t d
MinamikoshigayaMinamikoshigaya
UenoUeno
MatsudoMatsudo
IchikawaIchikawa
ShinjukuShinjuku
TokyoTokyoTsudanumaTsudanuma
ChibaChiba
sakisaki
0 10km
Brief SummaBrief Summa
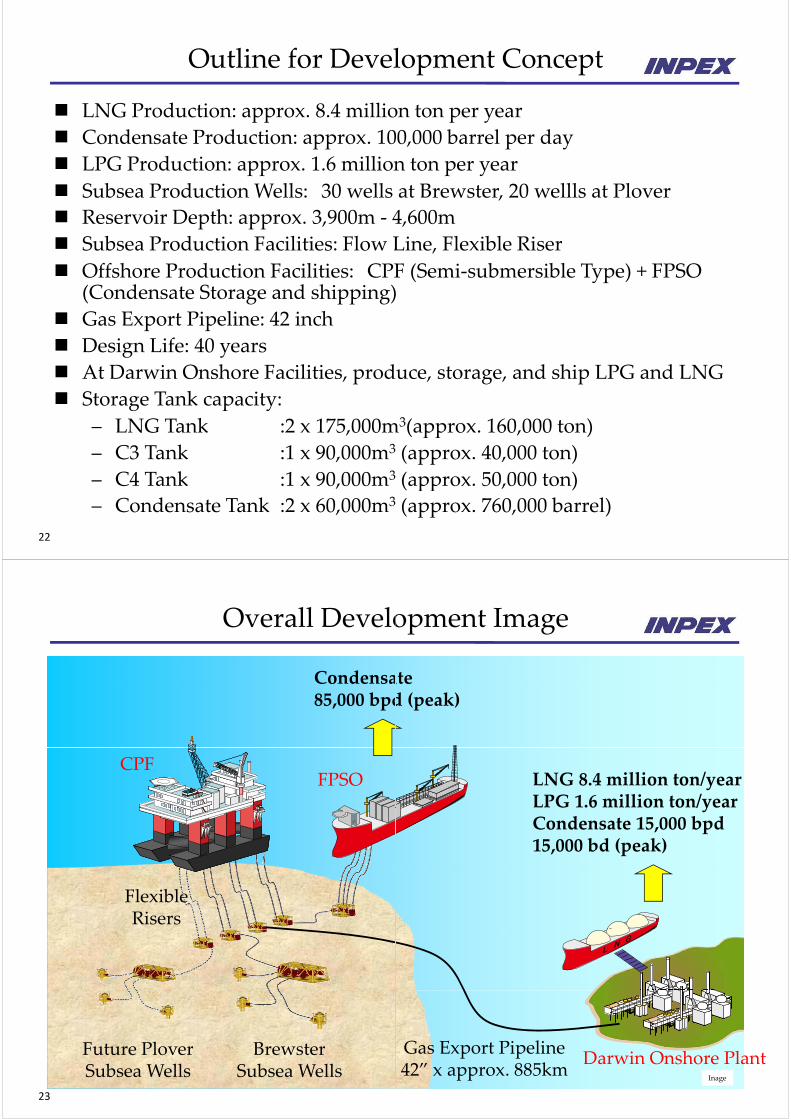
Permit Holders: INPEX BrowPermit Holders: INPEX BrowTOTAL E&P
Term: 6 years + 5 years (Currently iny y ( y
* Primary Term was 6 years from 1998
Location Block: 11 graticular blocks(Retention Lease ap(Retention Lease apgovernment evalua
Permit Area: 3,041km2(5,049km2 atMinimum Work Obligations:
Primary TermPrimary Term
Year Minimum Work O
1 4500km 2D Seismic/G
2 2 wells/G&G
3 1 well/G&G
4 1 well/1,200km2 3D S
5 1 well/G&G
20
6 G&G
ary of Permitary of Permit
wse Ltd (76%)wse, Ltd. (76%) Australia (24%)n 1st Extension Sep.6, 2004 ‐ Sep.5, 2009)p p )
8. Plan is to apply for 2nd Extension for 5 years.
s May 25, 2004 – May 24, 2008pplication is currently underpplication is currently under ation.)t commencement in 1998)
1st Extension Period1 Extension Period
Year Minimum Work Obligations
1 G&G
2 G&G
Obligations
G&G
3 250km2 3D Seismic/G&G
4 G&G
5 1 Well/G&G
Seismic/G&G
G&G: Geological and Geophysical Studies
Exploratio
1998
Exploratio
Mar.: WA‐285‐P offered in the Australian Ggazette.
Aug.: Obtained Exploration Permit for the W
Dec.: Acquired 2D seismic with line length
Mar. 2000 – Feb. 2001
1st Drilling Campaign of 3 wells (Dinichthys‐1 Drilling Campaign of 3 wells (Dinichthys‐encountered gas and condensate pools in eac
May‐Oct. 2001:
Th d ‘ICHTHYS GAS AThe structure was named ‘ICHTHYS GAS Adata acquisition / processing / interpretation
Jun. 2003 ‐ Feb. 2004:
2nd Drilling Campaign, 3 wells (Ichthys‐1A, areal extension of the reservoir and its hydro
Apr.2007 ‐ Jun. 2008:Apr.2007 Jun. 2008:
Drilled Dinichthys North‐1、Ichthys West‐1 aIchthys Gas and Condensate pool.
Note: Current reserve volume of Ichthys Fiel
21
Note: Current reserve volume of Ichthys Fielbarrels of Condensate
on Historyon History
overnment’s 1997 Offshore Exploration acreage
WA‐285‐P (Share 100%).
approx. 4,700km.
‐1 Gorgonichthys‐1 Titanichthys‐1)‐1, Gorgonichthys‐1, Titanichthys‐1) ch well.
AND CONDENSATE FIELD’ f h 3D S i iAND CONDENSATE FIELD’ after the 3D Seismic n.
Ichthys Deep‐1, Ichthys‐2A/ST1) confirmed ocarbon pool.
and examined further areal extension of the
ld is estimated to be 12 8TCF Gas and 527 MMld is estimated to be 12.8TCF Gas and 527 MM
Outline for DevelOutline for Devel
LNG Production: approx. 8.4 millio
Condensate Production: approx. 10
LPG Production: approx. 1.6 million
Subsea Production Wells: 30 wellsSubsea Production Wells: 30 wells
Reservoir Depth: approx. 3,900m ‐ 4
Subsea Production Facilities: Flow LSubsea Production Facilities: Flow L
Offshore Production Facilities: CPF(Condensate Storage and shipping)
Gas Export Pipeline: 42 inch
Design Life: 40 years
At Darwin Onshore Facilities prodAt Darwin Onshore Facilities, prod
Storage Tank capacity:
– LNG Tank :2 x 175,000mLNG Tank :2 x 175,000m
– C3 Tank :1 x 90,000m3
– C4 Tank :1 x 90,000m3
22
– Condensate Tank :2 x 60,000m3
lopment Conceptlopment Concept
on ton per year
00,000 barrel per day
n ton per year
at Brewster 20 wellls at Ploverat Brewster, 20 wellls at Plover
4,600m
Line, Flexible RiserLine, Flexible Riser
F (Semi‐submersible Type) + FPSO )
uce storage and ship LPG and LNGuce, storage, and ship LPG and LNG
m3(approx. 160,000 ton)m (approx. 160,000 ton)
(approx. 40,000 ton)
(approx. 50,000 ton)
(approx. 760,000 barrel)
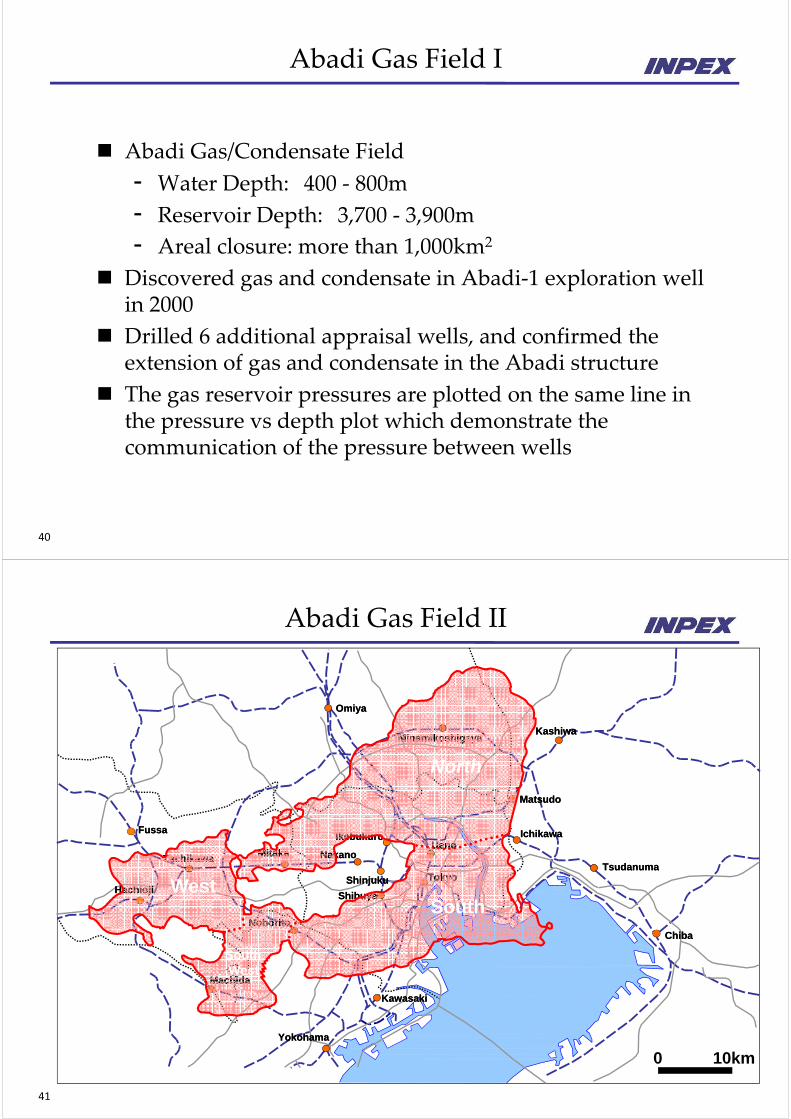
Overall DeveloOverall Develo
Condensa85,000 bpd
CPFFPSO
FlexibleRisers
BrewsterFuture Plover
23
BrewsterSubsea Wells
Future PloverSubsea Wells
opment Imageopment Image
ated (peak)
LNG 8.4 million ton/yearLPG 1.6 million ton/yearyCondensate 15,000 bpd15,000 bd (peak)
L N G
Gas Export PipelineO h l
Gas Export Pipeline42” x approx. 885km
Darwin Onshore PlantInage

Offshore FacOffshore Fac
CPF
SUBSEACONDENSSUBSEA CONDENSTRANSFER LIN
24
cility Layoutcility Layout
OFFTAKEOFFTAKETANKER
FPSO
SATESATENE
Image
Subsea Well andSubsea Well and
CPF
Drill Cen
25
Development Well
Infield Flowline Infield Flowline
FPSO
nter
Flow Line
ImageWater Depth: approx. 250m

CPF/FCPF/F
Flare Stack
Flexible Riser• 100m x 1• 100m x 1to GOM
• Living QSouth sid
Image
• Flexible
• 350• Liq• Sto• Ga• Liv
26
Turret
• Liv
Image
FPSOFPSO
100m One of the biggest size in the world (similar size100m. One of the biggest size in the world (similar size Thunder Horse)
Quarter (150 personnel capacity) will be installed in deRiser will be installed in North side.
0mx58mquid from CPF will be transferred through Turretorage Capacity : 1.2 million barrelas will be backed to CPF upon re‐pressurizedving Quarter (150 capacity) will be installedving Quarter (150 capacity) will be installed
Gas ExporGas Expor
Specification
Si d Thi k– Size and Thickness
– Length
– Allowable Pressure
– Material
– Total Weight
Wate Depth at Route– Water Depth at Route
27
rt Pipelinert Pipeline
42” 33 5: 42”x33.5 mm
: approx. 885 km
: 200 Bara
: X65
: approx. 800,000 ton
e app o 250 0e : approx. 250m ‐ 0m
Image

LNG Plant SiLNG Plant Si
Decided Onshore LNG Plant Site at D– Announcement was issued at Darwin dat– Announcement was issued at Darwin dat
– Messrs. Martin Ferguson, Minister for ResTourism and Paul Henderson Chief Minis
28
ite Location Iite Location I
Darwinte of 26th Sep 2008te of 26 Sep. 2008
sources and Energy CW, Minister for ster NT attended
LNG Plant SiLNG Plant Si
D
Darwin
East Arm PortEast Arm Port
Darwin LNG
Channel IslandPower Station
29
te Location IIte Location II
Darwin Airport
Plant SiteBlaydin Point
5km

LNG PlanLNG Plan
30
nt Layoutnt Layout
Image
Module OffloModule Offlo
31
ading Facilityading Facility
Image

GHG (Greenhouse GGHG (Greenhouse G
Situation in AustraliaSituation in Australia
‐ Carbon Capture and Storage (CCAmendment (Greenhouse Gas SAmendment (Greenhouse Gas S
‐ CCS acreages released in Mar. 2
‐ Carbon Pollution Reduction Schbill passed House of Representa
‐ CPRS bill to be voted in Senate i
‐ Government expects CPRS to co
INPEX Efforts
‐ Reduce GHG emissions from On
‐ Study measures to offset GHG e
• Biosequestration, Geoseque(emission permits) etc.
32
Gas) Management IGas) Management I
CS) Law (Offshore Petroleum Storage)) became effective in Nov. 2008Storage)) became effective in Nov. 2008
009
heme (CPRS: emissions trading scheme) ( g )atives on Jun. 4, 2009 and sent to Senate.
in Aug. 2009
ommence in Jul. 2011
nshore Liquefaction Plant
emissions
A E Ustration, Australian Emissions Units
GHG (Greenhouse G
Total emission of GHG : 280MMt/
GHG (Greenhouse G
/
Below shows CO2 emission in kg
33* H
Gas) Management II
/40years, 7MMt/year
Gas) Management II
/ y , /y
per 1MWh electric generation
Historical Aus LNG : NWS, Darwin LNG

Contribution to LContribution to L
Djarindjin Signing Ceremony (April 2009)
34
Local CommunityLocal Community
Fred’s Pass Rural Show (May 2009)y
DevelopmenDevelopmen
FIDA l f
Submission of
To obtain EnvironmGovernment Approval
Application of Environmental Approval
Public Comments
additional information
To obtain Environm
Application of Production Licence
FEED
Approval Public Comments
To obtain Producti
Onshore &
FEED D
EPC D i i
Onshore & Offshore Facilities Decision
LNG purchase commitmeGas
MarketingMarketing
2010
35
nt Schedulent Schedule
First LNG
ment Approvalment Approval
ion Licence
Detailed Engineering
Procurement
Construction
ent from buyers
2015

Project OrganProject Organ
TOTAL E&P AustraliaINPEX BrowWA‐285‐P
76%24%
TOTAL E&P Australia (OperatoJoint Venture
Perth
Deputy Head of Project
Perth
OffshoreCoordination
Onshore Coordination
E l tiOnshore
O tiExploration
Subsurface
Onshore Facility
Civil
Operations
Drilling & Completion
Offshore Facility
YokohamaOffice
London / OsloOffice
36
nization Chartnization Chart
wse, Ltd.or)
Managing DirectorH d f P j t
Tokyo Head OfficeIchthys Project Committee
Head of Project
Project Coordination
CorporateCoordination
QHSEExternal Affairs
QHSE
Environment
External Affairs& JV
HR
Fi &Finance & Administration
Commercial& Legal
GHG
Project Services
ITContracts &Procurement
Logistics DarwinOffice
Abadi LNA a i
Shunich
Director ManaginDirector, Managin
Senior General Manage
NG Projectoje
hiro Sugaya
ng Executive Officerng Executive Officer
er, Masela Project Division

Masela P
Banda SeaBanda Sea
Masela P
0 200km
Banda Sea
Dili MasDili
Sunrise
Timor
East TimorMas
Eva
Kupang EElang-Kakatua
CorallinaLaminaria
Buffalo
BayuーUndan
JabiruChallis
Cassini
TalbotSkua PetrelPetrel
Tern
Crux
Cornea
BlacktipIchthys
38
Blacktip
WA 285PIchthys
PSC Block
aKai Islands
PSC Block
Aru Islands
Tanimbar Islands
Islands
SaumlakiIslands
sela PSC Block
IndonesiaMasela Is
Abadi
Timor Sea
sela PSC Block
C lditBarossaans Shoal
Evans Shoal SouthTimor SeaCaldita
Australia
Darwin
ExplorationExploration
SC dNov. 16, 1998 PSC signed
Feb. – Mar. 1999 2D seismic survey (2,9
Oct. – Dec. 2000 Drilling of Abadi‐1 by
Jul. – Sep. 2001 3D seismic survey (2,0Challenger
Mar. – Oct. 2002 1st appraisal drilling bpp g
2003 – 2007 Subsurface studies and
May 2007 – Jul. 2008 2nd appraisal drilling
Sep 2007 – Nov 2008 Pre‐FEED of FloatingSep. 2007 Nov. 2008 Pre FEED of Floating
M/V Geco Rho
Energy Searcher
39
n Milestonesn Milestones
948km) by Marine Vessel Geco Rho
y rig Energy Searcher
060km2) by Marine Vessel PGS Ramform
by rig Energy Searcher (2 wells)y g gy ( )
d development concept selection studies
by rig Ocean General (4 wells)
LNGLNG
M/V PGS Ramform Challenger
Ocean General
Abadi GaAbadi Ga
Abadi Gas/Condensate Field
- Water Depth: 400 ‐ 800mWater Depth: 400 800m
- Reservoir Depth: 3,700 ‐
- Areal closure: more thanAreal closure: more than
Discovered gas and condensin 2000in 2000
Drilled 6 additional appraisaextension of gas and condeng
The gas reservoir pressures the pressure vs depth plot wp p pcommunication of the pressu
40
as Field Ias Field I
4 5North
d
m
13
264 5
7West
SW
m
‐ 3,900m
n 1 000km213
South
n 1,000km
sate in Abadi‐1 exploration well
al wells, and confirmed the nsate in the Abadi structure
are plotted on the same line in which demonstrate the ure between wells
Abadi GaAbadi Ga
OmiyaOmiya
MitakaMitaka NakanoNakanoTachikawaTachikawa
FussaFussaIkebukuroIkebukuro
ShinjukuShinjuku
ShibuyaShibuya
NoboritoNoborito
HachiojiHachioji West
MachidaMachida
SouthWest
KawKaw
YokohamaYokohama
41
as Field IIas Field II
KashiwaKashiwaMinamikoshigayaMinamikoshigaya
MatsudoMatsudo
North
UenoUeno
TsudanumaTsudanuma
IchikawaIchikawa
TokyoTokyoTsudanumaTsudanuma
SouthChibaChiba
wasakiwasaki
0 10km

Production ShaProduction Sha
Contractor: INPEX Masel
Effective Date: Nov. 16, 1998
Contract Period: 30 years
Exploration Period: 10 years (proPeriod in cas
Contract Area : 3,221.3km2 (arelinquishmerelinquishme
Indonesian Participation:
Obligation toObligation toIndonesian coGovernment commercial o
42
aring Contractaring Contract
la, Ltd. (100%)
8
oceed to Development and Production e of commercial discovery)
already had done twice partial ent from 5 725km2)ent from 5,725km2)
o propose the transfer of 10% interest too propose the transfer of 10% interest to ompany, which Indonesian designates after the discovery of oil and gas field
Plan of DevPlan of Dev
In Sep. 2008, INPEX submitted the POD of the Agas field, and BPMigas approved it in principlegas field, and BPMigas approved it in principle
Approved Development Concept
‐ Floating LNG
‐ Initial development focusing on the North
‐ The LNG production of 4.5MTPA for more30 yearsy
‐ Condensate production of 13,000 bpd
‐ Subsea production System
Advantages of the FLNG development Option
‐ Minimum Environmental Impact
Reduction in CAPEX OPEX and abandonm‐ Reduction in CAPEX, OPEX and abandonmwork & cost
‐ Possibility to reduce project lead time
Schedule
‐ Currently, working on the preparation for
‐ Production start‐up expected in 2016
43
velopmentvelopment
Abadi e.e.
block
e than
ment
FLNG 3D Imaga Hull Size: 500m length × 82m width
ment
FEED
SUBSEA Image

FloatinFloatin
Development Facilities
Development Scheme : Subsea Production p
Development Well : 18 production well
Floating LNG : Loading LNG Plan
ti l FPSOconventional FPSO
Stern
UtilityAccommodation
Stern
LNG Loading Arm
44
ng LNGng LNG
System + Floating LNGy g
ls (Directional Wells from 5 Drilling Center)
nt, LNG Storage Tank, and Loading facility on
OO
Flare Stack
SwivelProcess
Swivel
TurretBow
Tank
FLNG L
UtilityLiving
FLNG L
Utility Area
Living Quarter
500mStern
45
Condensate Offloading Hose Reel
LNG Loading
Layout
Flare St kProcess
Layout
StackProcess Area
Turret
Bow
82m82m
g Arm

DevelopmenDevelopmen
Final Investment Decisio
EnvironmentalGo ernment
Public Announcement
Local hearing
Environmental & Environmental Permit
Government Approval
Environmental & Social Impact Assessment
Floating LNG
FEED
EPC Decisionoa i g NG
Subsea Production System
Decision
Gas Marketing
LNG purchase commitme
g
2011
46
nt Schedulent Schedule
on(FID) First LNG
l d E
Procurement
Detailed Engineering
Construction
ent from buyers
2016
Organization of Proj
GMOld Organization (Jun. 2009)
Organization of Proj
FIN G&O EXPL PE OPEADM
(Jun. 2009)
New Organization(FEED phase)
PresidentDirector
( p )
IndonesiaAssetsAssetsDirector
FinanceGA&HRLegal &
Insurance G&O PE EXPL
47
Supporting function & Non Operator Project
ject Implementation
Total Manpower (as of Jun 2009)
ject Implementation
Total Manpower (as of Jun. 2009)Expat: 27 (16)National: 64 (36)* Figure in parenthesis is current manpower Figure in parenthesis is current manpower
MaselaAssetAsset
Director
StrategicPlanningHSE
ProjectService
Subsurface DrillingFacility
EngineeringPre-Pro
O&M
Masela Project

AppeAppeendixe i
Cost CalculatCost Calculat
From FEED Phase to Development Phase
Phase/Class and Cost Calculation Accuracy
Estimate Accuracy vs Phase/ClassEstimate Accuracy vs Phase/Class
Class 1Assess
(S i )
90/10
CS
Concept Select FE
Class 1Assess
(S i )
90/10
CS
Concept Select FE
Accuracy+40% Accurac
+30%
Class 2Select(Study)
(Screening)
Accuracy+40% Accurac
+30%
Class 2Select(Study)
(Screening)
+30%
50/50
+30%
50/50
Allowance &Contingency
30%
Accuracy‐40%
Allowance &Contingency
25%
Accurac‐30%
Contingency
30%
Accuracy‐40%
Contingency25%
Accurac‐30%
Base
Base Estimate
10/90 Base
Base Estimate
10/90
49
Base Estimate
10/90 Base Estimate
10/90
tion Accuracytion Accuracy
Final InvestmentFinal Investment
FEED Engineering Detailed Engineering
FID
Final InvestmentDecision
FEED
EED Decision
FEED Engineering Detailed Engineering
FID
Final InvestmentDecision
FEED
EED Decision
cy
A
Class 3Developcy
A
Class 3Develop
Accuracy+15%
AAllowance &
Accuracy+10%
Accuracy10%
(Budget) Class 4Execute(Control)
Accuracy+15%
A
Accuracy+10%
Accuracy10%
(Budget) Class 4Execute(Control)
cy Allowance &Contingency
Accuracy‐15%
Contingency ‐10%
cyContingency
Accuracy‐15%
Contingency ‐10%
Base Estimate
Base EstimateBase
Estimate
Base Estimate

Price Trends of MatePrice Trends of Mate
d f lMonitoring price trends of materialsvarious services based on the analys
D l t b d t hi h fl tDevelopment budget which reflects (statutory requirements, environmencalculated based on the optimizationthe o e of ba i de i (FEED)the progress of basic design (FEED) machineries, materials and services umatches the fixed specification.
The international prices for engineersteel, logistics, pipeline constructiondeclining trend since 3Q of last yeardeclining trend since 3Q of last year declined by the end of last year but arise from the beginning of this year.
According to CERA’s statistics, the uAsia‐Pacific region for 1Q of 2009 hayear ago.
50
year ago.
erials & Machinerieserials & Machineries
h l b ds, machineries, labor wages and sis of various cost data.
th h t i ti f th P j tthe characteristics of the Project ntal requirements, etc.) will be n of the plant specification in line with a d effi ie t te de i o e of, and, efficient tendering process of
utilizing the contract strategy which
ring, materials, machineries, labor, n vessels, rigs and so on, are showing a up to now Nonferrous metal pricesup to now. Nonferrous metal prices are currently showing a tendency to
upstream development costs in the as reduced 11% compared with half a
Price Trends of Materia
<Prices for Materials & Machineries, Labor WEngineering, Machineries, Bulk Materials4Q/2008.On the other hand, lack of skilled labor in,are on a rising trend.
<Steel Prices> (Spot price for 1Q/2009. Approx. 30% of JapAll ki d f t l f ll 30 t 40%All kinds of steel: fallen 30 to 40% compaHot Rolled Plates required for the Ichthyperiod.
<Nonferrous Metal Prices> (LME forward price for 2
Nonferrous metal prices have reached prcome back to recovery trend to some extecome back to recovery trend to some exteof price range of 3Q/2008.
<Rig Rates> (1Q/2009)d h h l lRig rates are maintained in a high level p
remarkable for floaters in West African shwater.O th th h d fl t t f A i P
51
On the other hand, floater rates for Asia‐Pbe related to Ichthys, are exceptionally po
als & Machineries, Rigs, g
Wages> (1Q/2009)g ( )
s, Logistics: fallen 4 to 10% compared with
n Australia is continuing and labor wages g g
panese steel mill products are dealt in the spot market.)
d ith 3Q/2008ared with 3Q/2008.s Pipeline: fallen over 40% from the peak
2Q/2009)
rice bottom around the end of 2008 and ent now. Nickel, Copper, Aluminum are halfent now. Nickel, Copper, Aluminum are half
d E llposition or rising trend . Especially, it is hallow waters (0 ‐ 3000ft) and mid/deep
P ifi h ll t (0 3000ft) hi h illPacific shallow waters (0 ‐ 3000ft) which will ositioned in declining trend.

MarketMarket
Market Tr(2006/3Q-200
140
125
130
135
140
3Q = 100)
110
115
120
125
dex (2006/3
90
95
100
105
Price Ind
90
2006-3Q
2006-4Q
2007-1Q
2007-2Q
2007-3Q
2007-4Q
2008-1Q
52
t Trendt Trend
rend09/1Q)
Engineering
Materials &MachineriesBulk MaterialsBulk Materials
Logistics Expenses
Labour Rates
2008-2Q
2008-3Q
2008-4Q
2009-1Q
CondensateCondensate
Market:– Condensate production of 1.85 mil
1.07 million barrels per day in tota– Condensate production of 670 thou
450 th d b l d i A450 thousand barrels per day in As– 200 thousand barrels per day impo– Surplus condensate is mainly expo
Buyers: Japan, South Korea, China, Tai
Use: Petrochemical material, Refinery m
Price: Linked to price of Dated Brent DPrice: Linked to price of Dated Brent, Dsurrounding area
Contract Type: FOB or CFRContract Type: FOB or CFR
Contract Term: Annual term and Spot
53
e Marketinge Marketing
llion barrels per day and consumption of l Asia (Year 2007)usand barrels per day and consumption of i t th Middl E t (Y 2007)sia except the Middle East (Year 2007)
orted to Japan (Year 2008)orted to U.S.A and Europe.
iwan, Singapore, Thailand, Indonesia etc.
material
Dubai and similar crude producing in theDubai, and similar crude producing in the

LPG MaLPG Ma
MarketU S i the la e t LPG o u e i– U.S. is the largest LPG consumer inJapan and India are the main consu
– Japan is the world largest LPG impton per year It accounts for approxton per year. It accounts for approxJapan. (2008)
– Main exporters are countries in thecountries in the East Asia includingcountries in the East Asia includingsupplied to East Asian countries, wtraded LPG volumes. (2008)
Buyers– LPG wholesalers and some of Elec
importing LPG in Japan.i po i g i Japa
Price– Saudi CP (Contract Price) is the ext– Saudi CP (Contract Price) is the ext
exported LPG Prices, made availabSaudi Aramco, national oil companIndex, the averaged spot price in F
54
g p pbecoming another benchmark pric
arketingarketing
the o ld hile i A ia Pa ifi Chi an the world, while in Asia‐Pacific, China, umers in the order of consumption.porter importing with about 14 million ximately 80% of total consumption inximately 80% of total consumption in
e Middle East, while main importers are g Japan. About 30 million ton of LPG isg Japan. About 30 million ton of LPG is which corresponds to a half of world sea
tric/City Gas companies are directly
tensively‐used benchmark for worldtensively‐used benchmark for world ble in the beginning of each month by ny of Saudi Arabia. Argus FEI (Far East Far East) monthly announced by Argus is ) y y ge for LPG in East‐Asian market.
Source: Poten & Partners
Taxation SchemTaxation Schem
⇒(Oil/Gas sales price)×(SalSales
⇒OPEX incurred in relevant
・Depreciation ⇒ Straight‐line MethCost of Goods Sold
The majority of the expenditu
Selling, General and
Administrative Expenses
The majority of the expenditu
PRRT=(Upstream Revenue-Upst
carried forward PRRT expenditure
・PRRT deductions are made inAb d t C t
A i is a i e E pe sesAbandonment Cost.
Note: Exploration cost is subjecentities.
・Upstream Revenue = Revenup
※GTP (Gas Transfer Price) →Ave
※Cost Plus Price → identify valu
※Net Back Price → identify value
・Undeducted PRRT Expenditure:Undeducted PRRT Expenditure: following year(s), which is subjec
Development cost: LTBR+5%; Exp
*GDP Factor applies to all expendapplication is made.
= (①-②-③-Interest pai
Corporate Tax
(In Australia)
app i a io i a e
*LTBR = Long Term Bond Rate
*GDP Factor = GDP Deflator of Au
55
Note: Gas Transfer Price
“Gas Transfer Pricing” rules prevent taxpayers from setting arbiinterests are held by the same entity (or entities).
me in Australiame in Australia
les volume) ・・・・・・・・・・・①
years(+Exploration cost)+CAPEX depreciation ・・・・・・・・・・②
hod (effective life: 15 years for Production Facilities; 20 years for Pipelines)
ure constitute PRRT(Petroleum Resource Rent Tax) paymentsure constitute PRRT(Petroleum Resource Rent Tax) payments
tream Capex & Opex- Expl. Cost-Abandonment Cost- undeducted
e)×40% ・・・・・・・・・・・・・・③
n the following order: Upstream Capex, Opex, Expl. Cost,
ct to mandatory transfer between Projects/members of same group of
ue from Oil and Gas sales or GTP×Sales volume
erage of “Cost Plus Price” and “Net Back Price”
ue based on Upstream costs
e based on LNG FOB sales price less Downstream costs
non‐utilised PRRT deductible expenditure can be carried forward to thenon‐utilised PRRT deductible expenditure can be carried forward to the t to augmentation at the rates set out below;
pl. Cost: LTBR+15%; Abandonment cost: LTBR
diture incurred more than 5 years before the Production Licence
id)×30%ustralia
itrary upstream gas sales price where both upstream and downstream

Ichthys ProjIchthys Proj
1998 1999 2000 2001 2002 20
INPEX Browse, Ltd.
1Q 2Q 3Q 4Q 1Q 2Q 3Q 4Q 1Q 2Q 3Q 4Q 1Q 2Q 3Q 4Q 1Q 2Q 3Q 4Q 1Q 2Q
Contract Year
WA‐285‐P / Ichthys
Y1 Y2 Y3 Y4 Y5
Permit Effective Date
(1998/8/19)
Location Blo
Geophysics Activities 2D seismic data
acquisition
3D seismic data acqui
(multi‐client data:
Dinichthys 1Drilling
(Ichthys/WA‐285‐P)
Dinichthys‐1
Gorgonichthys‐1
Titanichthys‐1
Development Engineering
56
ject Historyject History
003 2004 201020092005 2006 2007 2008Q 3Q 4Q 1Q 2Q 3Q 4Q 1Q 2Q 3Q 4Q 1Q 2Q 3Q 4Q 1Q 2Q 3Q 4Q 1Q 2Q 3Q 4Q 1Q 2Q 3Q 4Q 1Q 2Q 3Q 4Q
Y6 1RY1 1RY2 1RY41RY3 1RY5
1st renewal ,
partial relinquishment
2RY1 2
2nd renewal,
partial relinquishmentock Approval
isition
Ichthys 1A Dinichthys North 1Ichthys‐1A
Ichthys Deep‐1
Ichthys‐2A/ST2
Dinichthys North‐1
Ichthys West‐1
Commencement Onshore FEED
Commencement Offshore FEED
Abadi ProjeAbadi Proje
PSC Sign: Nov. 16, 98
2PSC
2D 2 948km
Geco RhoSeismic
3D 2 060km2
PGS Ramform Challenge
2D 2,948km 3D 2,060km
Site Survey
Abadi-1 Abadi
AbDrilling
Ab
Rig Energy Searcher
g
57
Rig Energy Searcher
ect Historyect History
25% Partial Relinquishment
Area Enlargement (362km2)
25% Partial Relinquishment
er
Site Survey
-2
b di 3
Abadi-4
Ab di 5badi-3 Abadi-5
Abadi-7
Abadi-6
Rig Ocean GeneralRig Ocean General

Current Status of otheCurrent Status of othe
EX G G d ( GFLEX LNG: LNG Producer (LNG– Awarded Samsung a contract to bu– Complete FEED of Generic Design o p e e EE o e e i e ig– Reviewing the projects in Nigeria, P
Shell: Generic LNG FPSO (3 5 MTShell: Generic LNG‐FPSO (3.5 MT– Reviewing to apply FLNG in Prelud
SBM: SBM’s FLNG (2.5 MTPA)– Complete FEED of Generic LNG‐FP
Höegh LNG: Höegh LNG FPSO – FEED (May, 2008 – March, 2009), re
58
er Companies’ FLNGer Companies FLNG
G ) (1 1 A)GP) (1.7 ‐ 1.95 MTPA)ild 4 HullsLNGP in the Q1 of 2009i e Q oPNG, Trinidad and Tobago, Brazil etc.
TPA)TPA)de Gas Field and Greater Sunrise Gas Fields
PSO in the 2H of 2008
(1.6 MTPA)eviewing applicable gas field