inoculation experiments with loose smuts of wheat …
TRANSCRIPT

INOCULATION EXPERIMENTS WITH LOOSE SMUTS OF WHEAT AND BARLEY (USTILAGO TRITICI AND
U. NUDA)
A . J . P . OOBT
PRINTED IN U. S. A.
[ßcprinted from PHYTOPATHOLOGY, August, 1939, Vol. XXIX, No. 8, pp. 717-728.]

[Reprinted from PHYTOPATHOLOGY, August, 1939, Vol. XXIX , No. 8, pp. 717-728.] PRINTED IN U. S. A.
INOCULATION EXPERIMENTS WITH LOOSE SMUTS OP WHEAT AND BARLEY (USTILAGO TRITICI AND
U. NUDA)1
A , J . P . O O K T
(Accepted for publication March 5, 1939)
INTRODUCTION
Whereas, for many plant diseases suitable inoculation methods have been established, there are still some for which these methods are not in all respects satisfactory. Thus, for the inoculation of wheat and barley with loose smut, Ustilago tritici (Pers.) Rostrup and Vstilago nuda (Jens.) K. and S., a number of methods have been described each of which has its advantages and disadvantages, but it cannot be said that the standard method has yet been found.
In the Institut für Pflanzenzüchtung, Halle (Germany), which for many years has been working on the problem of loose smut, use is very often made of the "EinzelMiitenspritze" (indicated below as the Halle method), with which each individual flower is inoculated with dry spores (Roemer, Fuchs, and Isenbeck, (3) ). The drawback with this as well as other methods is that the setting and viability of the smut-infected seed and the winter-hardiness of the plants grown from such seed may suffer to such extent as to result in losses amounting to 20-50 per cent ; in case of winter barley, according to Thren (4), even more. Pech's method (2), likewise of German origin, in which the entire head is treated in vacuo with dry spores, seems little used.
In 1936, Moore (1) described an apparatus enabling one to inoculate with a spore suspension entire heads in vacuo. The results thus obtained are very good. No data, however, are given concerning the most favorable period for inoculation, or the optimum concentration of spores and the requisite number of pump strokes.
It, therefore, seemed desirable to investigate more closely the different factors influencing the degree of success of inoculation according to Moore's method. Owing to lack of time and help no comparison could be made between Moore's and the Halle methods. The aim of the investigation here reported is not to establish the superiority of the one method to the other, but only to show that Moore's method with some slight modifications yields very good results and enables us without special training to perform a larger number of inoculations per hour than is possible with the Halle method with well-trained help.
METHODS AND MATERIALS
The apparatus used for the inoculations (Fig. 1) has been adequately described by Moore (1), so that here a short repetition will suffice in which
i Mededeeling 86, Laboratorium voor Mycologie en Aardappelonderzoek, Wageningen, The Netherlands.
717

718 PHYTOPATHOLOGY [VOL. 29
especially some modifications will be brought forward. The apparatus comprises a supporting rod (A), a flask for the spore suspension (B), an inoculating chamber (C) and a hand-operated vacuum pump (D). The lower portion of the rod is made of iron, to which an iron step is attached to push the rod into the ground. The clamp used by Moore to support the inoculum flask was substituted by a wire-net basket in order to prevent the breaking of the flask. The upper portion of the rod is made of wood and equipped with brass hooks on which by means of a spring the inoculating
F I G . 1. Moore's apparatus as modified by the author. For explanation, see text.
chamber may be suspended at each desired height. The inoculating chamber consists of a large glass tube with a narrow neck. The tube may be closed tightly with a rubber stopper. Through a hole in the stopper the tube is connected by means of a rubber tube with the inoculum flask. Through a slit in this stopper the heads that are to be inoculated can be inserted in the inoculating chamber. At the top the chamber is connected with the pump by means of a vacuum-rubber tube. In this rubber tube a T-tube with a stopcock is inserted in order to admit the air after the in-

1939] OORT : INOCULATION EXPERIMENTS WITH "WHEAT AND BARLEY 719
oculation. Inasmuch as the ruhher tuhe, owing to its weight, would cause the inoculating chamber to hang in an oblique position, it is laid across one of the hooks of the rod. A large bicycle pump with an inverted leather plunger makes a satisfactory vacuum pump. Contrary to Moore's method, no vent holes were bored in the upper part of the pump, so that the vacuum virtually remains after each stroke.
The inoculation is performed as follows. The flask (contents $ 1.) is filled with an opaque brownish-black suspension of spores. For 300-400 cc. of liquid six smutted heads suffice. The concentration is then so high that it equals the concentration 1 (see below) or even surpasses it. Through the slit of the rubber stopper a number of haulms are inserted just below the head. A mixture of wax and vaseline is added to render the stopper airtight.2 The heads are now covered by the tube (C), which, with the aid of the spring and the vacuum-rubber tube, is suspended at the desired height. The spore suspension is now carefully drawn up into the inoculating chamber until it has risen above the heads and consequently fills most of the tube. Then the connection between the flask and the inoculating chamber is broken by pinching the connecting tube with the fingers (in practice more convenient than with a Mohr pinchcock). A number of strokes is made with the pump so as to replace the air between the glumes with the spore suspension. The outer air is then admitted through the stopcock and the connection between glass tube and flask is restored, so that the liquid flows back into the flask. The heads are then taken out of the glass tube, the remainder of the wax-mixture is removed from the haulms.
After some experiments it was easily possible to inoculate 4 heads at a time. In general, it is rather easy to find 4 haulms equal in length and development. Thus, a considerable increase is obtained in the number of inoculated heads per hour. In 1938, the second year of our experiments, two persons could thus easily inoculate 80 heads of wheat per hour. With barley, owing to the weakness of the haulms, especially with 2-rowed spring barley, no more than about 50 heads per hour could be selected, inoculated, and marked. In contrast to Moore's method with barley, the sheath of the upper leaf was carefully unfolded and turned down. In most cases the treatment was then successful without breaking the haulms. In the case of barley, the heads were inoculated as soon as they had fully emerged from the boot. The inoculation period for wheat, however, was from the commencement to the middle of anthesis. The number of pump strokes was 10 for wheat and 20 for barley. The velocity of pumping is of no importance, because the wax-vaseline mixture prevents almost all leakage along the stem.
The experiments were planned with the intention to establish: (a) The optimum period for inoculation; (b) the optimum concentration of spores; (c) the optimum number of pump strokes. They were performed with Usti-lago tritici on wheat and Ustilago nuda on barley. The loose smut came
2 The mixture used consists of 50 per cent of wax and 50 per cent of vaseline. In hot weather the percentage of wax may be a little higher.

720 PHYTOPATHOLOGY [VOL. 29
from our own experimental fields from Vilmorin 27 winter wheat and Vindi-cat winter barley, respectively. For each treatment about 12 heads were inoculated. The seed of these was sown, head by head, 2\ cm. apart in the row. Although the harvesting, threshing, and sowing of each head separately takes more time, it is of great advantage that a check on the inoculation and on the possible errors made, remains possible. Such errors may occur, even when the experiments are carried out most accurately. With barley, among the 132 inoculated heads of 11 treatments, no irregularity occurred; with wheat, however, 5 among the 177 inoculated heads of 15 treatments showed some deviation. Of these 5 heads there were 4 that in subsequent culture (116 plants) showed no loose smut at all, 1 that in subsequent culture of 38 plants showed but 1 smutted plant, while the other heads of the same treatments had a high percentage of loose smut. Evidently either wrong heads were marked or wrong heads were harvested.8
If the heads of one treatment had not been harvested and sown separately, but together, such errors would not have come to light and the percentage of loose smut would have been considerably lower than when such mistakes are eliminated. For the treatments in which the errors occurred, the percentage of loose smut would have been 78.6, 58.4 and 77.3, had the errors not been considered. After elimination of the deviating heads these percentages were 86.0, 73.4, and 80.9, respectively, (cf. Table 2, notes a, b, and c) .
The sowing took place at the end of October in a greenhouse with loose frames in good, damp garden soil heavily manured with stable manure. The seed emergence was excellent. In the beginning of December the glass was removed and, because of a relatively warm winter, it was not necessary to put the glass on again. The crop tillered strongly and began to lodge in spots before heading. The plants that lodged early headed only in pa r t ; so that later on it was not possible to examine and determine whether all plants were attacked by loose smut. A number of plants, therefore, had to be ruled out, which, however, owing to the large number of remaining plants, did not affect the results very much.
The controls could not be sown under the same conditions, but had to be sown in the field, together with the seed of an experiment with different varieties.
Before sowing, the seeds were counted. After emergence, and in June, the plants were counted to determine the loss of plants at emergence and during winter.
The percentages of loose smut were calculated for subsequent culture of each head separately and for the plants of the 12 heads of each treatment together. The percentages as shown by the subsequent cultures of the separate heads have been omitted here for lack of space. They are, however, indicated by dots in figures 2 and 4. Thus, some idea may be gained in
s The occurrence of loose smut in subsequent culture of a non-inoculated wheat head can be explained from the presence of wheat with loose smut in the neighborhood of the experimental plot. Also, in the control, some loose smut occurred.

1939] OORT : INOCULATION EXPERIMENTS WITH "WHEAT AND BARLEY 721
regard to the difference in attack of the individual heads of each treatment. But it should be borne in mind that the number of plants deriving from one head varies strongly, so that one dot has more value than the other. This marked variation in number of plants deriving from one head is not a result of the number of grains harvested, but of the fact that, owing to early-lodging of several plants, their infection could not be established.
In the percentages of loose smut calculated according to the total number of plants of each treatment (mostly deriving from 12 heads), the mean error also is given.
ENTIRELY OR PARTLY DISEASED PLANTS
In June, for the subsequent culture of each head of each treatment, the number of diseased and healthy plants was separately noted. Most plants were either entirely healthy or entirely diseased. A part, however, showed either a number of diseased and healthy heads in the same plant or one or a few partly diseased heads in the same plant. These plants were called partly diseased. A distinction was made between plants that showed as many diseased heads as healthy ones or more diseased ones (degree of attack B) and plants that showed more healthy than diseased heads (degree of attack C). To the entirely diseased plants (degree of attack A) were counted also those that among wholly smutted heads showed at most one head that was less than half smut-free. As healthy plants only those were counted that showed no trace of smut.
If, in the determination of the degree of attack there were partly smutted heads these were counted as half-diseased, half-healthy heads.
The various degrees of attack may be indicated as follows :
A. Entirely diseased. All heads diseased or at most one head less than half healthy.
B. Partly diseased. Half of the number of heads or more, diseased (one partly diseased head = a half-diseased, half-healthy head).
C. Partly diseased Less than half of the number of heads diseased. D. Healthy. Entirely healthy.
In the barley experiments no distinction has been made between the degrees B and C, because nearly all the plants belonged to degree B. Most of these partly diseased plants showed some partly healthy heads, while the number of plants with one or more healthy heads, together with some entirely diseased heads, was comparatively small.
For wheat it was just the reverse. Here, in most plants of degrees B and C, smutted and smut-free heads occurred in one and the same plant, while partly diseased heads were much rarer. For wheat, a distinction was made between the degrees B and C.
Of the 2733 diseased plants of wheat (15 treatments) 2633, or 96.3 per cent, were entirely diseased, 94, or 3.7 per cent, showed the degree of attack B and 6, or 0.2 per cent, the degree C.

722 PHYTOPATHOLOGY [VOL. 29
For barley these numbers are : 2290 diseased plants (11 treatments). Attack A : 2203, or 96.2 per cent ; attack B and C : 87, or 3.8 per cent. Attack C was recorded as less than 0.2 per cent. In calculating the percentage of loose smut the "wholly and partly
smutted plants were counted together. Since the percentage of partly diseased plants probably is not affected by the period of inoculation or the concentration of the spore suspension, the data for each separate treatment are omitted.
LOSS OP PLANTS AT EMERGENCE AND DURING WINTER
Before discussing the experiments proper, something must be said here about plant mortality at emergence and during winter. According to Thren (4) losses of 20 to 50 per cent or more are mentioned in the literature. In contrast with this only a very small loss was found under the above conditions. A comparison with plants sown in the field under normal conditions could not be made, because the plants in the field—inoculated ones of an experiment with different varieties, as well as controls of the experiments described in this paper—suffered greatly from wire-worm damage. It could not, therefore, be established whether the slight loss of plants should be ascribed to the specially favorable greenhouse conditions or to the method of inoculation.
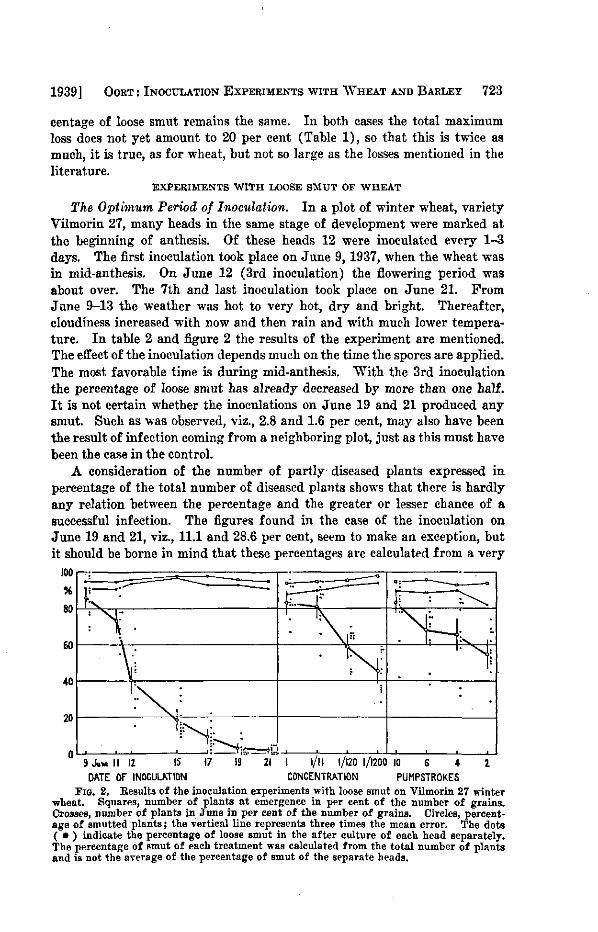
In figure 2, which refers to the experiments with wheat, the number of plants at emergence and the plants in mid-June, are indicated for each treatment separately. The figure shows that neither the concentration nor the period of inoculation has any effect on the number of surviving plants. From table 1 it appears that the loss averages only 9.1 per cent.
TABLE 1.—Comparison of the number of sown grains, emerged plants, and the number of plants in June of wheat and barley inoculated with loose smut
Variety
Wheat, Vilmorin 27
Barley, Vogels Agaer
Barley, Vindicat 14
Number of treatments
15
7
4
Number of heads harvested
177
84
48
Number of grains sown end of Oct.,
1937
7533
4846
2585
Number of plants emerged in % o f the num
ber of seeds
95.8
91-98
89-98
Number of plants mid-June
in % of the number of
seeds
90.9
83-96
82-92
For barley things are slightly different (Fig. 4). In the experiment on the period of inoculation it appears that a high percentage of loose smut is correlated with a slightly larger loss of plants. Further, it is obvious that a higher concentration causes a larger loss than a lower one, whereas the per-
1939] O O R T : INOCULATION EXPERIMENTS W I T H W H E A T AND BARLEY 723
centage of loose smut remains the same. In both cases the total maximum loss does not yet amount to 20 per cent (Table 1), so that this is twice as much, it is true, as for wheat, but not so large as the losses mentioned in the literature.
EXPERIMENTS WITH LOOSE SMUT OP WHEAT
The Optimum Period of Inoculation. In a plot of winter wheat, variety Vilmorin 27, many heads in the same stage of development were marked at the beginning of anthesis. Of these heads 12 were inoculated every 1-3 days. The first inoculation took place on June 9, 1937, when the wheat was in mid-anthesis. On June 12 (3rd inoculation) the flowering period was about over. The 7th and last inoculation took place on June 21. From Jane 9-13 the weather was hot to very hot, dry and bright. Thereafter, cloudiness increased with now and then rain and with much lower temperature. In table 2 and figure 2 the results of the experiment are mentioned. The effect of the inoculation depends much on the time the spores are applied. The most favorable time is during mid-anthesis. With the 3rd inoculation the percentage of loose smut has already decreased by more than one half. I t is not certain whether the inoculations on June 19 and 21 produced any smut. Such as was observed, viz., 2.8 and 1.6 per cent, may also have been the result of infection coming from a neighboring plot, just as this must have been the case in the control.
A consideration of the number of partly diseased plants expressed in percentage of the total number of diseased plants shows that there is hardly any relation between the percentage and the greater or lesser chance of a successful infection. The figures found in the case of the inoculation on June 19 and 21, viz., 11.1 and 28.6 per cent, seem to make an exception, but it should be borne in mind that these percentages are calculated from a very
1001—:-
9 Ju« Il IZ IS DATE OF INOCULATION
21 I l/ll 1/120 1/1200 10 6 *
CONCENTRATION PUMPSTR0KES Fia. 2. Results of the inoculation experiments with loose smut on Vilmorin 27 winter
wheat. Squares, number of plants at emergence in per cent of the number of grains. Crosses, number of plants in June in per cent of the number of grains. Circles, percentage of smutted plants ; the vertical line represents three times the mean error. The dots ( • ) indicate the percentage of loose smut in the after culture of each head separately. The percentage of smut of each treatment was calculated from the total number of plants and is not the average of the percentage of smut of the separate heads.

724 PHYTOPATHOLOGY [VOL. 29
small number of diseased plants, viz., 9 and 7, respectively. The obvious surmise that with a late inoculation the number of partly diseased plants increases is, therefore, not confirmed.
The Concentration of the Spore Suspension. The highest concentration used in my experiments was 1 g. spores per 1. of water, a quantity about equal to or slightly less than that taken for the ordinary inoculations. . The suspension was dark brownish-black and completely opaque. This concentration was called 1, and from it the dilution 1/11 was made with the aid of a pipette after shaking well. From this dilution a further dilution of 1/120 was obtained in the same way, and from this again a dilution of 1/1200. In view of the instability of the suspension (the spores fairly soon sank to the bottom) the concentrations were as far as possible checked with the counting chamber according to Thoma. As appears from table 3, the agreement is
TABLE 2.—Results of inoculation experiments with loose smut of wheat. Vilmorin 27
Variety
Treatment
Date of inoculation 9 June '37
11 " " 12 " " 15 " " 17 " " 19 " " 21 " "
Concentration of spores 1
1/11 1/120 1/1200
Number of pumpstrokes 10 6 4 2
Control, 6 rows of 3 m.,
Total number of plants
357» . 391b 415 367 444 324 429
303 346« 441 484
343 273 270 341
one smutted plant.
Number of diseased plants
307 287 167 67 40
9 7
252 280 260 220
286 186 177 188
Percentage smutted plants
86.0 +1.8 73.4 + 2.2 40.2 + 2.4 18.3 + 2.0 9.0 +1.4 2.8 + 0.9 1.6 + 0.6
83.2 + 2.2 80.9 + 2.1 58.9 + 2.3 45.4 ±2.3
83.4 + 2.0 68.1 + 2.8 65.6 + 2.9 55.1 + 2.7
» 36 plants, deriving from one head, showed for some uncheckable reason no smut at all and were therefore eliminated.
•»In 102 plants, deriving from 3 heads, there was only one smutted plant. Plants eliminated.
« 16 plants, deriving from one head, showed no smut and were therefore eliminated.
reasonably good. Figure 3 shows the different suspensions made later on, viz., the concentrations 1, 1/10, 1/100 and 1/1000. The inoculations were performed on June 10 in the same plot of wheat as mentioned above. The results of the experiment with the different concentrations (Table 2 and Fig. 2) show that a concentration of 1/11 still gives about a maximum effect. In lower concentrations the effect decreases. Yet, with a concentration of 1/1200 (i.e. about 10 spores per cu. mm.) the percentage of loose smut still amounts to 45.
The Number of Pump Strokes. "Whereas normally 10 pump strokes were

1939] O O R T : I N O C U L A T I O N E X P E R I M E N T S W I T H W H E A T A N D B A R L E Y 725
FIG. 3. Spore suspension of TJstilago tritici in water. From left to right the concentrations 1, 1/10, 1/100 and 1/1000. The concentration 1 contains 1 gr. spores per liter water.
given, with this experiment the number varied from 2 to 10. The date of inoculation was June 10, same plot as above. Table 2 and figure 2 give the results. With 2 pump strokes the number of smutted plants is already as high as 55 per cent, with increase of the number of pump strokes to 10 the number of smutted plants increases to 83 per cent. It is not certain whether with this number the optimum is already reached. Moore (1) indicates that 4-6 strokes are sufficient, but he was working under different conditions. In his experiment the normal pressure after each pump stroke was restored, which was not so in our case. I t is not impossible that, owing to the great changes of pressure, Moore reached the optimum effect sooner.
EXPERIMENTS WITH LOOSE SMUT OP BARLEY
The Optimum Period of Inoculation. This experiment was planned in the same way as for wheat. The first inoculation took place in a plot of Vogels Agaer winter barley on May 27, whilst the immature heads were still partly hidden in the boot. With the second inoculation (May 29), 10 of the 12 heads were completely free. The flowering was not recorded, but probably by May 31 it was largely over. Up to May 31 the weather was warm, dry, and sunny. On May 31 it was still warm but cloudy. An hour after inoculation there was a fairly heavy shower of rain. From June 1-4 the weather was dry and cool, followed by alternate hot to very hot temperature with occasional showers of rain, not, however, immediately after the inoculation.
In table 4 and figure 4 the results are summarized. It will be noticed that the moment of inoculation is of great importance. In 2 days the percentage of loose smut decreased from its maximum (84 per cent) down to 18

726 PHYTOPATHOLOGY [VOL. 29
TABLE 3.—The concentration of the spore suspensions calculated from countings with the counting chamber of Thoma. Loose smut of wheat and loose smut of barley
Concentration
according to the
dilution
Colour of the suspension
Number of samples X counted
volume in cu. mm.
Number of spores
counted per cu. mm.
Ratio calculated from
column 5
Wheat
1 1/11 1/120.... 1/1200.
Opaque brownish-black Greyish-brown
Fairly t ransparent Completely t ransparent
5 x 0.005 5 x 0.05
11 x 0.1
478 404 137
19120 1616
125
1 1/11.8 1/153
1 1/10 1/100 1/1000 . .. _
Opaque brownish-black Greyish-brown
Fairly t ransparent Completely t ransparent
Barley
2 x 0.02 13x0 .1 10x0 .1
682 1665
96
17050 1280
96
1 1/13.3 1/178
per cent. For barley, therefore, even more than for wheat, the inoculum should have been applied at the right moment. The few smutted plants after the inoculation of May 31 was, however, partly attributable to the weather, as pointed out above.
27 M», 29 31 2 Ju«
DATE OF INOCULATION
I 1/10 1/100 1/1000
CONCENTRATION Fio. 4. Results of the inoculation experiments with loose smut on winter barley.
Squares, number of plants a t emergence in per cent of the number of grains. Crosses, number of plants in June in per cent of the number of grains. Circles, percentage of smutted p lants ; the vertical line represents three times the mean error. The dots ( • ) indicate the percentage of loose smut in the afterculture of each head separately. The percentage of smut of each treatment was calculated from the total number of plants and is not the average of the percentage of smut of the separate heads.
The Concentration of the Spore Suspension. I n the case of loose smut of barley, too, the highest concentration used was 1 g. spores per 1. of water. The dilutions made were likewise checked by counting the spores (Table 3) .

1939 ] O O R T : I N O C U L A T I O N E X P E R I M E N T S W I T H " W H E A T A N D B A R L E Y 727
TABLE 4.—Results of inoculation experiments with loose smut of barley
Treatment
Date of inoculation „ 27 May 1937 § 29 " "
£>j» 31 " " •C „ 2 June 1937 £ • 3 5 " " ^ g 9 " "
> 11 " "
Concentration 3 of spores
$ • $ 1
•C.2 1/10 j * "§ l / i o o • ^ 1/1000
Total number of plants
476 562 523 538 556
not counted not counted
427 529 680 553
Number of diseased plants
348 471
95 114 52 0 0
295 364 364 187
Percentage smutted plants
73.1 + 2.0 83.8 + 1.6 18.1 +1.7 21.2 +1.8 9.4 +1.2
0 0
69.1 + 2.2 68.8 + 2.0 53.5 + 1.9 33.8 + 2.0
Control Vogels Agaer, 8 rows of 3 m., and Vindicat 14, 6 rows of 3 m,; no smut.
For this experiment a plot of winter barley, variety Vindicat 14, was inoculated on May 28. The results deviate slightly from those obtained for loose smut of wheat. With concentration 1/10 the effect is still optimum, but it decreases gradually with decreasing concentrations. I t may further be pointed out that with concentration 1 the loss of plants during winter is larger than with concentration 1/10, so that for barley, and especially for winter barley, it is of importance not to inoculate with too high a concentration. This is in agreement with the investigations of Thren (4), in which, however, the differences between the application of different concentrations were found to be much larger.
SUMMARY
For the inoculation of wheat and barley with loose smut, Moore's method, with some modifications, was applied. A considerable improvement was obtained by putting into the inoculating chamber 4 heads instead of one. When 2 persons are working together the speed can thus be increased up to 80 heads per hour for wheat and 50 for barley, including selecting and marking of heads. In this respect Moore's method surpasses the Halle method. The apparatus and experimentation are adequately described.
In contrast to the experiences of others, under our experimental conditions the loss of plants at emergence and during winter was only slight. For wheat the loss at emergence and during winter amounted to an average of 10 per cent, regardless of the period of inoculation and of concentration of spore suspension. In barley there was some relation between the loss of plants and the period of inoculation or the concentration used. However, the total maximum loss did not yet amount to 20 per cent.
In all experiments partly diseased plants, degrees B and C, were observed. For wheat the number was 3.9 per cent, for barley 3.8 per cent. Of these partly diseased plants only a small part was less than half diseased

728 PHYTOPATHOLOGY [VOL. 29
(for wheat 0.2 per cent of degree C to 3.7 per cent of degree B ; for barley the percentage of degree C was even smaller). The way in which plants were partly diseased was different for wheat and barley. In Vilmorin 27 winter wheat in most cases healthy and entirely diseased heads occurred in the same plant, in winter barley partly diseased heads were more prevalent. There probably is no relation between the occurrence of partly diseased plants and the period of inoculation or the concentration of the spore suspension.
The optimum period for inoculation lasts only a few days and during anthesis. The spore inoculum has a maximum effect both for wheat and for barley in a concentration of 1 g. and 0.1 g. spores per 1. of water, respectively. "With concentrations of about 0.001 g. spores per 1. water, or about 10 spores per c.mm., a fairly good infection still takes place.
"With an increasing number of pump strokes from 2 to 10, the number of smutted plants increases (experiments only with wheat). "Whether the maximum is already reached with 10 pump strokes is not certain, but for practical reasons a greater number is not recommended.
L A B O R A T O R I U M V O O R M Y C O L O G I E E N A A R D A P P E L O N D E R Z O E K ,
" W A G E N I N G E N , T H E N E T H E R L A N D S .
LITERATURE CITED
1. MOORE, M. B . A method for inoculating wheat and barley with loose Bmuts. Phytopath. 26: 397-400. 1936.
2. P E C H , W. Schulungsbriefe des Eeichsverbandes der Dtsch. Pflanzenzuchtbetriebe no. 8 and 9/10, 1935.
3. EOEMER, T., W. H. F U C H S and K. ISENBECK. Die Züchtung resistenter Eassen der Kulturpflanzen. Kühn Archiv 45 : 1-427. 1938.
4. T H E E N , E . Kritische Versuche zur Eesistenzprüfung der Gerste gegen Flugbrand (Ustilago nuda (Jens.) Kellerm. et Sw.) . Kühn Archiv 44: 211-231. 1938.