innovative work practices and labour turnover in canada
TRANSCRIPT

Statistique CanadaStatistics Canada
Catalogue no. 71-584-MIE
The Evolving Workplace Series
Innovative work practices andlabour turnover in Canada
Développement desressources humaines Canada
Human ResourcesDevelopment Canada

How to obtain more information
Specific inquiries about this product should be directed to René Morissette,Business and Labour Market Analysis Division, (telephone: (613) 951-3608, e-mail: [email protected]. Inquiries about related statisticsor services should be directed to:Labour Statistics Division, Client ServicesUnit, Statistics Canada, Ottawa, Ontario, K1A 0T6, (telephone: (613) 951-4090, toll free:1-866-873-8788, fax: (613) 951-2869), or internet [email protected].
For information on the wide range of data available from Statistics Canada,you can contact us by calling one of our toll-free numbers. You can alsocontact us by e-mail or by visiting our Web site.
National inquiries line 1 800 263-1136National telecommunications device for the
hearing impaired 1 800 363-7629Depository Services Program inquiries 1 800 700-1033Fax line for Depository Services Program 1 800 889-9734E-mail inquiries [email protected] site www.statcan.ca
Ordering and subscription information
This product is available in electronic format on the Statistics CanadaInternet site, for free, as Catalogue no. 71-584-MIE, no. 7. To obtain singleissues, visit our Web site at www.statcan.ca, and select Products andServices.
Standards of service to the public
Statistics Canada is committed to serving its clients in a prompt, reliableand courteous manner and in the official language of their choice. To thisend, the Agency has developed standards of service which its employeesobserve in serving its clients. To obtain a copy of these service standards,please contact Statistics Canada toll free at 1 800 263-1136.
Innovative work practices and labourturnover in CanadaRené Morissette and Julio Miguel Rosa
Statistics Canada
Published by authority of the Minister responsible for Statistics Canada
© Minister of Industry, 2003
All rights reserved. No part of this publication may be reproduced, stored in aretrieval system or transmitted in any form or by any means, electronic, mechanical,photocopying, recording or otherwise, without prior written permission fromLicence Services, Marketing Division, Statistics Canada, Ottawa, Ontario, Canada,K1A 0T6.
August 2003
No. 71-584-MIE No. 7Frequency: Occasional
ISSN 1499-0326ISBN 0-662-34136-8
Ottawa
Note of appreciation
Canada owes the success of its statistical system to a long-standing partnershipbetween Statistics Canada, the citizens of Canada, its businesses, governmentsand other institutions. Accurate and timely statistical information could not beproduced without their continued cooperation and goodwill.
Statistics CanadaHuman Resources Development Canada
The Evolving Workplace Series

2
The Evolving Workplace Series
Innovative Work Practices
Table of Contents
Foreword ............................................................................................... 3
I. Introduction .................................................................................. 6
II. Overview of Prior Research......................................................... 8
III. Hypotheses................................................................................... 11
IV. Data and Concepts ...................................................................... 14
V. Analysis of Quit Rates ................................................................ 20
V.1 Descriptive Statistics ......................................................... 20
V.2 Regression Analysis........................................................... 21
V.2.1 Work Practices Considered Individually ........................... 22
V.2.2 Joint Implementation of Work Practices ........................... 24
V.2.3 Discussion.......................................................................... 28
VI. Summary and Conclusions ........................................................ 30
References ........................................................................................... 39

3
The Evolving Workplace Series
Innovative Work Practices
Foreword
This document provides data from the new Workplace and Employee
Survey (WES) conducted by Statistics Canada with the support of
Human Resources Development Canada. The survey consists of two
components: (1) a workplace survey on the adoption of technologies,
organizational change, training and other human resource practices,
business strategies, and labour turnover in workplaces; and (2) a survey
of employees within these same workplaces covering wages, hours of
work, job type, human capital, use of technologies and training. The result
is a rich new source of linked information on workplaces and their
employees.
Why have a linked workplace and employee survey?
Advanced economies are constantly evolving. There is a general sense
that the pace of change has accelerated in recent years, and that we are
moving in new directions. This evolution is captured in phrases such as
“the knowledge-based economy” or “the learning organization”. Central
to these notions is the role of technology, particularly information
technology. The implementation of these technologies is thought to have
substantial impact on both firms and their workers. Likely related to these
technological and environmental changes, many firms have undertaken
significant organizational changes and have implemented new human
resource practices. Globalization and increasing international competition
also contribute to the sense of change.
4
The Evolving Workplace Series
Innovative Work Practices
In this environment, greater attention is being paid to the management
and development of human resources within firms. Education and training
are increasingly seen as an important investment for improved prosperity—
both for firms and individual workers.
Thanks to earlier surveys, researchers have a good understanding of
workers’ outcomes regarding wages and wage inequality, job stability and
layoffs, training, job creation, and unemployment. What is missing on the
employees’ side is the ability to link these changes to events taking place
in firms. Such a connection is necessary if we hope to understand the
association between labour market changes and pressures stemming from
global competition, technological change, and the drive to improve human
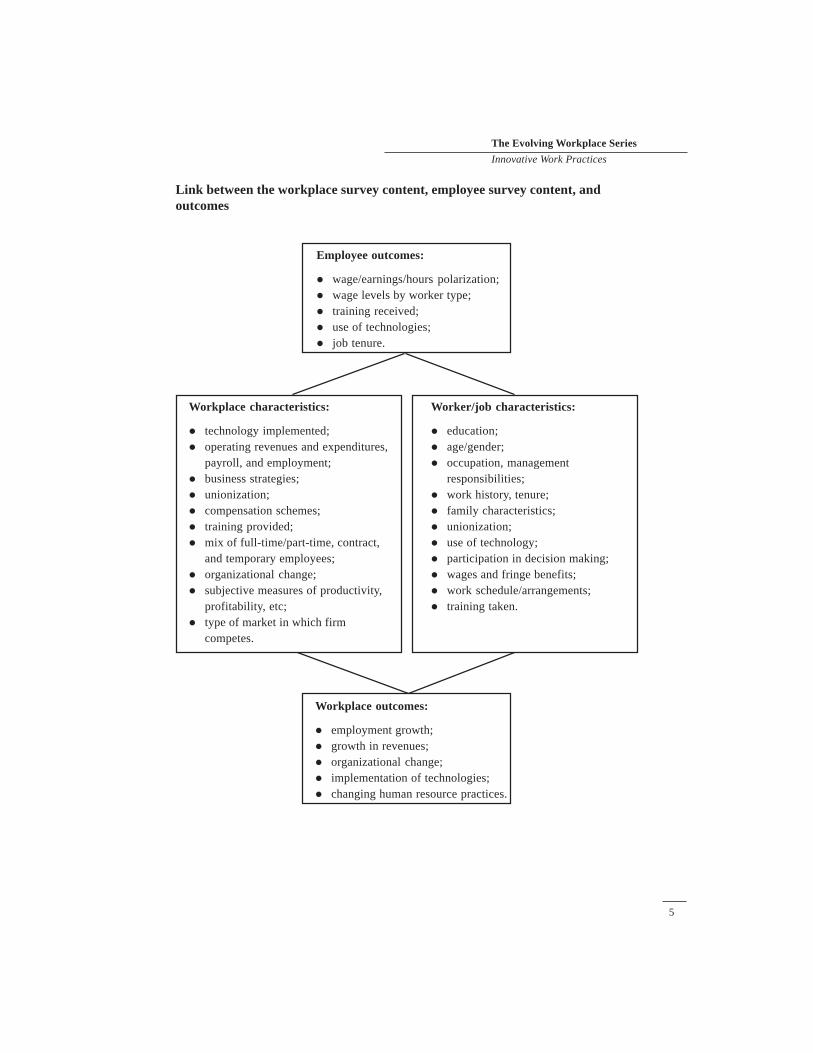
capital. Thus, one primary goal of WES is to establish a link between
events occurring in workplaces and the outcomes for workers. The
advantage of a linked survey is depicted in the figure which displays the
main content blocks in the two surveys.
The second goal of the survey is to develop a better understanding of
what is indeed occurring in companies in an era of substantial change.
Just how many companies have implemented new information
technologies? On what scale? What kind of training is associated with
these events? What type of organizational change is occurring in firms?
These are the kinds of issues addressed in the WES.
This report aims to give those interested in the determinants of
employer-sponsored training some useful insights from the initial survey,
as well as stimulating their interest in the possibilities provided by these
new data.
Those interested in the methodology should go to our website at
http://www.statcan.ca/english/survey/business/workplace/workplace.htm.
5
The Evolving Workplace Series
Innovative Work Practices
Employee outcomes:
� wage/earnings/hours polarization;� wage levels by worker type;� training received;� use of technologies;� job tenure.
Workplace characteristics:
� technology implemented;� operating revenues and expenditures,
payroll, and employment;� business strategies;� unionization;� compensation schemes;� training provided;� mix of full-time/part-time, contract,
and temporary employees;� organizational change;� subjective measures of productivity,
profitability, etc;� type of market in which firm
competes.
Worker/job characteristics:
� education;� age/gender;� occupation, management
responsibilities;� work history, tenure;� family characteristics;� unionization;� use of technology;� participation in decision making;� wages and fringe benefits;� work schedule/arrangements;� training taken.
Workplace outcomes:
� employment growth;� growth in revenues;� organizational change;� implementation of technologies;� changing human resource practices.
Link between the workplace survey content, employee survey content, andoutcomes

6
The Evolving Workplace Series
Innovative Work Practices
I. Introduction1
Over the last decade, a fast-growing literature has attempted to assess
whether alternative work practices (AWPs) improve labour productivity,
increase firms’ profitability and reduce labour turnover. The general
presumption is that there exists a set of “high performance” work practices
which, under certain conditions, will improve employees’ well-being and
lead them to be more productive, thereby causing both an increase in labour
productivity and a reduction in labour turnover.
However, no study has yet examined whether there is a negative
association between AWPs and labour turnover in Canada. The goal of
this study is to fill this gap. To do so, we focus our attention on a subset of
key AWPs.
In our view, teamwork, flexible job design, performance-based pay
systems and formal training aimed at improving workers’ ability to work
in teams are four fundamental components of AWPs. This is so for several
reasons. First, of all alternative work practices, teamwork is the most
studied in prior research (Cappelli and Neumark, 2001a: p.742). Second,
by its very nature, teamwork—at least in its most intensive form such as
self-directed workgroups—is likely to be implemented in conjunction with
flexible job design. Third, it is often argued that new forms of work
organization—such as teamwork—which attempt to elicit greater effort
from workers should be accompanied by alternative compensation schemes
such as profit sharing, gain sharing, merit pay or skill-based pay. Finally,
1 This study is an abridged version of Morissette and Rosa (2003).

7
The Evolving Workplace Series
Innovative Work Practices
because employees who work in teams may need more skills than those in
traditional work environments (Bailey et al., 2001: p.527), formal training
on various aspects such as group decision-making problem-solving,
leadership and communication is likely a crucial element which allows
workers to successfully perform the tasks they are expected to accomplish
in a new work environment.
The literature on AWPs generally considers bundles of work practices,
whose definition varies widely across studies. While there may be synergies
among work practices, such a strategy does not allow researchers to identify
which components, if any, are crucial in reducing quit rates. Furthermore,
individual work practices may have opposite effects on employees’
propensity to quit (Batt et al., 2002). We deal with these issues by
considering both the individual effect of the work practices analyzed as
well as synergies among these practices. Since the literature on AWPs
provides little guidance on which bundles of work practices should be
examined, we follow Cappelli and Neumark’s (2001a) strategy of pre-
specifying combinations of work practices, based on theoretical arguments.
The paper proceeds as follows. We first provide an overview of
previous studies on AWPs and employee turnover (Section II). Next, we
discuss the hypotheses tested in the paper (Section III). We describe the
data and concepts used in Section IV. We investigate whether
establishments which have key AWPs have lower quit rates than others in
Section V. Concluding comments follow.

8
The Evolving Workplace Series
Innovative Work Practices
II. Overview of Prior Research
Previous studies on AWPs and quit rates can be divided into two
groups. A first set of studies examine employee turnover for a relatively
narrow set of industries or establishments (Havlovic, 1991; Wilson and
Peel, 1991; Buch, 1992; Arthur, 1994; Hamilton et al., 2001; Batt et al.,
2002). Using monthly time series data on a manufacturing firm from 1976
to 1986, Havlovic (1991) finds that quality of work life initiatives reduce
absenteeism, minor accidents, grievances and quits. Wilson and Peel (1991)
use pooled cross-sectional time series data on quits and absenteeism for
52 engineering and metal working firms in the UK and find that firms
with profit-sharing schemes and employee participation in decision-making
have lower quit rates and absenteeism rates than others. Buch (1992) reports
a negative association between employee turnover and quality circles for
four organizations.2 Arthur (1994) examines 30 steel minimills and finds
that labour turnover is lower in plants with “commitment human resource
systems” than in other plants. Hamilton et al. (2001) analyze individual-
level job duration data in one garment plant in California and find that
workers’ probability of leaving the plant fell after the introduction of teams.
Batt et al. (2002) study firms in the telecommunications industry and find
that those with employee participation in offline problem-solving teams
and self-directed workgroups have lower quit rates than others.
A second set of studies analyze labour turnover and AWPs for a
broader set of industries (Delaney, 1996; Huselid, 1995; Cappelli and
2 The four organizations studied were: a bank, a manufacturing plant, a hospital and auniversity.

9
The Evolving Workplace Series
Innovative Work Practices
Neumark, 2001b; Azfar and Danninger, 2001). Delaney (1996) studies
495 large companies and finds that the number of AWPs implemented by
a firm is negatively associated with its quit rate. Huselid (1995) uses a
national sample of 855 firms with more than 100 employees and reports
that those with a cluster of AWPs have lower employee turnover than
others. Using the U.S. National Employers Survey, Cappelli and Neumark
(2001b) examine quit rates among establishments with 20 or more
employees and find that in manufacturing, establishments with self-directed
workgroups, job rotation and profit-sharing have lower quit rates than
others. Azfar and Danninger (2001) use the National Longitudinal Survey
of Youth and find some evidence that in non-unionized jobs, young men
participating in profit-sharing plans are less likely to quit than others.
Taken together, these findings appear to be consistent with the notion
that AWPs tend to reduce quit rates. Yet, the available evidence is subject
to several caveats. First, the results are not necessarily robust across
industries. For instance, Cappelli and Neumark (2001b) find that the
negative association between quit rates, on the one hand, and self-directed
workgroups, job rotation and profit-sharing, on the other, does not hold
outside the manufacturing sector. Second, the majority of the
aforementioned studies use cross-sectional data on establishments and,
consequently, are unable to control for unobserved establishment-specific
fixed effects—such as management quality—which may influence quit
rates substantially. The only exceptions are Havlovic (1991), Buch (1992)
and Hamilton et al. (2001), which do so implicitly by examining
longitudinal data on quits in a single establishment.3 Third, some of the
aforementioned studies (Arthur, 1994; Huselid, 1995) include both quits
3 Buch (1992) uses longitudinal data on turnover for one manufacturing plant. Shefinds that turnover fell in that plant following the implementation of quality circles.

10
The Evolving Workplace Series
Innovative Work Practices
and layoffs in their measure of employee turnover. If AWPs and layoffs
are jointly determined by changes in product markets or technology—
rather than AWPs determining layoffs—then the coefficient for AWPs in
an employee turnover equation no longer has a causal interpretation.
Fourth, in all studies using cross-sectional data on establishments, no
attention is paid to the possible endogeneity of AWPs with respect to quit
rates and little attention is paid to the endogeneity of wages.4
4 For a detailed discussion of the methodological issues which arise when analyzingAWPs and quit rates, see Morissette and Rosa (2003).
11
The Evolving Workplace Series
Innovative Work Practices
III. Hypotheses
One of the central arguments of the literature on AWPs is that while
these work practices, taken individually, may not substantially affect firms’
outcomes, combining them in bundles will likely yield substantial gains
in terms of greater productivity or reduced labour turnover. Since this
literature provides little guidance on which practices should be combined
together, we follow Cappelli and Neumark’s (2001a) strategy of pre-
specifying combinations of work practices, based on theoretical arguments.
This strategy avoids making inferences based on very peculiar bundles of
work practices and providing findings which may not be robust when
considering alternative combinations.
Our focus on teamwork, flexible job design, performance-based pay
systems and teamwork-related formal training allow us to test three simple
hypotheses when considering synergies. The first hypothesis, H1, is that
teamwork is more likely to succeed in reducing quit rates if combined
with flexible job design, and vice-versa. The reason is that workers may
enjoy more teamwork if they are allowed to rotate to the various tasks that
the teams need to perform and may enjoy more job rotation or other forms
of flexible job design if they have control, through self-management, over
when and where to move.5
Two versions of this hypothesis will be tested. The first version will
consider a bundle which combines self-directed workgroups and flexible
5 This is essentially the argument Cappelli and Neumark (2001a: p.758) apply whenanalyzing the impact of AWPs on firms’ productivity.

12
The Evolving Workplace Series
Innovative Work Practices
job design (bundle 13) while the second version will combine teamwork
broadly defined—i.e. including either self-directed workgroups or
problem-solving teams or both—and flexible job design (bundle 23).
The second hypothesis, H2, is that teamwork will be more effective
in reducing labour turnover if combined with performance-based pay
systems, such as profit sharing or gain sharing. Version H2a of this
hypothesis will be tested by combining profit sharing/gain sharing with
self-directed workgroups (bundle 14) or with teamwork, broadly defined
(bundle 24). Since teamwork may require workers to master a greater set
of skills than traditional work environments, workers may expect a
compensation for having to adapt and learn new skills. If so, merit pay or
skill-based pay can provide the incentives necessary to induce appropriate
behaviour in a new work environment. This suggests that teamwork may
also be more effective in reducing quit rates if combined with these forms
of compensation (version H2b). To account for this possibility, we use
merit pay or skill-based pay in conjunction with self-directed workgroups
(bundle 15) or teamwork (bundle 25).
The third hypothesis, H3, is that teamwork will reduce quit rates
only if firms send their employees a clear signal that they are serious
about it, i.e. only if they provide appropriate training on group decision-
making and problem-solving. To test this hypothesis, we combine
classroom training on teamwork-related issues with self-directed
workgroups (bundle 16) or teamwork broadly defined (bundle 26).
We also consider five additional bundles which combine these three
hypotheses. Specifically, we combine teamwork (broadly defined) and
flexible job design with profit sharing/gain sharing (bundle 234), merit
pay/skill based pay (bundle 235) or formal training on teamwork-related
issues (236). We also combine teamwork, flexible job design, alternative

13
The Evolving Workplace Series
Innovative Work Practices
compensation schemes and teamwork-related formal training (bundles
2346 and 2356). Hence, we consider 13 bundles of work practices.
Our empirical strategy will proceed in two steps. First, we will
examine whether key AWPs, considered individually, are associated with
lower quit rates. Second, we will analyze, for each of the 13 bundles defined
above, whether the joint implementation of work practices yields a negative
association with quit rates.6
6 In addition, Morissette and Rosa (2003) test for synergies by estimating interactionterms for each of the eight bundles combining two work practices.

14
The Evolving Workplace Series
Innovative Work Practices
IV. Data and Concepts
We use data from the Workplace and Employee Survey (WES)
conducted in 1999 and 2000 by Statistics Canada. WES is a linked
employer-employee file. Employers are sampled by physical locations—
the statistical unit that comes the closest to the concept of a workplace in
which employer and employee activities can be linked. Employees are
then sampled from employer-provided lists within each location.
The survey covers all industries except farming, fishing, trapping
and public administration. It examines a broad range of topics such as
human resource practices, labour turnover, technology adoption, innovation
and business strategies, among others. The employer portion of the survey
was administered in the summer and fall of 1999 using a computer-assisted
personal interview (CAPI). The primary respondent was the human
resource manager in a large firm and the business owner in a small firm.7
The survey was conducted though a computer-assisted telephone interview
(CATI) in 2000. The response rate of WES is quite impressive: it equals
96.5% and 95.8% in 1999 and 2000, respectively.
Our analysis of quit rates is based on the following question, asked
in the second interview, which was conducted in 2000:
“Please estimate the number of employees who have permanently
left this location between April 1, 1999 and March 31, 2000, by reason:
7 While it may be argued that human resource managers may not have detailed knowledgeabout AWPs, Gittleman et al. (1998: p.104) find that answers provided by humanresource persons did not systematically differ from those of line managers in the 1993U.S. Survey of Employer Provided Training.
15
The Evolving Workplace Series
Innovative Work Practices
A. Resignations (No special incentives)
B. Lay-offs (No recall expected)*
C. Special workforce reductions**
D. Dismissal for cause
E. Retirement (No special incentives)
To construct our measure of quit rates, we divide the number of
resignations (A) by the average level of employment observed between
April 1999 and March 2000.8
Information about teamwork and flexible job design were obtained
from establishments with more than 10 employees, using the following
question, asked in the first interview, which was conducted in 1999:
“For non-managerial employees, which of the following practices
exist on a formal basis in your workplace:
a) employee suggestion program [includes employee survey feedback].
b) flexible job design [includes job rotation, job enrichment/redesign
(broadened job definitions), job enrichment (increased skills, variety
or autonomy of work)].
* Involuntary lay-offs with enhanced severance packages should be included with“Lay-offs”.
** Special workforce reductions include resignations and early retirements inducedthrough special financial incentives (i.e. where employees voluntarily leave).
8 If an establishment has seasonal peaks in employment, the average level of employmentis constructed by taking a weighted average of maximum employment during thesepeaks and average employment in March 1999 and March 2000. Otherwise, theaverage level of employment is simply the average of employment observed in March1999 and March 2000.

16
The Evolving Workplace Series
Innovative Work Practices
c) Information sharing with employees [for example, with respect to firm’s
performance, colleagues’ wages, technological or organizational
changes, etc. This implies that employees have some feedback on
policies].
d) Problem-solving teams [responsibilities of teams are limited to specific
areas such as quality or work flow (i.e. narrower range of
responsibilities than self-directed work groups)].
e) Joint labour-management committees [include non-legislated joint
labour-management committees and task teams that generally cover a
broad range of issues, yet tend to be consultative in nature].
f) Self-directed work groups [semi-autonomous work groups or mini-
enterprise work groups that have a high level of responsibility for a
wide range of decisions/issues]”.
Several points must be noted with respect to the aforementioned
question. First, it refers to human resource practices which exist on a formal
basis and thus, does not consider informal practices which may have an
impact on working conditions and quit rates. Second, it specifies that
flexible job design includes concepts such as job rotation and job
enrichment. Third, it distinguishes at least two types of teamwork:
1) problem-solving teams, whose responsibilities are limited to specific
issues and, 2) self-directed workgroups (or self-managed teams), the most
intense form of teamwork. Fourth, when a firm reports having a practice,
it also asks about the year of adoption of that practice. However, if a firm
reports not having a work practice, it is not asked whether it implemented
that practice in the past and abandoned it later. Fifth, it contains no
information on the percentage of employees involved in that work practice.9
9 Note that this question was not asked in 2000.

17
The Evolving Workplace Series
Innovative Work Practices
To analyze performance-based pay systems, we construct indicators
of whether establishments had alternative compensation schemes such as
profit sharing, gain sharing, merit pay and skill-based pay for some of
their non-managerial employees in 1999. Contrary to the six work practices
listed in the aforementioned question, WES provides no information on
the year of implementation of these compensation schemes. We analyze
formal training aimed at improving workers’ ability to work in teams by
constructing an indicator of whether establishments paid or provided for
classroom training on group decision-making, problem-solving, team-
building, leadership and communication between April 1998 and March
1999.
As argued above, AWPs may be endogenous with respect to quits.
To minimize concerns regarding the endogeneity of AWPs, we omit from
our analysis establishments which have implemented in 1999 any of the
six practices listed in the aforementioned question. Adding this restriction
to the set of selection criteria defined below drops the number of selected
establishments from 3,285 to 3,142.10
We also distinguish establishments which adopted teamwork and/or
flexible job design in 1996 or earlier from those which did so in 1997-
1998. We introduce this distinction for four reasons. First, if establishments
introduce work practices gradually and increase their use over time, those
which adopted such practices at least two years ago may have a greater
fraction of workers involved in these practices than those which adopted
them more recently. If so, we may have more chances of finding a
significant effect for early adopters than for late adopters. Furthermore,
this strategy may help overcome the lack of information on the percentage
10 The 143 establishments excluded represent 3% of the (weighted) population ofestablishments covered by the selection criteria defined below.

18
The Evolving Workplace Series
Innovative Work Practices
of workers involved in AWPs. Second, if the impact of a given practice on
workers’ well-being takes time to operate—for instance, if workers in
teams need stability to learn to work together—we may also have more
chances of capturing an effect among establishments which adopted that
practice early than among those which adopted it late. Third, as argued
above, the introduction of AWPs may lead to a temporary increase in quit
rates and a decline subsequently, at least for some workplaces. If so,
establishments which implemented in 1997-1998 may have higher quit
rates than others. Lastly, if establishments which adopted practices late
differ from those which adopted them early in terms of management quality
or other unmeasured dimensions influencing quits, quite different patterns
could be found in the two groups.
To alleviate concerns regarding the endogeneity of wages, we use
data on establishments’ annual payroll per employee in period t-1, i.e.
between April 1998 and March 1999. In order to obtain a measure of
payroll which covers 12 months, we exclude from our analysis
establishments which were born after March 1998. Since quit rates depend
on hourly wages, rather than annual pay, we control for the number of
hours worked in an establishment between April 1998 and March 1999 by
conditioning our results on the percentage of employees working part-
time as well as the average number of weekly hours worked by full-time
employees.11
To ensure that the establishments analyzed represent workplaces
which pay meaningful earnings, we further restrict our sample to
establishments whose average payroll per employee varied between $5,000
11 Furthermore, we adjust our measure of annual payroll per employee by taking intoaccount the number of person-years of temporary layoff when calculating the averagenumber of employees.
19
The Evolving Workplace Series
Innovative Work Practices
12 Relaxing this restriction does not alter our results.13 The resulting sample is representative of establishments with more than 10 employees
in terms of union status and size. It slightly underrepresents establishments in retailtrade and consumer services. These establishments account for 29.5% of allestablishments in our sample, compared to 32.5% in a sample of establishments withmore than 10 employees in March 1999.
and $200,000 (in 1998 dollars).12 Finally, to ensure comparability with
previous studies—in which the question about quits refer to the percentage
of workers quitting—we delete establishments whose quit rates exceed
100%. As a result, our sample consists of profit-oriented establishments
which operated between April 1998 and March 2000, which had more
than 10 employees in March 1999, whose average annual pay per employee
varied between $5,000 and $200,000 and whose quit rates did not exceed
100%. These restrictions lead to a sample of 3,142 establishments.13

20
The Evolving Workplace Series
Innovative Work Practices
V. Analysis of Quit Rates
V.1 Descriptive Statistics
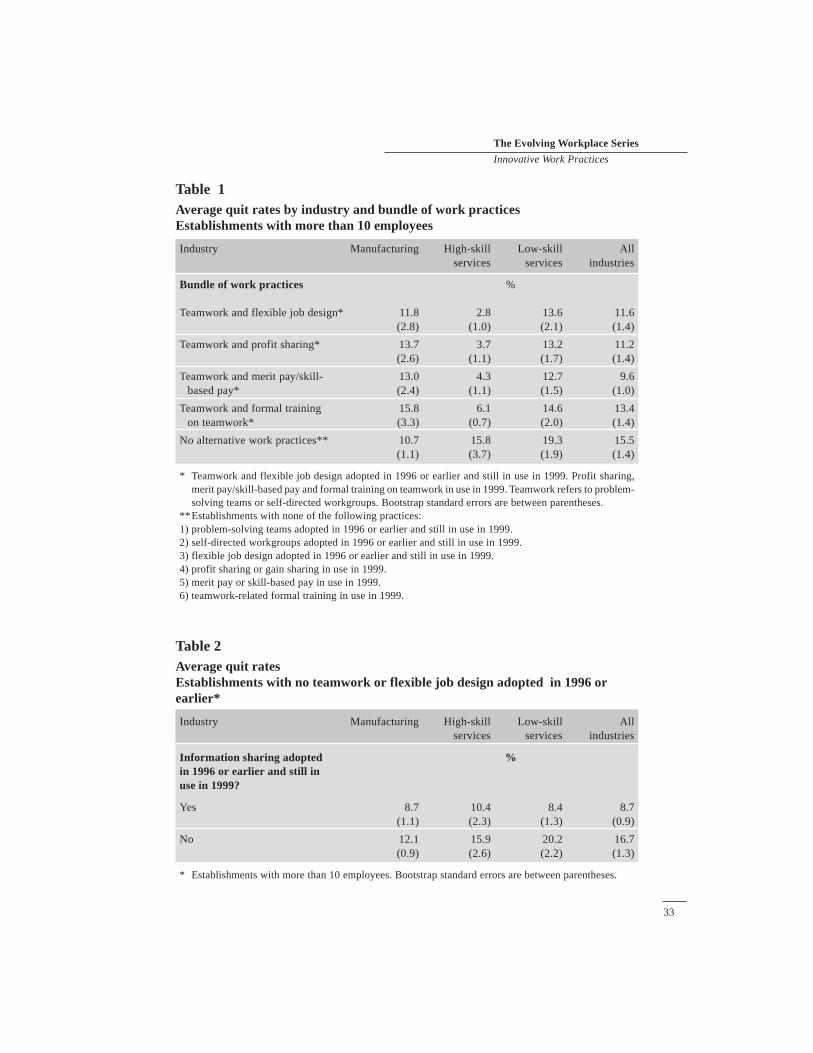
Tables 1 and 2 illustrate two key messages of this paper. The first
message is that AWPs do not appear to reduce quit rates in all industries.
For instance, manufacturing establishments which have some bundles of
work practices do not have lower quit rates than those with no AWPs
(Table 1). However, a quite different pattern is observed in high-skill
services. In this sector, establishments with bundles of AWPs have much
lower quit rates than those with no AWPs.
The second message is that information sharing seems to play an
important role in low-skill services. In this sector, of all establishments
which have adopted neither teamwork nor flexible job design in 1996 or
earlier, those with an information sharing policy have much lower quit
rates than others (Table 2). All we shall see below, both messages hold in
multivariate analysis.
High-skill services include finance and insurance, business services
and information and cultural industries.14 Low-skill services consist mainly
of establishments in transportation, warehousing, wholesale trade, retail
trade and consumer services, real estate, rental and leasing operations.
While 31% of employees in high-skill services have a university degree,
14 Business services include industries such as professional, scientific and technicalservices, of which computer systems design and related services are a component.Information and cultural industries include industries such as telecommunications,publishing and broadcasting.

21
The Evolving Workplace Series
Innovative Work Practices
the corresponding proportions are only 11% in low-skill services and 16%
in all industries of the private sector.15
V.2 Regression Analysis
In all models estimated in this section, we use the following set of
controls: average wages in year t-1, industry, establishment size, whether
the establishment belongs to a multi-establishment company, the
percentage of unionized workers, the percentage of part-time workers,
the percentage of temporary workers, the occupational composition of
the workforce, average weekly hours of full-time employees, the
unemployment rate of males 25-54 by economic region, the presence of a
formal grievance system, whether the establishment was operating in
1997-1998 or in 1996 or earlier and whether employment fell in year t-1
(i.e. between March 1998 and March 1999).16
15 High-skill services, low-skill services and manufacturing account for 22%, 44% and27% of total employment in our sample, respectively. The remaining 7% is accountedfor by construction, forestry, mining, oil and gas extraction.
16 For the sample consisting of establishments with more than 10 employees (N=3,142),we use 14 categories for industry, four categories for establishment size (10-19employees, 20-99 employees, 100-499 employees and 500 or more employees) andseven variables representing the percentage of workers in a given occupational group(managers, professionals, technical/trades, marketing/sales, clerical/administrative,production workers with no trade/certification, other). Our measure of wages includesaverage annual pay per employee as well as average non-wage benefits per employee.We define a formal grievance system as a system where the final authority to settledisputes is held by either a labour-management committee or an outside arbitrator.We control for whether an establishment was operating in 1997-1998 or in 1996 orearlier to account for the possibility that workplaces which adopted teamwork and/orflexible job design in 1996 or earlier may have lower quit rates than those which didso in 1997-1998 simply because they are older establishments. All control variablesare taken at the time of the first interview, i.e. in 1999.

22
The Evolving Workplace Series
Innovative Work Practices
V.2.1 Work Practices Considered Individually
Table 3 shows results of Tobit analyses performed on establishments
with more than 10 employees. Regression analyses are performed for all
industries as well as for the three following sectors: manufacturing, high-
skill services and low-skill services.
The first column of Table 3 indicates that in the aggregate,
establishments which pay relatively high wages and which are unionized
have lower quit rates than others. In contrast, establishments with a high
percentage of part-time workers and those whose employment fell last
year have higher quit rates than others.17 Having performance-based pay
systems is not associated with significant effects while having teamwork-
related formal training is associated with higher quit rates. Most important,
establishments which adopted problem-solving teams, self-directed
workgroups or flexible job design in 1996 or earlier and were still using
these practices in 1999 have lower quit rates than those which did not use
these practices in 1999.18 However, quite different patterns are observed
among establishments which adopted work practices later, i.e. in 1997-
1998. Specifically, those which implemented problem-solving teams during
that period have higher quit rates than those with no problem-solving teams
in 1999. This confirms the need to distinguish early adopters from late
adopters when analyzing quit patterns.
17 The finding that establishments whose employment fell last year have higher quitrates than others likely reflects the fact that workers quit firms whose performance isdeteriorating to avoid being laid-off in the near future.
18 Since the year of implementation of work practices is sometimes unknown, our set ofcovariates also includes indicators of whether or not an establishment adopted problem-solving teams, self-directed workgroups or flexible job design at an unknown date inthe past. For a given practice, the reference group consists of establishments whichare not using that practice in 1999.

23
The Evolving Workplace Series
Innovative Work Practices
The relationships documented above do not necessarily apply
uniformly across sectors. The most robust pattern observed is the negative
association between quit rates and the early adoption of self-directed
workgroups: this negative association appears to hold in all three sectors,
at least at the 10% level of significance.19 However, the early adoption of
problem-solving teams is associated with lower quit rates only in high-
skill services. Furthermore, there is very little evidence that performance-
based pay systems and teamwork-related formal training are associated
with lower quit rates: only establishments operating in high-skill services
and having profit sharing/gain sharing plans have lower quit rates than
others.
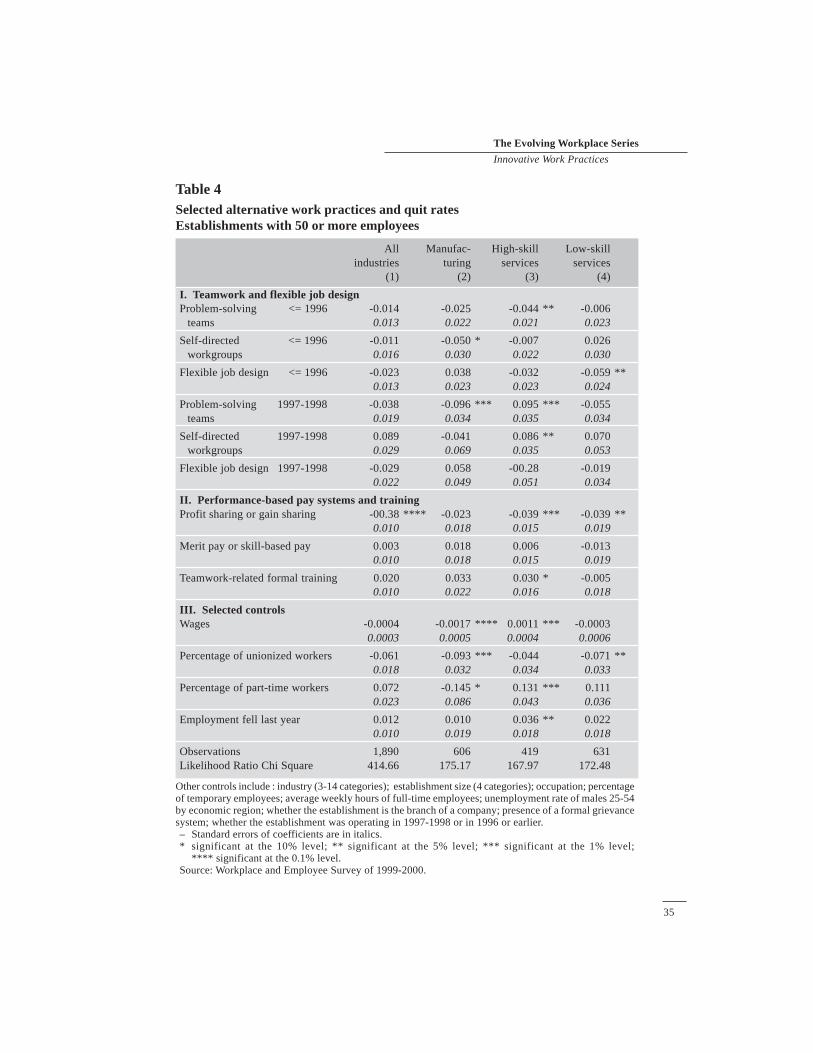
Among establishments with 50 or more employees, the early adoption
of self-directed workgroups is no longer associated with lower quit rates
(Table 4, column 1). Furthermore, it is hard to find a work practice yielding
consistently negative and statistically significant correlations with quit
rates across sectors. The only exception is profit sharing/gain sharing,
which is associated with lower employee turnover in both high-skill
services and low-skill services. In sum, relatively low quit rates are
generally found in establishments with more than 10 employees which
adopted self-directed workgroups in 1996 or earlier and among
establishments with 50 or more employees which have profit sharing or
gain sharing.
19 Cappelli and Neumark (2001b) also find a negative relationship between self-managedteams and quit rates in manufacturing.
24
The Evolving Workplace Series
Innovative Work Practices
V.2.2 Joint Implementation of Work Practices
Skeptics might argue that the results of Tables 3 and 4 do not provide
a satisfactory test of the impact of key AWPs on quit rates since they
consider work practices individually, thereby neglecting potential synergies
between these and other practices.20 To take this argument into account,
we analyze the impact of bundles of work practices in Table 5.
The 13 bundles considered in Table 5 include various combinations
of the six following practices: 1) problem-solving teams adopted in 1996
or earlier and still in use in 1999, 2) self-directed workgroups adopted in
1996 or earlier and still in use in 1999, 3) flexible job design adopted in
1996 or earlier and still in use in 1999, 4) profit sharing or gain sharing in
use in 1999, 5) merit pay or skill-based pay in use in 1999 and, 6)
teamwork-related formal training in use in 1999. To maintain a constant
control group across bundles, we use as a control group establishments
which have none of the six aforementioned practices in 1999. In other
terms, we ask the following question: compared to establishments which
have none of the six practices, do establishments which have a given bundle
20 Another potential caveat is that Tables 3 and 4 consider work practices individually,conditional on the presence/absence of other AWPs. Since many of these practicesmay be implemented together, conditioning results on the presence/absence of otherAWPs may lead to multicollinearity problems. To account for this possiblity, we alsoestimate separate Tobit models where a single work practice (e.g. self-directedworkgroups adopted in 1996 or earlier) is considered and where results are notconditioned on the presence/absence of other AWPs. When we do so, the main messageof Tables 3 and 4—i.e. the lack of uniformity of patterns across sectors—still holds.

25
The Evolving Workplace Series
Innovative Work Practices
of work practices have lower quit rates.21 We ask that question for each of
the 13 bundles considered, each of the three aforementioned industrial
groupings and the two size categories, thereby estimating 78 separate Tobit
models.
Table 5 presents the coefficients associated with each of the 13
bundles, i.e. the coefficients associated with a dummy variable indicating
whether or not an establishment has a given bundle. The results are striking.
In manufacturing and for both size categories, there is no evidence that
key AWPs reduce quit rates: none of the 13 bundles considered yields a
negative and statistically significant correlation.
Quite different patterns are found in the service sector. Among
establishments with more than 10 employees operating in low-skill
services, there is a negative association between bundles of work practices
and quit rates for about half of the bundles considered. By far, the strongest
evidence of a negative association is found in high-skill services, where
all except two bundles are statistically significant at the 5% level. Although
the number of significant and negative bundles drops when we consider
establishments with 50 or more employees in the two service sectors, the
evidence in favour of a negative association remains fairly strong in high-
skill services.
21 For each of the bundles considered, there is also an intermediate group ofestablishments, which neither have the bundle nor fall into the control group. Unlikethe control group, the intermediate group varies across bundles. Therefore, for eachof the bundles considered, the regressions include: 1) an indicator of whether or notan establishment has a given bundle and, 2) an indicator of whether or not anestablishment falls into the intermediate group. The omitted category is the controlgroup. Among establishments with more than 10 employees, the percentage ofestablishments which fall into the control group varies between 29% and 36%,depending on the industrial sector considered. The corresponding numbers forestablishments with 50 or more employees are 17% and 22%, respectively.
26
The Evolving Workplace Series
Innovative Work Practices
To investigate further the robustness of these patterns, we re-estimate
all models of Table 5 simply adding an indicator of whether establishments
adopted a formal policy of information sharing in 1996 or earlier and still
used it in 1999. When we do so, the results found in Table 5 in
manufacturing remain unchanged. Specifically, the finding that none of
the 13 bundles yields a negative and statistically significant correlation
holds, information sharing having no significant effect in most of the
models. Accordingly, we show the results of this exercise for high-skill
services and low-skill services only.
In columns 1 and 3 of Table 6, we first replicate the numbers shown
in columns 5 and 6 of Table 5 for low-skill services, i.e. present Tobit
coefficients without the information sharing indicator. Columns 2 and 4
show the Tobit coefficients with the information sharing indicator. Adding
information sharing to the bundles previously defined sharply reduces the
evidence of a negative association between these bundles and quit rates.
Among establishments with more than 10 employees, the number of
bundles implying a negative association drops from 7 to 3. Among
establishments with 50 or more employees, there is no longer evidence of
a negative association.
The story is different in high skill-services. For both size categories,
adding information sharing reduces the number and the magnitude (in
absolute value) of the significant negative correlations but even when the
information sharing indicator is included, about two thirds of the bundles
remain statistically significant among establishments with more than 10
employees. Therefore, the most robust evidence of a negative association
27
The Evolving Workplace Series
Innovative Work Practices
between key AWPs and quit rates is found among establishments with 10
or more employees operating in high skill-services.22
To evaluate the magnitude of this association, we use the Tobit
coefficients of column 6 of Table 6 and calculate the expected quit rates
of establishments employing 10 or more employees in high-skill services.
We do so for two bundles of work practices which combined teamwork—
narrowly or broadly defined—with flexible job design (bundles 13 and
23, respectively). Since information sharing is common among
establishments which have these bundles, we calculate the expected quit
rates assuming that establishments have a formal information sharing
policy. The results are shown in Table 7.
For both bundles, the expected quit rates of establishments with
teamwork and flexible job design vary between 5% and 7%. In contrast,
establishments with none of the six aforementioned practices have expected
quit rates equal to 12%. Thus, having teamwork and flexible job design
appears to have a sizable impact on labour turnover in high-skill services.
Since most establishments which have self-directed workgroups,
problem-solving teams or flexible job design also have information sharing
as a formal policy, one might argue that the negative effect obtained for
information sharing in low-skill services simply captures the impact of
teamwork and/or flexible job design. To investigate this hypothesis, we
estimate a Tobit model on a subsample of establishments employing more
22 For high-skill services, we re-estimated the models of Table 5 adding not onlyinformation sharing, but also two indicators of whether establishments had adoptedtask teams/joint labour-management committees or employee suggestion programsin 1996 or earlier and were still using these practices in 1999. Doing so did not alterthis conclusion.

28
The Evolving Workplace Series
Innovative Work Practices
than 10 workers in low-skill services and which had implemented neither
problem-solving teams, self-directed workgroups nor flexible job design
in 1996 or earlier (N=751). The resulting coefficient for information sharing
equals -0.074 and is statistically significant at the 1% level.
The second panel of Table 7 presents expected quit rates for this
subsample. Among establishments which implemented information sharing
in 1996 or earlier, expected quit rates are 14%. In contrast, expected quit
rates are 20% for other workplaces. Since we find a sizable effect for
information sharing even among establishments which adopted neither
teamwork nor flexible job design in 1996 or earlier, the negative effect
obtained for information sharing in low-skill services does not simply
capture the impact of teamwork and/or flexible job design.
V.2.3 Discussion
Taken together, Tables 1 to 7 suggest several stories. One
interpretation of the negative correlations found in high-skill services is
that key AWPs may be more successful in reducing quit rates in
technologically complex work environments, i.e. in firms which employ
a highly skilled workforce, require strong conceptual/analytical skills and
de-emphasize repetitive tasks.
One explanation for the decrease in correlations (in absolute value)
observed in low-skill and high-skill services when we add information
sharing could be that the information sharing indicator is a proxy for
policies which signal employers’ interest in workers’ well-being. If so,
such policies may also be useful tools for achieving reductions in labour
turnover. Alternatively, workers whose employers have a formal policy
of information sharing (on firm’s performance, organizational changes,
29
The Evolving Workplace Series
Innovative Work Practices
etc.) may perceive that they work in a less uncertain environment than
others. If so, the perceived reduction in uncertainty might induce them to
keep working with their current employer.

30
The Evolving Workplace Series
Innovative Work Practices
VI. Summary and Conclusions
Using a nationally representative sample of establishments, this study
has examined whether key AWPs tend to reduce quit rates. Overall, the
analysis provides:
1. Strong evidence of a negative association between key AWPs
and quit rates among establishments of more than 10 employees
operating in high-skill services;
2. Some evidence of a negative association in low-skill services.
However, the magnitude of this negative association is reduced
substantially when we simply add an indicator of whether the
workplace has a formal policy of information sharing;
3. Very little evidence of a negative association in manufacturing.
While establishments with self-directed workgroups have lower
quit rates than others, none of the bundles of work practices
considered in this sector yields a negative and statistically
significant effect.
Overall, the findings presented in this paper paint a rather complex
picture of the relationship between key AWPs and quit rates. The evidence
suggests that these practices appear to reduce quit rates in high-skill
services and is therefore consistent with the findings of Batt et al. (2002),
which show a negative association between teamwork and quit rates in
telecommunications in the U.S. Whether these practices operate in a similar
way in low-skill services remains an open question. Consistent with the
findings of Cappelli and Neumark (2001b), self-directed workgroups,
31
The Evolving Workplace Series
Innovative Work Practices
considered in isolation, appear to be associated with lower quit rates in
manufacturing. However, we find no further evidence that key AWPs
reduce quit rates in this sector.
Our interpretation of the negative correlations obtained for
information sharing in low-skill services is that this variable might proxy
the use of practices—that some might label “conventional”—which send
employees a clear signal of their employer’s interest in their well-being.
If so, such practices, whatever they are, might be successful in reducing
labour turnover in traditional/low-skill work environments.
Taken together, the findings obtained for high-skill services and low-
skill services suggest that key AWPs might be more successful in reducing
labour turnover in technologically complex environments than in low-
skill ones.23
Yet, alternative interpretations must be kept in mind. The negative
association found in cross-sectional data between key AWPs and quit rates
in high-skill services does not necessarily imply that adopting these
practices causes a reduction in quit rates in this sector. As mentioned above,
establishments with AWPs in high-skill services may have had lower quit
rates than others even before they adopted these practices. Second,
establishments which use these practices may simply have better managers
than others and it might the quality of management—rather than the
adoption of these practices—which causes a reduction in quit rates.24
23 Boning et al. (2001) find that the adoption of teamwork in U.S. steel minimills leadsto larger productivity increases in technologically complex production lines than inother production lines.
24 It is also important to acknowledge that if AWPs caused a reduction in quit rates inhigh-skill services, the magnitude of the impact will be overestimated if some of theestablishments which adopted these practices have abandoned them later becausethey did not prove successful in reducing quit rates.

32
The Evolving Workplace Series
Innovative Work Practices
Given the demographic pressures firms will face in the near future
as a result of the aging of their workforce, the search for work practices
which reduce labour turnover will likely intensify over the next few years.
The markedly different patterns that this paper has documented across
industries and the possibility that other confounding factors underlie the
correlations found in high-skill services suggest that it is still premature
to conclude that key AWPs are the magic tool one may be looking for to
achieve a substantial reduction in quit rates in all sectors of the economy.
33
The Evolving Workplace Series
Innovative Work Practices
Table 1Average quit rates by industry and bundle of work practicesEstablishments with more than 10 employees
Industry Manufacturing High-skill Low-skill Allservices services industries
Bundle of work practices %
Teamwork and flexible job design* 11.8 2.8 13.6 11.6(2.8) (1.0) (2.1) (1.4)
Teamwork and profit sharing* 13.7 3.7 13.2 11.2(2.6) (1.1) (1.7) (1.4)
Teamwork and merit pay/skill- 13.0 4.3 12.7 9.6based pay* (2.4) (1.1) (1.5) (1.0)
Teamwork and formal training 15.8 6.1 14.6 13.4on teamwork* (3.3) (0.7) (2.0) (1.4)
No alternative work practices** 10.7 15.8 19.3 15.5(1.1) (3.7) (1.9) (1.4)
* Teamwork and flexible job design adopted in 1996 or earlier and still in use in 1999. Profit sharing,merit pay/skill-based pay and formal training on teamwork in use in 1999. Teamwork refers to problem-solving teams or self-directed workgroups. Bootstrap standard errors are between parentheses.
**Establishments with none of the following practices:1) problem-solving teams adopted in 1996 or earlier and still in use in 1999.2) self-directed workgroups adopted in 1996 or earlier and still in use in 1999.3) flexible job design adopted in 1996 or earlier and still in use in 1999.4) profit sharing or gain sharing in use in 1999.5) merit pay or skill-based pay in use in 1999.6) teamwork-related formal training in use in 1999.
Table 2Average quit ratesEstablishments with no teamwork or flexible job design adopted in 1996 orearlier*
Industry Manufacturing High-skill Low-skill Allservices services industries
Information sharing adopted %in 1996 or earlier and still inuse in 1999?
Yes 8.7 10.4 8.4 8.7(1.1) (2.3) (1.3) (0.9)
No 12.1 15.9 20.2 16.7(0.9) (2.6) (2.2) (1.3)
* Establishments with more than 10 employees. Bootstrap standard errors are between parentheses.

34
The Evolving Workplace Series
Innovative Work Practices
Table 3Selected alternative work practices and quit ratesEstablishments with more than 10 employees
All Manufac- High-skill Low-skillindustries turing services services
(1) (2) (3) (4)
I. Teamwork and flexible job designProblem-solving <= 1996 -0.046 **** -0.007 -0.167 **** -0.021
teams 0.013 0.021 0.028 0.022
Self-directed <= 1996 -0.049 *** -0.081 ** -0.071 * -0.058 *workgroups 0.019 0.033 0.041 0.031
Flexible job design <= 1996 -0.023 ** 0.054 *** -0.097 **** -0.046 **0.012 0.019 0.030 0.019
Problem-solving 1997-1998 0.170 **** -0.034 0.095 0.253 ****teams 0.021 0.025 0.062 0.037
Self-directed 1997-1998 -0.014 0.056 0.087 -0.069workgroups 0.035 0.041 0.061 0.081
Flexible job design 1997-1998 0.036 * 0.003 -0.178 ** 0.0450.022 0.032 0.061 0.038
II. Performance-based pay systems and trainingProfit sharing or gain sharing -0.018 0.037 ** -0.055 ** 0.005
0.012 0.018 0.025 0.021
Merit pay or skill-based pay 0.003 -0.014 0.067 *** 0.0080.010 0.016 0.021 0.017
Teamwork-related formal training 0.027 ** 0.057 *** -0.004 0.0090.012 0.021 0.023 0.019
III. Selected controlsWages -0.0010 **** -0.0007 * 0.0007 -0022 ****
0.0003 0.0004 0.0005 0.0006
Percentage of unionized workers -0.095 **** -0.108 *** -0.038 -0.0570.022 0.037 0.048 0.037
Percentage of part-time workers 0.178 **** 0.001 0.085 * 0.209 ****0.023 0.054 0.053 0.036
Employment fell last year 0.059 **** 0.027 0.134 **** -0.0120.011 0.018 0.025 0.019
Observations 3,142 866 709 1,079Likelihood Ratio Chi Square 844.47 136.11 265.24 478.29
Other controls include : industry (3-14 categories); establishment size (4 categories); occupation; percentageof temporary employees; average weekly hours of full-time employees; unemployment rate of males 25-54by economic region; whether the establishment is the branch of a company; presence of a formal grievancesystem; whether the establishment was operating in 1997-1998 or in 1996 or earlier.– Standard errors of coefficients are in italics.* significant at the 10% level; ** significant at the 5% level; *** significant at the 1% level;
**** significant at the 0.1% level.Source: Workplace and Employee Survey of 1999-2000.
35
The Evolving Workplace Series
Innovative Work Practices
Table 4Selected alternative work practices and quit ratesEstablishments with 50 or more employees
All Manufac- High-skill Low-skillindustries turing services services
(1) (2) (3) (4)
I. Teamwork and flexible job designProblem-solving <= 1996 -0.014 -0.025 -0.044 ** -0.006
teams 0.013 0.022 0.021 0.023
Self-directed <= 1996 -0.011 -0.050 * -0.007 0.026workgroups 0.016 0.030 0.022 0.030
Flexible job design <= 1996 -0.023 0.038 -0.032 -0.059 **0.013 0.023 0.023 0.024
Problem-solving 1997-1998 -0.038 -0.096 *** 0.095 *** -0.055teams 0.019 0.034 0.035 0.034
Self-directed 1997-1998 0.089 -0.041 0.086 ** 0.070workgroups 0.029 0.069 0.035 0.053
Flexible job design 1997-1998 -0.029 0.058 -00.28 -0.0190.022 0.049 0.051 0.034
II. Performance-based pay systems and trainingProfit sharing or gain sharing -00.38 **** -0.023 -0.039 *** -0.039 **
0.010 0.018 0.015 0.019
Merit pay or skill-based pay 0.003 0.018 0.006 -0.0130.010 0.018 0.015 0.019
Teamwork-related formal training 0.020 0.033 0.030 * -0.0050.010 0.022 0.016 0.018
III. Selected controlsWages -0.0004 -0.0017 **** 0.0011 *** -0.0003
0.0003 0.0005 0.0004 0.0006
Percentage of unionized workers -0.061 -0.093 *** -0.044 -0.071 **0.018 0.032 0.034 0.033
Percentage of part-time workers 0.072 -0.145 * 0.131 *** 0.1110.023 0.086 0.043 0.036
Employment fell last year 0.012 0.010 0.036 ** 0.0220.010 0.019 0.018 0.018
Observations 1,890 606 419 631Likelihood Ratio Chi Square 414.66 175.17 167.97 172.48
Other controls include : industry (3-14 categories); establishment size (4 categories); occupation; percentageof temporary employees; average weekly hours of full-time employees; unemployment rate of males 25-54by economic region; whether the establishment is the branch of a company; presence of a formal grievancesystem; whether the establishment was operating in 1997-1998 or in 1996 or earlier.– Standard errors of coefficients are in italics.* significant at the 10% level; ** significant at the 5% level; *** significant at the 1% level;
**** significant at the 0.1% level.Source: Workplace and Employee Survey of 1999-2000.

36
The E
volving Workplace Series
Innovative Work P
ractices
Table 5Bundles of work practices and quit rates
Establishments Establishments Establishments Establishments Establishments Establishmentswith >10 with >=50 with >10 with >=50 with >10 with >=50
employees employees employees employees employees employees
Industry Manufacturing High-skill services Low-skill services
(1) (2) (3) (4) (5) (6)
Bundles withcomponents*:13 0.046 0.002 -0.200**** -0.101** -0.162**** -0.00114 -0.020 -0.002 -0.216**** -0.027 -0.143**** -0.04715 0.025 -0.042 -0.166**** -0.056* -0.044 -0.01516 -0.012 -0.018 -0.253*** -0.064* -0.078 -0.011
23 0.031 0.026 -0.169**** -0.069** -0.124**** -0.03024 0.078*** -0.021 -0.123*** -0.030 -0.150**** -0.056*25 0.064** 0.024 -0.120**** -0.059** -0.103**** -0.01226 0.113**** 0.039 -0.076* -0.043 -0.075** 0.010
234 0.033 -0.053 -0.231**** -0.034 -0.101*** -0.043235 0.058 0.091** -0.196**** -0.097*** -0.132**** -0.016236 0.077* 0.003 -0.243*** -0.090** -0.036 -0.011
2346 0.091* -0.041 -0.148 -0.024 -0.030 -0.0312356 -0.029 -0.027 -0.217** -0.101*** -0.072 -0.030
* Components of bundles are defined as follows:1= self-directed workgroups adopted in 1996 or earlier and still in use in 19992= self-directed workgroups or problem-solving teams adopted in 1996 or earlier and still in use in 19993= flexible job design adopted in 1996 or earlier and still in use in 19994= profit sharing or gain sharing in use in 19995= merit pay or skill-based pay in use in 19996= teamwork-related formal training in use in 1999.* Significant at the 10% level; ** significant at the 5% level; *** significant at the 1% level; **** significant at the 0.1% level.

37
The E
volving Workplace Series
Innovative Work P
ractices
Table 6Bundles of work practices, information sharing and quit rates
Establishments withemployees: > 10 >10 >=50 >=50 > 10 >10 >=50 >=50
Industry Low-skill services Low-skill services High-skill services High-skill services(1) (2) (3) (4) (5) (6) (7) (8)
Information sharingindicator included? No Yes No Yes No Yes No YesBundles withcomponents*
13 -0.162**** -0.093*** -0.001 0.050 -0.200**** -0.138*** -0.101** -0.087**14 -0.143**** -0.071* -0.047 -0.004 -0.216**** -0.149** -0.027 -0.00815 -0.044 0.029 -0.015 0.034 -0.166**** -0.101** -0.056* -0.04116 -0.078 -0.019 -0.011 0.032 -0.253*** -0.182** -0.064* -0.049
23 -0.124**** -0.048 -0.030 0.013 -0.169**** -0.106** -0.069** -0.05624 -0.150**** -0.078** -0.056* 0.019 -0.123*** -0.039 -0.030 -0.01125 -0.103**** -0.028 -0.012 0.031 -0.120**** -0.043 -0.059** -0.05426 -0.075** 0.005 0.010 0.073** -0.076* 0.001 -0.043 -0.032
234 -0.101*** -0.019 -0.043 0.040 -0.231**** -0.161** -0.034 -0.013235 -0.132**** -0.059 -0.016 0.027 -0.196**** -0.130** -0.097*** -0.085**236 -0.036 0.035 -0.011 0.036 -0.243*** -0.170* -0.090** -0.078**
2346 -0.030 0.040 -0.031 0.015 -0.148 -0.074 -0.024 -0.00012356 -0.072 -0.022 -0.030 0.079* -0.217** -0.145 -0.101*** -0.089**
* Components of bundles are defined as follows:1= self-directed workgroups adopted in 1996 or earlier and still in use in 19992= self-directed workgroups or problem-solving teams adopted in 1996 or earlier and still in use in 19993= flexible job design adopted in 1996 or earlier and still in use in 19994= profit sharing or gain sharing in use in 19995= merit pay or skill-based pay in use in 19996= teamwork-related formal training in use in 1999* Significant at the 10% level; ** significant at the 5% level; *** significant at the 1% level; **** significant at the 0.1% level.

38
The Evolving Workplace Series
Innovative Work Practices
Table 7Expected quit rates in high-skill services and low-skill services
I. Establishments with more than 10 employees in high-skill services and with aninformation sharing policy
Establishments Establishmentswith none of the with
6 practices** bundle(1) % (2)
Bundle with components* :
13 12 5[7]
23 12 7[9]
II. Establishments with more than 10 employees in low-skill services and with neitherproblem-solving teams, self-directed workgroups, nor flexible job design in 1996 orearlier (N=751)
No Yes(3) (4)
Information sharing in 1996 or earlier 20 14[12]
* Components of bundles are defined as follows:1= self-directed workgroups adopted in 1996 or earlier and still in use in 19992= self-directed workgroups or problem-solving teams adopted in 1996 or earlier and still in use in 19993= flexible job design adopted in 1996 or earlier and still in use in 1999** problem-solving teams (1996 or earlier), self-directed workgroups (1996 or earlier), flexible job design
(1996 or earlier),profit-sharing or gain sharing, merit pay or skill-based pay and, teamwork-relatedformal training. The percentage of establishments with a given bundle (or with an information sharingpolicy) is in brackets.
Source: Authors’ calculations from the Workplace and Employee Survey of 1999-2000.

39
The Evolving Workplace Series
Innovative Work Practices
References
Arthur, J.B. (1994) “Effects of Human Resource Systems on
Manufacturing Performance and Turnover”, Academy of Management
Journal, Vol. 37, No. 3, pp. 670-687.
Azfar, O. and S. Danninger (2001) “Profit-Sharing, Employment Stability,
and Wage Growth”, Industrial and Labor Relations Review, Vol. 54,
No. 3, pp. 619-630.
Bailey, T., P. Berg and C. Sandy (2001) “The Effect of High-Performance
Work Practices on Employee Earnings in the Steel, Apparel, and Medical
Electronics and Imaging Industries”, Industrial and Labor Relations
Review, Vol. 54, No. 2A, pp. 525-543.
Batt, R., A.J.S. Colvin and J. Keefe (2002) “Employee Voice, Human
Resource Practices, and Quit Rates: Evidence from the
Telecommunications Industry”, Industrial and Labor Relations Review,
Vol. 55, No. 4, pp. 573-594.
Boning, B., C. Ichniowski and K. Shaw (2001) “Opportunity Counts:
Teams and the Effectiveness of Production Incentives”, National Bureau
of Economic Research, Working Paper No. 8306.
Buch, K. (1992) “Quality Circles and Employee Withdrawal Behaviors:
A Cross-Organizational Study”, Journal of Applied Behavioral Science,
Vol. 28, No. 1, pp. 62-73.

40
The Evolving Workplace Series
Innovative Work Practices
Cappelli, P. and D. Neumark (2001a) “Do “High-Performance” Work
Practices Improve Establishment-Level Outcomes?”, Industrial and Labor
Relations Review, Vol. 54, No. 4, pp. 737-775.
Cappelli, P. and D. Neumark (2001b) “External Job Churning and Internal
Job Flexibility”, National Bureau of Economic Research, Working Paper
No. 8111.
Delaney, J.T. (1996) “Unions, Human Resource Innovations, and
Organizational Outcomes”, in Advances in Industrial and Labor Relations,
Volume 7, pp. 207-245.
Gittleman, M., M. Horrigan and M. Joyce (1998) “Flexible Workplace
Practices: Evidence from a Nationally Representative Survey”, Industrial
and Labor Relations Review, Vol. 52, No. 1, pp. 99-115.
Hamilton, B.H., J. Nickerson and H. Owan (2001) “Team Incentives and
Worker Heterogeneity: An Empirical Analysis of the Impact of Teams on
Productivity and Participation”, mimeo.
Havlovic, S.J. (1991) “Quality of Working Life and Human Resource
Outcomes” Industrial Relations, Vol. 30, No. 3, pp. 469-479.
Huselid, M.A. (1995) “The Impact of Human Resource Management
Practices on Turnover, Productivity, and Corporate Financial
Performance”, Academy of Management Journal, Vol. 38, No. 3, pp. 635-
672.
Morissette, R. and J.M. Rosa (2003) Alternative Work Practices and Quit
Rates: Methodological Issues and Empirical Evidence For Canada.
Analytical Studies Branch Research Paper 11F0019MIE 2003, No. 199,
Statistics Canada.

41
The Evolving Workplace Series
Innovative Work Practices
Wilson, N. and M. J. Peel (1991) “The Impact on Absenteeism and Quits
of Profit-Sharing and Other Forms of Employee Participation”, Industrial
and Labor Relations Review, Vol. 44, No. 3, pp. 454-468.