innovative ways of measuring tb transmission: …€¦ · innovative ways of measuring tb ... risk...
TRANSCRIPT

Innovative ways of measuring TB transmission: prospects and challenges
Gabriel Chamie MD, MPH Assistant Professor of Medicine
HIV/AIDS Division, San Francisco General Hospital University of California, San Francisco (UCSF)

Ventilation & TB Transmission
• Ventilation & TB Transmission – 6-12 Air Changes per Hour (ACH) recommended
for TB isolation & procedure rooms – Based on models of particle clearance rates
• 1 ACH clears 67% of contaminants in an hour • 7 ACH clears 99.9% of contaminants in an hour
• Evidence supporting ventilation for TB prevention? – Limited, largely from hospitals/clinical settings

Household TB Transmission
• Homes of active pulmonary TB cases are high risk environments for TB transmission
• HIV-infected household contacts and children at particularly high risk of TB
disease within a specified time period. The validity of the SAR,
however, depends on the degree of concordance of strain types
between index and contact cases. Because some disease in
households results from transmission outside the household
contact network, failure to account for these cases overestimates
the SAR for disease. Recent population-based studies from
industrialized countrieshave shown that the strain of M. tuberculosis
may differ between the index and contact cases in up to 30% of
pairs. In thisstudy, we observed a similar proportion of discordant
pairs. In fact, in thissetting, the SAR for disease would have been
overestimated by 25% without verifying thestrain-specific chain of
transmission by RFLP analysis.
Table 1. Estimates of the secondary attack rate of tuberculosis in 1918 household contacts in Kampala, Uganda, 1995–2004.
Characteri st ic Category
No. at
Risk
No. Posit ive Culture
Cases
No. without
RFLP
No. RFLP
Matched
Isolates
Est imated No.
Matched
Isolates{
SAR - Tubercu losis
(%) 95% CI
Overall 1918 76 15 46 57.3 3.0 2.2, 3.8
Age (y) # 5 508 28 3 23 25.8 5.1 3.2, 7.0
6–15 691 7 3 3 5.3 0.8 0.1, 1.4
16–25 364 16 3 8 9.8 2.7 1.0, 4.4
26–45 283 22 5 11 14.2 5.0 2.5, 7.6
$ 46 72 3 1 1 1.5 2.1 0, 5.4
. 5 1410 48 12 23 30.7 2.2 1.4, 2.9
HIV Status HIV+ 201 30 8 13 17.7 8.8 4.9, 12.7
HIV2 1455 44 7 31 36.9 2.5 1.7, 3.3
BCG Vaccine Yes 1349 46 6 32 36.8 2.7 1.9, 3.6
No 499 27 7 13 17.6 3.5 1.9, 5.1
**Co-prevalent cases with the same finger print pattern as the index case. Since 15 cases did not have RLFP results, this number is estimated using the observed
proportion (see methods) of RLFP matches. 46/61 observed matches; thus, 46/61*76 culture confirmed cases= 57.3= 57.{The total number of cases with matched RFLP patterns is the number of isolates with observed matches plus expected number of matches from isolates grown in
culture but not analyzed with RFLP. Expected number of matches was estimated as the product of the observed proportion of matches and the number of pairs
without RFLP results plus observed matches.
*HIV serostatus was not available in 262 (13.7%) of contacts. HIV serostatus was not measured in community control households; the general secondary attack rate for
infection was therefore used to estimate risk of disease after household infection.{Vaccination status missing or uncertain in 70 household contacts and 4 community members.
doi:10.1371/journal.pone.0016137.t001
Table 2. Prevalence of tuberculosis infection and risk difference in tuberculosis infection between 1918 household contacts and
1179 community members according to age and BCG vaccination status in Kampala, Uganda, 1995–2004.
Characterist ic Category Exposure N Number Infected Infected (%) Risk Difference 95% CI
Total Contacts 1918 1369 71.4 47.4 44.3, 50.6
Controls 1179 282 23.9
Age 0–5 Contacts 508 320 63.0 50.3 44.5, 56.2
Controls 253 32 12.6
6–15 Contacts 691 475 68.7 53.9 48.7, 59.2
Controls 311 46 14.8
16–25 Contacts 364 285 78.3 46.7 39.8, 53.6
Controls 275 87 31.6
26–45 Contacts 283 226 79.9 45.5 38.1, 52.9
Controls 262 90 34.4
$ 46 Contacts 72 63 87.5 52.9 39.9, 65.8
Controls 78 27 34.6
BCG Vaccine Yes Contacts 1349 935 69.3 47.4 43.6, 51.2
Controls 793 174 21.9
No Contacts 499 388 77.7 49.7 44.0, 55.5
Controls 382 107 28.0
{Vaccination status missing or uncertain in 70 household contacts and 4 community members.
*Defined as the sum of contacts with TS. 10 mm within 3 months of household evaluation who do not have evidence of active tuberculosis.
doi:10.1371/journal.pone.0016137.t002
Household Attack Rates for Tuberculosis
PLoS ONE | www.plosone.org 4 February 2011 | Volume 6 | Issue 2 | e16137
Whalen C, et al. PlosOne 2011

The freshAIR pilot study
• Study Objectives
– To describe the physical and social characteristics of TB patients’ homes in Kampala, Uganda
– To develop and test the feasibility of a simple in-home measurement of ventilation using a carbon dioxide (CO2) tracer gas decay technique
– To determine if household ventilation is associated with TB in household contacts
– To measure the impact of low-cost interventions on household ventilation

The freshAIR pilot study
• Study population: Pulmonary TB cases and their household contacts living in homes within 20 km of central Kampala
– All index patients diagnosed with pulmonary TB at the National Tuberculosis and Leprosy Programme
– All households identified from an existing prospective cohort: UCSF Family-based HIV Voluntary Counseling and Testing for patients at risk of study (PI: Dr. Charlebois)

• Household Survey
– Individual questionnaire
– Group questionnaire
– Floor plan/map of home
11’5”
9’10”

Measuring Household Ventilation
• CO2 tracer gas method for measuring air changes per hour (ACH)
– Modification of a method used in Canadian hospitals for measuring ACH (Menzies, et al. AJRCCM, 1995)
– Change in LogCO2 over time estimates ACH

* * * * * *
* * * * * *
CO2
*
400
* * * * * * * * * * * * * * * * * * * * * * * * * * * *
* * * * * * * * * * * * * * * * * * * * * * * * * * * * * * * * * * * * * * * * * * * * * * * * * * * * * *
3000
* * * * * *
* * * * * *
400
* * * * * * * * * * * * * * * * * * * * * * *
* * * * * * * * * * * * * * * * * * * * * * * * * *
1000
BASELINE
* *
* *
* *
CO2 monitor
Ventilation Measurement Schematic

In-home CO2 Decay Curves
Air Changes per Hour (ACH) = Ln(CO2[peak]) – Ln(CO2[t]) t
t = time for CO2 to return to baseline or at the end of measurement
(seconds)
29 ACH
26 ACH
SR: Sleep Room

In-home CO2 Decay Curves
6 ACH
11 ACH
CR: Communal Room


FreshAIR Results
Household Characteristics
• 61 homes enrolled in Kampala
• Median # residents: 5 people (IQR: 4-6)/home
• Median # of rooms: 1 room (IQR: 1-3)/home
• 58/61 homes (95%) reported closing all windows and doors at night

Results: Household Residents
• Index Cases (N=61)
– Median age: 30 years
– 48/61 (77%) AFB smear+
– 24/61 (39%) HIV-infected
• Household contacts (N=205)
– Median age: 15 years
– HIV-infected
• 9/205 (4.4%) of all contacts (adults + children)
• 8/83 (9.6%) adult contacts
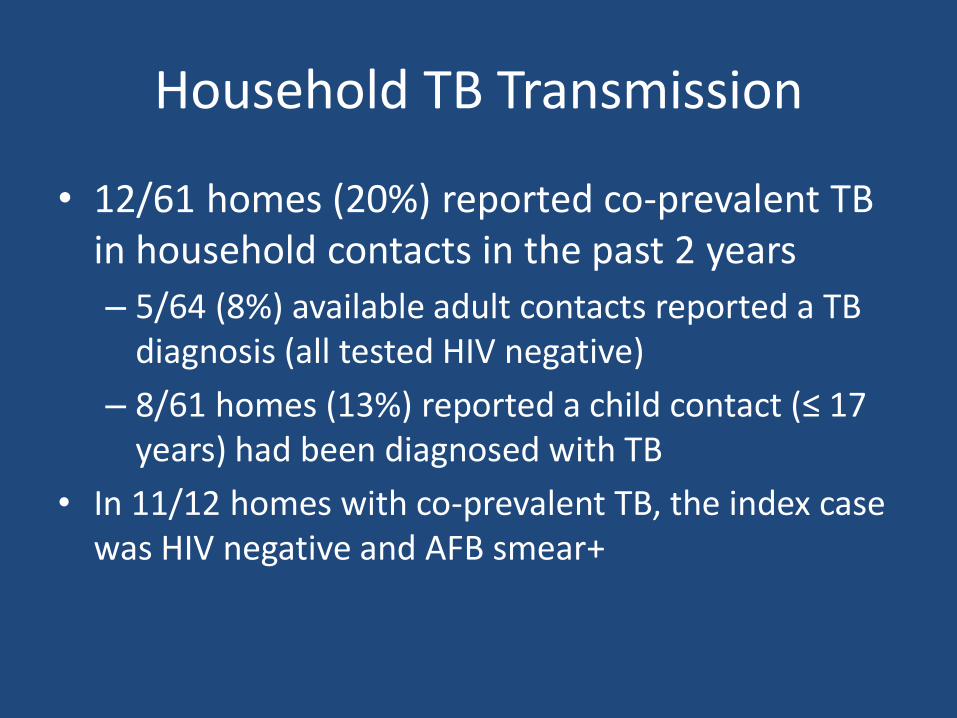
Household TB Transmission
• 12/61 homes (20%) reported co-prevalent TB in household contacts in the past 2 years
– 5/64 (8%) available adult contacts reported a TB diagnosis (all tested HIV negative)
– 8/61 homes (13%) reported a child contact (≤ 17 years) had been diagnosed with TB
• In 11/12 homes with co-prevalent TB, the index case was HIV negative and AFB smear+

Household Ventilation
N=94 rooms
Median 14 ACH (IQR: 10-18)

Ventilation Levels in other settings • Recommended for hospital settings: 6-12 ACH
• Peruvian hospitals (Escombe, PlosMed, 2007)
• Guatemalan kitchens: 16 ACH (Cowlin, Smith, unpublished data)

Ventilation & TB Transmission
p=0.24
Median: 15 vs. 12 ACH

Ventilation & TB Transmission Index Case = HIV-uninfected and AFB Smear+ (n=30)
Median: 17 vs. 12 ACH p=0.03

Interventions to Increase Ventilation
• Opening a window
– Average change in ventilation increase by 7 ACH
• Challenges
– 5/61 homes did not have windows
– 11/61 homes had no significant change in ventilation with opening a window
– Concerns re: open windows
• Security (64%)
• Mosquitos/Malaria (36%)

http://www.archiveglobal.org/our-work/haiti/haiti-gallery

Summary
• Median five residents and one room per home
• 95% of homes closed windows/doors at night
• 20% homes reporting co-prevalent TB
• Overall, median ventilation rate of 14 ACH
• In homes at high risk for TB transmission, ventilation rates significantly lower in homes reporting TB in a contact (12 vs. 17, p=0.03)
• Opening a window: mean increase of 7 ACH

Conclusions
• Homes in Uganda are crowded with few windows and doors
• CO2 diffusion method a low-cost, practical way to measure ventilation in homes
• Lower ventilation levels associated with increased household transmission of TB
• Simple and low-cost interventions (opening a window) can increase household ventilation

Acknowledgements
• The FreshAIR study participants • Edwin Charlebois • Diane Havlir • Bonnie Wandera • Annie Luetkemeyer • Roy Mugerwa • Bulya Nakalema • Kirk Smith • MU-UCSF Research
Collaboration