innovative materials and forms for attenuation at hyper
TRANSCRIPT

HAL Id: tel-01428908https://tel.archives-ouvertes.fr/tel-01428908
Submitted on 6 Jan 2017
HAL is a multi-disciplinary open accessarchive for the deposit and dissemination of sci-entific research documents, whether they are pub-lished or not. The documents may come fromteaching and research institutions in France orabroad, or from public or private research centers.
L’archive ouverte pluridisciplinaire HAL, estdestinée au dépôt et à la diffusion de documentsscientifiques de niveau recherche, publiés ou non,émanant des établissements d’enseignement et derecherche français ou étrangers, des laboratoirespublics ou privés.
Innovative materials and forms for attenuation at HyperFrequenciesLaura Pometcu
To cite this version:Laura Pometcu. Innovative materials and forms for attenuation at Hyper Frequencies. Electronics.Université Rennes 1, 2016. English. �NNT : 2016REN1S044�. �tel-01428908�

ANNÉE 2016
THÈSE / UNIVERSITÉ DE RENNES 1 sous le sceau de l’Université Bretagne Loire
pour le grade de
DOCTEUR DE L’UNIVERSITÉ DE RENNES 1
Mention : Traitement de signal et Télécommunications
Ecole doctorale Matisse
présentée par
Laura Pometcu Préparée à l’unité de recherche IETR (UMR CNRS 6164)
Institut d’Electronique et de Télécommunications de Rennes Université de Rennes 1
Matériaux et formes innovants pour l'atténuation en Hyper Fréquences
Thèse soutenue à Rennes le 8/09/2016
devant le jury composé de :
Valérie VIGNERAS Professeur des Universités, Bordeaux INP / rapporteur
Xavier BEGAUD Professeur à TELECOM ParisTech / rapporteur
Philippe POULIGUEN Responsable du Domaine Scientifique « Ondes Acoustiques et Radioélectriques » - DGA / examinateur
Marc HELIER Professeur des Universités, Université Pierre & Marie Curie / examinateur
Vincent LAUR Maître de Conférences à l'Université Bretagne Occidentale / examinateur
Pierre BRUGUIERE Ingénieur chercheur à CEA Gramat / examinateur
Ala SHARAIHA Professeur à l'Université de Rennes 1 - IETR / directeur de thèse
Ratiba BENZERGA Maître de Conférences à l'Université de Rennes 1 / co-directeur de thèse


"If you can't explain it simply,
you don't understand it well enough."
Albert Einstein


Acknowledgments
The work presented in this manuscript was carried out at Institute of Electronics and
Telecommunications of Rennes with the financial support of the Direction Générale de l'Armement
(DGA).
First I would like to present my gratitude to Prof. Valérie Vigneras and Prof. Xavier Begaud
for doing me the honor to be rapporteurs of my PhD thesis. I appreciated the precise and efficient
reviewing of the manuscript that helped me improve my thesis. I would like also to thank Prof. Marc
Helier who has agreed to be the president of my thesis committee and I am deeply grateful to all jury
members, namely, Dr. Pierre Bruguiere, Dr. Vincent Laur and Dr. Philippe Pouliguen, for agreeing to
read the manuscript.
I would like to express my sincere gratitude to my supervisor Prof. Ala Sharaiha for his
continuous support of my PhD study and research, for his patience, motivation, and immense
knowledge. I could not have imagined having a better advisor and mentor for my PhD study.
Besides, I would like to thank my co-supervisor Dr. Ratiba Benzerga, an extraordinary person
who helped me resolve problems. Without her guidance and persistent help this thesis would not have
been possible.
I express my gratitude to Dr. Philippe Pouliguen for his insightful comments and
encouragement which helped me broaden my knowledge.
I am also grateful for all the support that I've received from all the members from the lab:
especially Prof. Eric Pottier, the IETR director, the secretaries and mechanics that without their help I
wouldn't have been able to get this far.
In my daily work I've been blessed with having friendly colleges at National Institute of
Applied Sciences of Rennes, especially Mister Jean-Marie Floch and Mister Jerome Sol that helped
me with my measurements and provided me with all the materials needed so that I can obtain accurate
results.
I thank my fellow lab mates for all the fun we have had in the last three years. Also I want to
thank all my friends who inspired me and supported me all this time. Special thanks go to Chloé
Mejean, a wonderful colleague who always helped me even if it went beyond her call of duty.
Last but not least, I would like to thank my family, especially my mother for supporting me
spiritually throughout writing this thesis and in life in general.
I dedicate this thesis to them.
Rennes, 2016


7
Contents
Quote 3
Acknowledgments 5
Contents 7
Acronyms 11
List of Tables 13
List of Figures 15
Introduction 25
1. Material Characterization in a Non-anechoic Environment 29
1.1 Introduction.................................................................................................................. 29
1.2 Methods of material characterization in literature....................................................... 29
1.3 The characterization techniques used in this work...................................................... 31
1.3.1 Waveguide measurement technique........................................................... 31
1.3.2 Open ended coaxial probe method............................................................... 33
1.3.3 Free-space method....................................................................................... 35
1.3.3.1 Monostatic and bistatic measurements........................................ 36
1.4 A proposed method for material characterization in a non-anechoic environment..... 39
1.4.1 Proposed approach and measurement setup................................................ 40
1.4.2 Permittivity extraction................................................................................. 42
1.4.3 Measurement results.................................................................................... 43
1.4.3.1 Teflon........................................................................................... 43
Time gating technique.......................................................... 44
Mean value technique........................................................... 45
1.4.3.2 Commercial absorbing material................................................... 48
1.5 Conclusion................................................................................................................... 51
2 New Rigid Composite Materials for Anechoic Chamber Applications 53
2.1 Introduction.................................................................................................................. 53
2.2 Absorber materials composition.................................................................................. 53
2.3 New absorber material................................................................................................. 57
2.3.1 Absorber material composition.................................................................... 57
2.3.2 Elaboration method...................................................................................... 57
2.4 Characterization results of the epoxy composite absorbers......................................... 58
2.4.1 Non-anechoic environment technique......................................................... 63
2.5 Pyramidal absorber prototype based on the epoxy foam loaded with carbon

8 CONTENTS
fibers................................................................................................................................... 65
2.5.1 Simulation results............................................................................ 65
2.5.2 Prototype characterization............................................................... 67
2.6 Ideal absorber material................................................................................................. 74
2.7 Conclusion................................................................................................................... 79
3. Absorber Geometry Optimization for Anechoic Chambers 81
3.1 Introduction.................................................................................................................. 81
3.2 Standard absorber shapes used in anechoic chambers................................................. 81
3.2.1 Twisted pyramidal absorber......................................................................... 81
3.2.2 Double pyramidal absorber.......................................................................... 82
3.2.3 Hollow pyramidal absorber.......................................................................... 82
3.2.4 Cylinder pyramidal absorber........................................................................ 83
3.2.5 Triangular pyramidal absorber..................................................................... 83
3.2.6 Hexagonal pyramidal absorber.................................................................... 84
3.2.7 Convoluted microwave absorber.................................................................. 84
3.2.8 Pyramidal absorber....................................................................................... 85
3.2.9 Truncated pyramidal absorber...................................................................... 87
3.2.10 Wedge microwave absorber....................................................................... 88
3.2.11 Oblique wedge microwave absorber.......................................................... 88
3.2.12 Wedge arrays.............................................................................................. 89
3.3 Comparison in between the different shapes using commercial
materials.............................................................................................................................
89
3.4 Optimization of the wedge absorber geometry............................................................ 92
3.4.1 Introduction and state of art......................................................................... 92
3.4.2 Absorber optimization.................................................................................. 94
3.4.2.1 Optimized wedge geometry concept 1......................................... 94
3.4.2.2 Optimized wedge geometry concept 2......................................... 98
3.4.2.2.1 Simulation results......................................................... 99
Used material: epoxy foam loaded with 0.5%
carbon fibers............................................................
99
Used material: commercial material ECCOSORB
LS 24........................................................................
104
3.4.2.3 Optimized wedge geometry concept 3......................................... 105
3.5 Optimization of pyramidal geometry using genetic algorithm.................................... 108
3.6 Optimization of hexagonal geometry........................................................................... 111
3.6.1 Prototype of the optimized shape................................................................. 116
3.6.1.1 Simulation results......................................................................... 116

CONTENTS 9
3.6.1.2 Measurement results..................................................................... 119
3.7 Conclusion................................................................................................................... 121
4. Optimization of Microwave Absorbers Using Metamaterials 123
4.1 Introduction.................................................................................................................. 123
4.2 Metamaterial types and their association with natural absorber materials.................. 123
4.3 Metamaterial structure................................................................................................. 126
4.3.1 Geometry of the metamaterial...................................................................... 126
4.3.2 Influence of the size of the metamaterial..................................................... 135
4.3.3 Measurement results..................................................................................... 137
4.3.4 Absorber associated with metamaterial....................................................... 141
4.3.5 Symmetrical metamaterial........................................................................... 151
4.4 Broadband metamaterial.............................................................................................. 158
4.5 Conclusion................................................................................................................... 163
General conclusion 165
Perspectives........................................................................................................................ 167
Annexes 169
A. Electromagnetic wave propagation in lossy multilayer structures................................ 169
A.1 Reflection coefficient for a single dielectric slab........................................... 170
A.2 Reflection coefficient for two dielectric slabs................................................ 172
A.3 Infinite number of layers................................................................................ 173
A.4 Reflection and transmission coefficients for propagation at oblique
incidence...............................................................................................................
174
A.4.1 Total transmission and Total reflection.......................................... 175
A.4.1.1 Total transmission....................................................................... 175
A.4.1.2 Total reflection............................................................................ 176
B. Review of material characterization techniques............................................................ 177
B.1 Introduction.................................................................................................... 177
B.2 Characterization of ε....................................................................................... 177
B.3 Characterization of μ...................................................................................... 179
C. Nicolson - Ross - Weir (NRW) method........................................................................ 181
Communications and publications 183
Bibliography 185

10 CONTENTS

11
Acronyms
1D One-dimensional
APM Absorbeur Pyramidaux (Pyramidal Absorber)
CNT Carbon NanoTubes
CP Conducting Polymers
CST Computer Simulation Technology
EM Electromagnetic
EMC Electromagnetic Compatibility
EMI Electromagnetic Interference
FSS Frequency Selective Surface
GA Genetic Algorithm
HPBW Half Power Beam Width
IMA Interleaved Metamaterial Array
MMA Microwave Material Absorber
MUT Material Under Test
MUT - MP Material Under Test - Metallic Plate
NRL Naval Research Laboratory
NRW Nicolson - Ross - Weir
OSLT Open, Short circuit, Load and Through line
PEC Perfect Electric Conductor
PU Polyurethane
PS Polystyrene
RCS Radar Cross Section
RF Radio Frequency
SiC Silicon Carbide
TE Transverse Electric
TEM Transverse Electromagnetic
TGM Time Gating Method
TM Transverse Magnetic
UV Ultraviolet
UWB Ultra Wideband
VNA Vector Network Analyzer

12 ACRONYMS

13
List of Tables
TABLE 1.1 Waveguide specifications depending on frequency [8]................................................ 32
TABLE 3.1 Comparison in between different geometries used in anechoic chambers for the size
X1......................................................................................................................................................
90
TABLE 3.2 Comparison in between different geometries used in anechoic chambers for the size
APM12..............................................................................................................................................
91
TABLE. 3.3 Sizes of the commercial wedges.................................................................................. 95
TABLE. 3.4 Dimensions of the optimized wedge............................................................................ 106
TABLE. 3.5 Dimensions of the optimized pyramid......................................................................... 108
TABLE. 3.6 Sizes of the new shape................................................................................................. 111
TABLE 3.7 Pyramid dimensions...................................................................................................... 114
TABLE 4.1 Sizes of the pyramidal shapes....................................................................................... 141
TABLE. 4.2 Dimensions for the two cells........................................................................................ 151

14 LIST OF TABLES

15
List of Figures
FIG. 1.1 Summary of techniques for material characterization a) depending on the frequency
and losses and b) comparison in between methods.........................................................................
30
FIG. 1.2 Calibration for waveguide................................................................................................. 31
FIG. 1.3 S parameters: a) Magnitude and b) Phase for a Teflon sample of 9.7 mm thickness
with the permittivity r=2.1-j0.02 and permeability μr=1.00-j0.001...............................................
32
FIG. 1.4 Complex parameters of the Teflon sample: a) Real part of the permittivity, b)
Imaginary part of the permittivity, c) Real part of the permeability and d) Imaginary part of the
permeability.....................................................................................................................................
33
FIG. 1.5 Illustration of the coaxial probe setup............................................................................... 33
FIG. 1.6 Coaxial probe used............................................................................................................ 34
FIG. 1.7 Open ended coaxial probe real part of the permittivity measurement for a Teflon
material sample................................................................................................................................
34
FIG. 1.8 a) Reflection mode configuration, b) Transmission mode configuration………............. 36
FIG. 1.9 a) Monostatic and b) Bistatic measurements.................................................................... 37
FIG. 1.10 Measurement results obtained using the monostatic and bistatic method...................... 37
FIG. 1.11 Arc length approximations.............................................................................................. 38
FIG. 1.12 a) Frequency domain response for a Teflon material sample, b) Time domain
response, c) Frequency domain response for a Teflon material sample after using TGM, d)
Time domain filtered response........................................................................................................
38
FIG. 1.13 Measurement configuration with the horn antennas................................................. 40
FIG. 1.14 Measurement configurations in a) a multipath environment and b) in anechoic
chamber...........................................................................................................................................
41
FIG. 1.15 Reduction of the effect of moving items in a non-anechoic environment: the entire
setup is moved but keeping the same distance between the antennas and the sample....................
42
FIG. 1.16 a) Measured reflection coefficient in dB for a Teflon material sample in non-
anechoic environment compared to simulation before TGM, b) S11 magnitude after applying
TGM and c) Phase after applying TGM..........................................................................................
44
FIG. 1.17 a) Measured reflection coefficient in dB for a Teflon material sample backed by a
metallic plate in non-anechoic environment compared to simulation before TGM, b) S11
magnitude after applying TGM and c) Phase after applying TGM................................................
44
FIG. 1.18 Measurement and simulation results of the reflection coefficient a) mean value in red
and the superposition of all measurements, b) magnitude and c) phase for a Teflon
sample..............................................................................................................................................
46
FIG. 1.19 Measurement and simulation results of the reflection coefficient a) mean value in red

16 LIST OF FIGURES
and the superposition of all measurements, b) magnitude and c) phase for a Teflon sample
backed with a metallic plate............................................................................................................
47
FIG. 1.20 Permittivity of Teflon..................................................................................................... 48
FIG. 1.21 Measured and simulated results for the reflection coefficient of a) ECCOSORB LS
22 without a metallic plate and b) ECCOSORB LS 22 backed with a metallic plate, c) Phase of
ECCOSORB LS 22 without a metallic plate and d) Phase of ECCOSORB LS 22 backed with a
metallic plate...................................................................................................................................
49
FIG. 1.22 Permittivity of Commercial foam ECCOSOLB LS 22.................................................. 50
FIG. 1.23 Losses for the absorbing commercial material ECCOSORB LS 22............................... 50
FIG. 2.1 Different forms of carbon used for absorber materials: a) particles, b) fibers and c)
nanotubes [52].................................................................................................................................
54
FIG. 2.2 a) Multilayer absorber [70] and b) Commercial multilayer absorber (ECCOSORB-
AN) [77]..........................................................................................................................................
56
FIG. 2.3 a) PS based pyramidal absorbers [81] and b) Rice husk based pyramidal absorbers
[87]..................................................................................................................................................
56
FIG. 2.4 a) The mixture composite put in the mold and b) the mixture composite after foaming
step...................................................................................................................................................
58
FIG 2.5 Representation of the air holes inside the material samples.............................................. 59
FIG. 2.6 Material samples for free space measurement depending on the carbon loading............. 59
FIG. 2.7 Photo of measurement configuration for normal incidence in anechoic chamber of
IETR localized at INSA, Rennes, France........................................................................................
59
FIG.2.8 Simulated and measured reflection coefficient with and without metallic plate,
permittivity, tan and skin depth extracted from the anechoic chamber measurement of the
unloaded epoxy foam (0% wt.).......................................................................................................
60
FIG.2.9 Simulated and measured reflection coefficient with and without metallic plate,
permittivity, tan and skin depth extracted from the anechoic chamber measurement of the
epoxy foams loaded with carbon fibers a) 0.25% wt., b) 0.5% wt., c) 0.75% wt. d) 1% wt. and
e) Permittivity and losses comparison for all load rate composites................................................
61
FIG. 2.10 Measured and simulated results for the reflection coefficient of the a) foam without a
metallic plate mean value, b) foam without a metallic plate, c) foam backed with a metallic
plate mean value and d) foam backed with a metallic plate............................................................
64
FIG. 2.11 Permittivity of the Polymer foam loaded with 0.25% wt. carbon fibers........................ 65
FIG. 2.12 Size of the pyramidal geometry...................................................................................... 65
FIG. 2.13 Simulated reflection coefficients of the APM12 geometry with properties of the
epoxy foams loaded with different rates of carbon fibers (0.25% wt., 0.5% wt., 0.75% wt. and
1% wt.) for a) normal incidence 00, b) oblique incidence of 30
0 and c) oblique incidence of

LIST OF FIGURES 17
450.................................................................................................................................................... 66
FIG. 2.14 Simulated reflection coefficients of the APM12 geometry with the SIEPEL material
(G1) and 0.5% wt. carbon fibers loaded epoxy foam for a) normal incidence 00, b) oblique
incidence of 300 and c) oblique incidence of 45
0............................................................................
67
FIG. 2.15 a) Absorber prototype made of pyramidal epoxy foam loaded with 0.5% carbon
fibers and b) APM12 commercial absorber made of G1 material..................................................
68
FIG. 2.16 Measurement setup in the anechoic chamber for the pyramidal prototypes made of a)
0.5% wt. carbon fibers loaded epoxy foam and b) SIEPEL commercial material G1....................
68
FIG. 2.17 Measurement results of APM12 geometry prototypes made with the SIEPEL PU
foam (G1) and the 0.5% wt. carbon fibers loaded epoxy foam at a) normal incidence and b)
oblique incidence 300......................................................................................................................
69
FIG. 2.18 CHEOPS Anechoic chamber of CELAR (DGA), France.............................................. 69
FIG. 2.19 Radar cross section of the metallic plate for a) horizontal polarization and b) vertical
polarization and SIEPEL absorber for c) horizontal polarization and d) vertical polarization and
for the 0.5% carbon fibers loaded epoxy foam prototype for e) horizontal polarization and f)
vertical polarization.........................................................................................................................
70
FIG. 2.20 Reflection coefficient of the prototypes made of a) SIEPEL absorber for horizontal
polarization, b) SIEPEL absorber for vertical polarization, c) 0.5%wt. carbon fibers loaded
epoxy for horizontal polarization and d) 0.5%wt. carbon fibers loaded epoxy for vertical
polarization......................................................................................................................................
71
FIG. 2.21 Calculated reflection coefficient (from RCS measurements) for SIEPEL absorber and
for the epoxy prototype for a) normal incidence and horizontal polarization, b) normal
incidence and vertical polarization, c) oblique incidence of 30° and horizontal polarization, d)
oblique incidence of 30° and vertical polarization, e) oblique incidence of 45° and horizontal
polarization, d) oblique incidence of 45° and vertical polarization................................................
72
FIG. 2.22 Single dielectric slab................................................................................................. 74
FIG. 2.23 Study as a function of the increased losses of epoxy foam loaded with 0.5% carbon
fibers..............................................................................................................................
75
FIG. 2.24 Study as a function of the decreased losses of epoxy foam loaded with 0.5% carbon
fibers................................................................................................................................................
75
FIG. 2.25 Study as a function of the increased permittivity of epoxy foam loaded with 0.5%
carbon fibers....................................................................................................................................
76
FIG. 2.26 Study as a function of the decreased permittivity of epoxy foam loaded with 0.5%
carbon fibers....................................................................................................................................
76
FIG. 2.27 Study as a function of a lower permittivity and increased losses of epoxy loaded with
0.5% wt. carbon fibers.....................................................................................................................
77

18 LIST OF FIGURES
FIG. 2.28 Study us a function of a higher permittivity and increased losses of epoxy loaded
with 0.5% wt. carbon fibers.............................................................................................................
78
FIG. 3.1 Geometry of a standard twisted pyramidal absorber........................................................ 81
FIG. 3.2 Geometry of a standard double pyramidal absorber......................................................... 82
FIG. 3.3 Geometry of a standard hollow pyramidal absorber......................................................... 82
FIG. 3.4 Geometry of a standard cylinder pyramidal absorber....................................................... 83
FIG.3.5 Geometry of a standard triangular pyramidal absorber..................................................... 83
FIG. 3.6 Geometry of a standard hexagonal pyramidal absorber................................................... 84
FIG. 3.7 Geometry of a standard convoluted microwave absorber................................................. 84
FIG. 3.8 Geometry of a standard pyramidal absorber..................................................................... 85
FIG. 3.9 a) Normal incidence reflectivity performance of pyramidal absorbers, b) Effect of the
carbon loading on the performance of the pyramidal absorber [100] and c) Wide-angle
performance of pyramidal absorbers [100].....................................................................................
85
FIG. 3.10 Possible reflection paths from regular pyramids............................................................ 87
FIG. 3.11 Geometry of a standard truncated pyramidal absorber................................................... 87
FIG. 3.12 Geometry of a standard wedge microwave absorber...................................................... 88
FIG. 3.13 Different wedge arrangements for the absorber.............................................................. 88
FIG. 3.14 Geometry of a standard oblique wedge microwave absorber......................................... 88
FIG. 3.15 Geometry of a standard wedge arrays absorber.............................................................. 89
FIG. 3.16 Comparison between the different reflection coefficients at normal incidence for the
different geometries X1...................................................................................................................
90
FIG. 3.17 Comparison between the different reflection coefficients at normal incidence for the
different geometries APM12...........................................................................................................
91
FIG. 3.18 a) Initial pyramidal structure and b) Optimized structure............................................... 92
FIG. 3.19 Reflection coefficient of the optimized pyramidal structure [78]................................... 93
FIG. 3.20 a) Arbitrary curved pyramidal geometry built from 10 truncated linear pyramids and
b) Comparison in between a traditional pyramidal absorber (red curve) and the optimized
geometry in the frequency range 1 - 2 GHz [106]..........................................................................
93
FIG. 3.21 Natural evolution............................................................................................................ 94
FIG. 3.22 Realization process of the wedge: a) Original commercial wedge, b) Angle cut of the
wedge and c) Polarization...............................................................................................................
94
FIG. 3.23 Characteristics of the commercial materials a) G1 and b) G2 from Siepel.................... 95
FIG. 3.24 Comparison in between different cut angles for the commercial a) ADM3 and b)
ADM5..............................................................................................................................................
96
FIG 3.25 Simulation results for the commercial wedges using a cut angle of 600 at normal and
oblique incidence (450) for a) ADM5, b) ADM9 and c) ADM12...................................................
96

LIST OF FIGURES 19
FIG. 3.26 Straight wedge absorber in a) Side view and b) Top view............................................. 98
FIG. 3.27 Characteristic of the epoxy foam.................................................................................... 99
FIG. 3.28 Choosing the best arrangement for the wedges.............................................................. 100
FIG. 3.29 Influence of the polarization........................................................................................... 100
FIG. 3.30 Proposed optimized wedge geometry............................................................................. 101
FIG. 3.31 Simulation results at normal incidence for the epoxy foam........................................... 101
FIG. 3.32 Rotation at 450 of the wave around the asymmetrical structure at a) 0
0, b) 60
0, c) 100
0
and d)1800........................................................................................................................................
102
FIG. 3.33 Comparison between the original geometry and the optimized one for the epoxy
foam at a) Vertical polarization at oblique incidence (300), b) Horizontal polarization at oblique
incidence (300), c) Vertical polarization at oblique incidence (45
0) and d) Horizontal
polarization at oblique incidence (450)............................................................................................
102
FIG. 3.34 Comparison between the original geometry and the optimized one at oblique
incidence (300) for phi=0
0 - 360
0 using the epoxy foam material...................................................
103
FIG. 3.35 Comparison between the original geometry and the optimized one at oblique
incidence (450) for phi=0
0 - 360
0 using the epoxy foam material....................................................
103
FIG. 3.36 Characteristic of the commercial absorber ECCOSORB LS 24..................................... 104
FIG. 3.37 Simulation results at normal incidence for the commercial material ECCOSORB LS
24.....................................................................................................................................................
104
FIG. 3.38 Comparison between the original geometry and the optimized one at oblique
incidence (300) for phi=0
0 - 360
0 using the commercial ECCOSORB LS 24 material...................
105
FIG. 3.39 Comparison between the original geometry and the optimized one at oblique
incidence (450) for phi=0
0 - 360
0 using the commercial ECCOSORB LS 24 material..................
105
FIG. 3.40 Original commercial wedge............................................................................................ 105
FIG. 3.41 Size of the optimized wedge........................................................................................... 106
FIG. 3.42 Simulation results for the optimized wedge in comparison with the original wedge at
a) Normal incidence, b) Oblique incidence (300) and c) Oblique incidence (45
0)..........................
107
FIG. 3.43 Pyramidal geometry chosen............................................................................................ 108
FIG. 3.44 Size of the optimized pyramid........................................................................................ 109
FIG. 3.45 Simulation results for the optimized pyramid (red curve) in comparison with the
original pyramid at a) Normal incidence, b) Oblique incidence (300) and c) Oblique incidence
(450).................................................................................................................................................
110
FIG. 3.46 a) Dimensions of the new geometry for APM12, b) Perspective view of the new
shape, c) Plan view of the new shape..............................................................................................
111
FIG. 3.47 E-field comparison between pyramid and optimized shape at specific frequencies and
different parts of the structures........................................................................................................
112

20 LIST OF FIGURES
FIG. 3.48 Comparison in between the simulation results obtained for the new shape (red and
blue curves) and the pyramidal form (black curve) using the polyurethane foams G2 and G1 for
the sizes a)APM9, b)APM12, c)APM20.........................................................................................
115
FIG. 3.49 TE polarization................................................................................................................ 117
FIG. 3.50 TM polarization.............................................................................................................. 117
FIG. 3.51 Comparison in between the simulation results obtained for the new shape (blue
curve) and the pyramidal form (black curve) using the carbon fibers loaded epoxy foam with
a)0.25% carbon fibers, b)0.5% carbon fibers, c)0.75% carbon fibers, d)1% carbon
fibers................................................................................................................................................
117
FIG. 3.52 a) Pyramidal shape made of epoxy foam loaded with 0.5% carbon fibers and b) New
optimized shape made of epoxy foam loaded with 0.5% carbon
fibers................................................................................................................................................
119
FIG. 3.53 Measurement setup in the anechoic chamber for the a) pyramidal materials and b)
new optimized shape.......................................................................................................................
120
FIG. 3.54 Simulation and measurement results for the pyramidal shape and the new shape
made of epoxy loaded with 0.5% carbon fibers 3 mm at a) Normal incidence and b) Oblique
incidence (300).................................................................................................................................
120
FIG. 4.1 Examples of broadband metamaterials............................................................................. 123
FIG. 4.2 Examples of incorporating an artificial material on natural pyramidal absorber............. 125
FIG. 4.3 The two resonators: Reflection coefficient versus frequency for vertical and horizontal
polarization for a) Snake shape cell and b) Spiral shape cell..........................................................
126
FIG. 4.4 Periodicity of the small resonators.................................................................................... 127
FIG. 4.5 a) Interleaved metamaterial array, b) Photo of the fabricated sample.............................. 128
FIG. 4.6 Simulated results for the final IMA at normal incidence depending on polarization....... 128
FIG. 4.7 Optimal distance in between the two small cells.............................................................. 128
FIG. 4.8 Current distribution for the top layer of the IMA for horizontal polarization at 4.74
GHz.................................................................................................................................................
129
FIG. 4.9 Current distributions for the top layer of the IMA for vertical polarization at a) 7.149
GHz, b) 8.89 GHz, c) 9.78 GHz and d) 14.04 GHz........................................................................
129
FIG. 4.10 Different configurations of the IMA............................................................................... 130
FIG. 4.11 Only snake shaped metamaterial configuration 1........................................................... 131
FIG. 4.12 Only snake shaped metamaterial configuration 2........................................................... 132
FIG. 4.13 Only spiral shaped metamaterial configuration 1........................................................... 132
FIG. 4.14 Only spiral shaped metamaterial configuration 2........................................................... 132
FIG. 4.15 Rotated snake shaped IMA............................................................................................. 133
FIG. 4.16 Rotated spiral shaped IMA............................................................................................. 133

LIST OF FIGURES 21
FIG. 4.17 Reversed place in between the cells of the IMA............................................................. 134
FIG. 4.18 Double layer IMA with the top layer rotated at 900........................................................ 134
FIG. 4.19 Triple layer IMA with the two top layers rotated at 900................................................. 135
FIG. 4.20 a) Half size proposed IMA b) Original proposed IMA and c) Double size
IMA.................................................................................................................................................
135
FIG. 4.21 Simulation results at normal incidence for the miniaturization and maximization of
the IMA depending on polarization.................................................................................................
136
FIG. 4.22 a) Anechoic chamber measurement at IETR of Rennes, France and b) CHEOPS
Anechoic chamber from CELAR (DGA), France...........................................................................
137
FIG. 4.23 Simulated and measured reflection coefficient of the IMA at a) vertical polarization
and b) horizontal polarization................................................................................
137
FIG. 4.24 Simulated and measured results for the IMA at oblique incidence depending on
polarization for a)150, b) 30
0, c) 45
0 and d) 60
0..............................................................................
138
FIG. 4.25 Radar cross section of a) A perfect electric conductor (metallic plate of 2 mm
thickness), b) Metamaterial for vertical polarization and c) Metamaterial for horizontal
polarization......................................................................................................................................
139
FIG. 4.26 Reflection coefficient of the metamaterial depending on the angle of incidence
between -600 - 60
0 and frequency for a) Vertical polarization and b) Horizontal polarization.......
140
FIG. 4.27 Pyramidal absorber loaded with metamaterial................................................................ 141
FIG. 4.28 Chosen size of the pyramidal geometry.......................................................................... 141
FIG. 4.29 Skin depth and attenuation of the natural absorber G1................................................... 142
FIG. 4.30 Measurement and simulation results at Vertical polarization for the pyramidal
absorber APM12 with IMA at a) Normal incidence and b) Oblique incidence (450).....................
142
FIG. 4.31 Measurement and simulation results at Horizontal polarization for the pyramidal
absorber APM12 with IMA at a) Normal incidence and b) Oblique incidence (450).....................
143
FIG. 4.32 a) Simulations and b) measurements at oblique incidence between 150
- 600 for
APM12 + IMA................................................................................................................................
143
FIG. 4.33 Measurement and simulation results at Vertical polarization for the pyramidal
absorber X1 with IMA at a) Normal incidence and b) Oblique incidence (450).............................
144
FIG. 4.34 Measurement and simulation results at Horizontal polarization for the pyramidal
absorber X1 with IMA at a) Normal incidence and b) Oblique incidence (450).............................
145
FIG. 4.35 Measurements at oblique incidence between 150 - 60
0 for X1 + IMA............................ 146
FIG. 4.36 Radar cross section results obtained in the CHEOPS anechoic chamber from CELAR
(DGA) for a) Pyramidal geometry APM12, b) Pyramidal geometry APM12 with MM at
Vertical polarization and c) Pyramidal geometry APM12 with MM at Horizontal
polarization......................................................................................................................................
147

22 LIST OF FIGURES
FIG. 4.37 Reflection coefficient of a) Pyramidal geometry APM12, b) Pyramidal geometry
APM12 with metamaterial at Vertical polarization, c) Pyramidal geometry APM12 with
metamaterial at Horizontal polarization, d) Pyramidal geometry APM12 with metamaterial at
Vertical polarization (curve representation) and e) APM12 with metamaterial at Horizontal
polarization (curve representation)..................................................................................................
148
FIG. 4.38 Radar cross section results obtained in the CHEOPS anechoic chamber from CELAR
(DGA) for a) Pyramidal geometry X1, b) Pyramidal geometry X1 with MM at Vertical
polarization and c) Pyramidal geometry X1 with MM at Horizontal polarization.........................
149
FIG. 4.39 Reflection coefficient of a) Pyramidal geometry X1, b) Pyramidal geometry X1 with
metamaterial at Vertical polarization, c) Pyramidal geometry X1 with metamaterial at
Horizontal polarization, d) Pyramidal geometry X1 with metamaterial at Vertical polarization
(curve representation) and e) X1 with metamaterial at Horizontal polarization (curve
representation).................................................................................................................................
150
FIG. 4.40 The two resonators: Reflection coefficient versus frequency for vertical and
horizontal polarization for a) Symmetrical snake shape cell and b) Symmetrical spiral shape
cell...................................................................................................................................................
151
FIG. 4.41 a) Interleaved metamaterial array................................................................................... 152
FIG. 4.42 Simulated and measured results for the final IMA at normal incidence depending on
polarization: a) Vertical polarization and b) Horizontal polarization.............................................
152
FIG. 4.43 Chosen size of the pyramidal geometry.......................................................................... 153
FIG. 4.44 Simulation and measurement results for the pyramidal absorber X1 with IMA for
Vertical polarization at a) normal incidence and b) oblique incidence (450)..................................
153
FIG. 4.45 Simulation and measurement results for the pyramidal absorber X1 with IMA for
Horizontal polarization at a) normal incidence and b) oblique incidence (450) .............................
154
FIG. 4.46 Simulation results for the pyramidal absorber X1 with 2 layers IMA for Vertical
polarization at a) Normal incidence and b) Oblique incidence (450)..............................................
155
FIG. 4.47 Simulation results for the pyramidal absorber X1 with 2 layers IMA for Horizontal
polarization at a) Normal incidence and b) Oblique incidence (450)..............................................
155
FIG. 4.48 Simulation results for the pyramidal absorber X1 with 2 layers IMA with the top
layer rotated to 900 for Vertical polarization at a) Normal incidence and b) Oblique incidence
(450).................................................................................................................................................
156
FIG. 4.49 Simulation results for the pyramidal absorber X1 with 2 layers IMA with the top
layer rotated to 900 for Horizontal polarization at a) Normal incidence and b) Oblique incidence
(450).................................................................................................................................................
157
FIG. 4.50 Simulation results for the broadband polarization independent metamaterial................ 158
FIG 4.51 Natural absorber placement on the broadband metamaterial........................................... 159
LIST OF FIGURES 23
FIG. 4.52 Simulation results for the optimized metamaterial......................................................... 159
FIG 4.53 Simulation results for the pyramid APM12 in combination with the broadband
metamaterial placed: a) under the pyramidal base and b) inside the pyramidal base.....................
160
FIG. 4.54 Simulation results at oblique incidence using the metamaterial inside the pyramidal
base of APM12................................................................................................................................
161
FIG. 4.55 Simulation results at normal and oblique incidence for the optimized bottom layer of
the metamaterial..............................................................................................................................
161
FIG. 4.56 Simulation results for the optimized metamaterial that has resonant frequencies from
1.9 GHz...........................................................................................................................................
162
FIG. 4.57 Simulation results for the pyramidal absorber APM12 in combination with the
optimized metamaterial...................................................................................................................
162
FIG. A.1 Orientation of the electric field........................................................................................ 169
FIG. A.2 Single dielectric slab........................................................................................................ 170
FIG. A.3 Single dielectric slab backed by a metallic plate............................................................. 171
FIG. A.4 Two dielectric slabs......................................................................................................... 172
FIG A.5 Infinite number of dielectric slabs.................................................................................... 173
FIG A.6 Propagation at oblique incidence...................................................................................... 174
FIG. B.1 Frequency dependence of permittivity in the microwave field [24]................................ 177
FIG. B.2 Frequency variation of complex permeability in a ferrite (ω=20π GHz, ωm=11.2π
GHz, α=0.05) [24, 139]...................................................................................................................
179
FIG. C.1 Process for the NRW method........................................................................................... 181

24 LIST OF FIGURES

1
Résumé
Les matériaux absorbants des ondes électromagnétiques sont des éléments importants pour
l'évaluation de nombreux systèmes électroniques militaires mais également civils. Ces matériaux sont
utilisés, par exemple, pour la réduction des interférences électromagnétiques (EMI) dans divers
composants sans fils, la réduction de la surface équivalente radar (SER) ou comme absorbants à
l'intérieur des chambres de mesures. C’est cette dernière application qui est visée par les travaux de
cette thèse. L’objectif de mes travaux de thèse est d’optimiser des matériaux absorbants utilisés dans
les chambres anéchoïques. La géométrie et la composition du matériau absorbant sont les deux
paramètres qui influencent la capacité d’absorption de l’onde électromagnétique par un matériau. Ce
seront donc les deux pistes d’optimisation explorées durant cette thèse. Notre but est d’obtenir les
absorbants présentant les plus faibles coefficients de réflexion et de transmission, soit une absorption
élevée, ceci dans une large bande de fréquence.
Le premier chapitre de cette thèse sera dédié aux techniques de caractérisation diélectriques
des matériaux. Un bref état de l’art des différentes techniques existantes sera tout d’abord effectué.
Une nouvelle technique de caractérisation large bande, et en milieu non anéchoïque, sera proposée et
validée par la caractérisation de matériaux commerciaux aux caractéristiques diélectriques connues.
Dans le second chapitre, un nouveau matériau absorbant (à base de mousse époxy chargée
avec des fibres de carbone) sera étudié. La caractérisation diélectrique d’échantillons avec différents
taux de charge sera tout d’abord menée. Dans le but de sélectionner la composition présentant les
meilleurs performances d’absorption, on simulera ensuite un absorbant pyramidal en utilisant les
caractéristiques diélectriques expérimentales. Un prototype sera alors réalisé, caractérisé et comparé à
l’absorbant du commerce de même dimensions.
Dans le chapitre trois, l’optimisation de la forme de l’absorbant sera étudiée. Des simulations
numériques utilisant l’algorithme générique seront tout d’abord menées afin d’obtenir la forme
présentant la meilleure absorption. Un prototype présentant une des formes optimisées sera réalisé en
utilisant le nouveau matériau absorbant à base de mousse époxy. Ce prototype sera mesuré et comparé
au premier prototype pyramidal à base de mousse époxy.
Dans le dernier chapitre de cette thèse, l’optimisation des performances d’absorption sera
étudiée par l’association des absorbants pyramidaux du commerce à des métamatériaux. Trois
structures (deux structures 2D et une structure 3D) seront étudiées par simulation. Des prototypes des
matériaux hybrides « absorbant pyramidal du commerce + métamatériaux 2D » seront réalisés,
caractérisés et comparés à l’absorbant pyramidal seul.
Ce résumé de la thèse présente les principaux résultats des différents travaux cités auparavant.
Quatre paragraphes détaillent les quatre chapitres de la thèse, rédigée en anglais, suivis par une
conclusion et des perspectives.
2 RESUME
Le Chapitre 1 est dédié aux techniques de caractérisation des matériaux. Un état de l’art des
différentes techniques utilisées pour la détermination des propriétés diélectriques des matériaux est
d’abord présenté. Pour chaque méthode, les avantages et les inconvénients sont spécifiés.
Dans ce même chapitre, une nouvelle méthode de caractérisation diélectrique des matériaux,
réalisable dans un environnement non-anéchoïque (souvent nécessaire pour les caractérisations en
large bande) est proposée et détaillée. Cette technique permet l'extraction du coefficient de réflexion
du matériau caractérisé. Comme cette technique est utilisée en milieu non-anéchoïque, et afin de
réduire les effets de la propagation par trajets multiples, une mesure bistatique est réalisée à différentes
distances Antennes - Matériaux en champ lointain. Par la suite, la méthode de « de-embedding » est
utilisée afin de déterminer les paramètres S et la permittivité complexe du matériau.
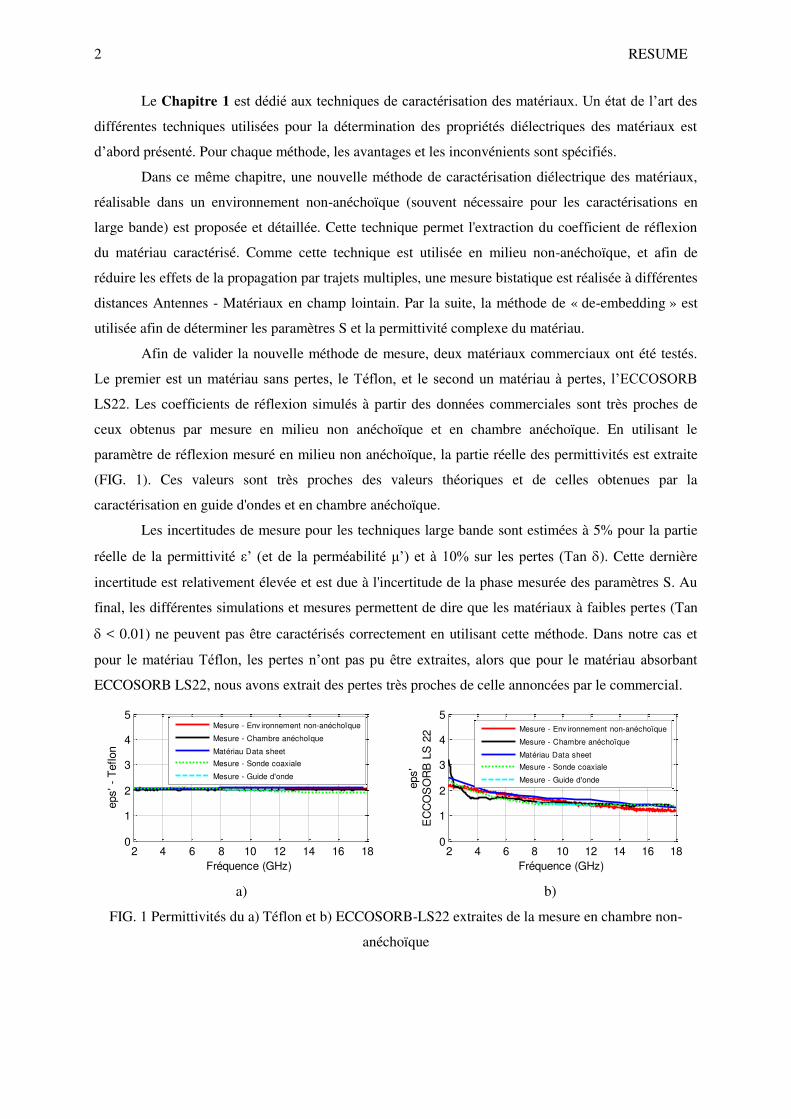
Afin de valider la nouvelle méthode de mesure, deux matériaux commerciaux ont été testés.
Le premier est un matériau sans pertes, le Téflon, et le second un matériau à pertes, l’ECCOSORB
LS22. Les coefficients de réflexion simulés à partir des données commerciales sont très proches de
ceux obtenus par mesure en milieu non anéchoïque et en chambre anéchoïque. En utilisant le
paramètre de réflexion mesuré en milieu non anéchoïque, la partie réelle des permittivités est extraite
(FIG. 1). Ces valeurs sont très proches des valeurs théoriques et de celles obtenues par la
caractérisation en guide d'ondes et en chambre anéchoïque.
Les incertitudes de mesure pour les techniques large bande sont estimées à 5% pour la partie
réelle de la permittivité ε’ (et de la perméabilité μ’) et à 10% sur les pertes (Tan ). Cette dernière
incertitude est relativement élevée et est due à l'incertitude de la phase mesurée des paramètres S. Au
final, les différentes simulations et mesures permettent de dire que les matériaux à faibles pertes (Tan
< 0.01) ne peuvent pas être caractérisés correctement en utilisant cette méthode. Dans notre cas et
pour le matériau Téflon, les pertes n’ont pas pu être extraites, alors que pour le matériau absorbant
ECCOSORB LS22, nous avons extrait des pertes très proches de celle annoncées par le commercial.
a) b)
FIG. 1 Permittivités du a) Téflon et b) ECCOSORB-LS22 extraites de la mesure en chambre non-
anéchoïque
2 4 6 8 10 12 14 16 180
1
2
3
4
5
Fréquence (GHz)
eps' -
Teflon
Mesure - Env ironnement non-anéchoïque
Mesure - Chambre anéchoïque
Matériau Data sheet
Mesure - Sonde coaxiale
Mesure - Guide d'onde
2 4 6 8 10 12 14 16 180
1
2
3
4
5
eps'
EC
CO
SO
RB
LS
22
Fréquence (GHz)
Mesure - Env ironnement non-anéchoïque
Mesure - Chambre anéchoïque
Matériau Data sheet
Mesure - Sonde coaxiale
Mesure - Guide d'onde

RESUME 3
Le Chapitre 2 présente l’étude menée sur un nouveau matériau absorbant, élaboré dans
l’équipe Matériaux Fonctionnels de l’IETR située à St Brieuc, dans le but de mettre en évidence son
potentiel d’utilisation en tant qu’absorbant en chambre anéchoïque.
Actuellement, les absorbants les plus utilisés en chambres anéchoïques sont les absorbants de
forme pyramidales composés d’une mousse polyuréthane imprégnée d’une solution carbonée. Ces
mousses présentent l’avantage d’une faible densité et d’un faible cout, mais présente également des
inconvénients. En effet, la mousse polyuréthanne est très souple et induit un usinage difficile et non
reproductible des absorbants. De plus, cette souplesse ne permet pas d’envisager l’utilisation de
formes complexes qui pourrait améliorer les performances d’absorption de ces matériaux.
Le nouveau matériau absorbant, développé dans le cadre de la thèse de Chloé Méjean, est
composé d’une mousse époxy chargée en fibres de carbone de 3 mm de long. Ce matériau permet,
grâce à la rigidité de la mousse époxy, une découpe plus facile et reproductible. Des composites avec
différents pourcentages massiques en fibres de carbone (FIG. 2) ont été réalisés et caractérisés en
chambre anéchoïque pour déterminer leurs propriétés diélectriques.
Taux de fibres de
carbone (% wt.) 0% 0.25% 0.5% 0.75% 1%
Echantillons
FIG. 2 : Photos d’échantillons mousses époxy chargées avec différents taux massiques en fibres de
carbone
Par la suite, les propriétés diélectriques de ces composites, extraites à partir des mesures, ont
été utilisées pour la simulation du coefficient de réflexion d’un absorbant pyramidal. Suivant les
propriétés diélectriques des composites, la géométrie des absorbants commerciaux APM9 ou APM12
de SIEPEL a été privilégiée pour la simulation et a permis d’estimer le potentiel d’utilisation de ces
composites autant qu’absorbant en chambres anéchoïques. Les différents résultats montraient un fort
potentiel d’absorption, comparable aux matériaux du commerce, voire meilleur pour certaines
fréquences.
Afin de confirmer ces résultats et de valider le potentiel de ces matériaux composites, un
prototype a été réalisé avec le composite mousse époxy chargée avec 0.5% en fibres de carbone. Ce
dernier taux de charge a été choisie car il présente le meilleur compromis : faible permittivité (afin de
minimiser la réflexion à l’interface air / matériau), fortes pertes diélectriques (afin de maximiser
l’absorption dans le matériau) et une bonne homogénéité du matériau. Les propriétés diélectriques de

4 RESUME
ce composite (’ et Tan ), extraites à partir de la mesure en chambre anéchoïque, sont présentés FIG.
3.
a) b)
FIG. 3 : Permittivité a) et pertes diélectriques b) du composite mousse époxy chargée avec 0.5% de
fibres de carbone extraites à partir de la mesure en chambre anéchoïque
La géométrie retenue pour ce prototype, et qui est la plus adaptée au composite choisie (0.5%
de fibres de carbone), est celle de l’absorbant commercial APM12. La FIG. 4. montre la photo du
prototype réalisé ainsi que l’absorbant commercial utilisé pour cette étude. Ces deux absorbants sont
constitués de 64 pyramides positionnés côte à côte.
a) b)
FIG. 4 : a) Prototype mousse époxy chargé avec 0.5% de fibres de carbone b) Absorbant commercial
APM12
La FIG. 5.a montre la simulation du prototype (à partir des caractérisations obtenues en
chambre anéchoïque) ainsi que le résultat de mesure, en chambre anéchoïque de ce prototype. Une
bonne concordance est à noter entre ces deux résultats. Ceci valide, par ailleurs, la technique
d’extraction des propriétés diélectriques pas la mesure en chambre anéchoïque. La FIG. 5.b compare la
mesure du prototype époxy chargée en fibres de carbone à l’absorbant du commerce APM12. Les
deux absorbants montrent des résultats comparables sur toute la gamme de fréquence étudiée, voire
meilleurs pour le prototype époxy dans la gamme de fréquence allant de 3 à 7 GHz. Les mêmes
résultats ont été constatés en incidence oblique (30°).
2 4 6 8 10 12 14 16 180
1
2
3
4
5
Fréquence (GHz)
Eps'
0.5%
2 4 6 8 10 12 14 16 180
0.5
1
Fréquence (GHz)
Tan d
elta
0.5%

RESUME 5
a) b)
FIG. 5 : a) La mesure du prototype comparée à la simulation b) la mesure du prototype comparée à la
mesure du matériau commercial APM12
Dans ce même chapitre, des simulations ont été menées, à partir des propriétés des matériaux
composites élaborés, mais également en utilisant les caractéristiques des matériaux absorbants du
commerce, afin de déterminer les propriétés de l’absorbant idéal. Cette étude a montré que la partie
réelle de la permittivité doit être la plus proche possible de l’air (espace libre) afin d’éviter la
discontinuité du milieu et ainsi éviter la réflexion (comme dit auparavant). Par ailleurs, les pertes
doivent être élevées pour pouvoir absorber l’onde, mais si celles-ci sont trop élevées (Tg >> 1), la
partie imaginaire de la permittivité sera très élevée (ε’’>>1) résultant en une forte conductivité
électrique σ = ωε" >> 1, ce qui va au final induire une grande réflexion.
Le Chapitre 3 traite des différentes géométries des absorbants utilisées en chambres
anéchoïques. Selon le type de caractérisation réalisée en chambre anéchoïque ainsi que la bande de
fréquences de caractérisation (qui peut varier de 300 MHz à 300 GHz), différentes géométries et
compositions peuvent être utilisées pour atténuer l'énergie des ondes électromagnétiques incidentes.
Un état de l’art des géométries d’absorbants est tout d’abord présenté dans ce chapitre, suivi par la
proposition, la réalisation et la mesure d’une nouvelle géométrie adaptée aux nouveaux matériaux
composites (rappelons que ces derniers présentent l’avantage d’être usinable sous des formes
complexes). Dans ce chapitre, les méthodes théoriques d’optimisation ainsi que quelques résultats
(formes optimisées) sont présentées.
Actuellement, différentes géométries d’absorbants sont utilisées en chambres anéchoïque,
néanmoins, la géométrie la plus répandue et qui montre les meilleures performances jusque-là est celle
de l’absorbant pyramidal. Dans ce chapitre, nous avons présenté une nouvelle géométrie, inspirée de
la géométrie pyramidale classique et de la géométrie hexagonale, et qui permet d'augmenter
l'absorption et ainsi améliorer les performances de réflexion (minimiser ce paramètre) dans une
chambre anéchoïque. La nouvelle géométrie ainsi que le prototype réalisé sont présentés en FIG. 6.
Pour ce second prototype, la même composition (mousse époxy + 0.5% de fibres de carbone) a été
utilisée afin de pouvoir comparer les deux prototypes réalisés.
2 4 6 8 10 12 14 16 18-80
-60
-40
-20
0
Fréquence (GHz)
S11 (
dB
)
Simulation - Prototype
Mesure - Prototype
2 4 6 8 10 12 14 16 18-80
-60
-40
-20
0
Fréquence (GHz)
S11 (
dB
)
Mesure - Absorbant commercial
Mesure - Prototype

6 RESUME
a) b)
FIG. 6 a) Schéma de la géométrie optimisée et b) photo du prototype réalisé suivant cette géométrie
Les résultats de mesure de ce nouveau prototype sont comparés à la mesure du premier
prototype pyramidal sur la FIG. 7. Celle-ci montre une nette diminution du coefficient de réflexion et
cela suivant les deux polarisations TM et TE. Un gain moyen, calculé sur toute la gamme de
fréquence, d’environ 8 dB et 9 dB est à noter, respectivement pour la polarisation TE et TM. De plus,
un bon accord a été observé entre les résultats de simulations et ceux de mesures.
FIG. 7 Comparaison de la mesure du prototype optimisé et du prototype pyramidal à base de mousse
époxy chargée en fibres de carbone
Dans la dernière partie de ce chapitre, l'optimisation des structures d'absorbants
électromagnétiques, utilisant l'algorithme génétique, a été étudiée. En effet, la nécessité d'obtenir des
formes plus parfaites et aussi de meilleurs résultats d’absorption pour des applications spécifiques
devient évidente et a conduit au développement de différents outils d'optimisation.
Dans cette partie, et après avoir expliqué les différentes méthodes d’optimisation des formes
ainsi que le processus d'optimisation basé sur l’algorithme génétique, différentes formes optimisées
obtenues sont montrées et expliquées. Une optimisation de l’absorbant dièdre, utilisé également en
chambres anéchoïques mais qui souffre d’une forte réflexion pour les incidences obliques de l’onde
électromagnétique, a été réalisée. L’algorithme génétique a permis d’obtenir une forme avec un faible
coefficient de réflexion dans une large bande de fréquence.
2 4 6 8 10 12 14 16 18-80
-60
-40
-20
0
Fréquence (GHz)
S11 (
dB
)
Mesure Chambre anéchoïque - Incidence normale (00)
Pyramid
Nouveau prototype TE
Nouveau prototype TM

RESUME 7
Le Chapitre 4 présente une autre possibilité d’optimisation des absorbants par leur association
avec des métamatériaux. Au cours de ma thèse, j’ai tout d’abord étudié l’impact de l’association de
deux métamatériaux de structure 2D sur les performances d’absorption d’un matériau du commerce.
Les structures 2D ont été réalisées et caractérisées (toute seule et en association avec un matériau
absorbant du commerce). Par la suite, j’ai étudié, par simulation numérique, l’impact de l’association
d’une troisième géométrie de métamatériau, avec une structure 3D, au même absorbant naturel du
commerce.
Les métamatériaux ont attiré l'attention et ont été intensément étudiés autant qu’absorbants au
cours des dix dernières années. Dans ce chapitre, un matériau hybride, associant un métamatériau
(matériau artificiel) à un absorbant naturel (absorbant du commerce) afin d'améliorer sa compacité et
ses propriétés d'absorption, a été étudié. Le premier Absorbants Microondes à base de Métamatériaux
(AMM) que nous avons choisie pour cette étude est constitué de deux cellules unitaires résonnantes
(FIG. 8.a et 8.b) imprimées sur un substrat commercial (Arlon) d’une épaisseur de 1,5 mm et de
permittivité ε = 2,2. Le dos du substrat est métallisé et considéré comme un plan de masse. Les deux
cellules de métamatériau sont composées chacune d’un résonateur rectangulaire fonctionnant dans des
gammes de fréquences distinctes. La première cellule (inspirée de la bibliographie), référencée A,
possède une forme de méandre qui résonne à 2 GHz. La seconde cellule, référencée B, est de forme
spirale et résonne à 6 et à 10 GHz. La structure finale, constituée d’un damier associant ces deux
cellules unitaires (FIG. 8.c) fonctionne à différentes gammes de fréquences. Un prototype de cette
structure périodique de dimensions 19 x 19 cm², a été réalisé (FIG. 8.d) et caractérisé en chambre
anéchoïque.
a) b) c) d)
FIG. 8 Géométrie du premier métamatériau utilisé : a) cellule unitaire A, b) cellule unitaire B, c)
Structure globale et d) Photo du prototype réalisé
Les FIG. 9.a et 9.b présentent les résultats de simulation et de mesure de la première structure
AMM seule (avant son association au matériau naturel) pour une polarisation de l’onde
électromagnétique horizontale et verticale. Sur ces figures nous retrouvons les absorptions attendues à
plusieurs bandes de fréquences prévues par la simulation (fréquences de résonances des cellules seules
et de leur association). La différence entre la mesure et la simulation est principalement dû au fait que

8 RESUME
nous avons utilisé une structure finie du métamatériau pour la mesure alors qu’elle est infinie pour la
simulation.
a) b)
FIG. 9 Coefficient de réflexion simulé et mesurée de l’AMM tout seul pour une polarisation de l’onde
a) verticale et b) horizontale
Afin de valider le principe d’utilisation d’un matériau artificiel pour optimiser l’absorption
d’un matériau naturel, deux matériaux absorbants pyramidaux naturels sont utilisés. Ces absorbants
pyramidaux sont à base de mousse de polyuréthane imprégnée d’une solution carbonée (Absorbants
SIEPEL). Le premier matériau utilisé est l’APM12 et le second (qui sera noté ici X1) est composé du
même matériau que l’APM12 mais les dimensions des pyramides de celui-ci sont diminuées (Tableau
1) par rapport à l’APM12. Pour le matériau hybride, la structure AMM est placée au dos du matériau
absorbant (colée à la base rectangulaire de chaque pyramide) comme montré en TABLEAU 1.
L’absorbant
pyramidal
dimensions Géométrie
A (mm) B (mm) C (mm)
X1 38 13 89
APM12 38 25 115
TABLEAU 1 Tailles des absorbants pyramidaux utilisés
Les résultats de simulation (réalisée avec CST Microwave Studio en utilisant le domaine (ou
réponse) fréquentiel et les conditions aux limites de Floquet) ainsi que les mesures du matériau
hybride à base de l’absorbant APM12 ont montré une très faible amélioration du coefficient de
réflexion lors de l’ajout du métamatériau, alors que le second matériau hybride (à base de l’absorbant
X1) montre une nette amélioration du coefficient de réflexion. En effet, une amélioration de
l’absorption avec un gain maximum de 20 dB est mesurée entre 8 et 15 GHz en incidence normale et
pour une polarisation verticale de l’onde électromagnétique (FIG. 10.a). Ce gain était de 5 dB pour le
premier matériau hybride à base de l’APM12. Pour une polarisation horizontale de l’onde
2 4 6 8 10 12 14 16 18-40
-30
-20
-10
0
Fréquence (GHz)
S11
(dB) - Incidence normale
Polarisation verticale
Simulation
Mesure
2 4 6 8 10 12 14 16 18-40
-30
-20
-10
0
Fréquence (GHz)
S11
(dB) - Incidence normale
Polarisation horizontale
Simulation
Mesure
Couche de
cuivre continue
A
B
C IMA

RESUME 9
électromagnétique, l’optimisation de l’absorbant « X1 + Métamatériau » est obtenue dans la gamme
de fréquence entre 4 et 6 GHz et le gain ici est d’un maximum de 15 dB alors qu’aucun gain n’a été
observé sur le matériau hybride à base de l’APM12. En incidence oblique, des gains aussi intéressants
qu’en incidence normale, ont été observés avec la structure « X1 + Métamatériau ». La FIG. 10 montre
les résultats de la structure AMM associée au matériau naturel X1.
a)
b)
FIG. 10 Résultats de simulation et de mesure en incidence normale pour l’absorbant pyramidal X1
associé à l’AMM pour une polarisation a) verticale et b) horizontale
Nous pouvons conclure, à partir des différents résultats de simulation et de mesures obtenues
pour ce premier matériau hybride (naturel + artificiel) réalisé avec la première géométrie AMM
proposée, que l’association du métamatériau 2D à un absorbant ayant la composition et la géométrie
optimale (ce qui est le cas des absorbants du commerce et de l’APM12 utilisé) n'apporte pas
d’amélioration sur le coefficient de réflexion de l’absorbant pyramidal car l’onde électromagnétique
sera complètement absorbée avant d’atteindre le métamatériau. Par contre, cette association aura tout
son intérêt si les dimensions de l’absorbant sont diminuées (le cas du matériau X1 étudié ici). Dans ce
cas, le métamatériau permettra de diminuer la réflexion du matériau en absorbant la partie de l’onde
qui n’a pas été absorbée par le matériau et qui a atteint le dos de la pyramide. Par contre, nous avons
remarqué que le gain obtenu ici est fonction de la polarisation : optimisation dans la gamme des
fréquences basses (entre 4 et 6 GHz) pour une polarisation horizontale, et dans la gamme des
fréquences hautes (au-delà de 8 GHz) pour une polarisation verticale. Ceci est dû à l’asymétrie de la
2 4 6 8 10 12 14 16 18-50
-40
-30
-20
-10
0
Fréquence (GHz)
S11
(dB) - Incidence normale - Polarisation verticale
Simulation - X1 + Plaque métallique
Simulation - X1 + MM
2 4 6 8 10 12 14 16 18-50
-40
-30
-20
-10
0
Fréquence (GHz)
S11
(dB) - Incidence normale - Polarisation verticale
Mesure - X1 + Plaque métallique
Mesure - X1 + MM
2 4 6 8 10 12 14 16 18-50
-40
-30
-20
-10
0
Fréquence (GHz)
S11
(dB) - Incidence normale - Polarisation horizontale
Simulation - X1 + Plaque métallique
Simulation - X1 + MM
2 4 6 8 10 12 14 16 18-50
-40
-30
-20
-10
0
Fréquence (GHz)
S11
(dB) - Incidence normale - Polarisation horizontale
Mesure - X1 + Plaque métallique
Mesure - X1 + MM

10 RESUME
géométrie AMM proposée résultant d’un fonctionnement mono polarisation. Afin de contourner cet
effet et d’avoir une optimisation de l’absorption sur les deux polarisations de l’onde EM, une seconde
géométrie d’AMM, cette fois ci à double polarisation, a été proposée en modifiant les cellules
unitaires A et B. Nous aboutissons à deux nouvelles structures de deux cellules unitaires référencées C
et D de forme, respectivement, méandre et spirale modifiées (FIG. 11.a et b). La structure finale
constituée également d’un damier associant ces deux nouvelles cellules unitaires et fonctionnant dans
la gamme de fréquence entre 2 et 18 GHz est présentée en FIG. 11.c. Un prototype de cette structure
de dimensions 19 x 19 cm² a été réalisé (FIG. 11.d) en utilisant le même substrat et la même épaisseur
métallique que précédemment (premier prototype).
a) b) c) d)
FIG. 11 Géométrie du deuxième métamatériau (symétrique) utilisé : a) cellule unitaire C, b) cellule
unitaire D, c) Structure globale et d) Photo du prototype réalisé
Les FIG. 12.a et 12.b présentent les résultats de simulation et de mesure (en chambre
anéchoïque) de la nouvelle structure AMM seule (avant son association au matériau absorbant naturel)
pour une polarisation horizontale et verticale de l’onde électromagnétique.
a) b)
FIG. 12 Coefficient de réflexion simulé et mesurée de l’AMM symétrique tout seul pour une
polarisation de l’onde a) verticale b) horizontale
Pour une polarisation verticale de l’onde EM, la nouvelle géométrie montre le même
comportement que l’AMM original présenté auparavant. Une absorption large bande est ici observée
entre 9 et 18 GHz (FIG. 12.a) en plus des deux résonances aux alentours de 3,5 et 5 GHz. Pour une
2 4 6 8 10 12 14 16 18-40
-30
-20
-10
0
Fréquence (GHz)
S11
(dB) - Incidence normale
Polarisation verticale
Simulation
Mesure
2 4 6 8 10 12 14 16 18-40
-30
-20
-10
0
Fréquence (GHz)
S11
(dB) - Incidence normale
Polarisation horizontale
Simulation
Mesure
C D

RESUME 11
polarisation horizontale de l’onde EM, l’AMM montre des pics de résonance entre 3 et 7 GHz mais
également une absorption large bande entre 9 et 18 GHz, contrairement à la première géométrie AMM
étudiée (FIG. 9.b). Il faut noter ici que le coefficient de réflexion S11 simulé ou mesuré pour cette
nouvelle géométrie est plus faible que celui observé sur le premier AMM (FIG. 9).
Les résultats de simulation et de mesure du nouveau matériau hybride (absorbant naturel +
nouvelle géométrie AMM) sont présentés dans la FIG. 13. L’absorbant pyramidal naturel X1
(TABLEAU 1) a été utilisé pour cette étude.
a)
b)
FIG. 13 Résultats de simulation et de mesure en incidence normale pour l’absorbant pyramidal X1
associé à l’AMM symétrique pour une polarisation a) verticale et b) horizontale
Les simulations de la FIG. 13 montrent un gain sur toute la gamme de fréquence étudiée,
lorsque l’AMM symétrique est associé au matériau absorbant X1, et cela pour les deux polarisations
de l’onde EM. Le gain ici est compris entre 3 et 15 dB. La mesure du nouveau prototype confirme
l’optimisation de la performance d’absorption suivant les deux polarisations. Des gains jusqu’à 15 dB
sont observés respectivement entre 3 et 7 GHz et 9 et 18 GHz.
2 4 6 8 10 12 14 16 18-50
-40
-30
-20
-10
0
Fréquence (GHz)
S11
(dB) - Incidence normale - Polarisation verticale
Mesure- X1 + Plaque métallique
Mesure - X1 + MM
2 4 6 8 10 12 14 16 18-50
-40
-30
-20
-10
0
Fréquence (GHz)
S11
(dB) - Incidence normale - Polarisation verticale
Mesure- X1 + Plaque métallique
Mesure - X1 + MM
2 4 6 8 10 12 14 16 18-50
-40
-30
-20
-10
0
Fréquence (GHz)
S11
(dB) - Incidence normale - Polarisation horizontale
Mesure- X1 + Plaque métallique
Mesure - X1 + MM
2 4 6 8 10 12 14 16 18-50
-40
-30
-20
-10
0
Fréquence (GHz)
S11
(dB) - Incidence normale - Polarisation horizontale
Mesure- X1 + Plaque métallique
Mesure - X1 + MM

12 RESUME
Conclusion
Mon manuscrit de thèse traite de l’optimisation des matériaux absorbants utilisés en chambres
anéchoïques. Différentes méthodes d’optimisation ont été abordées telles que l’utilisation d’un
nouveau matériau absorbant rigide récemment élaboré par l’équipe « Matériaux Fonctionnels » de
l’IETR (site de St-Brieuc), ou l’amélioration de la géométrie des absorbants, ou encore, l’association
de matériaux artificiels (métamatériaux 2D et 3D) aux absorbants pyramidaux naturels. De même, une
nouvelle technique de caractérisation des matériaux, dans un milieu non-anéchoïque a été proposée.
Dans ce résumé, ces différents aspects sont succinctement abordés et les principaux résultats (de
simulation et/ou de mesures) obtenues lors de la thèse sont présentés.
Concernant la nouvelle méthode de caractérisation, nous avons validé l’utilisation de cette
technique large bande et qui ne nécessite qu’un échantillon relativement petit, sur des matériaux
commerciaux. Nous avons montré la possibilité d’extraction avec succès de la permittivité des
matériaux à faibles ou fortes pertes. Par contre, l’extraction des pertes par cette technique reste limitée
aux matériaux présentant de fortes pertes.
Par ailleurs, l’utilisation du nouveau matériau absorbant à base de mousse époxy chargée en
fibres longue (3 mm) de carbone a montré des résultats très encourageants. Les performances
d’absorption d’un prototype pyramidal sont comparables voir meilleures que l’absorbant du commerce
(APM12) pour la gamme de fréquence entre 3 à 7 GHz. Ce nouveau matériau absorbant a été
également utilisé pour réaliser une nouvelle géométrie d’absorbant, proposée lors de cette thèse. Les
résultats de simulation et de mesure du second prototype réalisé montrent un gain de 10 dB sur toute la
gamme de fréquence étudiée, par rapport au matériau du commerce. Il faut noter ici que la rigidité de
ce nouveau matériau absorbant permettra d’envisager de nouvelles formes encore plus complexes afin
d’optimiser les performances des absorbants.
Finalement, l’étude de l’association d’un métamatériau à un matériau pyramidal du commerce
montre une amélioration de l’absorption sur une large bande de fréquence. Cette amélioration est plus
importantes et surtout effective sur une large bande de fréquence et pour les deux polarisations de
l’onde EM (verticale et horizontale) lorsqu’une structure symétrique du métamatériau est utilisée. Au
final, les métamatériaux peuvent être utilisés en association avec des absorbants non optimums de
faibles épaisseurs (afin de réduire le volume du matériau utilisé) ou très peu chargés.

25
Introduction
Absorber materials have emerged during the Second World War; their first application was to
reduce, or to eliminate completely, the signal of military equipment (planes and submarines) from the
first radar detectors. Since then, the intensive use of electromagnetic waves and the induced rapid
increase of the emitted parasitic waves in the microwave band have diversified the application
domains of absorbers. Indeed, this intensive use of microwaves is not without consequences for the
reliability of electronic equipment or for public opinion (debate on the harmfulness of electromagnetic
waves). All these reasons, finally, have involved an increase in the use of absorber materials.
Today, whether for civil or military domains, the demand for new absorber materials is
growing to meet the evolution of the use of microwaves, for example, in the reduction of
electromagnetic interferences (EMI), in the reduction of the radar cross section (RCS), in
electromagnetic compatibility (EMC).
Another area that was affected by the development of the microwave applications is the
domain of electronic device characterization. Today, it is necessary to simulate a free space
environment during the measurement without any electromagnetic disturbance, in order to extract the
real specificities of the device under test. The anechoic chamber is one of the environments often used
for this type of measure. These chambers are good consumers of absorber materials, in fact,
microwave absorbers are one of the main components in anechoic chambers. Indeed, to simulate a free
space condition and to eliminate reflected microwave signals, these rooms (walls, ceiling and floor)
are completely covered with absorber materials.
For anechoic chambers, the field uniformity is the most important parameter to evaluate its
conformity. The standard IEC 61000 - 4 - 3 specifies that in the test zone, where the material under
test is placed, the field should be uniform. The later can be obtained by measuring the field at different
frequencies between 30 MHz and 300 GHz, and at specific points. If only a slight variation of the field
is obtained at the majority of measured points, the anechoic chamber can be considered acceptable.
Usually, two types of absorbers are used in anechoic chambers. The first one is the thin layer
absorbers (tiles) based on ferrites loaded composites which allow the absorption of the EM waves at
low frequencies. These ferrites are expansive and heavy, but present advantages like impedance close
to the one of free space, which allows direct transmission without any significant reflection at the
surface, and magnetic losses, meaning that the wave is almost completely absorbed inside the material.
Furthermore, the ferrite tiles work at low frequencies, between 30 MHz and 600 MHz.
The second, and the most used material in anechoic chambers, is the pyramidal absorber based
on loaded foam materials. They work at higher frequencies, superior to 1 GHz. A good performance
has been found when the thickness of the pyramids is equal to several wavelengths. In fact, with the
pyramidal geometry, multiple reflections occur at the interface air/material, and for each

26 INTRODUCTION
interaction/reflection, a portion of the wave is absorbed inside the material resulting in a very small
portion of the incident wave which survived to the multipath reflections.
The pyramidal absorbers are currently made of polyurethane foam loaded with fine carbon
particles in order to provide the electromagnetic absorption. Although these materials have various
advantages, they have also disadvantages. The first one is their poor mechanical properties, with a
great flexibility. The latter often gives rise to non-reproducible machining shape, and therefore,
induces non-reproducible properties. Also, it limits their machining to simple shapes (such as
pyramids), while complex shapes can be considered to improve the absorption properties. An
inhomogeneity of the composition has been also highlighted. It is mainly due to the elaboration
method, which consists of an impregnation of the foams in carbon solutions. This method is the only
possible way to introduce the carbon particles in the foams in order to bring the absorption properties.
Moreover, this method does not introduce the carbon particles in the foam matrix, but actually, place
them on the walls, allowing the load to escape throughout the lifetime of the absorber: the induced
volatile dust particles become then hazardous to the human health. The evolution of REACH standards
aims to prohibit in the coming years the use of fine carbon particles for this application. In fact, the
polyurethane foam is also targeted by these standards because of the pollution caused by their
elaboration. For all these reasons, the achievement of new materials, which could replace the
polyurethane foam loaded with fine particles, becomes urgent.
The subject of the present thesis is to propose solutions to replace the used material in
anechoic chambers and to optimize their absorption properties by showing the potential of: using new
materials (developed in Chloé Mejean PHD thesis), optimizing the existent absorber geometries,
proposing new absorber shapes and combine natural absorbers with metamaterials. This work,
supported by the Direction Générale de l’Armement (DGA), was conducted at the Institut
d’Electronique et de Télécommunications de Rennes (IETR), with the Systèmes Rayonnants
Complexes (SRC) team and the Matériaux Fonctionnels (MF) team of the Antennes et Dispositifs
Hyperfréquences department (ADH).
This thesis manuscript is organized like explained below:
The first chapter quickly presents the materials characterization techniques. A new
measurement method, in non-anechoic environment, is proposed and validated by measuring two
reference materials.
In Chapter 2, after a brief description of the new absorber material made of loaded epoxy
foam, we first measure its dielectric properties to further be used for the simulation (using CST
Microwave Studio software) of a pyramid absorber having the same geometry size as a commercial
one. A prototype is developed with the optimum composition of the composite, previously defined by
simulations. The prototype is then characterized and compared to the commercial absorber.

27
In Chapter 3, the optimization of the shape of the pyramidal absorbers is studied. Numerical
simulations, using the Generic Algorithm, are first conducted to obtain the shape having better
absorption. A prototype of the optimized form is then proposed using the new composite absorber
material. The prototype is measured and compared to the first pyramidal prototype.
In the last chapter of the manuscript, the optimization of the absorption performance is studied
by the association of natural pyramidal absorber to an artificial material, a metamaterial. Two
structures (2D and 3D) metamaterials are studied by simulations. Hybrid prototypes "commercial
pyramidal material + 2D metamaterials" are achieved, characterized and compared to the pyramidal
absorber alone.
At the end of the manuscript, the conclusion summarizes the main obtained results and
perspectives to this work are given.

28 INTRODUCTION

29
Chapter 1
Material Characterization in a Non-anechoic Environment
1.1 Introduction
The context of this work is the development of innovative absorber materials which can be
used particularly as absorbers for anechoic chambers. For this we do need to characterize these new
materials and especially in the frequency band of interest (2 GHz - 18 GHz). Two methods, that we
have in our Laboratory and that were found suitable for measuring absorbing material samples are
considered: a waveguide measurement technique, in which the material sample is placed inside the
waveguide and an open-ended coaxial-line technique which was commercialized by Keysight. These
two methods were specifically used to determine the dielectric properties of the new material
elaborated in our Laboratory at St. Brieuc where the open-ended coaxial-line technique is used to
estimate the complex dielectric value and then this value was verified in X-band by using the
waveguide technique.
For large samples, to characterize the material in a broadband frequency range we have used
the classical free space method in an anechoic chamber. We have also developed a new method based
on a free space bistatic technique that can be used in a non-anechoic environment and especially
dedicated to evaluate the material absorption.
This chapter presents the work done during this thesis concerning absorber materials
characterization. The section is organized as follows. First a brief description of the standard
techniques usually used at microwave frequencies is exposed. The methods employed in this work,
such as waveguide and free space technique, are presented as well as their advantages and
disadvantages. Then a simple approach to characterize these materials in a non-anechoic environment
is detailed where very large samples are not required. Finally, the measurement setup proposed is used
to characterize several types of materials validating this new method.
1.2 Methods of material characterization in literature
The electrical nature of absorber materials that we consider can be described by their dielectric
properties, which influence the distribution of the electromagnetic fields and currents in the region
occupied by the materials and determine the behavior of the materials. The real part of the dielectric
constant is a measure of how much energy from an external electric field is stored in a material. The
imaginary part of the permittivity is a measure of how dissipative or lossy a material is in the presence
of an external electric field.
To measure the characteristics of materials several methods have been developed and the
choice of the technique depends on several factors like: the frequency of interest, the expected value of

30 CH. 1 MATERIAL CHARACTERIZATION IN A NON-ANECHOIC ENVIRONMENT
the material properties, the required measurement accuracy, material form (liquid, solid and so on),
sample size restrictions, destructive properties and so on. FIG. 1.1 shows a summary of these
measuring techniques such as: coaxial probe, transmission line, cavity and free space methods.
a)
b)
FIG. 1.1 Summary of techniques for material characterization a) depending on the frequency and
losses and b) comparison in between methods
20
GHz
40
GHz
60
GHz
Frequency
Parallel
plate
Resonant cavity Open resonator
Fabry-Perot
Free space
Transmission line
Coaxial probe
Loss
High
Medium
Low
50
MHz
5
GHz
Low frequency RF Microwave Millimeter-wave
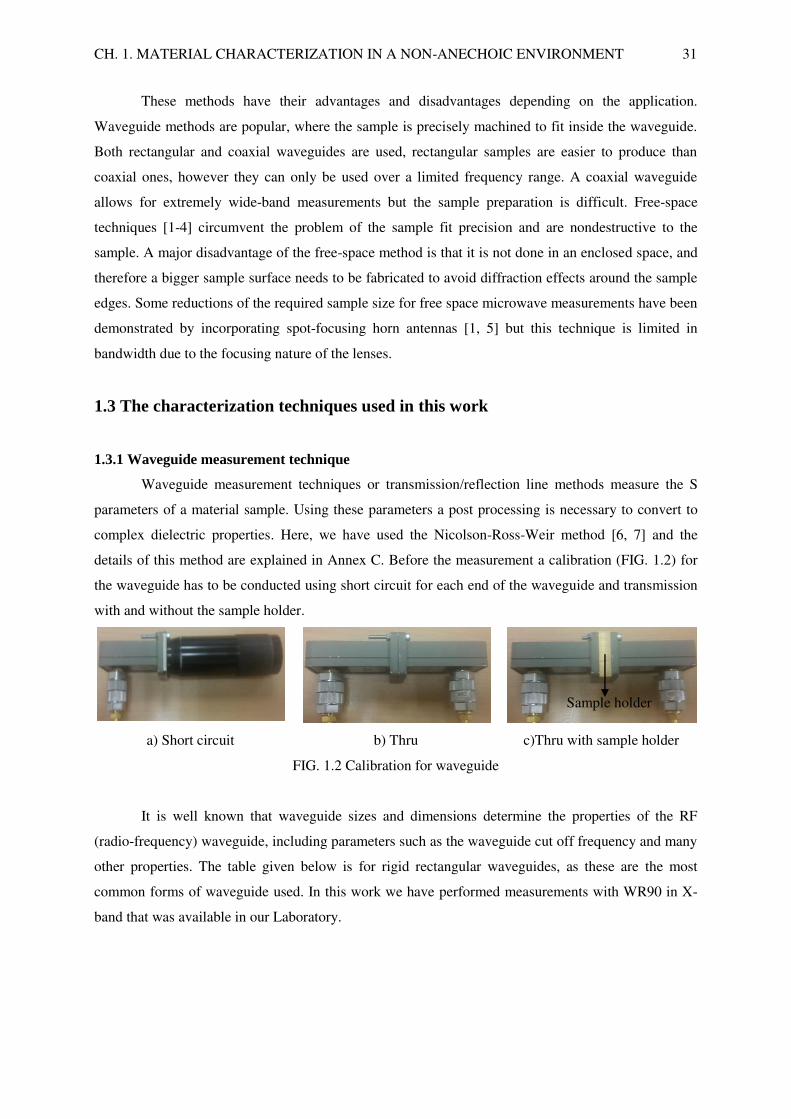
CH. 1. MATERIAL CHARACTERIZATION IN A NON-ANECHOIC ENVIRONMENT 31
These methods have their advantages and disadvantages depending on the application.
Waveguide methods are popular, where the sample is precisely machined to fit inside the waveguide.
Both rectangular and coaxial waveguides are used, rectangular samples are easier to produce than
coaxial ones, however they can only be used over a limited frequency range. A coaxial waveguide
allows for extremely wide-band measurements but the sample preparation is difficult. Free-space
techniques [1-4] circumvent the problem of the sample fit precision and are nondestructive to the
sample. A major disadvantage of the free-space method is that it is not done in an enclosed space, and
therefore a bigger sample surface needs to be fabricated to avoid diffraction effects around the sample
edges. Some reductions of the required sample size for free space microwave measurements have been
demonstrated by incorporating spot-focusing horn antennas [1, 5] but this technique is limited in
bandwidth due to the focusing nature of the lenses.
1.3 The characterization techniques used in this work
1.3.1 Waveguide measurement technique
Waveguide measurement techniques or transmission/reflection line methods measure the S
parameters of a material sample. Using these parameters a post processing is necessary to convert to
complex dielectric properties. Here, we have used the Nicolson-Ross-Weir method [6, 7] and the
details of this method are explained in Annex C. Before the measurement a calibration (FIG. 1.2) for
the waveguide has to be conducted using short circuit for each end of the waveguide and transmission
with and without the sample holder.
a) Short circuit b) Thru c)Thru with sample holder
FIG. 1.2 Calibration for waveguide
It is well known that waveguide sizes and dimensions determine the properties of the RF
(radio-frequency) waveguide, including parameters such as the waveguide cut off frequency and many
other properties. The table given below is for rigid rectangular waveguides, as these are the most
common forms of waveguide used. In this work we have performed measurements with WR90 in X-
band that was available in our Laboratory.
Sample holder

32 CH. 1 MATERIAL CHARACTERIZATION IN A NON-ANECHOIC ENVIRONMENT
Rectangular
Waveguide
Frequency Range
(GHz)
Cutoff Frequency
(GHz)
Internal size
(mm)
Thickness sample
(mm)
WR1500 0.49 - 0.74 0.393 381.0 x 190.5 108.21
WR975 0.75 - 1.12 0.605 247.65 x 123.825 108.21
WR650 1.12 - 1.70 0.908 165.1 x 82.55 71.62
WR430 1.70 - 2.60 1.372 109.22 x 54.61 46.68
WR284 2.60 - 3.95 2.078 72.136 x 34.036 30.45
WR187 3.95 - 5.85 3.152 47.5488 x 22.1488 20.51
WR137 5.85 - 8.20 4.301 34.8488 x 15.7988 13.69
WR90 8.20 - 12.4 6.56 22.86 x 10.16 9.7
WR62 12.4 - 18.0 9.49 15.7988 x 7.8994 6.44
WR42 18.0 - 26.5 14.1 10.668 x 4.318 4.45
TABLE 1.1 Waveguide specifications depending on frequency [8]
Advantages:
Waveguides are commonly used to measure samples with medium to high loss and it can
determinate the permittivity and the permeability of the material under test.
Disadvantages:
The method requires sample preparation such as machining so that the sample can fit tightly
into the sample holder and the measurement accuracy is limited by the air gap effects.
An example is presented below (FIG.1.3) characterizing a Teflon material sample in X - band.
a)
b)
FIG. 1.3 S parameters: a) Magnitude and b) Phase for a Teflon sample of 9.7 mm thickness with the
permittivity r=2.1-j0.02 and permeability r=1.00-j0.001
Using the reflection and transmission coefficients and applying the NRW method [6, 7]
described in Annex C, the characteristics of the material are obtained and presented below in FIG. 1.4.
The results obtained reproduce the theoretical values of the material characteristics. We have used the
mean value to determine the exact values of the materials characteristic in order to avoid the resonant
peaks that appear because of the resonant frequency obtained in the S parameters.
8.2 9.25 10.3 11.35 12.4
-40
-20
0
Frequency (GHz)
S p
ara
mete
rs (
dB
)
Teflon Sample
S11
S21
8.2 9.25 10.3 11.35 12.4-200
-100
0
100
200
Frequency (GHz)
Phase o
f
S p
ara
mete
rs (
degre
es)
Teflon Sample
S11
S21

CH. 1. MATERIAL CHARACTERIZATION IN A NON-ANECHOIC ENVIRONMENT 33
a)
b)
c)
d)
FIG. 1.4 Complex parameters of the Teflon sample: a) Real part of the permittivity, b) Imaginary part
of the permittivity, c) Real part of the permeability and d) Imaginary part of the permeability
1.3.2 Open ended coaxial probe method
This method has been used for years as a non-destructive testing method where the probe is
pressed against the MUT (FIG. 1.5) and the reflection coefficient is measured and used to determine
the permittivity. The calibration process is performed by placing the standards (short, open and a
referenced liquid, here water) at the probe's end.
FIG. 1.5 Illustration of the coaxial probe setup
Advantages:
This method is broadband, the material preparation is easy to do, it takes a short time to
measure and can be done at ambient temperature.
Disadvantages:
Still, this method comes also with some disadvantages like the fact that the air gaps in between
the probe and the MUT can cause measurement uncertainties especially for the foam materials used in
8.2 9.25 10.3 11.35 12.40
0.5
1
1.5
2
2.5
X: 10
Y: 2.062
Dielectric Constant
Frequency [GHz]
Magnitude e
ps'
Mean
Real Permittivity
8.2 9.25 10.3 11.35 12.4-1.5
-1
-0.5
0
0.5
1
1.5
X: 10
Y: 0.03067
Imaginary part of permittivity
Frequency [GHz]
Magnitude e
ps"
Mean
Imag Permittivity
8.2 9.25 10.3 11.35 12.40
0.5
1
1.5
X: 10
Y: 1.011
Real part of permeability
Frequency [GHz]
Magnitude
'
Mean
Real Permeability
8.2 9.25 10.3 11.35 12.4-1.5
-1
-0.5
0
0.5
1
1.5
X: 10
Y: 0.01274
Imaginary part of permeability
Frequency [GHz]
Magnitude
"Mean
Imag Permeability
MUT
Coaxial probe

34 CH. 1 MATERIAL CHARACTERIZATION IN A NON-ANECHOIC ENVIRONMENT
our study, for that, this technique is more adapted to liquid samples. Moreover, the uncertainties
in the measurement are also due to the calibration process at the liquid reference and the selection of
liquid as a calibration standard.
This method will mainly be used to estimate the material permittivity in the fabrication
process (by Chloé Méjean PHD student in St. Brieuc).
The coaxial probe used is a Keysight 85070E Dielectric Probe Kit [9], presented in FIG. 1.6
and the vector network analyzer is an Agilent 8510C [10].
FIG. 1.6 Coaxial probe used
An example of an open ended coaxial probe measurement is presented in FIG. 1.7. The
measurement has been performed using a Teflon sample with the size 15 x 15 x 6.5 cm3. The probe
has been placed on the material in four specific places and the permittivity has been measured. The
average value was calculated and presented here in FIG. 1.7. The permittivity value measured at 10
GHz is ’ = 2. This value is close to the theoretical one.
FIG. 1.7 Open ended coaxial probe real part of the permittivity measurement for a Teflon material
sample
As for the losses, this method seems to be unsuitable for this low loss material, since we
obtain an overestimated value after several measurements (Tan 0.1 instead of 0.0003).
2 4 6 8 10 12 14 16 180
1
2
3
4
5
Frequency (GHz)
eps' -
Teflon
Measurement - coaxial probe

CH. 1. MATERIAL CHARACTERIZATION IN A NON-ANECHOIC ENVIRONMENT 35
1.3.3 Free-space method
Free-space techniques [1-4] circumvent the problem of the sample fit precision and are
nondestructive to the sample.
A major disadvantage of the free-space method is that it is not done in an enclosed space, and
therefore a greater sample surface needs to be fabricated to avoid diffraction effects around the sample
edges.
Some reductions of the required sample size for free space microwave measurements have
been demonstrated by incorporating spot-focusing horn antennas [1, 5] but this technique is limited in
bandwidth due to the focusing nature of the lenses and were used at frequencies above 30 GHz
because of the availability of the small horn lens antennas which have field focusing ability [4]. As
opposed to the classical techniques that use an anechoic chamber, measuring the reflection coefficient
for a material sample in a non-anechoic environment should take into consideration a multipath
transmission scenario (including reflection scattering and diffraction on the walls and on other objects
encountered) [11]. A post processing after the measurement is necessary in order to extract accurately
the reflection coefficient of the material sample under test. This is called the "de-embedding"
technique [12]. In literature, most of the characterization methods require a sample of a size much
greater than the antenna aperture to be used, as most of the wave front surface should be incident on
the material sample [1, 13]. For characterizing a material sample with small dimensions and at low
frequencies (where the size of the antennas is very important) the classical "de-embedding" method
cannot be applied [1, 14].
In this work we obtain the reflection coefficient S11 of the material with and without a metallic
plate by using a bistatic type of measurement described in the next section. Using these two
coefficients we apply the method of Fenner et al, described in [15], to obtain the complex permittivity
of the characterized material.
For this technique, the dimensions of the characterized samples are 15 x 15 x 6.5 cm3. Two
ultra-wideband (UWB) antennas ETS-Lindgren's Model 3115 Double-ridged Waveguide Horn [16]
are used. These two antennas are placed in front of the characterized sample (in order be at normal
incidence). The distance between the sample and antennas was about 1,1 m. This latter was chosen in
order to respect the far field condition in between the resonant sample and the reception antenna,
2D2/ at the lowest frequency.

36 CH. 1 MATERIAL CHARACTERIZATION IN A NON-ANECHOIC ENVIRONMENT
1.3.3.1 Monostatic and bistatic measurements
a) b)
FIG. 1.8 a) Reflection mode configuration, b) Transmission mode configuration
For the reflection mode configuration (FIG. 1.8a) we use only one antenna placed in far field
in front of the material sample. The "de-embedded" reflection coefficient at the surface of the material
is obtained with the following formula [4]:
(1.1)
where represents the measured reflection coefficient obtained from the VNA
by placing the material sample in front of the antenna in far field, represents the reflection
coefficient measured for a normal foam with no losses (example polystyrene) and
represents the reflection coefficient obtained for a metallic plate placed in front of the antenna at the
same distance as the MUT in far field.
In the transmission mode configuration (FIG. 1.8b) we are measuring the transmission
coefficient. For this we need two antennas, one that transmits and one that receives the signal from the
transmitting antenna. The "de-embedding" process in this case is [5]:
(1.2)
where represents the measured transmission coefficient obtained from the
VNA by placing the material sample in between the two antennas and represents the
transmission coefficient obtained for a metallic plate placed in between the antennas at the same
distance as the MUT in far field, , δ represents the thickness of the material and θ is the
angle of incidence.
γ0
Transmitting
Antenna
Receiving
Antenna
Material under test
(MUT)
Ground plane
Pyramidal
absorbers γ0
Transmitting
Antenna

CH. 1. MATERIAL CHARACTERIZATION IN A NON-ANECHOIC ENVIRONMENT 37
To obtain the reflection coefficient we have two types of measurements: monostatic and
bistatic (FIG. 1.9). The usage of the bistatic measurement has its advantages over the monostatic case
especially in a real environment.
Moreover, monostatic measurements can only observe the backscatter of an object, or the
radiation that returns from the object directly back in the direction of the source. We know from
electromagnetic scattering theory that objects, in general, radiate in all directions, not just the
backscatter.
a) b)
FIG. 1.9 a) Monostatic and b) Bistatic configuration
A bistatic measurement can observe how the object scatters in every direction in a plane that
intersects the object, for a given look angle. Forward RCS measurements in the laboratory are
technically complicated due to the large direct contribution from the transmitting antenna to the
received signal: the direct contribution to the signal has to be removed using coherent subtraction. This
puts considerable demands on the dynamic range and the stability of the system. This can be observed
in FIG. 1.10 where we compare the monostatic approach and the bistatic approach that we propose for
a Teflon material sample measurement. The same results are obtained for other materials. Monostatic
and bistatic measurements use the same formula (1.1) to extract the exact reflection coefficient of the
material but in the case of the bistatic measurement we use S21 instead of S11.
FIG. 1.10 Measurement results obtained using the monostatic and bistatic method for a Teflon sample
2 4 6 8 10 12 14 16 18-60
-50
-40
-30
-20
-10
0
10
Frequency (GHz)
S11 (
dB
)
Teflon
Simulation CST
Monostatic Measurement
Bistatic Measurement
Material under test
(MUT)
Metallic plate
Pyramidal
absorbers γ0
Transmitting
Antenna
Receiving
Antenna
Material under test
(MUT)
Metallic plate
Pyramidal
absorbers γ0
Transmitting
Antenna

38 CH. 1 MATERIAL CHARACTERIZATION IN A NON-ANECHOIC ENVIRONMENT
Moreover, we are interested by bistatic measurements in order to characterize the material not
only at normal incidence but also at oblique incidence.
A disadvantage of the method is that in order to perform a reliable free-space measurement we
need a sample size of 2 or 4 depending on the frequency band. For a standard setup at 2 - 18 GHz
the material size should be more than 30 x 30 cm2 or than 61 x 61 cm
2 respectively and the distance
between the antennas and the sample should be between 76 and 92 cm [17]. The size of the sample can
be approximated to the arc length as seen in FIG. 1.11.
FIG. 1.11 Arc length approximations
where Ф represents the - 3 dB beamwidth of the antenna used.
Usually the accuracy of the measurement depends on the quiet zone space in the anechoic
chamber and the performance of the absorbers that cover the chamber. To increase the quiet zone
space and reduce the multipath reflections that can appear in an anechoic chamber, a time gating
method (TGM) [18-21] is usually used along with the de-embedding method presented above. The
TGM transforms the frequency domain response (FIG. 1.12a) in a time domain response (FIG. 1.12b)
and filters the late time pulses caused by the multiple interferences by using a gating window. The
obtained time domain response (FIG. 1.12d) is transformed back to give us the frequency domain
response (FIG. 1.12c).
a)
b)
2 4 6 8 10 12 14 16 18-40
-30
-20
-10
0
Frequency (GHz)
S11 (
dB
)
Amplitude
50 70 90 110 130 1500
0.05
0.1
0.15
0.2
0.25
time(ns)
Am
plit
ude
Time domain response
Ф
Distance between
antenna and MUT (R)
L=RФ

CH. 1. MATERIAL CHARACTERIZATION IN A NON-ANECHOIC ENVIRONMENT 39
c)
d)
FIG. 1.12 a) Frequency domain response for a Teflon material sample, b) Time domain response, c)
Frequency domain response for a Teflon material sample after using TGM and d) Time domain
filtered response
A significant improvement of the measurement is observed when the TGM is used. Depending
on the size of the anechoic chamber and the multiple reflections that occur, this method can be used as
a smooth-out procedure to obtain a stable measurement result.
After obtaining the reflection and transmission coefficients we can use the NRW method (See
Annex C) to determine the permittivity and permeability of the material.
The inaccuracies in dielectric measurements using free space methods are mainly due to:
diffraction effects at the edges of the sample, multiple reflections between the two horns and via the
surface of the sample.
So, in the next section, we will present a novel free-space measurement system operating at
lower frequencies and where the sample size is reduced to about .
1.4 Proposed method for material characterization in a non-anechoic
environment
Here we propose a method for measuring the reflection coefficient of materials that does not
require large material samples and is done in a non-anechoic environment. It is based on the free-space
method by combining the "de-embedding" and the average value techniques for several sample
distances, resulting in the elimination of unwanted multiple diffractions and reflections related to the
environment. The material's properties can then be afterwards deduced from the reflection coefficient.
This coefficient is extracted from the transmission between two antennas through a bistatic reflection
method [22].
2 4 6 8 10 12 14 16 18-40
-30
-20
-10
0
Frequency (GHz)
S11 (
dB
)Amplitude after filtering
50 70 90 110 130 1500
0.05
0.1
0.15
0.2
0.25
time(ns)
Am
plit
ude
Time domain filtered response

40 CH. 1 MATERIAL CHARACTERIZATION IN A NON-ANECHOIC ENVIRONMENT
1.4.1 Proposed approach and measurement setup
A schematic diagram of the bistatic microwave measurement system is given in FIG. 1.13. The
transmitting and receiving antennas are focusing broadband horn antennas QWH-SL-2-18-N-HG-R
[23]. They are placed side by side and oriented towards a Material Under Test (MUT). A vector
network analyzer is used for this type of measurements. The size of the MUT depends on the desired
frequency range. At low frequencies we would need large samples and smaller distances between the
antennas and the samples in order to eliminate the unwanted reflections. The calibration has been done
only for the coaxial cables using an OSLT (Open, Short circuit, Load and Through line) calibration
kit.
FIG. 1.13 Measurement configuration with the horn antennas
Since the antennas are close to each other, the angle between the material sample and the two
antennas Ф is close to 0o. Thus, we can do the approximation that the transmission coefficient S21
measured with the VNA corresponds to the reflection coefficient of the MUT but at the reference point
X. We need the reflection coefficient at the surface of the material, in FIG. 1.13 referred to as ΓMUT.
The parameter S21 at normal incidence can be obtained by calculating the ratio between the reflected
electric field over the incident electric field on the MUT of a planar wave at a distance R in between
the MUT and the reception antenna in far field [18, 24], such as:
(1.3)
where A is the mutual coupling between the two antennas and the medium itself, k0 the wave
number, R the distance between the antennas and the sample and ΓMUT is the reflection coefficient of
the Material.
Second, by replacing the MUT with a metallic plate, the reflection coefficient called can be expressed as:
(1.4)
Third, a measurement without the MUT gives us the reflection coefficient of the environment
called .

CH. 1. MATERIAL CHARACTERIZATION IN A NON-ANECHOIC ENVIRONMENT 41
(1.5)
From equations (1.3), (1.4), (1.5) we can extract the exact reflection coefficient of the MUT
using the following formula:
(1.6)
This formula can be considered as the "de-embedding" process.
The characterization is performed in the frequency range 2 - 18 GHz in a multipath
environment and in an anechoic chamber, respectively. FIG. 1.14 shows the measuring setup in a non-
anechoic environment (FIG. 1.14a), using two horn antennas with an aperture size of 16.5 x 16.5 cm2
[23], and the setup used for measuring inside an anechoic chamber (FIG. 1.14b) with the same
broadband horn antennas. The measurements in the anechoic environment have been performed only
at one distance where the material is placed in the far field (Fraunhofer) region from the antenna which
corresponds to 75 cm at the lowest frequency, 2 GHz.
In a multipath environment, an absorbing material sample can be placed between the antennas in
order to reduce the mutual coupling between them. The mutual coupling impacts on the accuracy of
the measurements, resulting in an incorrect extraction of the phase. Another method to reduce the
coupling between the antennas [25], consists in placing the antennas as far as possible one from the
other [25]. The optimal distance between the antennas and the MUT is 2D2/ at the lowest frequency.
This represents the beginning of the far field region. Where D is the maximum dimension of the
antenna.
a) b)
FIG. 1.14 Measurement configurations in a) a multipath environment and b) in anechoic chamber
In order to increase the accuracy of these measurements we have to enhance the elimination of
the multipath transmission, including reflection scattering and diffractions off of the walls and other
objects encountered. For this, we propose to add two steps to the measurement protocol:

42 CH. 1 MATERIAL CHARACTERIZATION IN A NON-ANECHOIC ENVIRONMENT
- varying the distance between the MUT and the antennas, by example at least six different
distances, keeping the far field condition at the lower frequency;
- varying the position of the measurement setup, at least two positions, while keeping the same
distance between the antennas and the MUT (FIG. 1.15).
At each distance, four transmission coefficients will be obtained i.e., for the environment, for a
metallic plate, for a material sample and for a material sample with a metallic plate placed on its back.
For each distance we apply the "de-embedding" process [14, 24] and we obtain a corresponding
reflection coefficientΓ . The average reflection coefficient is then deduced by applying the mean
value of all the Γ like this: Γ Γ .
FIG. 1.15 Reduction of the effect of moving items in a non-anechoic environment: the entire setup is
moved but keeping the same distance between the antennas and the sample
1.4.2 Permittivity extraction
The method for extracting the permittivity is based on the work of Fenner et al. [15]. The
equations used are shown below: (1.7)
(1.8)
(1.9)
Γ Γ (1.10)
where Z2 is the transverse impedance and Z
A and Z
B are the wave impedances of the material
sample, respectively backed by the metallic plate (MUT - MP) and alone (MUT). Since the
measurements have been done in free space, the wave impedance is Z0 = 377 Ω.
Our used materials are non-magnetic, thus the permeability is = 0. This method uses the
impedance for the extraction of the material's properties. The phase reference for this technique has to
be at the front surface of the material, this is why the "de-embedding" process is very important.
CH. 1. MATERIAL CHARACTERIZATION IN A NON-ANECHOIC ENVIRONMENT 43
Because we have used a bistatic technique, the angle of incidence is about 6o for a distance
of 75 cm between the antennas and the material and gets smaller the further we go in far field.
Some errors may appear in the measurement because of the sample thickness and position, air
gaps between the metallic plate and the material sample, incidence angle, unknown material properties
and residual noise from the network analyzer. The method described above shows a very small error
range to noise for the real part of the permittivity but a higher error range for the imaginary part of the
permittivity like it was observed by Nicolson and Ross in the 1970s [6, 7]. Still, the extracted
characteristics are quite insensitive to the noise created by the VNA.
1.4.3 Measurement results
1.4.3.1 Teflon
In order to validate the characterization method in a multipath environment, a known dielectric
material with very low losses (Teflon sample) was measured.
Based on the radiation pattern and on the first measurement distance, the optimal thickness,
length and width of the sample can be found, in order to reduce the effect of the scattering on its edges
for broadband studies.
The optimal thickness of the material sample should be at least /4 at the lowest frequency i.e.,
at 2 GHz. The distance between the antennas and the sample in far field at 2 GHz is 75 cm. The
antennas [23] have a half power beam width (HPBW, -3dB beamwidth) of 59o at 2 GHz, of 11.5
o at 10
GHz and of 8o at 18 GHz.
The size of the sample can be approximated to the arc length on the wave front. At 10 GHz we
have an arc length of 15 cm for the first distance of 75 cm. Since at 2 GHz the size of the sample
would have been very big (77.25 cm) and because our technique is used to reduce the effects of the
multipath transmission in an ordinary room, we proposed 15 cm for the length and width of the MUT,
which is the arc length for the middle frequency, 10 GHz.
The final size of the sample is 15cm x 15cm x 6cm (large x width x height). With this
dimensions we proved that the accurate reflection coefficient can be extracted by applying our mean
value method on the measurements at different distances.
Theoretically, the Material Under Test, here Teflon, has a permittivity of 2.1 and a loss tangent
of 0.0003 at 10 GHz.
Two types of measurements have been done. One using the MUT alone showing that we have
transmission through it and another measurement for the MUT backed by a metallic plate. The latter
measurement has been performed because it gives us the absorption of the material and also because it
is necessary for the permittivity extraction method.

44 CH. 1 MATERIAL CHARACTERIZATION IN A NON-ANECHOIC ENVIRONMENT
Time gating technique
For non-anechoic environment, the TGM is not sufficient to get accurate reflection coefficient
measurement especially for the phase. Let us consider an example where we measure the Teflon
sample with or without a metallic plate at one distance (FIG. 1.16 and FIG. 1.17). The simulations
have been done using the CST Microwave Studio software, Frequency domain and Floquet theory.
a) b)
c)
FIG. 1.16 a) Measured reflection coefficient in dB for a Teflon material sample in non-anechoic
environment compared to simulation before TGM, b) S11 magnitude after applying TGM and c) Phase
after applying TGM
a)
b)
2 4 6 8 10 12 14 16 18-40
-30
-20
-10
0
10
Frequency (GHz)
S11 (
dB
)
Amplitude
2 4 6 8 10 12 14 16 18-40
-30
-20
-10
0
10
Frequency (GHz)S
11 (
dB
)
Amplitude after filtering
Measurement after f iltering
Simulation
2 4 6 8 10 12 14 16 18-200
-100
0
100
200
Frequency (GHz)
S11 (
dB
)
Phase after filtering
Measurement after f iltering
Simulation
2 4 6 8 10 12 14 16 18-40
-30
-20
-10
0
10
Frequency (GHz)
S11 (
dB
)
Amplitude
2 4 6 8 10 12 14 16 18-40
-30
-20
-10
0
10
Frequency (GHz)
S11 (
dB
)
Amplitude after filtering
Measurement after f iltering
Simulation

CH. 1. MATERIAL CHARACTERIZATION IN A NON-ANECHOIC ENVIRONMENT 45
c)
FIG. 1.17 a) Measured reflection coefficient in dB for a Teflon material sample backed by a metallic
plate in non-anechoic environment compared to simulation before TGM, b) S11 magnitude after
applying TGM and c) Phase after applying TGM
We can note that, TGM is only smoothing the result, eliminating some of the multipath
reflections. If the result is inconclusive from the beginning like it can be seen in FIG. 1.16a and FIG.
1.17a, where the reflection coefficient is higher than the theoretical value or has unwanted resonant
peaks, then even after applying the TGM, the results will still be inaccurate. Also, the phase obtained
after applying the method is very noisy and not the same as the one obtained by simulation, (FIG.
1.16c, FIG. 1.17c). By applying the averaging value we are going to see in the next part of our chapter
that we can obtain more accurate results.
Mean value technique
FIG. 1.18a shows the average reflection coefficient obtained from all 30 measurements (6
different antenna-material distances and 5 different displacements of the measurement setup) after
applying the "de-embedding" method for the Teflon sample.
FIG. 1.18b shows the reflection coefficient, simulated using 3D CST Microwave Studio
(Frequency domain and Floquet theory) and measured for the Teflon sample. We can see that the
measured result (dotted red curve) is very different from the one obtained by simulation; when
applying the "de-embedding" procedure and the mean value method we can extract an exact result
(solid red curve) similar to the simulation and to the measurement in the anechoic chamber.
The phase measured in the multipath environment without "de-embedding" is represented
from 10 GHz and is fluctuating dramatically (FIG. 1.18c) over the entire frequency range and
therefore it cannot be compared with the theoretical phase. The only reason to depict the phase
variation in FIG. 1.18c was to better understand why the "de-embedding" procedure and the mean
value are so important for the determination of the correct reflection coefficient of a material. The
phase extracted from the same measurement, after the "de-embedding" and applying the average value
2 4 6 8 10 12 14 16 18-200
-100
0
100
200
Frequency (GHz)
S11 (
dB
)
Phase after filtering
Measurement after f iltering
Simulation

46 CH. 1 MATERIAL CHARACTERIZATION IN A NON-ANECHOIC ENVIRONMENT
is confirmed correct by comparison with the measurement in the anechoic chamber as well as from
simulation (see FIG. 1.18c).
a) b)
c)
FIG. 1.18 Measurement and simulation results of the reflection coefficient a) mean value in red and
the superposition of all measurements, b) magnitude and c) phase for a Teflon sample
Now, we consider the Teflon sample backed by a metallic plate (FIG. 1.19). FIG. 1.19a
compares the average values of the reflection coefficient obtained in the real environment with and
without "de-embedding", with the results obtained in an anechoic chamber and with the CST
simulation results.
The phase measured without "de-embedding" and without averaging has the same variation as
the one shown in FIG. 1.19c. The phase extracted by applying the "de-embedding" and by averaging
the measured results in a multipath environment is close to that obtained in the anechoic chamber and
to the simulation as can be seen in FIG. 1.19c.
2 4 6 8 10 12 14 16 18-80
-60
-40
-20
0
Frequency (GHz)
Reflection c
oeff
icie
nt
of
Teflon w
ithout
meta
llic p
late
(dB
)
2 4 6 8 10 12 14 16 18-80
-60
-40
-20
0
Frequency (GHz)
Reflection c
oeff
icie
nt
of
Teflon w
ithout
meta
llic p
late
(dB
)
2 4 6 8 10 12 14 16 18-200
-100
0
100
200
Frequency (GHz)
Phase o
f T
eflon
without
meta
llic p
late
(degre
es)
Without "de-embedding"
Anechoic chamber
Simulation CST
With "de-embedding"
Measurement in anechoic chamber Measurement in real environment with
"de-embedding" Measurement in real environment
without "de-embedding" Simulation CST
Tef
lon

CH. 1. MATERIAL CHARACTERIZATION IN A NON-ANECHOIC ENVIRONMENT 47
a) b)
c)
FIG. 1.19 Measurement and simulation results of the reflection coefficient a) mean value in red and
the superposition of all measurements, b) magnitude and c) phase for a Teflon sample backed with a
metallic plate
FIG. 1.20 shows the real part of permittivity for a Teflon sample and for the absorbing
material, extracted from the measurements in the frequency range 2-18 GHz. For the Teflon sample
the mean value for the permittivity in this frequency range is 2.06. This result is comparable to the
theoretical value (obtained by applying (1.7) - (1.10) on the reflection coefficients obtained from
simulation) and to the result obtained from the measurement in the anechoic chamber. Note that in
CST we used a permittivity of ɛ’ = 2.1 at 10 GHz. In CST we are considering an ideal environment
with no outside interference and simulate using the sample block as an infinite structure having the
same thickness as in the measurement.
Moreover, in FIG. 1.20 we have presented measured results in the X band for a Teflon sample in
a waveguide. This result obtained using the Nicolson - Ross - Weir method [6, 7] is close to that
2 4 6 8 10 12 14 16 18-40
-30
-20
-10
0
10
Frequency (GHz)
Reflection c
oeff
icie
nt
of
Teflon w
ith m
eta
llic p
late
(dB
)
2 4 6 8 10 12 14 16 18-40
-30
-20
-10
0
10
Frequency (GHz)R
eflection c
oeff
icie
nt
of
Teflon w
ith m
eta
llic p
late
(dB
)
2 4 6 8 10 12 14 16 18-200
-100
0
100
200
Frequency (GHz)
Phase o
f T
eflon
with m
eta
llic p
late
(degre
es)
Anechoic chamber
Simulation CST
With "de-embedding"
Measurement in anechoic chamber Measurement in real environment with
"de-embedding" Measurement in real environment
without "de-embedding" Simulation CST
Tef
lon

48 CH. 1 MATERIAL CHARACTERIZATION IN A NON-ANECHOIC ENVIRONMENT
obtained in a multipath environment, to the theoretical value in CST, coaxial probe measurement [27]
and anechoic chamber.
FIG. 1.20 Permittivity of Teflon
We remind that this method is not suitable for measurements of losses for low loss materials.
1.4.3.2 Commercial absorbing material
We have also measured a commercial absorbing material named ECCOSORB LS 22 [26].
This material is polyurethane foam loaded with carbon powder. From the material characteristics [26],
we can note that for the frequency range 2 GHz to 18 GHz, the permittivity is varying from 2.6 to 1.4
and the loss tangent is decreasing from 1.8 to 0.6. A sample with a size of 15 cm x 15 cm x 5 cm
(length x width x height) was characterized.
As before, we measured at several distances four transmission coefficients: with the antennas
alone, with a metallic plate, with a material sample, and with a material sample backed with a metallic
plate. We extracted from the measured data all the reflection coefficients and the real part of the
permittivity for our material.
In FIG. 1.21a we compared the simulation results with the measurement results in the
anechoic chamber and in the non-anechoic environment for the absorbing material alone. The results
from the measurement are close to those achieved from simulation. By measuring the reflection
coefficient of the material sample backed by the metallic plate, (FIG. 1.21b) we can find the
absorption coefficient and assess whether or not the material can be considered lossy. Nevertheless,
we could have an idea on how high the losses are by using an optimization algorithm under CST for
the reflection coefficient obtained by measurement. We applied the technique described by Fenner et
al. [15] to extract the real part of the permittivity from measurement.
2 4 6 8 10 12 14 16 180
1
2
3
4
5
Frequency (GHz)
eps' -
Teflon
Measurement - real env ironment
Measurement - Anechoic chamber
Material Data sheet
Measurement - coaxial probe
Measurement - wav eguideT
eflo
n

CH. 1. MATERIAL CHARACTERIZATION IN A NON-ANECHOIC ENVIRONMENT 49
a) b)
c) d)
FIG. 1.21 Measured and simulated results for the reflection coefficient of a) ECCOSORB LS 22
without a metallic plate and b) ECCOSORB LS 22 backed with a metallic plate, c) Phase of
ECCOSORB LS 22 without a metallic plate and d) Phase of ECCOSORB LS 22 backed with a
metallic plate
For materials with low losses where the method for the permittivity extraction does not work
we use the optimization tool in CST Microwave Studio where for the simulation we use the real part
of the permittivity extracted from the measurement using the method described by Fenner et al and we
propose an initial value for the imaginary part of the permittivity that is then optimized in CST
Microwave Studio. Thus, the optimization finds an imaginary part of the permittivity that gives us the
complex r used to determinate the reflection coefficient simulated that is as close as possible with the
measurement results and also the material losses.
2 4 6 8 10 12 14 16 18-60
-40
-20
0
Frequency (GHz)
Reflection c
oeff
. of
the a
bsorb
ing m
ate
rial
without
meta
llic p
late
(dB
)
2 4 6 8 10 12 14 16 18-60
-50
-40
-30
-20
-10
0
Frequency (GHz)
Reflection c
oeff
. of
the a
bsorb
ing m
ate
rial
with m
eta
llic p
late
(dB
)
2 4 6 8 10 12 14 16 18-200
-100
0
100
200
Frequency (GHz)
Phase o
f
the a
bsorb
ing m
ate
rial
without
meta
llic p
late
(dB
)
Anechoic chamber
Simulation CST
With "de-embedding"
2 4 6 8 10 12 14 16 18-200
-100
0
100
200
Frequency (GHz)
Phase o
f
the a
bsorb
ing m
ate
rial
with m
eta
llic p
late
(dB
)
Anechoic chamber
Simulation CST
With "de-embedding"
Measurement in anechoic chamber Measurement in real environment with
"de-embedding" Measurement in real environment
without "de-embedding" Simulation CST using the material
characteristic given in [26]
EC
CO
SO
RB
LS
22
Measurement in anechoic chamber Measurement in real environment with
"de-embedding" Measurement in real environment
without "de-embedding" Simulation CST using the material
characteristic given in [26]
EC
CO
SO
RB
LS
22

50 CH. 1 MATERIAL CHARACTERIZATION IN A NON-ANECHOIC ENVIRONMENT
FIG. 1.22 Permittivity of commercial foam ECCOSOLB LS 22
FIG. 1.22 presents the measured results for the real part of the permittivity of the loaded
polyurethane foam ECCOSORB LS 22. The result obtained in a multipath environment is very close
to the value given by the fabricant. The results obtained in a waveguide, coaxial probe and anechoic
chamber confirm also the exactitude of our method in a real environment.
One of the disadvantages of the free-space method is that it has errors for the real part of and
of about 5% and for the losses of 10%. Typically these errors appear due to the uncertainty in the
measured phase of the S-parameters [28, 29]. A material that has losses lower than 0.01 cannot be
characterized using this method [28]. In our case for the Teflon material sample the losses cannot be
extracted but for the lossy commercial material we were able to obtain Tangent delta (FIG. 1.23).
FIG. 1.23 Losses for the absorbing commercial material ECCOSORB LS 22
The non-anechoic extraction of tangent delta coincides with the waveguide measurement in
the frequency band 8.2 - 12.4 GHz and also with the open ended coaxial probe measurement, as well
as, with the measurement in anechoic chamber. Because the coaxial probe does not give accurate
results for the losses at frequencies below 6 GHz we cannot compare the results below this frequency.
2 4 6 8 10 12 14 16 180
1
2
3
4
5
Frequency (GHz)eps'
EC
CO
SO
RB
LS
22
Measurement - real env ironment
Measurement - Anechoic chamber
Material Data sheet
Measurement - coaxial probe
Measurement - wav eguide
2 4 6 8 10 12 14 16 180
2
4
6
8
Frequency (GHz)
Tg d
elta
EC
CO
SO
RB
LS
22
Measurement - real env ironment
Measurement - Anechoic chamber
Material Data sheet
Measurement - coaxial probe
Measurement - wav eguide
EC
CO
SO
RB
LS
22

CH. 1. MATERIAL CHARACTERIZATION IN A NON-ANECHOIC ENVIRONMENT 51
1.5 Conclusion
We have developed a method for material characterization in a multipath environment. The
proposed measurement method does not require an anechoic chamber and allows the extraction of the
material's complex reflection coefficient and real part of the permittivity. Thus, measurements can be
performed into an ordinary room, by using the distance averaging method, in order to reduce the
effects of the multipath propagation. The reflection coefficient that we found for a Teflon sample or a
lossy material commercial sample is close to the simulated one, as well as to the reflection coefficient
measured in an anechoic chamber. By using this parameter, the real part of the permittivity was
obtained for Teflon and for the absorbing material. For the later, we were able also to extract the
losses. This value is close to the theoretical value and to that obtained in waveguide and anechoic
chamber.
Our objective was to determine the reflection coefficient of a material but we have shown that
we can also extract the characteristic of the material.
In this manuscript, most of the measurements were done in the anechoic room for simplicity
and since we have at the laboratory several clean environments (anechoic chambers) we decided to use
one.

52 CH. 1 MATERIAL CHARACTERIZATION IN A NON-ANECHOIC ENVIRONMENT

53
Chapter 2
New Rigid Composite Materials for Anechoic Chamber Applications
2.1 Introduction
The research efforts of last years have focused on the development of new materials for EM
wave absorbers that overcome the disadvantages of the current material used in anechoic chambers.
Pyramidal absorbers made of flexible polyurethane (PU) foam loaded with conductive carbon
black particles is the most used material in anechoic chambers. This material presents several
advantages, but also several disadvantages such as its mechanical flexibility and carbon nanoparticles
load which may be prohibited by the REACH standards in the coming years.
After a brief state of the art of the current used absorber materials composition, a new absorber
material will be presented in this chapter. The characterization of the new composite will be conducted
using the anechoic chamber free space technique. In order to highlight the potential of these materials
as absorbers, simulations of a pyramidal absorber will be achieved. These simulations will allow the
choice of an optimum composite composition which will be further used for the realization of a
prototype. This one will be measured and compared to a commercial absorber.
2.2 Absorber materials composition
The electromagnetic absorber materials are today very important for different military and
civil electronic systems applications. Absorbers are used, for example, for the reduction of
electromagnetic interference (EMI) in various wireless components [30], for the reduction of the radar
cross section (RCS) [31] or as absorbers in measuring chambers [32, 33].
The microwave absorber materials can be categorized by their composition. These
compositions can be divided into two families, or even three. The first one is those having high
dielectric loss, coming from conducting or dielectric loads. The second contains the materials based on
magnetic loss. The third family concerns materials that have dielectric but also magnetic losses.
Absorber materials based on dielectric loss have electric dipoles which interact with the
incident EM wave inducing dielectric losses, and therefore an absorption of the EM wave [34]. These
materials often consist of a combination in between an insulating matrix (non-absorbent material) and
a dielectric or conductive load providing EM absorption.
Carbon is conducting and is one of the most used loads in absorber materials [35]. It is used in
different forms. First, it is used as particles, called carbon black (FIG. 2.1a). This charge has a low
mass and especially a good absorption performance in the high frequency range [36,37]. It is
associated with various matrixes, including polymer materials, such as polyester [38], polyurethane

54 CH2. NEW RIGID COMPOSITE MATERIALS FOR ANECHOIC CHAMBER APPL.
[37] and epoxy [39] resins. Different particle sizes are used, ranging from micrometers to nanometers.
This last size is often preferred because it shows very interesting absorbing performances [40].
Carbon fibers (FIG. 2.1b) are also studied for EM absorber applications. For years, this charge
has been limited to the composites industry for aerospace and naval applications, thanks to these
mechanical reinforcing properties [41]. More recently, carbon fibers have found their place in the field
of electromagnetic shielding, due to their reflectivity properties. In fact, these fibers, associated with a
low resin level, exhibit very high dielectric properties and losses [42]. So, highly charged carbon
composites (> 50%) were used as reflective substrates [42]. Again, with low carbon loading, the wave
reflection on the composite surface can be reduced, therefore allowing absorption inside the composite
[43]. The combination of carbon fibers with different organic matrices [44, 45] and inorganic ones
[46] are currently studied.
Finally, Carbon nanotubes (CNT) (FIG. 2.1c) are also studied as EM absorbers [40, 47, 48].
These materials have a high length/diameter ratio, associated with very high electrical conductivity,
creates good absorber materials with low load rate of CNT [49, 50]. Nevertheless, their high cost [51]
limits their use in the absorber industry.
a) b) c)
FIG. 2.1 Different forms of carbon used for absorber materials: a) particles, b) fibers and c) nanotubes
[52]
Furthermore, dielectric materials, including ferroelectric, are also used to develop EM
absorbers. These materials are used thanks to their high permittivity for other microwave applications,
such as miniaturization of devices [53, 54]. They have very high dielectric loss and so, their use as
absorbers has been attempted in association with other absorber materials. For example, Abbas et al.
[37] used the BaTiO3 with carbon black loaded PU composite, to improve its absorption performance.
Similarly, other studies [55, 56] showed that the combination of the same ferroelectric compound
(BaTiO3) with magnetic absorbers improves the dielectric losses of the composite and also shifts the
absorption to the X band frequencies.
The magnetic absorber family regroups materials with high magnetic permeability and losses,
such as ferrites [57-59]. These materials, consisting of metal oxides (with iron, cobalt or nickel atoms),
exhibit absorption at low frequencies (less than 1 GHz). The composition modification of the ferrites
(combination of different metals or percentage of metals in the oxide) allows the change of their
working frequencies, bringing them to high frequencies (tens of GHz) [60]. This characteristic makes
them very attractive for EM absorber applications, but their high weight is their major disadvantage.
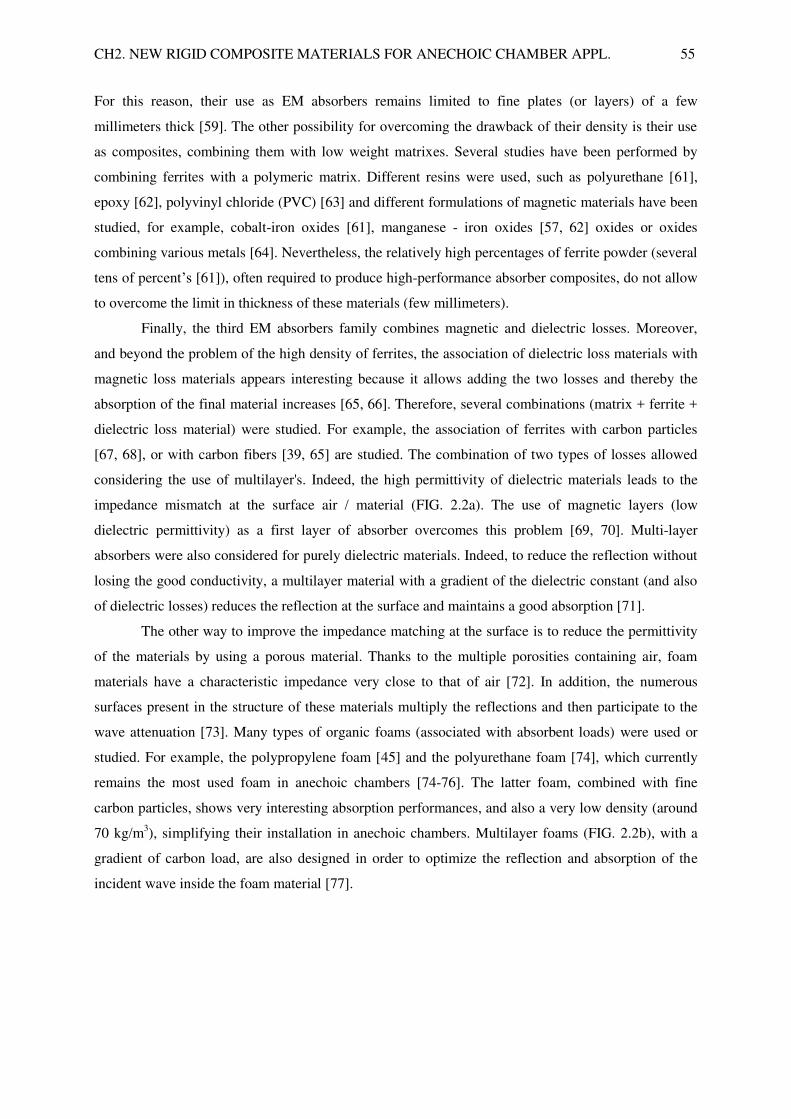
CH2. NEW RIGID COMPOSITE MATERIALS FOR ANECHOIC CHAMBER APPL. 55
For this reason, their use as EM absorbers remains limited to fine plates (or layers) of a few
millimeters thick [59]. The other possibility for overcoming the drawback of their density is their use
as composites, combining them with low weight matrixes. Several studies have been performed by
combining ferrites with a polymeric matrix. Different resins were used, such as polyurethane [61],
epoxy [62], polyvinyl chloride (PVC) [63] and different formulations of magnetic materials have been
studied, for example, cobalt-iron oxides [61], manganese - iron oxides [57, 62] oxides or oxides
combining various metals [64]. Nevertheless, the relatively high percentages of ferrite powder (several
tens of percent’s [61]), often required to produce high-performance absorber composites, do not allow
to overcome the limit in thickness of these materials (few millimeters).
Finally, the third EM absorbers family combines magnetic and dielectric losses. Moreover,
and beyond the problem of the high density of ferrites, the association of dielectric loss materials with
magnetic loss materials appears interesting because it allows adding the two losses and thereby the
absorption of the final material increases [65, 66]. Therefore, several combinations (matrix + ferrite +
dielectric loss material) were studied. For example, the association of ferrites with carbon particles
[67, 68], or with carbon fibers [39, 65] are studied. The combination of two types of losses allowed
considering the use of multilayer's. Indeed, the high permittivity of dielectric materials leads to the
impedance mismatch at the surface air / material (FIG. 2.2a). The use of magnetic layers (low
dielectric permittivity) as a first layer of absorber overcomes this problem [69, 70]. Multi-layer
absorbers were also considered for purely dielectric materials. Indeed, to reduce the reflection without
losing the good conductivity, a multilayer material with a gradient of the dielectric constant (and also
of dielectric losses) reduces the reflection at the surface and maintains a good absorption [71].
The other way to improve the impedance matching at the surface is to reduce the permittivity
of the materials by using a porous material. Thanks to the multiple porosities containing air, foam
materials have a characteristic impedance very close to that of air [72]. In addition, the numerous
surfaces present in the structure of these materials multiply the reflections and then participate to the
wave attenuation [73]. Many types of organic foams (associated with absorbent loads) were used or
studied. For example, the polypropylene foam [45] and the polyurethane foam [74], which currently
remains the most used foam in anechoic chambers [74-76]. The latter foam, combined with fine
carbon particles, shows very interesting absorption performances, and also a very low density (around
70 kg/m3), simplifying their installation in anechoic chambers. Multilayer foams (FIG. 2.2b), with a
gradient of carbon load, are also designed in order to optimize the reflection and absorption of the
incident wave inside the foam material [77].

56 CH2. NEW RIGID COMPOSITE MATERIALS FOR ANECHOIC CHAMBER APPL.
a) b)
FIG. 2.2 a) Multilayer absorber [70] and b) Commercial multilayer absorber (ECCOSORB-AN) [77]
However, the flexibleness of the polyurethane foam does not allow the fabrication of complex
shapes which are needed to enhance the absorption [78, 79]. Furthermore, the impregnation process
used to introduce the carbon particles leads to an inhomogeneous distribution of the load inside the
foam. In addition, the use of nanoparticles remains till today uncertain: these volatile dust particles can
be hazardous to the human health [80]. Because of these disadvantages, several materials have been
proposed, to replace the pyramidal absorbers. The polystyrene (PS) foam loaded with carbon particles
(FIG. 2.3a) is one of these new materials [81]. This solution partly addresses the problem of the PU
foam but brings up a new one that is their recycling problem. Indeed, the diversity of polystyrene (PS
foam, semi-expanded PS and PS hard) and the lightness of this product makes it very hard to recycle
(the different PS should be sorted manually) and very expensive (cost of transport of this very light
and very bulky waste). Moreover, and because of the ecological concerns, "green" alternative
materials have been proposed to replace the polymer matrices. Banana leaves [82], palm shells [83],
coconut shells [84], sugar cane bagasse [85],or rice husk, presented on FIG. 2.3b, have therefore been
studied [86, 87].
a) b)
FIG. 2.3 a) Commercial PS based pyramidal absorbers [81] and b) Rice husk based pyramidal
absorbers [87]
A new class of electronic materials that has attracted a lot of attention since their discovery in
the 1970s are the conducting polymers (CP). This type of material is used for a lot of applications like:
thin film transistors [88], electromagnetic shielding [89], sensor technology [90] and others. The CPs
present electronic properties but also optic properties. Because of these properties and because we can
choose the molecule combination, resulting in multifunctional molecular structures, these materials
can be used for almost any application.

CH2. NEW RIGID COMPOSITE MATERIALS FOR ANECHOIC CHAMBER APPL. 57
2.3 New absorber material
2.3.1 Absorber material composition
As mentioned before, the most used absorber materials in anechoic chambers are the
pyramidal absorbers made of PU foam impregnated with a carbon solution. These absorbers present
lots of advantages like good absorption performances for a large frequency band (between 80 MHz
and 40 GHz) depending on the size and composition (loading rates) of the pyramids [74, 81].
Likewise, they present a relatively low cost and a low weight (around 70 kg/m3) which make their
installation easier in anechoic chambers.
However, these materials present some disadvantages like their flexibility which make their
machining difficult and induces a non-reproducibility of the absorber form. In addition, the flexibility
of the PU foam does not allow the fabrication of complex shapes which are needed to further enhance
the absorption performance [78, 79]. Furthermore, their elaboration process is made by impregnation
of the foam with a solution containing the carbon particles, which induces an inhomogeneous
distribution of the load in the pyramids. It does not allow introducing loads other than small particles
which can be diluted in the impregnation solution. To overcome these disadvantages, the Functional
Materials team of IETR from St. Brieuc has worked on the use of a new composite based on an epoxy
foam matrix, developed in the thesis of Chloé Méjean. Epoxy resins have been widely used for
microwave absorbers [71, 91 - 94] but never in the form of foams. This is preferred in this study
because of the high density (1100 kg/m3) of the (bulk) epoxy resin. Moreover, the presence of a huge
amount of air bubbles in the foams leads to lower values of the real permittivity ( ’) for the epoxy
foam than for the epoxy resin, thus preventing obtaining a high level of reflection [95]. The epoxy
foam matrix presents good electrical insulating properties [96] and very good mechanical behavior
which makes it perfect for usage in anechoic chambers [97]. This matrix has a working temperature
limit higher than the one of the PU foam [73] and presents different densities starting at 130 kg/m3
[96]. In addition, the epoxy matrix has a white color which gives the possibility to color it using
different additives.
As the epoxy foam is a non-absorber matrix, a load consisting of long carbon fibers has been
used to provide the EM absorption property. In the last years, this load has been widely studied for
microwave applications thanks to its high dielectric loss at low concentrations [98]. Furthermore, the
originality of this new composite is to associate carbon fibers to the epoxy foam matrix.
2.3.2 Elaboration method
The elaboration process of the epoxy foams loaded with carbon fibers is fairly simple. The
chosen percentage of load is added to a commercial epoxy resin (PB 170 from Sicomin) and mixed for
a few minutes before adding the commercial hardener agent (DM 02 from Sicomin). This latter
induces the foaming process (during half an hour) and then, the polymerization reaction of the resin

58 CH2. NEW RIGID COMPOSITE MATERIALS FOR ANECHOIC CHAMBER APPL.
(during 6 hours). When the foaming step is complete, a thermal treatment is achieved (6 hours at
60°C) in order to complete the polymerization reaction and fix the mechanical properties of the foam
composite. The carbon fibers used in this study are 3 mm long and 7 μm diameter. Different weight
percentages of carbon fibers (between 0% wt. and 1%wt.) are used to elaborate the absorber materials.
FIG. 2.4a presents the composite in its liquid phase after the mixture of components (resin + carbon
fibers + hardener) and placement in the mold. FIG. 2.4b shows the same composite at the end of the
foaming step. After the heat treatment, the obtained materials are cut to the desired geometry required
for the characterization methods.
a) b)
FIG. 2.4 a) The mixture composite put in the mold and b) the mixture composite after foaming step
2.4 Characterization results of the epoxy composite absorbers
In this section different carbon fiber load percentages have been used for the realization of the
absorbing epoxy foams and characterized using the free space technique.
It should be noted that the X-band waveguide measurement method is not suitable in our case.
The major problems encountered are the air gaps and the small size of the samples: 22.86 x 10.16 x
9.7 mm3 (length x width x height).
Indeed, the porous nature of the epoxy foam (with millimetric porosities) and the addition of
carbon fibers 3 mm length, make the composite heterogeneous at a millimetric scale, which is the
scale of the waveguide measurement in the X-band. As the carbon fibers load increases, this
heterogeneity increases as shown by the different sizes of porosities when the load percentage
increases (FIG. 2.5). In this case, fibers prevent the normal foaming of the epoxy foam resulting in
samples that have bigger or smaller size air holes (FIG. 2.5). For this reasons, it appears very difficult
to characterize this type of material by using the waveguide technique because the small characterized
sample is not representative of the entire composite material which contains porosities and fibers in
the millimetric scale. In addition, the sample surface state is critical for the waveguide measurement
and is very sensitive to the presence of any air gaps. As the surface of the foam is irregular, this
inexorably leads to an under-estimation of the measured dielectric properties.

CH2. NEW RIGID COMPOSITE MATERIALS FOR ANECHOIC CHAMBER APPL. 59
Carbon Loading (% wt.) 0% 0.25% 0.5% 0.75% 1%
Air holes
FIG 2.5 Representation of the air holes inside the material samples
So we consider fine carbon fiber loading percentages in weight (0% wt., 0.25% wt., 0.5% wt.,
0.75 wt. % and 1% wt.) and we characterize them in an anechoic chamber. The grey coloration,
becoming darker as the percentage of fibers increases, should be noted. The samples have the
dimensions 15 X 15 X 6.5 cm3 (length x width x height). FIG. 2.6 shows the photos of the composite
samples used for the free space measurement.
Carbon loading
(% wt.) 0% 0.25% 0.5% 0.75% 1%
Material samples
FIG. 2.6 Material samples for free space measurement depending on the carbon loading
For the anechoic chamber characterization, the reflection coefficient of the samples alone and
of the samples backed by a metallic plate is measured. These two values are needed for the extraction
of the complex permittivity, as explained in Chapter 1. FIG. 2.7 shows the photo of the normal
incidence configuration for the anechoic chamber measurements.
FIG. 2.7 Photo of measurement configuration for normal incidence in anechoic chamber of IETR
localized at INSA, Rennes, France
5 mm
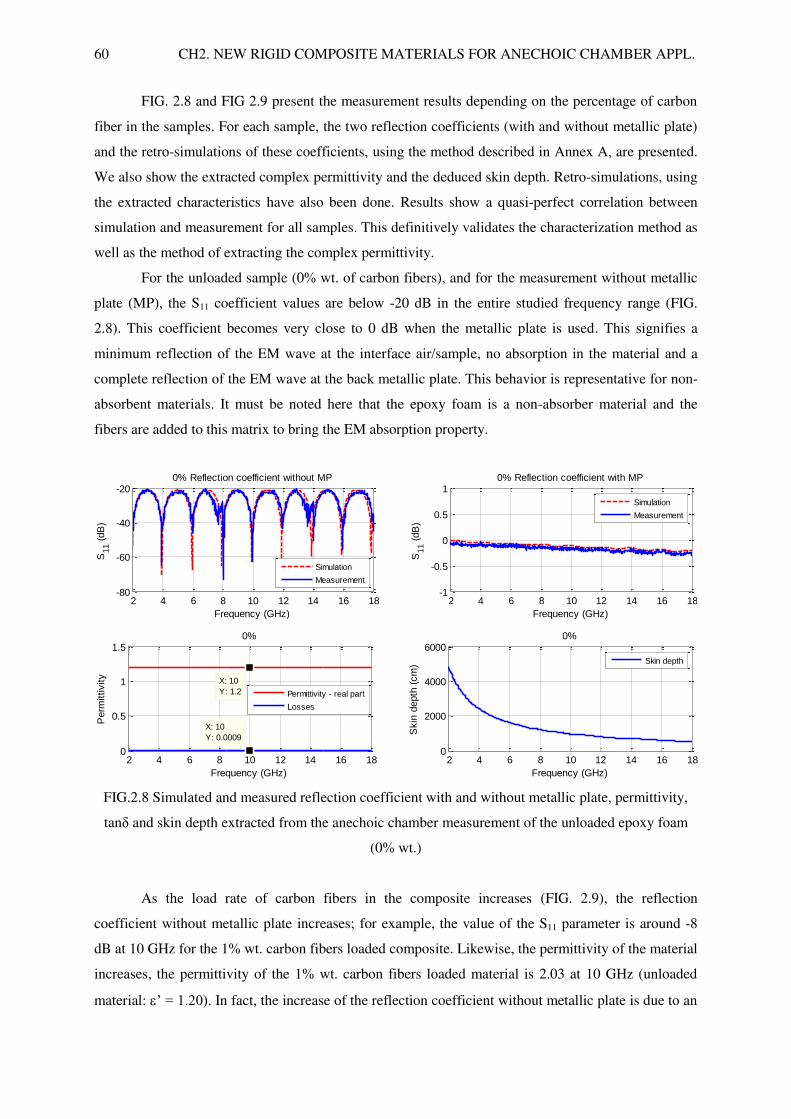
60 CH2. NEW RIGID COMPOSITE MATERIALS FOR ANECHOIC CHAMBER APPL.
FIG. 2.8 and FIG 2.9 present the measurement results depending on the percentage of carbon
fiber in the samples. For each sample, the two reflection coefficients (with and without metallic plate)
and the retro-simulations of these coefficients, using the method described in Annex A, are presented.
We also show the extracted complex permittivity and the deduced skin depth. Retro-simulations, using
the extracted characteristics have also been done. Results show a quasi-perfect correlation between
simulation and measurement for all samples. This definitively validates the characterization method as
well as the method of extracting the complex permittivity.
For the unloaded sample (0% wt. of carbon fibers), and for the measurement without metallic
plate (MP), the S11 coefficient values are below -20 dB in the entire studied frequency range (FIG.
2.8). This coefficient becomes very close to 0 dB when the metallic plate is used. This signifies a
minimum reflection of the EM wave at the interface air/sample, no absorption in the material and a
complete reflection of the EM wave at the back metallic plate. This behavior is representative for non-
absorbent materials. It must be noted here that the epoxy foam is a non-absorber material and the
fibers are added to this matrix to bring the EM absorption property.
FIG.2.8 Simulated and measured reflection coefficient with and without metallic plate, permittivity,
tan and skin depth extracted from the anechoic chamber measurement of the unloaded epoxy foam
(0% wt.)
As the load rate of carbon fibers in the composite increases (FIG. 2.9), the reflection
coefficient without metallic plate increases; for example, the value of the S11 parameter is around -8
dB at 10 GHz for the 1% wt. carbon fibers loaded composite. Likewise, the permittivity of the material
increases, the permittivity of the 1% wt. carbon fibers loaded material is 2.03 at 10 GHz (unloaded
material: ’ = 1.20). In fact, the increase of the reflection coefficient without metallic plate is due to an
2 4 6 8 10 12 14 16 18-80
-60
-40
-20
Frequency (GHz)
S11 (
dB
)
0% Reflection coefficient without MP
Simulation
Measurement
2 4 6 8 10 12 14 16 18-1
-0.5
0
0.5
1
Frequency (GHz)
S11 (
dB
)
0% Reflection coefficient with MP
Simulation
Measurement
2 4 6 8 10 12 14 16 180
0.5
1
1.5
X: 10
Y: 1.2
Frequency (GHz)
Perm
ittivity
0%
X: 10
Y: 0.0009
Permittivity - real part
Losses
2 4 6 8 10 12 14 16 180
2000
4000
6000
Frequency (GHz)
Skin
depth
(cm
)
0%
Skin depth
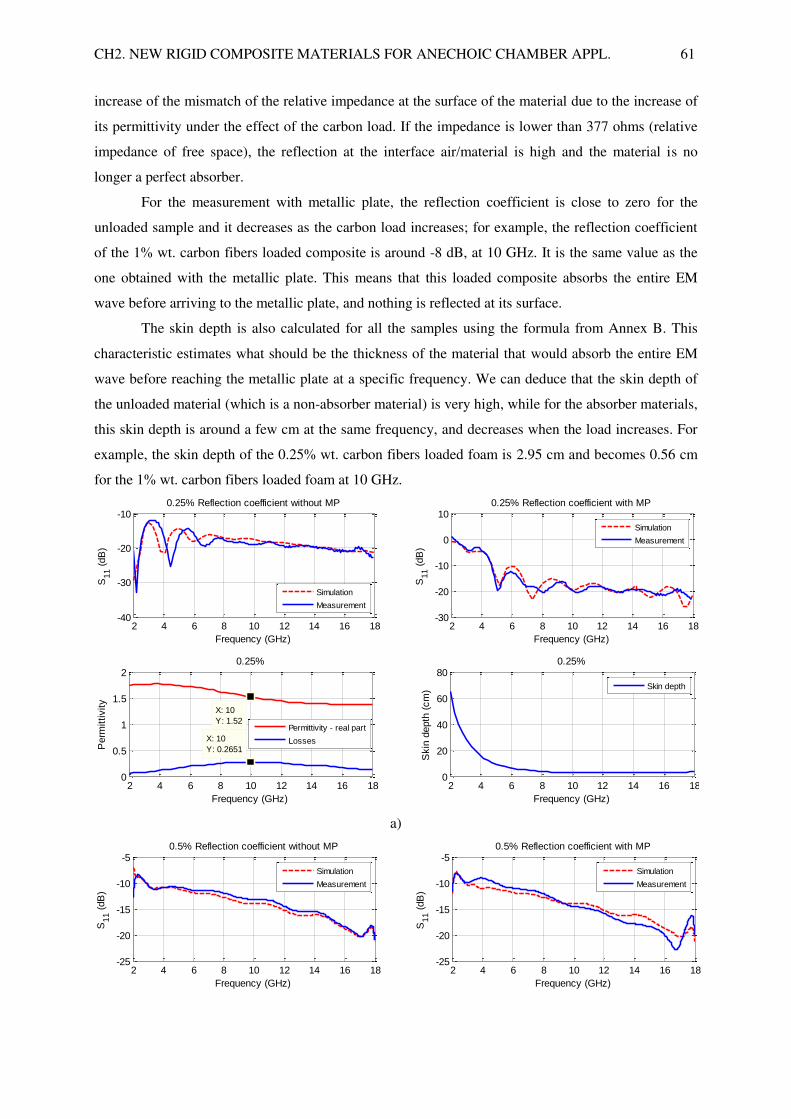
CH2. NEW RIGID COMPOSITE MATERIALS FOR ANECHOIC CHAMBER APPL. 61
increase of the mismatch of the relative impedance at the surface of the material due to the increase of
its permittivity under the effect of the carbon load. If the impedance is lower than 377 ohms (relative
impedance of free space), the reflection at the interface air/material is high and the material is no
longer a perfect absorber.
For the measurement with metallic plate, the reflection coefficient is close to zero for the
unloaded sample and it decreases as the carbon load increases; for example, the reflection coefficient
of the 1% wt. carbon fibers loaded composite is around -8 dB, at 10 GHz. It is the same value as the
one obtained with the metallic plate. This means that this loaded composite absorbs the entire EM
wave before arriving to the metallic plate, and nothing is reflected at its surface.
The skin depth is also calculated for all the samples using the formula from Annex B. This
characteristic estimates what should be the thickness of the material that would absorb the entire EM
wave before reaching the metallic plate at a specific frequency. We can deduce that the skin depth of
the unloaded material (which is a non-absorber material) is very high, while for the absorber materials,
this skin depth is around a few cm at the same frequency, and decreases when the load increases. For
example, the skin depth of the 0.25% wt. carbon fibers loaded foam is 2.95 cm and becomes 0.56 cm
for the 1% wt. carbon fibers loaded foam at 10 GHz.
a)
2 4 6 8 10 12 14 16 18-40
-30
-20
-10
Frequency (GHz)
S11 (
dB
)
0.25% Reflection coefficient without MP
Simulation
Measurement
2 4 6 8 10 12 14 16 18-30
-20
-10
0
10
Frequency (GHz)
S11 (
dB
)
0.25% Reflection coefficient with MP
Simulation
Measurement
2 4 6 8 10 12 14 16 180
0.5
1
1.5
2
X: 10
Y: 1.52
Frequency (GHz)
Perm
ittivity
0.25%
X: 10
Y: 0.2651
Permittivity - real part
Losses
2 4 6 8 10 12 14 16 180
20
40
60
80
Frequency (GHz)
Skin
depth
(cm
)
0.25%
Skin depth
2 4 6 8 10 12 14 16 18-25
-20
-15
-10
-5
Frequency (GHz)
S11 (
dB
)
0.5% Reflection coefficient without MP
Simulation
Measurement
2 4 6 8 10 12 14 16 18-25
-20
-15
-10
-5
Frequency (GHz)
S11 (
dB
)
0.5% Reflection coefficient with MP
Simulation
Measurement

62 CH2. NEW RIGID COMPOSITE MATERIALS FOR ANECHOIC CHAMBER APPL.
b)
c)
d)
2 4 6 8 10 12 14 16 180
2
4
6
X: 10
Y: 1.204
Frequency (GHz)
Perm
ittivity
0.5%
X: 10
Y: 0.7907
Permittivity - real part
Losses
2 4 6 8 10 12 14 16 180
5
10
15
20
Frequency (GHz)
Skin
depth
(cm
)
0.5%
Skin depth
2 4 6 8 10 12 14 16 18-20
-15
-10
-5
0
Frequency (GHz)
S11 (
dB
)
0.75% Reflection coefficient without MP
Simulation
Measurement
2 4 6 8 10 12 14 16 18-20
-15
-10
-5
Frequency (GHz)S
11 (
dB
)
0.75% Reflection coefficient with MP
Simulation
Measurement
2 4 6 8 10 12 14 16 180
5
10
X: 10
Y: 1.53
Frequency (GHz)
Perm
ittivity
0.75%
X: 10
Y: 1.171
Permittivity - real part
Losses
2 4 6 8 10 12 14 16 180
20
40
60
Frequency (GHz)
Skin
depth
(cm
)
0.75%
Skin depth
2 4 6 8 10 12 14 16 18-15
-10
-5
0
Frequency (GHz)
S11 (
dB
)
1% Reflection coefficient without MP
Simulation
Measurement
2 4 6 8 10 12 14 16 18-15
-10
-5
0
Frequency (GHz)
S11 (
dB
)
1% Reflection coefficient with MP
Simulation
Measurement
2 4 6 8 10 12 14 16 180
5
10
15
20
X: 10
Y: 2.038
Frequency (GHz)
Perm
ittivity
1%
X: 10
Y: 1.384
Permittivity - real part
Losses
2 4 6 8 10 12 14 16 180
10
20
30
Frequency (GHz)
Skin
depth
(cm
)
1%
Skin depth

CH2. NEW RIGID COMPOSITE MATERIALS FOR ANECHOIC CHAMBER APPL. 63
e)
FIG.2.9 Simulated and measured reflection coefficient with and without metallic plate, permittivity,
tan and skin depth extracted from the anechoic chamber measurement of the epoxy foams loaded
with carbon fibers a) 0.25% wt., b) 0.5% wt., c) 0.75% wt. d) 1% wt. and e) Permittivity and losses
comparison for all load rate composites
FIG. 2.9e summarizes the permittivity and dielectric losses of all the epoxy composites. It
shows that the composite materials have a relatively low permittivity (compared to those obtained on
the resin composite [95]). The permittivity increases when the load increases. Concurrently, high
values of Tan are obtained, which increases with the increase of the load rate. A dielectric loss (Tan)
of 0.001 and 1.39 are obtained for, respectively, unloaded and 1% wt. loaded composites at 10 GHz.
2.4.1 Non-anechoic environment technique
We can also characterize these samples by applying the technique in a non - anechoic
environment. For simplicity we have done all our measurements in the anechoic chamber of IETR but
the non-anechoic environment technique can be applied for all the samples. Here, we will only
validate the measurement, in the non-anechoic environment, of the sample loaded with 0.25% wt.
carbon fibers and compare with the previous results for this sample.
As before, we measured at several distances the four transmission coefficients: with the
antennas alone, with a metallic plate, with a material sample, and with a material sample backed by a
metallic plate. We extracted from the measured data all the reflection coefficients and the real part of
the permittivity for our material.
In FIG. 2.10 we compared the simulation results with the measurement results in the anechoic
chamber and in the non-anechoic environment for the absorbing material alone and with the metallic
plate. The extracted reflection coefficients, after the "de-embedding", are close to the simulated
coefficients and to the measured coefficients in anechoic chamber.
2 4 6 8 10 12 14 16 181
6
11
16
Frequency (GHz)
Eps'
Permittivity - Free space
0%
0.25%
0.5%
0.75%
1%
2 4 6 8 10 12 14 16 180
0.5
1
1.5
2
Frequency (GHz)
Tg d
elta
Permittivity - Free space

64 CH2. NEW RIGID COMPOSITE MATERIALS FOR ANECHOIC CHAMBER APPL.
a)
b)
c) d)
FIG. 2.10 Measured and simulated results for the reflection coefficient of the a) foam without a
metallic plate mean value, b) foam without a metallic plate, c) foam backed with a metallic plate mean
value and d) foam backed with a metallic plate
We applied the technique described by Fenner et al. [15] to extract the permittivity from the
measurement (FIG. 2.11). These results show a good correlation between the dielectric properties (’
and Tan) obtained from the different measurement techniques. This validates again the proposed
measurement method in non-anechoic chamber.
2 4 6 8 10 12 14 16 18-60
-40
-20
0
Frequency (GHz)
Reflection c
oeff
icie
nt
of
0.2
5%
without
meta
llic p
late
(dB
)
2 4 6 8 10 12 14 16 18-60
-40
-20
0
Frequency (GHz)
Reflection c
oeff
icie
nt
of
0.2
5%
without
meta
llic p
late
(dB
)
2 4 6 8 10 12 14 16 18-60
-40
-20
0
Frequency (GHz)
Reflection c
oeff
icie
nt
of
0.2
5%
with m
eta
llic p
late
(dB
)
2 4 6 8 10 12 14 16 18-60
-40
-20
0
Frequency (GHz)
Reflection c
oeff
icie
nt
of
0.2
5%
with m
eta
llic p
late
(dB
)______ Measurement in anechoic chamber ______ Measurement in real environment with
"de-embedding" ****** Measurement in real environment
without "de-embedding" ______ Simulation CST
Fo
am
______ Measurement in anechoic chamber ______ Measurement in real environment with
"de-embedding" ****** Measurement in real environment
without "de-embedding" ______ Simulation CST
Fo
am

CH2. NEW RIGID COMPOSITE MATERIALS FOR ANECHOIC CHAMBER APPL. 65
FIG. 2.11 Permittivity of the Polymer foam loaded with 0.25% wt. carbon fibers
We can assume that the method developed for a non-anechoic environment gives us an
accurate reflection coefficient and absorption and that we also can use these coefficients to extract the
permittivity of the dielectric material.
2.5 Pyramidal absorber prototype based on the epoxy foam loaded with carbon
fibers
2.5.1 Simulation results
In order to estimate the absorption performance of the new composite, simulations of a
pyramidal absorber have been carried out using CST Microwave Studio software (Frequency domain
and Floquet theory so that we can consider an infinite structure and also a perfect environment). The
chosen absorber geometry is the one of the APM12 commercial absorber from SIEPEL [74]. It
consists of a combination of square-based pyramids, of 9 cm high and 3.8 x 3.8 cm2 base deposited on
a 2.5 cm thick base (FIG. 2.12). The dielectric properties, obtained in anechoic chamber, for the
different composites (0.25% wt. to 1% wt. carbon load) are used for these simulations (FIG. 2.9e).
FIG. 2.12 Size of the pyramidal geometry
FIG. 2.13 shows the simulated reflection coefficient using CST Microwave Studio in
Frequency domain and Floquet theory of the pyramidal geometry for the different carbon fiber
compositions for normal incidence (0o) and for two oblique incidence angles (30
o and 45
o) of the EM
2 4 6 8 10 12 14 16 181
2
3
4
5
Frequency (GHz)
eps' -
Foam
Measurement - anechoic chamber
Measurement - real environment
Simulation CST
2 4 6 8 10 12 14 16 180
0.2
0.4
0.6
0.8
1
Frequency (GHz)
Losses -
Foam
Measurement - anechoic chamber
Measurement - real environment
Simulation CST
90
mm
25
mm
38 mm PEC
Fo
am

66 CH2. NEW RIGID COMPOSITE MATERIALS FOR ANECHOIC CHAMBER APPL.
wave. We have used the TE polarization of the wave. From these results, we can note that the
composite loaded with 0.25% wt. carbon fibers presents the least interesting reflection coefficient,
above -20 dB for frequencies below 6.5 GHz. This result is certainly due to the low dielectric loss
obtained for this sample. The other load rates present better reflection coefficients. The best is
obtained for the 0.5% wt. loaded composite; this is particularly valid for oblique incidence except at
low frequencies at normal incidence. For this reason and as this composition (0.5% wt.) shows the best
homogeneity, it was chosen for the next part of the study.
a) b)
c)
FIG. 2.13 Simulated reflection coefficients of the APM12 geometry with properties of the epoxy
foams loaded with different rates of carbon fibers (0.25% wt., 0.5% wt., 0.75% wt. and 1% wt.) for a)
normal incidence 0o, b) oblique incidence of 30
o and c) oblique incidence of 45
o
In order to compare the chosen epoxy composite to the commercial one, simulations of the
reflection coefficient using the epoxy composite and a commercial one were conducted. The CST
software in Frequency domain, Floquet theory and the APM12 pyramidal geometry (FIG. 2.12) were
used. We recall that the used commercial material is the PU foam soaked with carbon particles (noted
here G1) and the used new composite is the 0.5% wt. carbon fibers loaded epoxy foam. Different
angles of incidence of the EM wave are tested: normal incidence (0o) and two oblique incidence angles
(30o and 45
o) for TE polarization. Theoretically, the results obtained at normal incidence should be the
same for both polarizations (TE and TM) but at oblique incidence the results start to be different. In
our case, at oblique incidence we have studied only the TE polarization.
For normal incidence, FIG. 2.14a shows a better reflection coefficient for the epoxy material
than the one obtained for the commercial absorber except at low frequencies. This result predicts a
2 4 6 8 10 12 14 16 18-80
-60
-40
-20
0
Frequency (GHz)
S11 (
dB
)
APM12 - Normal incidence
0.25%
0.5%
0.75%
1%
2 4 6 8 10 12 14 16 18-80
-60
-40
-20
0
Frequency (GHz)S
11 (
dB
)
APM12 - Oblique incidence (300)
0.25%
0.5%
0.75%
1%
2 4 6 8 10 12 14 16 18-80
-60
-40
-20
0
Frequency (GHz)
S11 (
dB
)
APM12 - Oblique incidence (450)
0.25%
0.5%
0.75%
1%

CH2. NEW RIGID COMPOSITE MATERIALS FOR ANECHOIC CHAMBER APPL. 67
gain of several dB in the frequency range between 3 and 18 GHz. The mean gain in this frequency
band is equal to 6 dB. But lower performances for the prototype than those calculated for the
commercial absorber are observed for frequencies lower than 3 GHz. Furthermore, a lower gain is
observed with the epoxy prototype for the incidence angle of 300
and TE polarization, with a mean
gain of 2 dB calculated in the frequency range from 3 GHz to 18 GHz (FIG. 2.14b). No improvement
is observed with the epoxy prototype for the angle of 450
and TE polarization at oblique incidence
(FIG. 2.14c). Results remain very promising for the new composite and this material is further used
for the prototype achievement.
a) b)
c)
FIG. 2.14 Simulated reflection coefficients of the APM12 geometry with the SIEPEL material (G1)
and 0.5% wt. carbon fibers loaded epoxy foam for a) normal incidence 0o, b) oblique incidence of 30
o
and c) oblique incidence of 45o
2.5.2 Prototype characterization
The photos of the achieved prototype are presented in FIG. 2.15a. The absorber prototype
contains 64 pyramids and is made of the epoxy foam loaded with 0.5% wt. carbon fibers. FIG. 2.15b
shows the commercial absorber APM12 (which contains also 64 pyramids) made of carbon particles
loaded PU foam (G1), used for the comparison with our prototype.
2 4 6 8 10 12 14 16 18-80
-60
-40
-20
0
Frequency (GHz)
S11 (
dB
)
APM12 - Normal incidence
Commercial material
0.5% Anechoic chamber
2 4 6 8 10 12 14 16 18-80
-60
-40
-20
0
Frequency (GHz)
S11 (
dB
)
APM12 - Oblique incidence (300)
Commercial material
0.5% Anechoic chamber
2 4 6 8 10 12 14 16 18-80
-60
-40
-20
0
Frequency (GHz)
S11 (
dB
)
APM12 - Oblique incidence (450)
Commercial material
0.5% Anechoic chamber

68 CH2. NEW RIGID COMPOSITE MATERIALS FOR ANECHOIC CHAMBER APPL.
a)
b)
FIG. 2.15 a) Absorber prototype made of pyramidal epoxy foam loaded with 0.5% carbon fibers and
b) APM12 commercial absorber (from Siepel) made of G1 material
The measurement of the two prototypes is done in the anechoic chamber using the free space
method. The photos of the prototypes under the measurement configuration are presented in FIG. 2.16.
a) b)
FIG. 2.16 Measurement setup in the anechoic chamber for the pyramidal prototypes made of a) 0.5%
wt. carbon fibers loaded epoxy foam and b) SIEPEL commercial material G1
FIG. 2.17 shows the results of the reflection coefficient measurement of the two prototypes,
for normal and oblique incidence (0o and 30
o). For both incidences, the reflection coefficient reaches
values underneath -30 dB in the frequency range between 4 and 18 GHz. Moreover, FIG. 2.17 shows
that the prototype and the commercial absorber have similar performances in the frequency band
between 7 GHz and 18 GHz. Between 3 and 7 GHz, the epoxy prototype shows better absorption
performances: a mean gain of 8 dB is calculated in this frequency range for both incidences (00 and
30o). We note here that the oblique incidence measurement with an angle of 45
o could not be

CH2. NEW RIGID COMPOSITE MATERIALS FOR ANECHOIC CHAMBER APPL. 69
performed because this configuration needed a relatively high distance between the antennas (higher
than 2 m), which could not be obtained in the used anechoic chamber. The measurements are in good
agreement with the simulation run from the complex permittivity extracted from the anechoic
chamber. This confirms that the extracted properties are correct and representative of the composite
material.
a) b)
FIG. 2.17 Measurement results of APM12 geometry prototypes made with the SIEPEL PU foam (G1)
and the 0.5% wt. carbon fibers loaded epoxy foam at a) normal incidence and b) oblique incidence 30o
The prototype has also been measured at the CHEOPS anechoic chamber of CELAR (DGA).
FIG. 2.18 shows the photo of this chamber. Bistatic Radar Cross Section (RCS) of the epoxy prototype
and of the commercial absorber are obtained as a function of frequency, for different incidence angles
(between -60o and +60
o) and for horizontal and vertical polarizations of the EM wave.
FIG. 2.18 CHEOPS Anechoic chamber of CELAR (DGA), France
FIG. 2.19 presents the measured RCS signal in the frequency range between 2 and 18 GHz of
the metallic plate (FIG. 2.19a and b), the epoxy prototype and the APM12 commercial absorber (FIG.
2.19c to FIG. 2.19f). First, we can note that the RCS measurements present different results in
function of the polarization of the EM wave. Normally, these results should be similar because of the
symmetrical geometry of the prototypes. But here, the use of an L shape metallic plate behind the
structures induces a difference which is obviously not observed on the measurement of the metallic
plate alone and very little observed on the prototypes backed by the metallic plate (FIG. 2.19a and b).
2 4 6 8 10 12 14 16 18-80
-60
-40
-20
0
Frequency (GHz)
S11 (
dB
)
Measurement
G1
0.5%
2 4 6 8 10 12 14 16 18
-60
-40
-20
0
Frequency (GHz)
S11 (
dB
)
Measurement
G1
0.5%
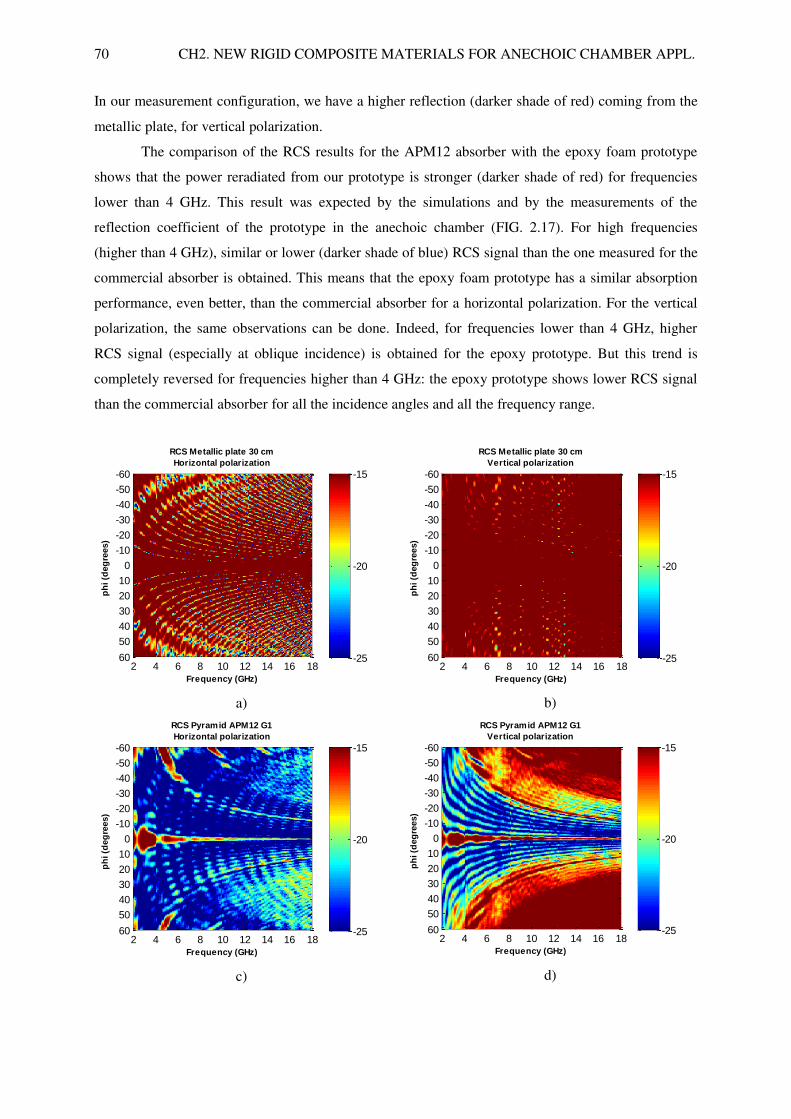
70 CH2. NEW RIGID COMPOSITE MATERIALS FOR ANECHOIC CHAMBER APPL.
In our measurement configuration, we have a higher reflection (darker shade of red) coming from the
metallic plate, for vertical polarization.
The comparison of the RCS results for the APM12 absorber with the epoxy foam prototype
shows that the power reradiated from our prototype is stronger (darker shade of red) for frequencies
lower than 4 GHz. This result was expected by the simulations and by the measurements of the
reflection coefficient of the prototype in the anechoic chamber (FIG. 2.17). For high frequencies
(higher than 4 GHz), similar or lower (darker shade of blue) RCS signal than the one measured for the
commercial absorber is obtained. This means that the epoxy foam prototype has a similar absorption
performance, even better, than the commercial absorber for a horizontal polarization. For the vertical
polarization, the same observations can be done. Indeed, for frequencies lower than 4 GHz, higher
RCS signal (especially at oblique incidence) is obtained for the epoxy prototype. But this trend is
completely reversed for frequencies higher than 4 GHz: the epoxy prototype shows lower RCS signal
than the commercial absorber for all the incidence angles and all the frequency range.
a)
b)
c)
d)
Frequency (GHz)
ph
i (d
eg
rees)
RCS Metallic plate 30 cm
Horizontal polarization
2 4 6 8 10 12 14 16 18
-60
-50
-40
-30
-20
-10
0
10
20
30
40
50
60 -25
-20
-15
Frequency (GHz)
ph
i (d
eg
rees)
RCS Metallic plate 30 cm
Vertical polarization
2 4 6 8 10 12 14 16 18
-60
-50
-40
-30
-20
-10
0
10
20
30
40
50
60 -25
-20
-15
Frequency (GHz)
ph
i (d
eg
rees)
RCS Pyramid APM12 G1
Horizontal polarization
2 4 6 8 10 12 14 16 18
-60
-50
-40
-30
-20
-10
0
10
20
30
40
50
60 -25
-20
-15
Frequency (GHz)
ph
i (d
eg
rees)
RCS Pyramid APM12 G1
Vertical polarization
2 4 6 8 10 12 14 16 18
-60
-50
-40
-30
-20
-10
0
10
20
30
40
50
60 -25
-20
-15
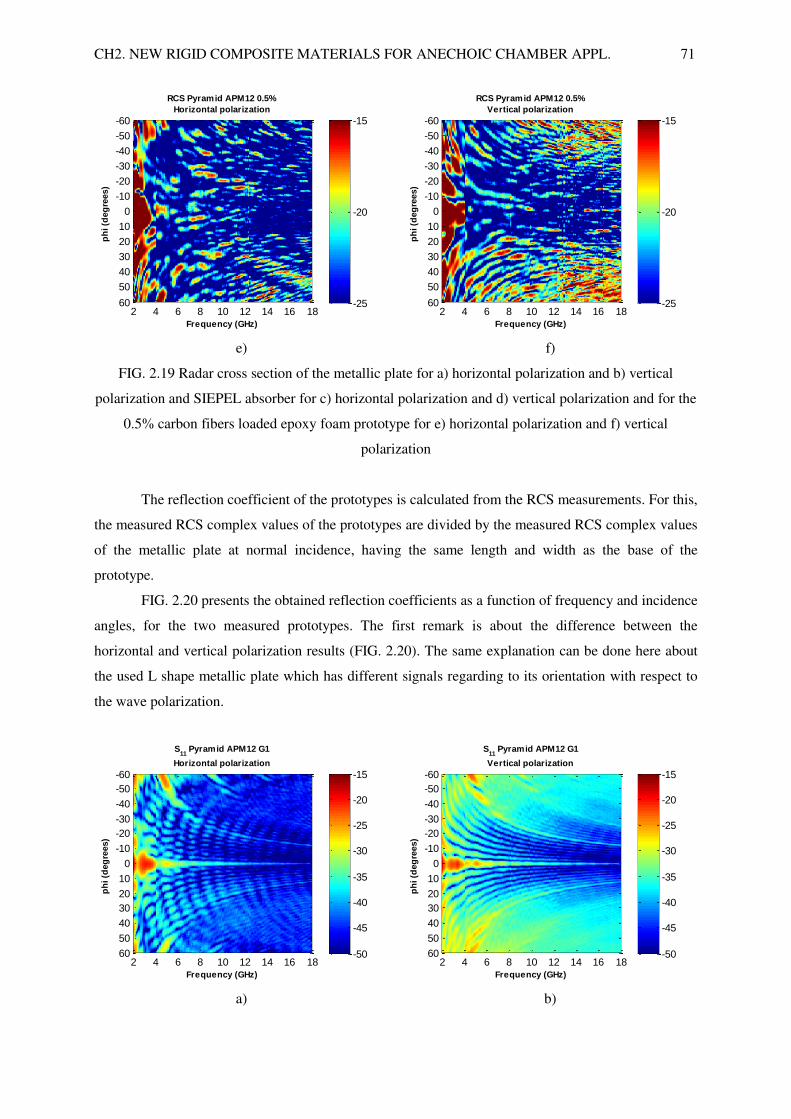
CH2. NEW RIGID COMPOSITE MATERIALS FOR ANECHOIC CHAMBER APPL. 71
e)
f)
FIG. 2.19 Radar cross section of the metallic plate for a) horizontal polarization and b) vertical
polarization and SIEPEL absorber for c) horizontal polarization and d) vertical polarization and for the
0.5% carbon fibers loaded epoxy foam prototype for e) horizontal polarization and f) vertical
polarization
The reflection coefficient of the prototypes is calculated from the RCS measurements. For this,
the measured RCS complex values of the prototypes are divided by the measured RCS complex values
of the metallic plate at normal incidence, having the same length and width as the base of the
prototype.
FIG. 2.20 presents the obtained reflection coefficients as a function of frequency and incidence
angles, for the two measured prototypes. The first remark is about the difference between the
horizontal and vertical polarization results (FIG. 2.20). The same explanation can be done here about
the used L shape metallic plate which has different signals regarding to its orientation with respect to
the wave polarization.
a)
b)
Frequency (GHz)
ph
i (d
eg
rees)
RCS Pyramid APM12 0.5%
Horizontal polarization
2 4 6 8 10 12 14 16 18
-60
-50
-40
-30
-20
-10
0
10
20
30
40
50
60 -25
-20
-15
Frequency (GHz)
ph
i (d
eg
rees)
RCS Pyramid APM12 0.5%
Vertical polarization
2 4 6 8 10 12 14 16 18
-60
-50
-40
-30
-20
-10
0
10
20
30
40
50
60 -25
-20
-15
Frequency (GHz)
ph
i (d
eg
rees)
S11
Pyramid APM12 G1
Horizontal polarization
2 4 6 8 10 12 14 16 18
-60
-50
-40
-30
-20
-10
0
10
20
30
40
50
60 -50
-45
-40
-35
-30
-25
-20
-15
Frequency (GHz)
ph
i (d
eg
rees)
S11
Pyramid APM12 G1
Vertical polarization
2 4 6 8 10 12 14 16 18
-60
-50
-40
-30
-20
-10
0
10
20
30
40
50
60 -50
-45
-40
-35
-30
-25
-20
-15
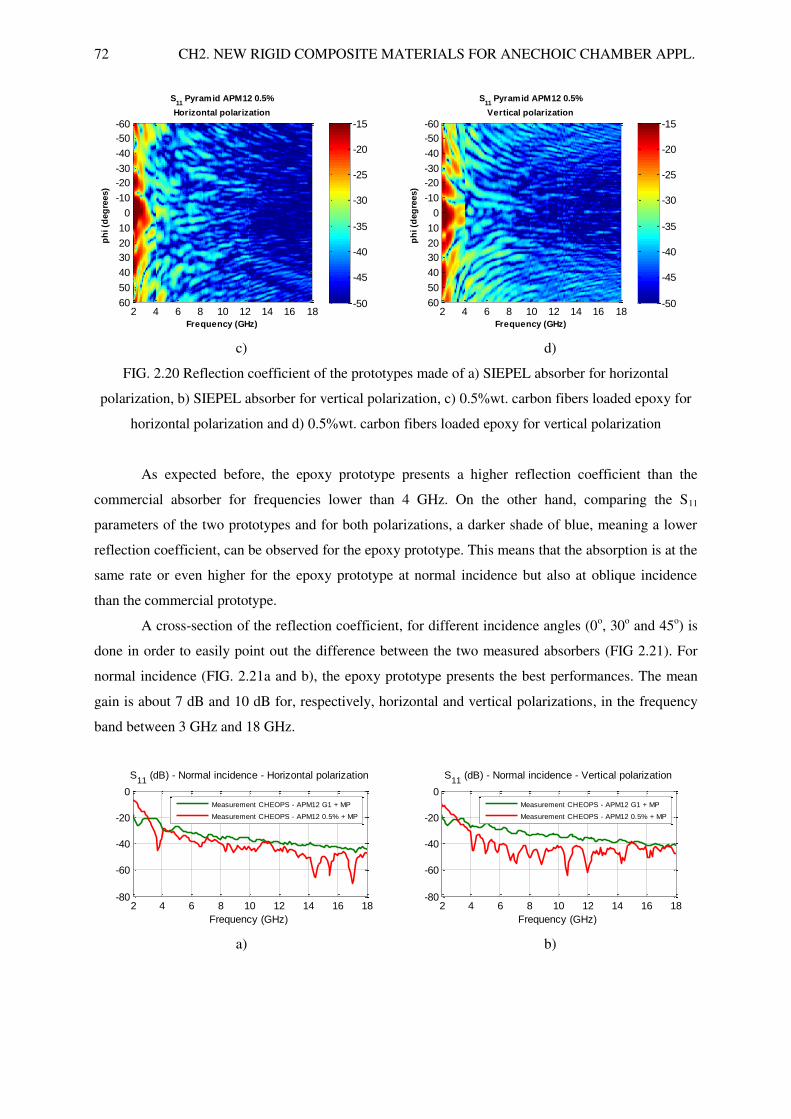
72 CH2. NEW RIGID COMPOSITE MATERIALS FOR ANECHOIC CHAMBER APPL.
c)
d)
FIG. 2.20 Reflection coefficient of the prototypes made of a) SIEPEL absorber for horizontal
polarization, b) SIEPEL absorber for vertical polarization, c) 0.5%wt. carbon fibers loaded epoxy for
horizontal polarization and d) 0.5%wt. carbon fibers loaded epoxy for vertical polarization
As expected before, the epoxy prototype presents a higher reflection coefficient than the
commercial absorber for frequencies lower than 4 GHz. On the other hand, comparing the S11
parameters of the two prototypes and for both polarizations, a darker shade of blue, meaning a lower
reflection coefficient, can be observed for the epoxy prototype. This means that the absorption is at the
same rate or even higher for the epoxy prototype at normal incidence but also at oblique incidence
than the commercial prototype.
A cross-section of the reflection coefficient, for different incidence angles (0o, 30
o and 45
o) is
done in order to easily point out the difference between the two measured absorbers (FIG 2.21). For
normal incidence (FIG. 2.21a and b), the epoxy prototype presents the best performances. The mean
gain is about 7 dB and 10 dB for, respectively, horizontal and vertical polarizations, in the frequency
band between 3 GHz and 18 GHz.
a) b)
Frequency (GHz)
ph
i (d
eg
rees)
S11
Pyramid APM12 0.5%
Horizontal polarization
2 4 6 8 10 12 14 16 18
-60
-50
-40
-30
-20
-10
0
10
20
30
40
50
60 -50
-45
-40
-35
-30
-25
-20
-15
Frequency (GHz)
ph
i (d
eg
rees)
S11
Pyramid APM12 0.5%
Vertical polarization
2 4 6 8 10 12 14 16 18
-60
-50
-40
-30
-20
-10
0
10
20
30
40
50
60 -50
-45
-40
-35
-30
-25
-20
-15
2 4 6 8 10 12 14 16 18-80
-60
-40
-20
0
Frequency (GHz)
S11
(dB) - Normal incidence - Horizontal polarization
Measurement CHEOPS - APM12 G1 + MP
Measurement CHEOPS - APM12 0.5% + MP
2 4 6 8 10 12 14 16 18-80
-60
-40
-20
0
Frequency (GHz)
S11
(dB) - Normal incidence - Vertical polarization
Measurement CHEOPS - APM12 G1 + MP
Measurement CHEOPS - APM12 0.5% + MP

CH2. NEW RIGID COMPOSITE MATERIALS FOR ANECHOIC CHAMBER APPL. 73
c) d)
e) f)
FIG. 2.21 Calculated reflection coefficient (from RCS measurements) for SIEPEL absorber and for the
epoxy prototype for a) normal incidence and horizontal polarization, b) normal incidence and vertical
polarization, c) oblique incidence of 30° and horizontal polarization, d) oblique incidence of 30° and
vertical polarization, e) oblique incidence of 45° and horizontal polarization, d) oblique incidence of
45° and vertical polarization
The frequency limit of 3 GHz, from which the epoxy prototype presents lower absorption
performances, is highlighted in this cross section. This value is in perfect correlation with the
simulations and measurement (in an anechoic chamber) results of the absorbers (FIG. 2.17).
FIG. 2.21c to FIG. 2.21f present the reflection coefficient of the epoxy prototype compared to
the commercial absorber, for oblique incidence angles, respectively, of 30o and 45
o. Indeed, for the
two incidence angles, a better gain is observed for vertical polarization. Mean gains of 5 dB and 8 dB
are calculated for the epoxy prototype, between 3 GHz and 18 GHz, for vertical polarization and for,
respectively, oblique incidence at 30o and 45
o. Lower and non-significant gains are obtained for
horizontal polarization; they are about 2 dB and 1 dB for incidence angles of, respectively, 30o and
45o, and in the same frequency range (between 3 GHz and 18 GHz). Furthermore, it can be noted that
the reflection coefficient of the epoxy prototype remains below -20 dB in this frequency band for
normal incidence, and below -30 dB for oblique incidence. It has to be noted here, that the gain values
are very close to those obtained by the measurements in the anechoic chamber and also those of
previous simulations. All these results are very encouraging for this first prototype made from the new
developed absorber material.
2 4 6 8 10 12 14 16 18-80
-60
-40
-20
0
Frequency (GHz)
S11
(dB) - Oblique incidence (300) - Horizontal polarization
Measurement CHEOPS - APM12 G1 + MP
Measurement CHEOPS - APM12 0.5% + MP
2 4 6 8 10 12 14 16 18-80
-60
-40
-20
0
Frequency (GHz)
S11
(dB) - Oblique incidence (300) - Vertical polarization
Measurement CHEOPS - APM12 G1 + MP
Measurement CHEOPS - APM12 0.5% + MP
2 4 6 8 10 12 14 16 18-80
-60
-40
-20
0
Frequency (GHz)
S11
(dB) - Oblique incidence (450) - Horizontal polarization
Measurement CHEOPS - APM12 G1 + MP
Measurement CHEOPS - APM12 0.5% + MP
2 4 6 8 10 12 14 16 18-80
-60
-40
-20
0
Frequency (GHz)
S11
(dB) - Oblique incidence (450) - Vertical polarization
Measurement CHEOPS - APM12 G1 + MP
Measurement CHEOPS - APM12 0.5% + MP

74 CH2. NEW RIGID COMPOSITE MATERIALS FOR ANECHOIC CHAMBER APPL.
In conclusion, the simulated and characterization results of the new home-made prototype
(epoxy foam loaded with 0.5% wt. of carbon fibers), compared to a commercial absorber prototype
(APM12 from SIEPEL), show very promising results for the new composite for frequencies higher
than 3 GHz. The lowering of performance below a limit frequency of 3 GHz is probably due to the
dielectric characteristics of the material in this frequency band.
2.6 Ideal absorber material
Using the equations from Annexes A and B, we have conducted the present study where we
tried to determine what should be the optimal characteristics for an ideal EM absorber. For this, we
have used the dielectric characteristics of the epoxy foam loaded with 0.5% wt. carbon fibers. It should
be remembered that this composition has shown the best results and was used for the prototype
achievement. Here, we use Matlab software, limiting the geometry of the absorbent material to a
single dielectric slab material (FIG. 2.22). In order to study the optimization for low frequencies, the
thickness of the material layer is fixed at d = 6.5 cm.
Where:
FIG. 2.22 Single dielectric slab
For each couple of dielectric characteristics, the reflection coefficient (with and without a
metallic plate), the transmission coefficient, the absorption coefficient, the intrinsic impedance and the
skin depth, are calculated. Simulations are conducted, firstly, by maintaining constant one of the two
dielectric characteristics of the material (real permittivity or dielectric loss) and varying the second
Γ1, T1
Γ2, T2
Air
ηa=1
PEC
ηb=0
d Z1
S11
Z2
S22
η1 , k1
E
Mat
eria
l M
ater
ial
d
Air
ηa=1
Air
ηa=1
Z1
S11
Z2
S22
η1 , k1
Γ2, T2
E
Γ1, T1

CH2. NEW RIGID COMPOSITE MATERIALS FOR ANECHOIC CHAMBER APPL. 75
one, then after, by using the two limit values of permittivity (low and high limits) and varying the
dielectric losses.
So, first, we maintain fixed the real part of the permittivity and vary (increase) the losses of the
0.5% wt. carbon fibers epoxy material (FIG. 2.9b). In FIG 2.23, we can see that when the imaginary
part of the permittivity (or Tan) is low, we have a better absorption and an intrinsic impedance closer
to 377 ohms. Moreover, these simulations show that the reflection coefficient is still higher at low
frequencies (higher than the needed -10 dB for the absorber), whatever the values of dielectric losses.
This means that having high losses is not sufficient to have a good absorber material, but high losses
are also imperative to have a good absorption.
FIG. 2.23 Study as a function of the increased losses of epoxy foam loaded with 0.5% carbon fibers
For the next simulations, we maintain fixed the real part of the permittivity and decrease the
losses (FIG. 2.24). Here, we can observe again that the best absorption coefficient is obtained for the
lower losses. This result confirms the previous conclusion (FIG. 2.23) that an ideal absorber must not
present very high losses.
FIG. 2.24 Study as a function of the decreased losses of epoxy foam loaded with 0.5% carbon fibers
2 4 6 8 10 12 14 16 181
2
3
4
5
Frequency (GHz)
real(eps)
Epoxy 0.5%
2 4 6 8 10 12 14 16 180
1
2
3
4
Frequency (GHz)
Tg d
elta
Epoxy 0.5%
2 4 6 8 10 12 14 16 18-30
-20
-10
0
Frequency (GHz)
S11 w
ith m
eta
l(dB
)
Epoxy 0.5%
2 4 6 8 10 12 14 16 18-30
-20
-10
0
Frequency (GHz)
S11 w
ithout
meta
l(dB
)
Epoxy 0.5%
2 4 6 8 10 12 14 16 18-300
-200
-100
0
Frequency (GHz)
Tra
nsm
issio
n(d
B)
Epoxy 0.5%
2 4 6 8 10 12 14 16 180.5
0.6
0.7
0.8
0.9
1
Frequency (GHz)
Absorp
tion
Epoxy 0.5%
2 4 6 8 10 12 14 16 180
100
200
300
400
Frequency (GHz)
Z (
ohm
s)
Epoxy 0.5%
2 4 6 8 10 12 14 16 180
5
10
15
20
Frequency (GHz)S
kin
depth
(cm
)
Epoxy 0.5%
2 4 6 8 10 12 14 16 181
2
3
4
5
Frequency (GHz)
real(eps)
Epoxy 0.5%
2 4 6 8 10 12 14 16 180
0.5
1
Frequency (GHz)
Tg d
elta
Epoxy 0.5%
2 4 6 8 10 12 14 16 18-40
-30
-20
-10
0
Frequency (GHz)
S11 w
ith m
eta
l(dB
)
Epoxy 0.5%
2 4 6 8 10 12 14 16 18-30
-20
-10
0
Frequency (GHz)
S11 w
ithout
meta
l(dB
)
Epoxy 0.5%
2 4 6 8 10 12 14 16 18-60
-40
-20
0
Frequency (GHz)
Tra
nsm
issio
n(d
B)
Epoxy 0.5%
2 4 6 8 10 12 14 16 180.5
0.6
0.7
0.8
0.9
1
Frequency (GHz)
Absorp
tion
Epoxy 0.5%
2 4 6 8 10 12 14 16 18100
200
300
400
Frequency (GHz)
Z (
ohm
s)
Epoxy 0.5%
2 4 6 8 10 12 14 16 180
5
10
15
20
Frequency (GHz)
Skin
depth
(cm
)
Epoxy 0.5%

76 CH2. NEW RIGID COMPOSITE MATERIALS FOR ANECHOIC CHAMBER APPL.
In the second part, we maintain fixed the losses and vary (increase) the real part of the
permittivity of the composite (FIG. 2.25). Here, we can observe that for this used tangent delta (lower
than 1), the reflection coefficient is lower (higher absorption) for the lower permittivity values. We can
conclude that for an absorber material with tangent delta near 1, we need a low real permittivity to
obtain a good absorber.
FIG. 2.25 Study as a function of the increased permittivity of epoxy foam loaded with 0.5% carbon
fibers
In the next part, we maintain fixed the losses but decrease the real part of the permittivity of
the composite (FIG. 2.26). Here, and for a Tan near 1, the absorption increases when the permittivity
decreases. We can note here that the reflection coefficients are very low. We can conclude that for
losses around 1, we need a low real permittivity (near to 1, the permittivity of air) in order to have an
intrinsic impedance close to 377 ohms and so low reflection of the EM wave.
An equalization is noted around the frequency of 10 GHz. This is due to the values of the
simulated permittivity, exactly equal to 1.
FIG. 2.26 Study as a function of the decreased permittivity of epoxy foam loaded with 0.5% carbon
fibers
2 4 6 8 10 12 14 16 180
5
10
Frequency (GHz)
real(eps)
Epoxy 0.5%
2 4 6 8 10 12 14 16 180.2
0.4
0.6
0.8
1
Frequency (GHz)
Tg d
elta
Epoxy 0.5%
2 4 6 8 10 12 14 16 18-30
-20
-10
0
Frequency (GHz)
S11 w
ith m
eta
l(dB
)
Epoxy 0.5%
2 4 6 8 10 12 14 16 18-25
-20
-15
-10
-5
Frequency (GHz)
S11 w
ithout
meta
l(dB
)
Epoxy 0.5%
2 4 6 8 10 12 14 16 18-150
-100
-50
0
Frequency (GHz)
Tra
nsm
issio
n(d
B)
Epoxy 0.5%
2 4 6 8 10 12 14 16 180.5
0.6
0.7
0.8
0.9
1
Frequency (GHz)
Absorp
tion
Epoxy 0.5%
2 4 6 8 10 12 14 16 180
100
200
300
400
Frequency (GHz)
Z (
ohm
s)
Epoxy 0.5%
2 4 6 8 10 12 14 16 180
5
10
15
20
Frequency (GHz)
Skin
depth
(cm
)
Epoxy 0.5%
2 4 6 8 10 12 14 16 181
2
3
4
5
Frequency (GHz)
real(eps)
Epoxy 0.5%
2 4 6 8 10 12 14 16 180.2
0.4
0.6
0.8
1
Frequency (GHz)
Tg d
elta
Epoxy 0.5%
2 4 6 8 10 12 14 16 18-25
-20
-15
-10
-5
Frequency (GHz)
S11 w
ith m
eta
l(dB
)
Epoxy 0.5%
2 4 6 8 10 12 14 16 18-25
-20
-15
-10
-5
Frequency (GHz)
S11 w
ithout
meta
l(dB
)
Epoxy 0.5%
2 4 6 8 10 12 14 16 18-60
-40
-20
0
Frequency (GHz)
Tra
nsm
issio
n(d
B)
Epoxy 0.5%
2 4 6 8 10 12 14 16 180.5
0.6
0.7
0.8
0.9
1
Frequency (GHz)
Absorp
tion
Epoxy 0.5%
2 4 6 8 10 12 14 16 18100
200
300
400
Frequency (GHz)
Z (
ohm
s)
Epoxy 0.5%
2 4 6 8 10 12 14 16 180
5
10
15
20
Frequency (GHz)
Skin
depth
(cm
)
Epoxy 0.5%
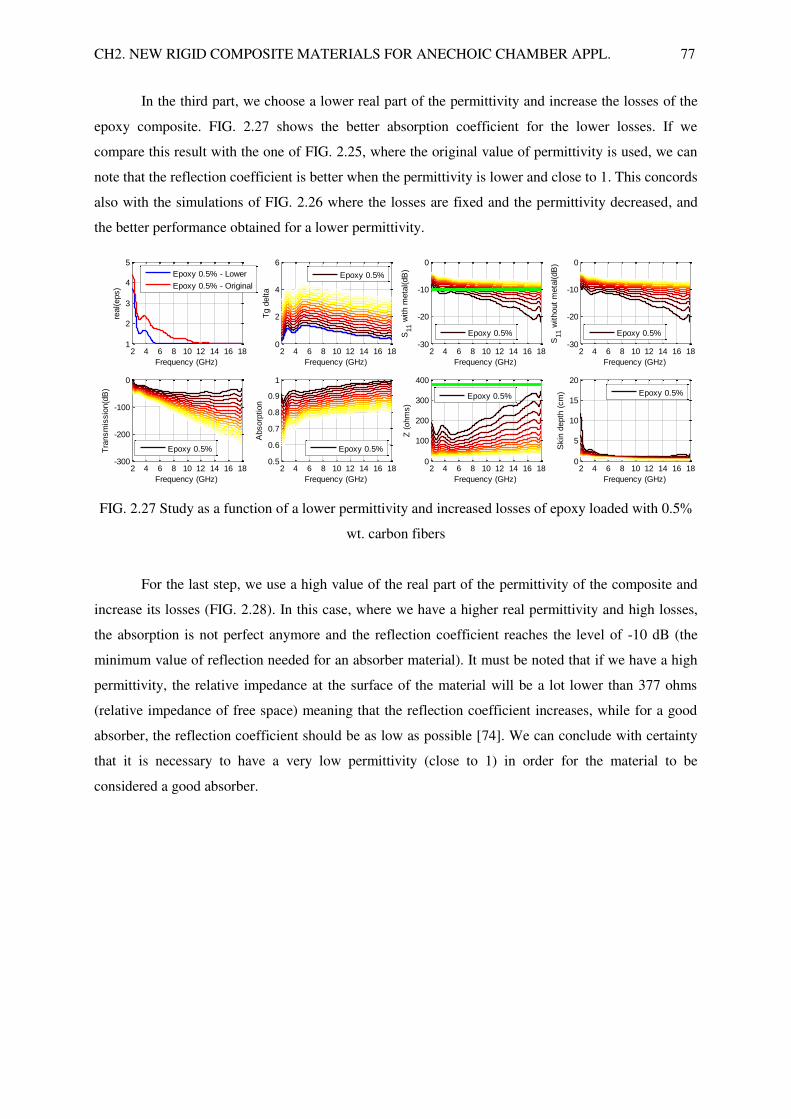
CH2. NEW RIGID COMPOSITE MATERIALS FOR ANECHOIC CHAMBER APPL. 77
In the third part, we choose a lower real part of the permittivity and increase the losses of the
epoxy composite. FIG. 2.27 shows the better absorption coefficient for the lower losses. If we
compare this result with the one of FIG. 2.25, where the original value of permittivity is used, we can
note that the reflection coefficient is better when the permittivity is lower and close to 1. This concords
also with the simulations of FIG. 2.26 where the losses are fixed and the permittivity decreased, and
the better performance obtained for a lower permittivity.
FIG. 2.27 Study as a function of a lower permittivity and increased losses of epoxy loaded with 0.5%
wt. carbon fibers
For the last step, we use a high value of the real part of the permittivity of the composite and
increase its losses (FIG. 2.28). In this case, where we have a higher real permittivity and high losses,
the absorption is not perfect anymore and the reflection coefficient reaches the level of -10 dB (the
minimum value of reflection needed for an absorber material). It must be noted that if we have a high
permittivity, the relative impedance at the surface of the material will be a lot lower than 377 ohms
(relative impedance of free space) meaning that the reflection coefficient increases, while for a good
absorber, the reflection coefficient should be as low as possible [74]. We can conclude with certainty
that it is necessary to have a very low permittivity (close to 1) in order for the material to be
considered a good absorber.
2 4 6 8 10 12 14 16 181
2
3
4
5
Frequency (GHz)
real(eps)
Epoxy 0.5% - Lower
Epoxy 0.5% - Original
2 4 6 8 10 12 14 16 180
2
4
6
Frequency (GHz)
Tg d
elta
Epoxy 0.5%
2 4 6 8 10 12 14 16 18-30
-20
-10
0
Frequency (GHz)
S11 w
ith m
eta
l(dB
)
Epoxy 0.5%
2 4 6 8 10 12 14 16 18-30
-20
-10
0
Frequency (GHz)
S11 w
ithout
meta
l(dB
)
Epoxy 0.5%
2 4 6 8 10 12 14 16 18-300
-200
-100
0
Frequency (GHz)
Tra
nsm
issio
n(d
B)
Epoxy 0.5%
2 4 6 8 10 12 14 16 180.5
0.6
0.7
0.8
0.9
1
Frequency (GHz)
Absorp
tion
Epoxy 0.5%
2 4 6 8 10 12 14 16 180
100
200
300
400
Frequency (GHz)
Z (
ohm
s)
Epoxy 0.5%
2 4 6 8 10 12 14 16 180
5
10
15
20
Frequency (GHz)
Skin
depth
(cm
)
Epoxy 0.5%

78 CH2. NEW RIGID COMPOSITE MATERIALS FOR ANECHOIC CHAMBER APPL.
FIG. 2.28 Study us a function of a higher permittivity and increased losses of epoxy loaded with 0.5%
wt. carbon fibers
The same observations are done for the other simulated materials. In fact, this study was also
conducted on the 0.75% wt. carbon fibers epoxy foam, which has different dielectric characteristics
than the 0.5 % wt. one and also than the G1 and G2 SIEPEL materials. We have chosen these four
materials because they do not have the same type of behavior for the permittivity and tangent delta.
For the two commercial materials, both permittivity and Tan decrease with frequency, and the two
other materials (carbon fibers loaded epoxy foams) have a permittivity which decreases with
frequency while the losses increase. The simulation results show exactly the same behavior as a
function of the increase (or decrease) of the permittivity and dielectric losses.
In conclusion, we can say that a material can be considered as a perfect absorber if: its real
part of the permittivity is very low, close to the one of the free space, in order to avoid any
discontinuities between the material and air and its losses to be lower than 1. If the losses are very high
(Tan >> 1), then the imaginary part of the permittivity is very high ( ">>1) resulting in σ = ω " >>1.
This means that the material has the ability to conduct the electric current and becomes a good
conductor, and not a good dielectric.
Because the study has been done only using a specific thickness, the results will change if we
increase or decrease this variable but the conclusion will still stand. Moreover, results strengthen our
choice of the 0.5% wt. carbon fibers loaded epoxy foam for the realization of the prototype. Indeed,
this composite presents relatively high losses, but not higher than 1, combined with relatively low
permittivity.
2 4 6 8 10 12 14 16 180
2
4
6
8
Frequency (GHz)
real(eps)
Epoxy 0.5% - Higher
Epoxy 0.5% - Original
2 4 6 8 10 12 14 16 180
1
2
3
4
Frequency (GHz)
Tg d
elta
Epoxy 0.5%
2 4 6 8 10 12 14 16 18-15
-10
-5
0
Frequency (GHz)
S11 w
ith m
eta
l(dB
)
Epoxy 0.5%
2 4 6 8 10 12 14 16 18-15
-10
-5
0
Frequency (GHz)
S11 w
ithout
meta
l(dB
)
Epoxy 0.5%
2 4 6 8 10 12 14 16 18-600
-400
-200
0
Frequency (GHz)
Tra
nsm
issio
n(d
B)
Epoxy 0.5%
2 4 6 8 10 12 14 16 180.5
0.6
0.7
0.8
0.9
1
Frequency (GHz)
Absorp
tion
Epoxy 0.5%
2 4 6 8 10 12 14 16 180
100
200
300
400
Frequency (GHz)
Z (
ohm
s)
Epoxy 0.5%
2 4 6 8 10 12 14 16 180
5
10
15
20
Frequency (GHz)
Skin
depth
(cm
)
Epoxy 0.5%
CH2. NEW RIGID COMPOSITE MATERIALS FOR ANECHOIC CHAMBER APPL. 79
2.7 Conclusion
In this chapter, a novel composite was used as an absorber material. The new composite is
made of epoxy foam loaded with carbon fibers and is developed in the Functional Materials team of
the IETR lab, installed in St Brieuc. The dielectric characterization in anechoic chamber of the epoxy
composites loaded with different fiber rates, shows high dielectric losses with relatively low
permittivity. Simulation of a pyramidal absorber made of the 0.5% wt. carbon fibers loaded epoxy
foam is conducted using the commercial geometry of the APM12 absorber from SIEPEL. The
simulations, for three incidence angles, show very interesting reflection coefficients, similar to the
commercial absorber, even better for the epoxy prototype at normal incidence. The achievement of the
composite prototype is done. The characterization of the prototype and the APM12 absorber show also
similar absorption performances, even better for the prototype for some frequencies, like predicted by
the simulations. The new material presents low performance for frequencies below 3 GHz, probably
due to the type of charge. However, the epoxy foam loaded with carbon fibers shows very interesting
results and is promising for use as a pyramidal absorber in anechoic chambers.
Subsequently, in order to understand the influence of the permittivity and the dielectric loss on
the absorption performance of a material, a numerical study is conducted using the dielectric
characteristics of the epoxy composites and commercial materials. One of the two characteristics is
fixed, when the second is varied (increased or decreased). The different simulations show that an ideal
absorber needs very low relative permittivity (close to 1) and high dielectric losses, but with tan
lower than 1, in order to keep a dielectric composite behavior (not a conductor one) and to keep the
relative impedance at the surface of the material close to 377 ohms, relative impedance of free space.

80 CH2. NEW RIGID COMPOSITE MATERIALS FOR ANECHOIC CHAMBER APPL.

81
Chapter 3
Absorber Geometry Optimization for Anechoic Chambers
3.1 Introduction
A key design item for an anechoic chamber is the radio frequency (RF) absorber. Absorbers
will absorb the electromagnetic energy to provide a non - reflecting environment. A typical RF
absorber is a lossy material shaped to allow incoming electromagnetic waves to penetrate with
minimal reflections. Once the electromagnetic (EM) energy travels inside the material, the RF energy
is transformed into thermal energy and dissipates into the surrounding air. The electrical thickness of
the material determinates how much energy is absorbed.
Much research has been focused on developing absorbers with superior absorbing properties.
Several standard shapes have been proposed and used, such as: pyramidal, truncated pyramid, wedge,
convoluted and others. The most used shapes for anechoic chambers are the pyramid and the wedge.
The idea is to use materials which gradually taper from an impedance near that of free space at the
front surface to that of a lossy medium at the back surface.
This chapter presents various optimized absorber structures obtained either by modifying the
standard shape of the absorber or employing optimization algorithms such as genetic algorithm and
others.
The main objective is to improve the absorbing properties such as low normal incidence
reflection, low forward scatter and backscatter at wide incidence angles, lower usable frequency, wide
bandwidth and reduced absorber thickness. This can improve the quietness of anechoic chambers, the
efficiency and the required room size.
3.2 Standard absorber shapes used in anechoic chambers
3.2.1 Twisted pyramidal absorber
FIG. 3.1 Geometry of a standard twisted pyramidal absorber
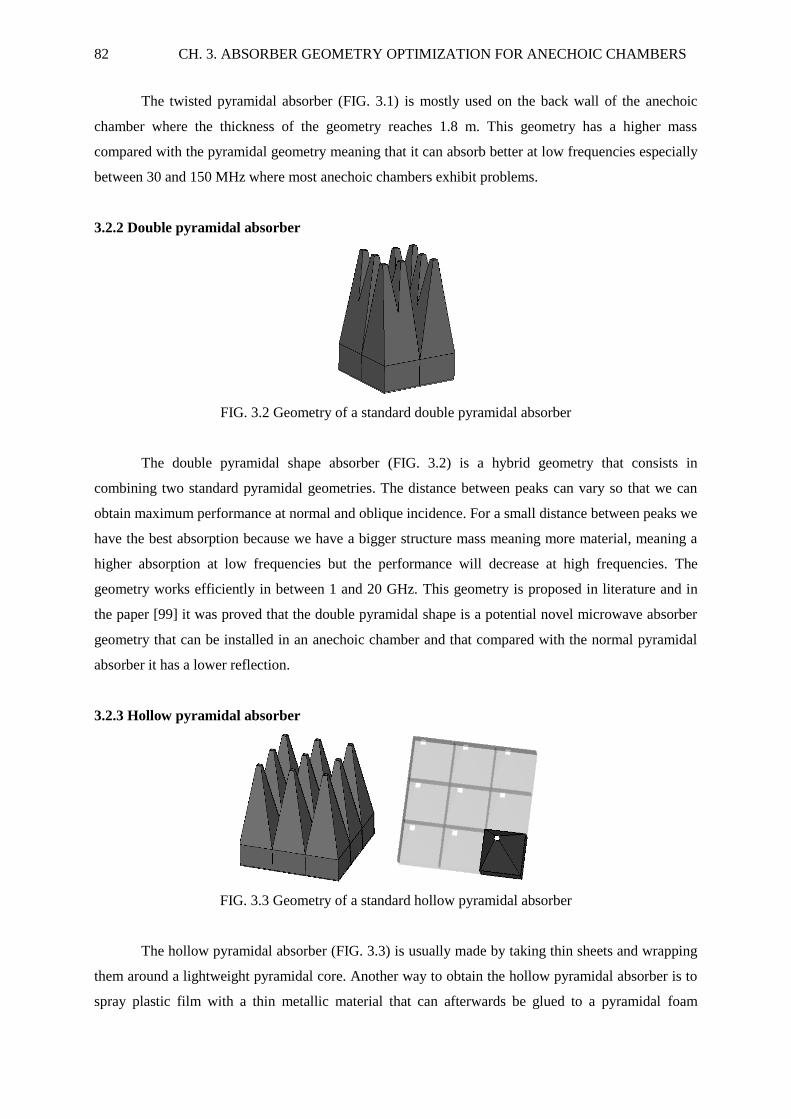
82 CH. 3. ABSORBER GEOMETRY OPTIMIZATION FOR ANECHOIC CHAMBERS
The twisted pyramidal absorber (FIG. 3.1) is mostly used on the back wall of the anechoic
chamber where the thickness of the geometry reaches 1.8 m. This geometry has a higher mass
compared with the pyramidal geometry meaning that it can absorb better at low frequencies especially
between 30 and 150 MHz where most anechoic chambers exhibit problems.
3.2.2 Double pyramidal absorber
FIG. 3.2 Geometry of a standard double pyramidal absorber
The double pyramidal shape absorber (FIG. 3.2) is a hybrid geometry that consists in
combining two standard pyramidal geometries. The distance between peaks can vary so that we can
obtain maximum performance at normal and oblique incidence. For a small distance between peaks we
have the best absorption because we have a bigger structure mass meaning more material, meaning a
higher absorption at low frequencies but the performance will decrease at high frequencies. The
geometry works efficiently in between 1 and 20 GHz. This geometry is proposed in literature and in
the paper [99] it was proved that the double pyramidal shape is a potential novel microwave absorber
geometry that can be installed in an anechoic chamber and that compared with the normal pyramidal
absorber it has a lower reflection.
3.2.3 Hollow pyramidal absorber
FIG. 3.3 Geometry of a standard hollow pyramidal absorber
The hollow pyramidal absorber (FIG. 3.3) is usually made by taking thin sheets and wrapping
them around a lightweight pyramidal core. Another way to obtain the hollow pyramidal absorber is to
spray plastic film with a thin metallic material that can afterwards be glued to a pyramidal foam

CH. 3. ABSORBER GEOMETRY OPTIMIZATION FOR ANECHOIC CHAMBERS 83
support. These types of geometries are usually used at low frequencies between 30 MHz and 1 GHz
[100].
3.2.4 Cylinder pyramidal absorber
FIG. 3.4 Geometry of a standard cylinder pyramidal absorber
The cylinder pyramidal absorber (FIG. 3.4) can be a good substitute for the standard
pyramidal absorber but it can be difficult to fabricate without a mold. Also, depending on the material
used if the mechanical properties are not good the geometry might become difficult to create. The
performance is the same as the standard pyramidal geometry [101]. The cylinder pyramidal absorber
geometry could be used as a novel shape in anechoic chambers but for the moment is just proposed in
literature.
3.2.5 Triangular pyramidal absorber
FIG.3.5 Geometry of a standard triangular pyramidal absorber
Depending on the material used for the realization of the geometry (FIG. 3.5) it has been
proven that some shapes work better than others [102]. For the triangular pyramidal absorber
mentioned in literature we can use an isosceles or equilateral triangle. In [102], the isosceles triangular
pyramidal absorber shows a lower reflection loss in the frequency range of 1 - 20 GHz comparing with
the equilateral triangular pyramidal absorber.

84 CH. 3. ABSORBER GEOMETRY OPTIMIZATION FOR ANECHOIC CHAMBERS
3.2.6 Hexagonal pyramidal absorber
FIG. 3.6 Geometry of a standard hexagonal pyramidal absorber
Another type of shape proposed in literature is the hexagonal pyramidal absorber (FIG. 3.6).
Like the triangular pyramidal absorber depending on the material used to fabricate the samples, this
geometry can give better or the same performances as the standard pyramidal shape [103]. A truncated
hexagonal pyramidal absorber can also be fabricated for usage in anechoic chambers for emission and
immunity testing. The geometry is symmetrical, so the performance will be the same for both
polarizations at normal incidence. The frequency range where this geometry usually shows a lower
reflection coefficient than the pyramidal shape is 1 - 20 GHz. It was shown that by using a novel
material made of agricultural waste (rice husk) [103], this geometry can be developed and also the
truncated hexagonal pyramidal absorber. The results presented in this paper show a gain of 1 - 2 dB
for this geometry in comparison with the normal pyramid.
3.2.7 Convoluted microwave absorber
FIG. 3.7 Geometry of a standard convoluted microwave absorber
Usually the convoluted microwave absorber (FIG. 3.7) is used at high frequencies for
millimeter measurements. The geometry is made of a convoluted foam and the manufacturing
technique is usually used in the furniture industry.
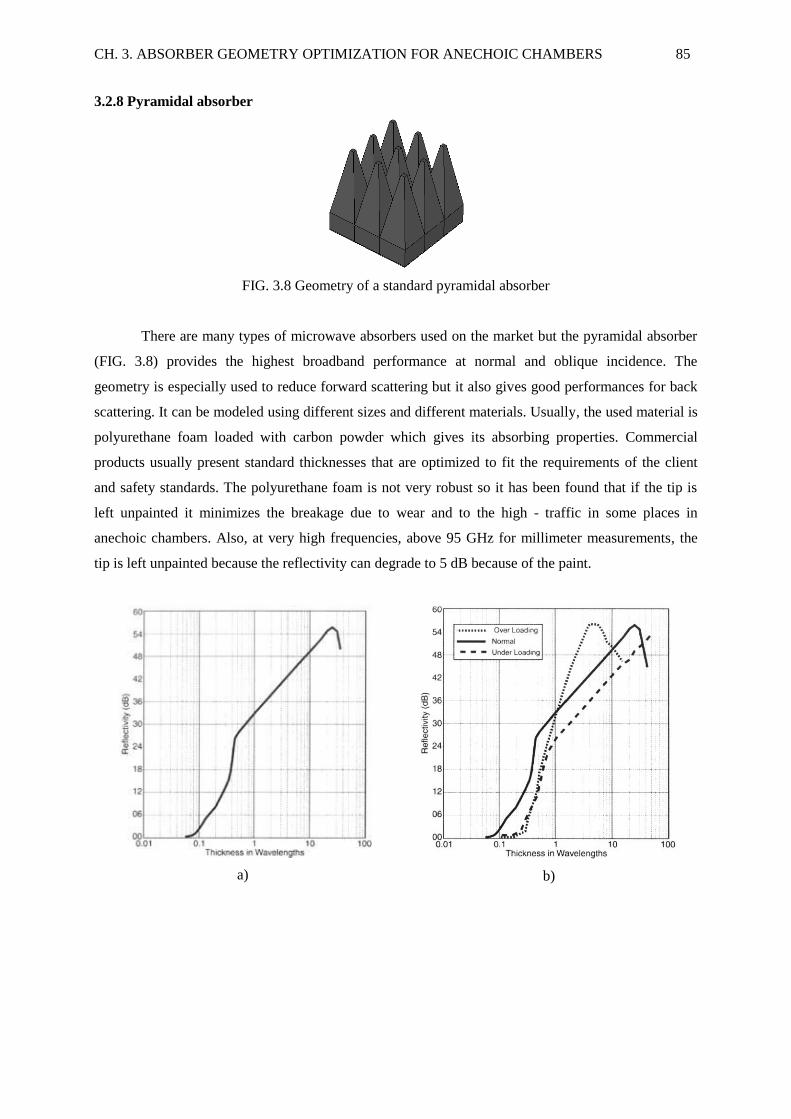
CH. 3. ABSORBER GEOMETRY OPTIMIZATION FOR ANECHOIC CHAMBERS 85
3.2.8 Pyramidal absorber
FIG. 3.8 Geometry of a standard pyramidal absorber
There are many types of microwave absorbers used on the market but the pyramidal absorber
(FIG. 3.8) provides the highest broadband performance at normal and oblique incidence. The
geometry is especially used to reduce forward scattering but it also gives good performances for back
scattering. It can be modeled using different sizes and different materials. Usually, the used material is
polyurethane foam loaded with carbon powder which gives its absorbing properties. Commercial
products usually present standard thicknesses that are optimized to fit the requirements of the client
and safety standards. The polyurethane foam is not very robust so it has been found that if the tip is
left unpainted it minimizes the breakage due to wear and to the high - traffic in some places in
anechoic chambers. Also, at very high frequencies, above 95 GHz for millimeter measurements, the
tip is left unpainted because the reflectivity can degrade to 5 dB because of the paint.
a)
b)

86 CH. 3. ABSORBER GEOMETRY OPTIMIZATION FOR ANECHOIC CHAMBERS
c)
FIG. 3.9 a) Normal incidence reflectivity performance of pyramidal absorbers, b) Effect of the carbon
loading on the performance of the pyramidal absorber [100] and c) Wide-angle performance of
pyramidal absorbers [100]
The curves presented in FIG. 3.9 have been validated for many pyramidal absorbers. We can
see that for a specific carbon loading and for a pyramidal absorber having the same thickness as the
wavelength the reflectivity is about -33 dB. If the absorber has a thickness below the wavelength then
the performance rapidly decreases. Also, if the material is too thick and large then, the reflectivity
performance decreases.
In FIG. 3.9b we can note that overloading the material with carbon decreases the reflectivity
for small thickness and increases for very thick materials above wavelength whereas, under loading
the material results in increasing the thickness in order to achieve the same performances as before
[100].
FIG. 3.9c presents the bistatic absorber performance depending on the angle of incidence and
the absorber thickness in wavelengths. Depending on the angle of incidence, the absorber performance
drops. The graph represented is used for determining the level of reflected energy that will be found in
the quiet zone of the anechoic chamber due to all the reflections from the walls, ceiling and floor
[100].
60
50
40
30
20
10
0
0 1 10 100
Absorber thickness in wavelengths
Bistatic
performance
in -dB versus
Angle of
incidence
A50i
A55i
A60i
A65i
A70i
A0i

CH. 3. ABSORBER GEOMETRY OPTIMIZATION FOR ANECHOIC CHAMBERS 87
The longest typical absorber size currently available is 72" (1.82 m). At 100 MHz, the
thickness of this absorber is 1.64λ with a normal incidence performance of about -33 dB [104].
Another aspect that is very important is the angle at which the reflected wave travels with
respect to the plane of the pyramidal absorber.
FIG. 3.10 Possible reflection paths from regular pyramids
The reflectivity of a pyramidal absorber can be expressed in terms of reflectance’s reflected
along a series of paths. Each reflection path (FIG. 3.10) can be defined by the series of angles where
the light ray is incident as it is reflected by one or more facets of the surface texture [100].
The very low reflections from pyramidal absorbers result from the fact that incident
microwaves reflect several times from the cones before finally being reflected back into free space.
Since a fraction of the incident wave is absorbed at each bounce, the microwaves are very
much diminished by the time they reflect back from an array of absorbers.
At low enough frequencies, the waves become much longer than the spacing between adjacent
absorbers. Their skin depths likewise become comparable to the size of the pyramids. This makes
pyramid absorbers of limited usefulness for anechoic chambers to be used at lower frequencies.
3.2.9 Truncated pyramidal absorber
FIG. 3.11 Geometry of a standard truncated pyramidal absorber
A truncated pyramidal absorber (FIG. 3.11) is a pyramidal geometry where the tip is cut. This
way we obtain a smaller and more compact anechoic chamber and also we eliminate the possibly of tip
breakage. These types of geometries are usually used in anechoic chambers for emission and
immunity testing. Usually, the frequency range is between 80 MHz and 40 GHz according to the
standards DO160 and MIL STD 461 [97].

88 CH. 3. ABSORBER GEOMETRY OPTIMIZATION FOR ANECHOIC CHAMBERS
3.2.10 Wedge microwave absorber
FIG. 3.12 Geometry of a standard wedge microwave absorber
Another type of geometry is the wedge absorber (FIG. 3.12). This type of absorber has the
same shape as the pyramidal geometry in one direction and a continuous wedge on the other. Because
the shape is not symmetrical a specific arrangement of the wedges has to be found so that we can
achieve the same performance for both vertical and horizontal polarization at normal incidence. The
wedge microwave absorber is used mostly for RCS measurements where it is preferable for the wave
to be guided [100]. This absorber has the same performance as the standard pyramidal geometry when
the electric field is perpendicular with the wedges and lower by 10 dB when the electric field is
parallel with the wedges. In FIG. 3.13 are presented the different arrangements for the wedges. It has
been proven that arrangement A can guide better the wave and that arrangement D has the same
absorption for both polarizations (H and V).
A
B
C
D
FIG. 3.13 Different arrangements for the wedge absorber
3.2.11 Oblique wedge microwave absorber
FIG. 3.14 Geometry of a standard oblique wedge microwave absorber

CH. 3. ABSORBER GEOMETRY OPTIMIZATION FOR ANECHOIC CHAMBERS 89
The oblique wedge absorber (FIG. 3.14) can be used to improve the performance of the
standard wedge absorber at high frequencies. If the wedge is cut then, we can arrive to obtain a
standard pyramidal geometry. Because the wedge geometry does not give a very good absorption
when the electric field is parallel with the wedge then, we can cut a small part of it and improve the
performance and also keep the properties where for RCS measurements, the wave has to be guided
[100].
3.2.12 Wedge arrays
FIG. 3.15 Geometry of a standard wedge arrays absorber
In order to obtain a smaller reflection coefficient we can use wedge arrays (FIG. 3.15). This
geometry has multiple tip points and narrower apex angles. The multiple apex angles are equal and can
give us multiple reflections in comparison with the standard wedge absorber. Wedge arrays can
provide a good absorption at normal and close to normal incidence in anechoic chambers. In the paper
[105], using a dielectric material with the permittivity of eps=1.46+0.35i at 1 GHz it was shown that a
double wedge absorber has a better performance at normal incidence and at oblique incidence (30o) in
the frequency range 0.5 - 3 GHz than the normal wedge absorber. Triple and quadruple wedge
absorbers are also described in [105] and they present a better absorption at normal and oblique
incidence (30o) comparing with the normal wedge geometry. This geometry can represent a novel
microwave absorber used in anechoic chambers.
3.3 Comparison in between the different shapes using commercial materials
In order to have a better understanding of the way the geometries work we have done some
simulations using two different commercial materials from Siepel [74] and two sizes (heights) for the
geometries.
For the first study, we have used a height of 9cm (here referred as X1) with a skin depth
varying from 2 to 1.5 cm for the frequency range 2 - 18 GHz.

90 CH. 3. ABSORBER GEOMETRY OPTIMIZATION FOR ANECHOIC CHAMBERS
FIG. 3.16 Comparison between the different reflection coefficients at normal incidence for the
different geometries X1
Geometry for X1 Normal incidence - Average reflectivity (dB)
Pyramidal absorber -46
Truncated pyramidal absorber -29
Twisted pyramidal absorber -45
Double pyramidal absorber -41
Cylinder pyramidal absorber -46
Triangular pyramidal absorber -46
Hexagonal pyramidal absorber -46
Wedge microwave absorber -30
Oblique wedge microwave absorber -41
Wedge arrays -24
TABLE 3.1 Comparison in between different geometries used in anechoic chambers for the size X1
For the size X1 the best geometry seems to be the cylindrical pyramid. Close after, we have
the pyramidal geometry. Because the cylindrical shape is usually difficult to realize using
polyurethane foam then the pyramidal geometry seems the best option having very good results in the
entire frequency range.
Now we consider the APM12 (12 cm of height) with a higher skin depth going from 3.5 to 2.5
cm between 2 and 18 GHz respectively.
0.5 2 4 6 8 10 12 14 16 18-120
-100
-80
-60
-40
-20
0
Frequency (GHz)
S11 (
dB
)X1
Pyramid
Truncated pyramid
Twisted pyramid
Double pyramid
Cylinder pyramid
0.5 2 4 6 8 10 12 14 16 18-120
-100
-80
-60
-40
-20
0
Frequency (GHz)
S11 (
dB
)
X1
Pyramid
Triangular pyramid
Hexagonal pyramid
Wedge
Oblique wedge
Wedge arrays

CH. 3. ABSORBER GEOMETRY OPTIMIZATION FOR ANECHOIC CHAMBERS 91
FIG. 3.17 Comparison between the different reflection coefficients at normal incidence for the
different geometries APM12
Geometry for APM 12 Normal incidence - Average reflectivity (dB)
Pyramidal absorber -38
Truncated pyramidal absorber -33
Twisted pyramidal absorber -47
Double pyramidal absorber -43
Cylinder pyramidal absorber -45
Triangular pyramidal absorber -38
Hexagonal pyramidal absorber -39
Wedge microwave absorber -34
Oblique wedge microwave absorber -41
Wedge arrays -28
TABLE 3.2 Comparison in between different geometries used in anechoic chambers for the size
APM12
From the comparison in between the different geometries we can conclude that there are some
shapes that give a better performance than the original pyramidal shape but only at frequencies higher
than 1 GHz. Here the twisted pyramidal shape has the lowest average reflection coefficient after 2
GHz. In order to obtain a low reflectivity in a broadband in between 0.5 and 18 GHz, the pyramidal
shape seems to be the best choice.
To achieve small reflectivity over a large bandwidth absorbers should not only work at
frequencies where they are electrically thick but at the frequencies where they are electrically thin.
When an incident wave encounters an electrically thin absorber, it does not "see" the fine structure of
the pyramids by example. Instead, the incident wave behaves as though it encountered a solid medium
whose effective permittivity and conductivity varies with the distance into the medium.
An optimized electrically thin absorber provides a transition from the wave impedance of free
space to the wave impedance of the base of the absorber. With the correct carbon loading the incident
0.5 2 4 6 8 10 12 14 16 18-120
-100
-80
-60
-40
-20
0
Frequency (GHz)
S11 (
dB
)APM 12
Pyramid
Truncated pyramid
Twisted pyramid
Double pyramid
Cylinder pyramid
0.5 2 4 6 8 10 12 14 16 18-120
-100
-80
-60
-40
-20
0
Frequency (GHz)
S11 (
dB
)
APM 12
Pyramid
Triangular pyramid
Hexagonal pyramid
Wedge
Oblique wedge
Wedge arrays

92 CH. 3. ABSORBER GEOMETRY OPTIMIZATION FOR ANECHOIC CHAMBERS
wave penetrates the pyramids or other geometries and is absorbed as it travels through their solid base.
Hence the optimum carbon loading used for wideband absorbers is extremely challenging.
In the next section, we have focused on optimizing the wedge, the pyramidal and the
hexagonal geometries in order to improve the absorbing properties and reducing their volume.
3.4 Optimization of the wedge absorber geometry
3.4.1 Introduction and state of art
Various researches have been done before using optimization algorithms to improve the
performance of the shapes used in anechoic chambers.
A first example is described in [78] and FIG. 3.18 where using a genetic algorithm in CST
Microwave Studio an initial pyramidal structure made of a lossy dielectric material with permittivity
of eps=1.46+j0.35 was optimized. The optimization has been done by dividing the conventional
pyramidal structure in four layers with the same thickness and electrical parameters. Using the genetic
algorithm, the widths between layers have been optimized.
a)
b)
FIG. 3.18 a) Initial pyramidal structure and b) Optimized structure
The optimized structure has a lower reflection coefficient than the original one by 5 dB in the
frequency range 1 - 3 GHz at normal incidence (FIG. 3.19).

CH. 3. ABSORBER GEOMETRY OPTIMIZATION FOR ANECHOIC CHAMBERS 93
FIG. 3.19 Reflection coefficient of the optimized pyramidal structure [78]
A second example is exposed in [106] and FIG. 3.20 where a "fast" optimization approach was
used to optimize the shape of absorbers in a specific frequency range between 0.1 and 2 GHz.
a)
b)
FIG. 3.20 a) Arbitrary curved pyramidal geometry built from 10 truncated linear pyramids and b)
Comparison in between a traditional pyramidal absorber (red curve) and the optimized geometry in the
frequency range 1 - 2 GHz [106]
Using a one-dimensional (1D) homogenized equivalent structure the optimization algorithm is
applied. After the optimization a refractive index profile is obtained and then used to create a 3D
curved pyramidal structure. The 3D structure is then validated by using full-wave 3D numerical
simulations. In FIG. 3.20b we can see that the optimized pyramidal absorber has the same
performance as the original pyramidal absorber till 1 GHz. For higher frequencies the optimized shape
shows a significant improvement. The material used has a refractive index of n=1.4.
The aspects discussed in the paper are about the optimization of the shape but also about the
optimization of the properties of the material used. Still, the optimal shapes obtained depend on the
properties of the material meaning that certain geometries cannot be used as an etalon for different
materials.

94 CH. 3. ABSORBER GEOMETRY OPTIMIZATION FOR ANECHOIC CHAMBERS
3.4.2 Absorber optimization
In this part of Chapter 3, three absorbing structures are taken into consideration for the
optimization: pyramid, wedge and hexagon. The software used was CST Microwave Studio and we
have simulated using the Frequency domain and Floquet theory. Because the optimized geometry has
to work also at oblique incidence we could not use the Time domain simulator because it does not
work for oblique incidence.
Optimization algorithms have been developed for solving combinatorial and numerical
optimization problems [107, 108]. Genetic Algorithm attempts to simulate evolution. In an ever-
changing environment each species searches for adaptation, for evolution (FIG. 3.21). Genetic
Algorithm is based on optimizing a solution over several iterations only by selecting the fittest (the
best) solutions and allowing them to form the next generation.
FIG. 3.21 Natural evolution
3.4.2.1 Optimized wedge geometry concept 1
We have proposed an optimized wedge structure that can improve the absorption at high
frequencies and also still conduct the wave. This structure is different from the wedge geometry
because it does not have the same shape as the pyramidal geometry in one direction and a continuous
wedge on the other. The process to obtain the structure is: we take a commercial wedge absorber and
then we cut at a specific angle (here X) from the top of the wedge so that we can still maintain a small
wedge portion of 1 cm just like can be seen in FIG. 3.22.
a)
b)
c)
FIG. 3.22 Realization process of the wedge: a) Original commercial wedge, b) Angle cut of the wedge
and c) Polarization
x
y
A
B
D
1 cm
A
B
D
X=300
X=150
X=600

CH. 3. ABSORBER GEOMETRY OPTIMIZATION FOR ANECHOIC CHAMBERS 95
In this part we have considered as a reference several shape dimensions and material loadings
of commercial materials provided by Siepel. The size of the wedge absorbers is referred as ADMy (y:
means the size specified in TABLE. 3.3). We consider two types of loading, G1 and G2, where we
present in FIG. 3.23 their skin depth as well as the corresponding attenuation.
Type A (mm) B (mm) C(mm) D (mm) Mass (kg) Material
used
ADM3 18 10 28 18.5 0.4 G2
ADM5 38 18 55 18.5 1 G2
ADM9 76 13 89 38 1.2 G2
ADM12 90 25 115 38 1.6 G1
TABLE. 3.3 Sizes of the commercial wedges
a)
b)
FIG. 3.23 Characteristics of the commercial materials a) G1 and b) G2 from Siepel
2 4 6 8 10 12 14 16 181
2
3
4
Frequency (GHz)
Skin
depth
(cm
)
G1
1 1.5 2 2.5 3 3.5 4-6
-5
-4
-3
-2
Skin depth (cm)
Att
enuation (
dB
/cm
)
G1
2 4 6 8 10 12 14 16 181
2
3
4
Frequency (GHz)
Skin
depth
(cm
)
G2
1 1.5 2 2.5 3 3.5 4-6
-5
-4
-3
-2
Skin depth (cm)
Att
enuation (
dB
/cm
)
G2
A
B
D PEC
C

96 CH. 3. ABSORBER GEOMETRY OPTIMIZATION FOR ANECHOIC CHAMBERS
In order to determine exactly what is the angle that we need to cut from the wedge we have
run various simulations for a chosen commercial wedge. In this work, ADM3 and ADM5 [109] were
used. The sizes for these shapes are: 18.5 x 18.5 x 28 mm3 (length x width x thickness) and 18.5 x 18.5
x 55 mm3 respectively and the thickness of the base is 10 mm for ADM3 and 18 mm for ADM15.
Using these geometries we have run simulations at normal incidence for the angles X of 30o, 60
o and
70o. The used material, for both wedge sizes is the commercial G2 material from Siepel presented in
FIG. 3.23. All the simulations have been done using the wedge arrangement presented in FIG. 3.22c
so that we can have a symmetrical structure and obtain the same result at normal incidence for both
polarizations.
a)
b)
FIG. 3.24 Comparison in between different cut angles for the commercial a) ADM3 and b) ADM5
In FIG. 3.24 we can see that the red curve which is the reflection coefficient of the wedge
ADM3/ADM5 cut at an angle X of 60o
is lower than the other curves especially at high frequencies
between 7 and 18 GHz. For ADM5 we have a better gain for an angle X of 70o in between 6 and 14
GHz but after 14 GHz the performance degrades quickly. This led us to conclude that the wedge
geometry can be optimized; we can have a lower reflection coefficient if we cut only from the top
surface of the geometry.
We have also run simulations for other bigger geometries using this angles X = 30o, 60
o, 70
o
and the results were always the same, for 60o we have gain after 4 GHz at normal and oblique
incidence. So, we have chosen angle X = 60o and used it for bigger commercial geometries.
In FIG. 3.25 we can see the simulation results obtained for the different geometries.
0.5 2 4 6 8 10 12 14 16 18-80
-60
-40
-20
0
Frequency (GHz)
S11 (
dB
)
Comparison angles
Normal incidence
Wedge ADM3
Wedge ADM3 X=300
Wedge ADM3 X=600
Wedge ADM3 X=700
0.5 2 4 6 8 10 12 14 16 18-80
-60
-40
-20
0
Frequency (GHz)
S11 (
dB
)
Comparison angles
Normal incidence
Wedge ADM5
Wedge ADM5 X=300
Wedge ADM5 X=600
Wedge ADM5 X=700
0.5 2 4 6 8 10 12 14 16 18-60
-40
-20
0
Frequency (GHz)
S11 (
dB
)
Wedge ADM5
Normal incidence
Wedge ADM5
Wedge ADM5 X=600

CH. 3. ABSORBER GEOMETRY OPTIMIZATION FOR ANECHOIC CHAMBERS 97
a)
b)
0.5 2 4 6 8 10 12 14 16 18-60
-40
-20
0
Frequency (GHz)
S11 (
dB
)Wedge ADM5
Oblique incidence(450)
Wedge ADM5 Polarization x
Wedge ADM5 X=600 Polarization x
0.5 2 4 6 8 10 12 14 16 18-60
-40
-20
0
Frequency (GHz)
S11 (
dB
)
Wedge ADM5
Oblique incidence(450)
Wedge ADM5 Polarization y
Wedge ADM5 X=600 Polarization y
0.5 2 4 6 8 10 12 14 16 18-60
-40
-20
0
Frequency (GHz)
S11 (
dB
)
Wedge ADM9
Normal incidence
Wedge ADM9
Wedge ADM9 X=600
0.5 2 4 6 8 10 12 14 16 18-60
-40
-20
0
Frequency (GHz)
S11 (
dB
)
Wedge ADM9
Oblique incidence(450)
Wedge ADM9 Polarization x
Wedge ADM9 X=600 Polarization x
0.5 2 4 6 8 10 12 14 16 18-60
-40
-20
0
Frequency (GHz)
S11 (
dB
)
Wedge ADM9
Oblique incidence(450)
Wedge ADM9 Polarization y
Wedge ADM9 X=600 Polarization y
0.5 2 4 6 8 10 12 14 16 18-80
-60
-40
-20
0
Frequency (GHz)
S11 (
dB
)
Wedge ADM12
Normal incidence
Wedge ADM12
Wedge ADM12 X=600

98 CH. 3. ABSORBER GEOMETRY OPTIMIZATION FOR ANECHOIC CHAMBERS
c)
FIG 3.25 Simulation results for the commercial wedges using a cut angle X of 60o at normal and
oblique incidence (45o) for a) ADM5, b) ADM9 and c) ADM12
Because at oblique incidence even if the geometry is symmetrical, we will not have the same
results for both polarizations, for the wedge geometry we have two curves for an angle of incidence of
450. In FIG. 3.25a we have the results using the wedge geometry ADM5. The thickness of this
geometry is 55 mm, meaning 1.09λ at 0.5 GHz. At normal and oblique incidence the gain is located in
between 10 and 18 GHz. For thicker wedge geometries like ADM9 and ADM12 that have respectively
89 mm (1.48λ) and 115 mm (1.91λ), we obtain a gain up to 20 dB for frequencies above 4 GHz at
normal incidence. At oblique incidence the gain of maximum 10 dB is obtained only for one
polarization (x direction). For y polarization we have the same results as the original wedge geometry
because the side of the geometry that is illuminated by the wave is the same as for the original wedge
geometry.
3.4.2.2 Optimized wedge geometry concept 2
In this part of the chapter we are explaining how the geometry of a straight wedge absorber
can be optimized using genetic algorithm. For the determination of a material performance the most
important parameter is the signal absorption.
a)
b)
FIG. 3.26 Straight wedge absorber in a) Side view and b) Top view
0.5 2 4 6 8 10 12 14 16 18-80
-60
-40
-20
0
Frequency (GHz)
S11 (
dB
)Wedge ADM12
Oblique incidence(450)
Wedge ADM12 Polarization x
Wedge ADM12 X=600 Polarization x
0.5 2 4 6 8 10 12 14 16 18-80
-60
-40
-20
0
Frequency (GHz)
S11 (
dB
)
Wedge ADM12
Oblique incidence(450)
Wedge ADM12 Polarization y
Wedge ADM12 X=600 Polarization y

CH. 3. ABSORBER GEOMETRY OPTIMIZATION FOR ANECHOIC CHAMBERS 99
In anechoic chambers, the design and the material used are the elements that enable us to
determine the absorption. The straight wedge design has shown reduced reflectivity at low
frequencies, this is why it is used in this study. An example of this type of geometry is shown in FIG.
3.26.
In the 1940s, the first dielectric absorber has been created. This type of absorber was lined
with matted "horse hair" that was loaded with a conductive carbon solution [100]. Since then
numerous types of absorbers have been developed. This study examines a shape that provides lower
reflectivity at normal and especially at oblique incidence. Because the straight wedge is not a
symmetrical shape, the two directions of the electric field have to be considered depending on the
orientation of the wedge. The optimization has been done for the 2 - 8 GHz frequency range.
3.4.2.2.1 Simulation results
We have done the optimization using the epoxy foam material loaded with 0.5% carbon fibers,
presented in Chapter 2. After the optimization various simulations at oblique incidence have been
conducted for both the original wedge and the optimized one. The results are presented below. Using
the obtained geometry we changed the used material with a commercial one and seen if the shape still
gives better results than an original wedge absorber.
Used material: epoxy foam loaded with 0.5% carbon fibers
The epoxy foam composite, presented in Chapter 2, is a new material that has never been used
before for microwave absorption applications. The measured characteristics, in anechoic chamber, as
well as the skin depth of this epoxy foam composite are presented in FIG. 3.27.
FIG. 3.27 Characteristic of the epoxy foam composite
It has been demonstrated that depending on the electric field, changing the orientation of the
wedge gives better results, at normal incidence. Using the wedge geometry that can be seen in FIG.
3.26 and rotating the direction of only one wedge the reflectivity varies, because, depending on how
the electric field falls on the wedge, it can interact a lot more with the material. At low frequencies,
there has to always be a lot more material in order to absorb the energy wave than at high frequencies.
For the wedge shape, when the electric field is parallel with the wedge then the reflection
2 4 6 8 10 12 14 16 180
2
4
6
Frequency (GHz)
Perm
ittivity (
real part
)
0.5%
Real part
Losses
2 4 6 8 10 12 14 16 180
5
10
15
Frequency (GHz)
Skin
depth
(cm
)
0.5%
Skin depth

100 CH. 3. ABSORBER GEOMETRY OPTIMIZATION FOR ANECHOIC CHAMBERS
increases and the transmission decreases but, when the electric field is perpendicular with the wedge
the transmission is higher and the reflection lower.
By using the wedge arrangement shown in FIG. 3.26 and not an arrangement where all the
wedges are aligned in the same way we can improve the reflectivity for horizontal polarization (H) by
1.32 dB in the entire frequency range (from 2 to 8 GHz) as seen in FIG. 3.28. This is why here there
has been used a design that does not keep the same orientation for the wedge, FIG. 3.26.
FIG. 3.28 Choosing the best arrangement for the wedges
For vertical polarization (V), FIG. 3.29, the electric field that is in the x-direction and falls on
the 3 same orientated wedges in a perpendicular way gives a better result than when the electric field
is parallel with the 3 same orientated wedges. This confirms the hypothesis from above.
FIG. 3.29 Influence of the polarization
After the creation of the design, the next step would be to optimize it. The used size for a
single wedge here is: 5x5x15 cm3 (length x width x height) while the thickness of the base is 2 cm.
The Genetic Algorithm always needs a solution, a result to the problem at hand commonly
called a genome or chromosome. After, it creates a population of solutions and then applies genetic
operators (mutation and crossover) to resolve the solutions and to find the best one. In this case, the
solution to the problem is the reflectivity. It has to be as low as possible. After defining the solution,
the setting of the parameters is done. Here, the wedge shape is being divided in 5 equal parts excluding
the base. The number of cuts can be increased but for minimizing the simulation time we have chosen
only 5 parts. For each part the radius of the top and bottom square is set as a parameter for the
2 3 4 5 6 7 8-50
-40
-30
-20
-10
Frequency (GHz)S
11 (
dB
)
Original wedge (H) Polarization - Wedges our direction
Original wedge (H) Polarization - Wedges same direction
2 3 4 5 6 7 8-50
-40
-30
-20
-10
Frequency (GHz)
S11 (
dB
)
Original wedge (H) Polarization
Original wedge (V) Polarization

CH. 3. ABSORBER GEOMETRY OPTIMIZATION FOR ANECHOIC CHAMBERS 101
optimization algorithm. These parameters will be used to calculate at each step the reflectivity until it
reaches the optimum value.
Using the optimization algorithm in CST Microwave Studio, explained before, for a straight
wedge shape, we obtained a new geometry, FIG. 3.30, which has an improved performance. In total
we had 6 parameters to optimize: the base thickness, the thickness of each of the 5 equal parts of the
wedge and the 4 radii. We have set as an anchor value for each parameter the original value obtained
from the wedge not optimized and set for the optimization the minimum and maximum as being 10%
of the anchor value. The goal set in CST Microwave Studio was the reflection coefficient in dB for
both polarizations to be as low as possible in the entire frequency band, here we have chosen S11 < -80
dB.
FIG. 3.30 Proposed optimized wedge geometry
The volume for the original shape is 1942 cm3 but for the optimized shape is 1490 cm
3. There
is 23.3% less material and we obtain the same performance or a better performance for the optimized
wedge.
FIG. 3.31 Simulation results at normal incidence for the epoxy foam
At normal incidence and for polarization V (FIG. 3.31), the reflection coefficient has
decreased by 1.45 dB, in the frequency range 2 - 8 GHz, for the optimized straight wedge. At normal
incidence and for polarization H, the reflection coefficient has decreased in the entire frequency range
by 3.31 dB.
The next step is to determine the performance at oblique incidence [24]. In this case only the
30o and 45
o angles have been studied. Using these 2 angles the wave has been rotated around the
2 3 4 5 6 7 8-75
-65
-55
-45
-35
-25
-15
-5
Frequency (GHz)
S11 (
dB
)
Optimized wedge (V) Polarization
Original wedge (V) Polarization
2 3 4 5 6 7 8-75
-65
-55
-45
-35
-25
-15
-5
Frequency (GHz)
S11 (
dB
)
Optimized wedge (H) Polarization
Original wedge (H) Polarization
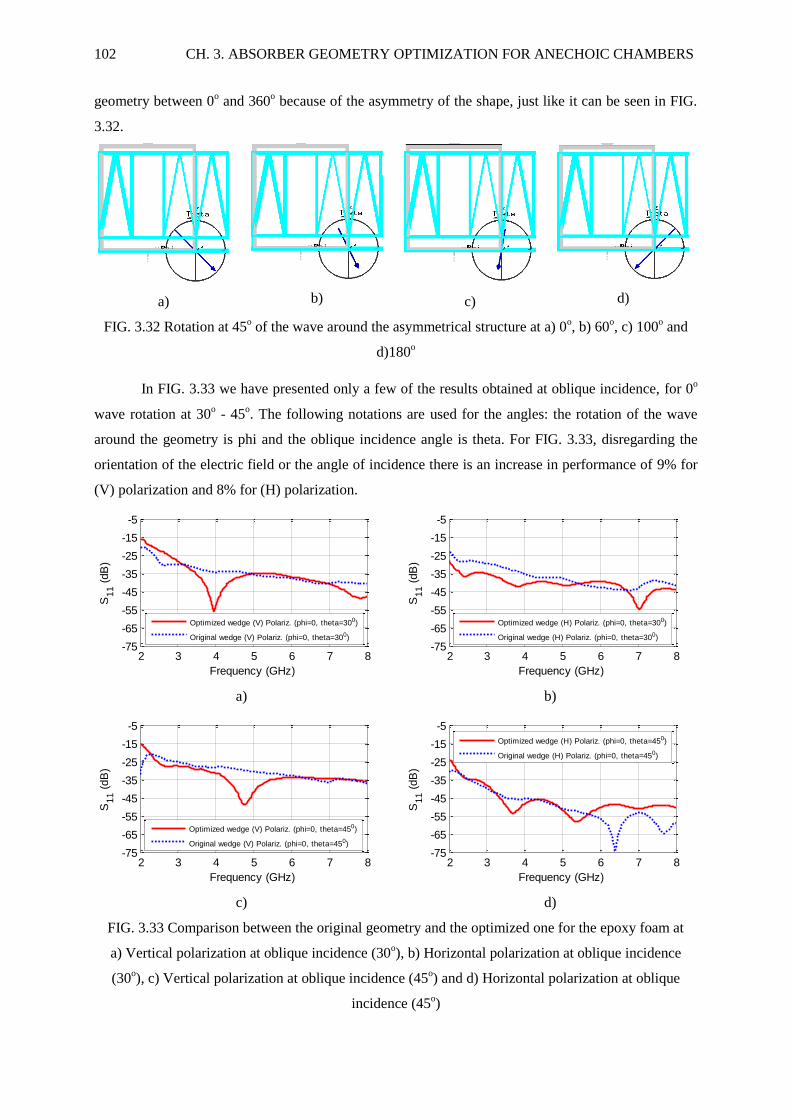
102 CH. 3. ABSORBER GEOMETRY OPTIMIZATION FOR ANECHOIC CHAMBERS
geometry between 0o and 360
o because of the asymmetry of the shape, just like it can be seen in FIG.
3.32.
a)
b)
c)
d)
FIG. 3.32 Rotation at 45o of the wave around the asymmetrical structure at a) 0
o, b) 60
o, c) 100
o and
d)180o
In FIG. 3.33 we have presented only a few of the results obtained at oblique incidence, for 0o
wave rotation at 30o - 45
o. The following notations are used for the angles: the rotation of the wave
around the geometry is phi and the oblique incidence angle is theta. For FIG. 3.33, disregarding the
orientation of the electric field or the angle of incidence there is an increase in performance of 9% for
(V) polarization and 8% for (H) polarization.
a)
b)
c)
d)
FIG. 3.33 Comparison between the original geometry and the optimized one for the epoxy foam at
a) Vertical polarization at oblique incidence (30o), b) Horizontal polarization at oblique incidence
(30o), c) Vertical polarization at oblique incidence (45
o) and d) Horizontal polarization at oblique
incidence (45o)
2 3 4 5 6 7 8-75
-65
-55
-45
-35
-25
-15
-5
Frequency (GHz)
S11 (
dB
)
Optimized wedge (V) Polariz. (phi=0, theta=300)
Original wedge (V) Polariz. (phi=0, theta=300)
2 3 4 5 6 7 8-75
-65
-55
-45
-35
-25
-15
-5
Frequency (GHz)
S11 (
dB
)
Optimized wedge (H) Polariz. (phi=0, theta=300)
Original wedge (H) Polariz. (phi=0, theta=300)
2 3 4 5 6 7 8-75
-65
-55
-45
-35
-25
-15
-5
Frequency (GHz)
S11 (
dB
)
Optimized wedge (V) Polariz. (phi=0, theta=450)
Original wedge (V) Polariz. (phi=0, theta=450)
2 3 4 5 6 7 8-75
-65
-55
-45
-35
-25
-15
-5
Frequency (GHz)
S11 (
dB
)
Optimized wedge (H) Polariz. (phi=0, theta=450)
Original wedge (H) Polariz. (phi=0, theta=450)

CH. 3. ABSORBER GEOMETRY OPTIMIZATION FOR ANECHOIC CHAMBERS 103
Now we are going to show all results obtained at 30o and 45
o oblique incidence when the wave
is rotated between 0o and 360
o around the geometry. At oblique incidence with theta=30
o, the
optimized wedge has a lower reflection coefficient after 4 GHz for (V) and (H) polarizations. The
same thing happens at oblique incidence with theta=45o, we have a darker blue color for (V)
polarization after 4 GHz but for (H) polarization we have no significant gain.
FIG. 3.34 Comparison between the original geometry and the optimized one at oblique incidence (30o)
for phi=0o - 360
o using the epoxy foam material
FIG. 3.35 Comparison between the original geometry and the optimized one at oblique incidence (45o)
for phi=0o - 360
o using the epoxy foam material
Frequency (GHz)
ph
i (d
eg
rees)
Reflection coefficient
original wedge (theta=300)Vertical polariz.
2 4 6 8
0
30
60
90
120
150
180
210
240
270
300
330
360 -60
-55
-50
-45
-40
-35
-30
-25
-20
Frequency (GHz)
ph
i (d
eg
rees)
Reflection coefficient
optimized wedge (theta=300)Vertical polariz.
2 4 6 8
0
30
60
90
120
150
180
210
240
270
300
330
360 -60
-55
-50
-45
-40
-35
-30
-25
-20
Frequency (GHz)
ph
i (d
eg
rees)
Reflection coefficient
original wedge (theta=300)Horizontal polariz.
2 4 6 8
0
30
60
90
120
150
180
210
240
270
300
330
360 -60
-55
-50
-45
-40
-35
-30
-25
-20
Frequency (GHz)
ph
i (d
eg
rees)
Reflection coefficient
optimized wedge (theta=300)Horizontal polariz.
2 4 6 8
0
30
60
90
120
150
180
210
240
270
300
330
360 -60
-55
-50
-45
-40
-35
-30
-25
-20
Frequency (GHz)
ph
i (d
eg
rees)
Reflection coefficient
original wedge (theta=450)Vertical polariz.
2 4 6 8
0
30
60
90
120
150
180
210
240
270
300
330
360 -60
-55
-50
-45
-40
-35
-30
-25
-20
Frequency (GHz)
ph
i (d
eg
rees)
Reflection coefficient
optimized wedge (theta=450)Vertical polariz.
2 4 6 8
0
30
60
90
120
150
180
210
240
270
300
330
360 -60
-55
-50
-45
-40
-35
-30
-25
-20
Frequency (GHz)
ph
i (d
eg
rees)
Reflection coefficient
original wedge (theta=450)Horizontal polariz.
2 4 6 8
0
30
60
90
120
150
180
210
240
270
300
330
360 -60
-55
-50
-45
-40
-35
-30
-25
-20
Frequency (GHz)
ph
i (d
eg
rees)
Reflection coefficient
optimized wedge (theta=450)Horizontal polariz.
2 4 6 8
0
30
60
90
120
150
180
210
240
270
300
330
360 -60
-55
-50
-45
-40
-35
-30
-25
-20

104 CH. 3. ABSORBER GEOMETRY OPTIMIZATION FOR ANECHOIC CHAMBERS
Used material: commercial material ECCOSORB LS 24
We have shown that the optimized geometry works for a new material in simulation but what
happens when a commercial material is used.
The material used before for the optimization has a low real part of the permittivity and a tan 1. If we increase the material's characteristics this optimized geometry can also give good results
with 23.3% less material. So we consider a commercial absorber ECCOSORB LS 24, with r > 3 and
tan > 1.3 (see FIG. 3.36).
FIG. 3.36 Characteristic of the commercial absorber ECCOSORB LS 24
At normal incidence the optimized geometry works only for one polarization, vertical while
for the horizontal polarization we have the same results as the original wedge shape, just like can be
seen in FIG. 3.37.
FIG. 3.37 Simulation results at normal incidence for the commercial material ECCOSORB LS 24
After seeing the results at normal incidence we have simulated the structures at oblique
incidence at 30o and 45
o and rotated the wave around the structure so that we can have a total response
over the efficiency of the optimized wedge. The rotation angle is phi=0o to 360
o. We can see from FIG.
3.38 and FIG. 3.39 that the optimized structure has a lot more blue but only at high frequencies after
3.5 GHz.
1 2 3 4 5 60
1
2
3
4
5
6
7
8
Frequency (GHz)
Eps'
1 2 3 4 5 60.4
0.6
0.8
1
1.2
1.4
1.6
1.8
2
Tg d
elta
1 2 3 4 5 6-55
-45
-35
-25
-10
Frequency (GHz)
Normal incidence (00)
S11 (
dB
)
Optimized w edge (H) Polariz. - ECCO. LS24
Original w edge (H) Polariz. - ECCO. LS24
1 2 3 4 5 6-65
-55
-45
-35
-25
-15
Frequency (GHz)
Normal incidence (00)
S11 (
dB
)
Optimized w edge (V) Polariz. - ECCO. LS24
Original w edge (V) Polariz. - ECCO. LS24
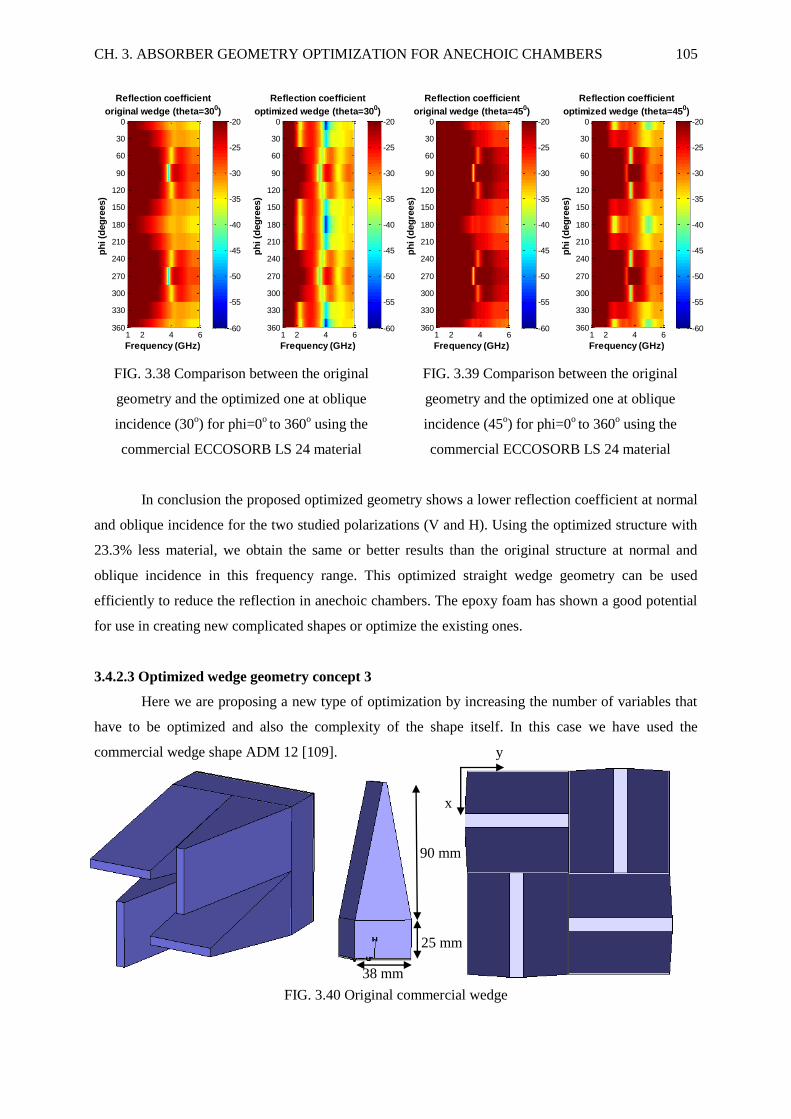
CH. 3. ABSORBER GEOMETRY OPTIMIZATION FOR ANECHOIC CHAMBERS 105
FIG. 3.38 Comparison between the original
geometry and the optimized one at oblique
incidence (30o) for phi=0
o to 360
o using the
commercial ECCOSORB LS 24 material
FIG. 3.39 Comparison between the original
geometry and the optimized one at oblique
incidence (45o) for phi=0
o to 360
o using the
commercial ECCOSORB LS 24 material
In conclusion the proposed optimized geometry shows a lower reflection coefficient at normal
and oblique incidence for the two studied polarizations (V and H). Using the optimized structure with
23.3% less material, we obtain the same or better results than the original structure at normal and
oblique incidence in this frequency range. This optimized straight wedge geometry can be used
efficiently to reduce the reflection in anechoic chambers. The epoxy foam has shown a good potential
for use in creating new complicated shapes or optimize the existing ones.
3.4.2.3 Optimized wedge geometry concept 3
Here we are proposing a new type of optimization by increasing the number of variables that
have to be optimized and also the complexity of the shape itself. In this case we have used the
commercial wedge shape ADM 12 [109].
FIG. 3.40 Original commercial wedge
Frequency (GHz)
ph
i (d
eg
rees)
Reflection coefficient
original wedge (theta=300)
1 2 4 6
0
30
60
90
120
150
180
210
240
270
300
330
360 -60
-55
-50
-45
-40
-35
-30
-25
-20
Frequency (GHz)
ph
i (d
eg
rees)
Reflection coefficient
optimized wedge (theta=300)
1 2 4 6
0
30
60
90
120
150
180
210
240
270
300
330
360 -60
-55
-50
-45
-40
-35
-30
-25
-20
Frequency (GHz)
ph
i (d
eg
rees)
Reflection coefficient
original wedge (theta=450)
1 2 4 6
0
30
60
90
120
150
180
210
240
270
300
330
360 -60
-55
-50
-45
-40
-35
-30
-25
-20
Frequency (GHz)
ph
i (d
eg
rees)
Reflection coefficient
optimized wedge (theta=450)
1 2 4 6
0
30
60
90
120
150
180
210
240
270
300
330
360 -60
-55
-50
-45
-40
-35
-30
-25
-20
38 mm
25 mm
90 mm
x
y

106 CH. 3. ABSORBER GEOMETRY OPTIMIZATION FOR ANECHOIC CHAMBERS
We have chosen the orientation of the wedges described in FIG. 3.40 because it will give the
same results for both polarizations at normal incidence.
Using the Genetic Algorithm in CST Microwave Studio we have optimized the wedge as
follows: we have divided horizontally one wedge in 4 equal parts. After this division we have divided
again the wedge in 2 parts but this time vertically. The optimization has been done on all the
parameters for the new parts obtained. The result can be seen in FIG. 3.41. The different dimensions
are summarized in TABLE. 3.4.
Name Size (mm) Name Size (mm) Name Size (mm) Name Size (mm)
L1 38 L9 22.1 L17 5.48 L25 11.672
L2 19 L10 21.586 L18 21.536 L26 5.78
L3 24.86 L11 21.934 L19 22.423 L27 2.5
L4 20.71 L12 22.47 L20 20.817 L28 27.418
L5 18 L13 22.309 L21 20 L29 22.021
L6 18.056 L14 20.17 L22 22.47 L30 13.256
L7 17.587 L15 21.88 L23 25.453 L31 6.52
L8 10.871 L16 18.237 L24 19.377
TABLE. 3.4 Dimensions of the optimized wedge
FIG. 3.41 Size of the optimized wedge
L1
L3
L13
L14
L15
L16
L17
L21
L20
L19
L18
L2 L2
L3
L1
L4
L5
L6
L7
L8
L12
L11
L10
L9
L2 L2
L27
L1
L21 L28
L29
L30
L31
L27
L25
L23
L1
L22
L26
L24

CH. 3. ABSORBER GEOMETRY OPTIMIZATION FOR ANECHOIC CHAMBERS 107
FIG. 3.42 shows that the optimized geometry has a gain higher than 5.8 dB from 3 GHz to 18
GHz at normal and oblique incidence. The optimized geometry is smaller than the original geometry
and in this case we have 10% less material for the optimized wedge.
a)
b)
c)
FIG. 3.42 Simulation results for the optimized wedge in comparison with the original wedge at a)
Normal incidence, b) Oblique incidence (300) and c) Oblique incidence (45
0)
0.5 2 4 6 8 10 12 14 16 18-80
-60
-40
-20
0
Frequency (GHz)
S11 (
dB
)
Optimization commercial wedge
Normal incidence
Original wedge absorber
Optimized wedge
0.5 2 4 6 8 10 12 14 16 18-80
-60
-40
-20
0
Frequency (GHz)
S11 (
dB
)
Optimization commercial wedge
Oblique incidence(300)
Original Wedge Polarization x
Optimized Wedge Polarization x
0.5 2 4 6 8 10 12 14 16 18-80
-60
-40
-20
0
Frequency (GHz)
S11 (
dB
)Optimization commercial wedge
Oblique incidence(300)
Original Wedge Polarization y
Optimized Wedge Polarization y
0.5 2 4 6 8 10 12 14 16 18-80
-60
-40
-20
0
Frequency (GHz)
S11 (
dB
)
Optimization commercial wedge
Oblique incidence(450)
Original Wedge Polarization x
Optimized Wedge Polarization x
0.5 2 4 6 8 10 12 14 16 18-80
-60
-40
-20
0
Frequency (GHz)
S11 (
dB
)
Optimization commercial wedge
Oblique incidence(450)
Original Wedge Polarization y
Optimized Wedge Polarization y

108 CH. 3. ABSORBER GEOMETRY OPTIMIZATION FOR ANECHOIC CHAMBERS
3.5 Optimization of pyramidal geometry using genetic algorithm
For this study we have used the commercial material provided by Siepel (G2) presented above
(FIG. 3.23b). We have chosen a pyramidal geometry with the dimensions of 2.5 x 2.5 x 10 cm3 (length
x width x height). The base of the pyramidal structure has a thickness of 3 cm and the tip of the
pyramid has a length of 5 mm. The dimensions chosen are not commercial but used only for this
optimization.
FIG. 3.43 Chosen pyramidal geometry
Using this geometry we have divided the base horizontally in 3 parts and the pyramid in 4
parts. After this division we have divided again the base and the pyramid in 4 parts but this time
vertically. Using the Genetic Algorithm in CST Microwave Studio we have optimized each part of the
geometry and obtained the shape presented in FIG. 3.44. The different dimensions are summarized in
TABLE. 3.5.
Name Size (mm) Name Size (mm) Name Size (mm) Name Size (mm)
P1 25 P10 8.55 P19 6.05 P28 9.72
P2 8.94 P11 9.33 P20 4.25 P29 4.57
P3 8.086 P12 8.4 P21 5.35 P30 5.91
P4 9.8 P13 11.17 P22 8.84 P31 11.01
P5 15.5 P14 9.92 P23 8.51 P32 17.43
P6 15.51 P15 11.17 P24 3.6 P33 8.32
P7 2.5 P16 9.92 P25 16.33 P34 9.33
P8 6.56 P17 7.2 P26 9.41 P35 8.71
P9 14.01 P18 8.96 P27 8
TABLE. 3.5 Dimensions of the optimized pyramid
25 mm 25 mm
30 mm
70 mm

CH. 3. ABSORBER GEOMETRY OPTIMIZATION FOR ANECHOIC CHAMBERS 109
FIG. 3.44 Size of the optimized pyramidal geometry
x
y
P12
P1
P2
P3
P4
P5
P6
P6
P6 P7
P11
P10
P9
P9
P8
P9
P9
P15
P17 P18
P16
P19
P20
P28
P26
P25
P25
P25
P25
P24
P27
P1
P35
P33
P32
P32
P32
P32
P34
P31
P30
P29 P21
P22
P23
P2
P3
P4
P5
P6
P6
P6
P1
P35
P34
P33
P32
P32
P32
P32
P31
P30
P29 P19
P17
P15
P12
P10
P1
P9
P9
P9
P9
P8
P24
P25
P25
P25
P25
P26
P27
P28
P22
P23 P16
P18
P20
P21
P11

110 CH. 3. ABSORBER GEOMETRY OPTIMIZATION FOR ANECHOIC CHAMBERS
We have run simulations at normal and oblique incidence using this optimized pyramid with
the G2 commercial material. The results are presented in FIG. 3.45.
a)
b)
c)
FIG. 3.45 Simulation results for the optimized pyramid (red and black curves) in comparison with the
original pyramid (blue curve) at a) Normal incidence, b) Oblique incidence of 30o and c) Oblique
incidence of 450
From the simulation results we can see that the optimized pyramid has a gain of maximum 20
dB only at high frequencies after 6 GHz (and after 8 GHz for oblique incidence of 45o). These
phenomena can be explained by looking at the optimized pyramid. This geometry has a smaller
amount of material and also a smaller tip. We know that the pyramid geometry gives the best
absorption performance because of the actual shape. At low frequencies we need more material so that
the wave can be absorbed entirely and at high frequencies we need a small amount of material so that
we can avoid any high reflections. So, knowing this we can conclude that the base of the optimized
pyramid works for low frequencies and the top of the pyramid works for high frequencies. The
geometry is not symmetrical so we will have slightly different results depending on polarization.
It must be noted here that because the optimization has been done using a specific material the
pyramidal structure may not work for other materials.
0.5 2 4 6 8 10 12 14 16 18-80
-60
-40
-20
0
Frequency (GHz)
S11 (
dB
)
Optimization pyramidal shape
Normal incidence
Original py ramid
Optimized py ramid polarization x
Optimized py ramid polarization y
0.5 2 4 6 8 10 12 14 16 18-80
-60
-40
-20
0
Frequency (GHz)
S11 (
dB
)
Optimization pyramidal shape
Oblique incidence (300)
Original py ramid
Optimized py ramid polarization x
Optimized py ramid polarization y
0.5 2 4 6 8 10 12 14 16 18-80
-60
-40
-20
0
Frequency (GHz)
S11 (
dB
)
Optimization pyramidal shape
Oblique incidence (450)
Original py ramid
Optimized py ramid polarization x
Optimized py ramid polarization y

CH. 3. ABSORBER GEOMETRY OPTIMIZATION FOR ANECHOIC CHAMBERS 111
3.6 Optimization of hexagonal geometry
Comparing the different geometries presented so far we have observed that by using more
material for a structure we can improve the absorption at low frequencies but have a decline at high
frequencies. Our objective is to improve the performance at low frequencies but still maintain the
same level at high frequencies. Because the hexagonal pyramidal geometry works in a large frequency
band, uses a little bit more material that the original pyramidal geometry and has almost the same
performance as the pyramidal geometry we have chosen it for the next optimization. The hexagonal
top of the structure has 6 faces. We have chosen this faces and added more material by using the
Extrusion option in CST Microwave Studio. The Taper angle necessary is always -20 degrees. This
way we can add more material to the original shape and still conserve the geometry as hexagonal. The
proposed geometry is shown in FIG. 3.46 and TABLE. 3.6 regroups the different dimensions.
Depending on the size needed the new shape can be scaled so that we can obtain thicker
samples.
a)
b)
c)
FIG. 3.46 a) The optimized geometry for APM12, b) Perspective view of the new shape, c) Plan view
of the new shape
Name Size (mm) Name Size (mm) Name Size (mm)
N1 38 N5 9.11 N9 43.1
N2 25 N6 60.74 N10 12.67
N3 5 N7 34.46 N11 45.94
N4 115 N8 40.6
TABLE. 3.6 Dimensions of the new shape
In order to understand better how the optimized geometry (FIG. 3.46) works we have plotted
the E-field of a pyramidal geometry in comparison with the new geometry at different frequencies and
also for different parts of the structures (FIG. 3.47). The used material is the G1 commercial material
N1
N2
N4
N8
N9
N10
N7
N1
N2
N4
N8
N6
N5
Tip diameter: N3
N7
N11

112 CH. 3. ABSORBER GEOMETRY OPTIMIZATION FOR ANECHOIC CHAMBERS
from Siepel presented above in this chapter (FIG. 3.23a). All results were obtained using CST
Microwave Studio.
The frequencies chosen are 2 GHz, 6 GHz, 10 GHz, 14 GHz and 18 GHz. For these
frequencies, we have studied the electric field at different levels of the two structures and seen where
we have the most intense field. For the pyramidal geometry we have a more intense electric field in
between the pyramidal shapes meaning a higher reflection especially at lower frequencies in between
2 GHz and 10 GHz and for the bottom layers of the structure (levels 1-3). The base of both structures
works best at low frequencies because we have more material meaning a better absorption of the wave.
At high frequencies, for levels 4 and 5 we can see that both structures have almost the same electric
level meaning the same reflection loss. Because of the multiple wedges and faces of the optimized
shape the wave is reflected multiple times and absorbed a lot better inside the geometry comparing
with the pyramidal shape.
f=2 GHz
Pyramid
1 2 3 4 5
Optimized shape
1
2
3
4
5
1
2
3
4
5

CH. 3. ABSORBER GEOMETRY OPTIMIZATION FOR ANECHOIC CHAMBERS 113
f=6 GHz
Pyramid
Optimized shape
f=10 GHz
Pyramid
Optimized shape
f=14 GHz
Pyramid
Optimized shape

114 CH. 3. ABSORBER GEOMETRY OPTIMIZATION FOR ANECHOIC CHAMBERS
f=18 GHz
Pyramid
Optimized shape
FIG. 3.47 E-field comparison between pyramid and optimized shape at specific frequencies and
different parts of the structures
We have run simulations using the polyurethane foams G1 and G2 provided by Siepel for
different shape dimensions (TABLE 3.7). We have compared the pyramidal geometry with the new
geometry at normal and oblique incidence (FIG. 3.48). Only for APM9 we have used the material
characteristic G2 because it is the same one that Siepel uses. For all the other dimensions APM12 -
APM20 we have used G1. The G2 polyurethane foam has a higher carbon loading and works better for
smaller dimensions because of the impedance matching in between air and the foam. We have to take
into account the fact that the new geometry is not symmetrical so we will have slightly different
results for vertical and horizontal polarization.
Type A (mm) B (mm) C(mm) D (mm) Mass (kg)
APM9 76 13 89 38 0.8
APM12 90 25 115 38 1.2
APM20 147 63 210 68 2.0
TABLE 3.7 Pyramid dimensions
A
B
D PEC
C

CH. 3. ABSORBER GEOMETRY OPTIMIZATION FOR ANECHOIC CHAMBERS 115
In FIG. 3.48a we have the results for the APM9 (8.9 cm height) size. We have compared the
new geometry (red and blue curves) at normal and oblique incidence (30o, 45
o) with the pyramidal
geometry (black curve) using the same size for both geometries. At normal incidence we have a gain
of 5 to 10 dB in the frequency range of 4 - 18 GHz for the new shape. Below 2 GHz the new geometry
doesn't give better results comparing with the pyramid. At oblique incidence and for 30o, we have a
gain of 3 to 10 dB depending on frequency after 6 GHz. At 45o, the gain is located after 7 GHz.
In FIG. 3.48b and FIG. 3.48c we have increased the thickness of the geometry and also
changed the used material. Because APM12 is a commercial size by Siepel and the material used by
them is G1 we have utilized the same one for the simulations with the new geometry. At normal
incidence the gain of 10 dB is located after 3 GHz and at oblique incidence the gain is located after 4
GHz for 30o and 6 GHz for 45
o, respectively.
a)
2 4 6 8 10 12 14 16 181
1.5
2
2.5
Frequency (GHz)
Skin
depth
(cm
)
G2 - Free space
2 4 6 8 10 12 14 16 18-80
-60
-40
-20
0
Frequency (GHz)
S11 (
dB
)
APM 9 Simulation CST
Normal incidence (00)
Pyramid
New shape TE
New shape TM
2 4 6 8 10 12 14 16 18-80
-60
-40
-20
0
Frequency (GHz)
S11 (
dB
)
APM 9 Simulation CST
Oblique incidence (300)
Pyramid
New shape TE
New shape TM
2 4 6 8 10 12 14 16 18-80
-60
-40
-20
0
Frequency (GHz)
S11 (
dB
)
APM 9 Simulation CST
Oblique incidence (450)
Pyramid
New shape TE
New shape TM
2 4 6 8 10 12 14 16 182
2.5
3
3.5
4
Frequency (GHz)
Skin
depth
(cm
)
G1 - Free space
2 4 6 8 10 12 14 16 18-80
-60
-40
-20
0
Frequency (GHz)
S11 (
dB
)
APM 12 Simulation CST
Normal incidence (00)
Pyramid
New shape TE
New shape TM
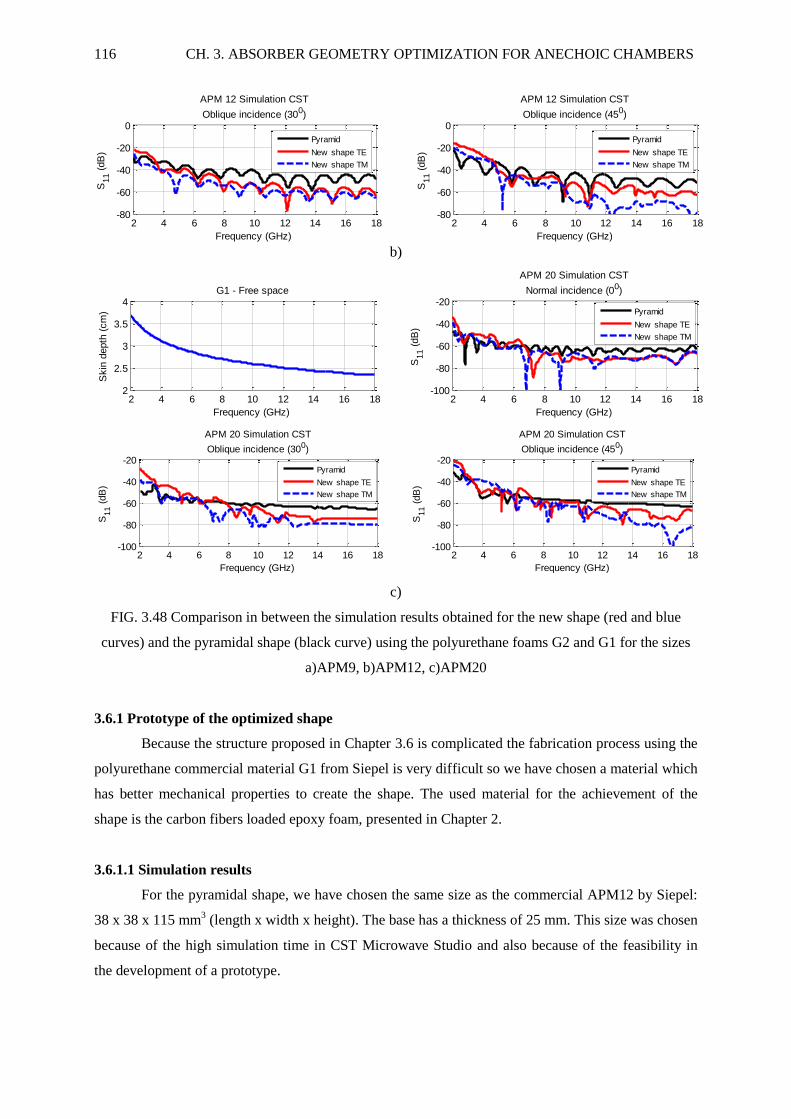
116 CH. 3. ABSORBER GEOMETRY OPTIMIZATION FOR ANECHOIC CHAMBERS
b)
c)
FIG. 3.48 Comparison in between the simulation results obtained for the new shape (red and blue
curves) and the pyramidal shape (black curve) using the polyurethane foams G2 and G1 for the sizes
a)APM9, b)APM12, c)APM20
3.6.1 Prototype of the optimized shape
Because the structure proposed in Chapter 3.6 is complicated the fabrication process using the
polyurethane commercial material G1 from Siepel is very difficult so we have chosen a material which
has better mechanical properties to create the shape. The used material for the achievement of the
shape is the carbon fibers loaded epoxy foam, presented in Chapter 2.
3.6.1.1 Simulation results
For the pyramidal shape, we have chosen the same size as the commercial APM12 by Siepel:
38 x 38 x 115 mm3 (length x width x height). The base has a thickness of 25 mm. This size was chosen
because of the high simulation time in CST Microwave Studio and also because of the feasibility in
the development of a prototype.
2 4 6 8 10 12 14 16 18-80
-60
-40
-20
0
Frequency (GHz)
S11 (
dB
)APM 12 Simulation CST
Oblique incidence (300)
Pyramid
New shape TE
New shape TM
2 4 6 8 10 12 14 16 18-80
-60
-40
-20
0
Frequency (GHz)
S11 (
dB
)
APM 12 Simulation CST
Oblique incidence (450)
Pyramid
New shape TE
New shape TM
2 4 6 8 10 12 14 16 182
2.5
3
3.5
4
Frequency (GHz)
Skin
depth
(cm
)
G1 - Free space
2 4 6 8 10 12 14 16 18-100
-80
-60
-40
-20
Frequency (GHz)S
11 (
dB
)
APM 20 Simulation CST
Normal incidence (00)
Pyramid
New shape TE
New shape TM
2 4 6 8 10 12 14 16 18-100
-80
-60
-40
-20
Frequency (GHz)
S11 (
dB
)
APM 20 Simulation CST
Oblique incidence (300)
Pyramid
New shape TE
New shape TM
2 4 6 8 10 12 14 16 18-100
-80
-60
-40
-20
Frequency (GHz)
S11 (
dB
)
APM 20 Simulation CST
Oblique incidence (450)
Pyramid
New shape TE
New shape TM

CH. 3. ABSORBER GEOMETRY OPTIMIZATION FOR ANECHOIC CHAMBERS 117
We have done multiple simulations using the epoxy foam loaded with different carbon
percentages and we have seen that the best results are obtained for the epoxy foam loaded with 0.5%
carbon fibers of 3mm length (FIG. 3.51). Because the new geometry is not symmetrical we have
slightly different results for each polarization mostly visible at oblique incidence. As a reminder, the
TE and TM polarizations are shown in FIG. 3.49 and FIG. 3.50, respectively.
FIG. 3.49 TE polarization FIG. 3.50 TM polarization
a)
b)
2 4 6 8 10 12 14 16 180
0.5
1
1.5
2
Frequency (GHz)
Eps
0.25% Permittivity - Free space
Real part
Losses
2 4 6 8 10 12 14 16 18-100
-50
0
Frequency (GHz)
S11 (
dB
)
Simulation CST
Normal incidence (00)
Pyramid
New shape TE
New shape TM
2 4 6 8 10 12 14 16 18-80
-60
-40
-20
0
Frequency (GHz)
S11 (
dB
)
Simulation CST
Oblique incidence (300)
Pyramid
New shape TE
New shape TM
2 4 6 8 10 12 14 16 18-80
-60
-40
-20
0
Frequency (GHz)
S11 (
dB
)
Simulation CST
Oblique incidence (450)
Pyramid
New shape TE
New shape TM
2 4 6 8 10 12 14 16 180
2
4
6
Frequency (GHz)
Eps
0.5% Permittivity - Free space
Real part
Losses
2 4 6 8 10 12 14 16 18
-60
-40
-20
Frequency (GHz)
S11 (
dB
)
Simulation CST
Normal incidence (00)
Pyramid
New shape TE
New shape TM
2 4 6 8 10 12 14 16 18-80
-60
-40
-20
0
Frequency (GHz)
S11 (
dB
)
Simulation CST
Oblique incidence (300)
Pyramid
New shape TE
New shape TM
2 4 6 8 10 12 14 16 18-80
-60
-40
-20
0
Frequency (GHz)
S11 (
dB
)
Simulation CST
Oblique incidence (450)
Pyramid
New shape TE
New shape TM
x, H
y, E
x, E
y, H

118 CH. 3. ABSORBER GEOMETRY OPTIMIZATION FOR ANECHOIC CHAMBERS
c)
d)
FIG. 3.51 Comparison in between the simulation results obtained for the new shape (red and blue
curves) and the pyramidal form (black curve) using the 3mm fibers loaded epoxy foam with a) 0.25%
carbon fibers, b)0.5% carbon fibers, c)0.75% carbon fibers and d)1% carbon fibers
In FIG. 3.51a we present the simulation results for the new shape and the pyramidal shape at
normal and oblique incidence (30o and 45
o) using the epoxy foam loaded with 0.25% carbon fiber. At
normal and oblique incidence the gain becomes visible after 8 GHz. The reflection coefficient is lower
by 10 dB for the new shape. In FIG. 3.51b we increase the carbon loading to 0.5% and the results
using epoxy foam loaded with this percentage are shown. In this case we can see the gain of 7 to 10
dB in the entire frequency range 2 – 18 GHz at normal incidence for the proposed geometry. At
2 4 6 8 10 12 14 16 180
5
10
Frequency (GHz)
Eps
0.75% Permittivity - Free space
Real part
Losses
2 4 6 8 10 12 14 16 18-80
-60
-40
-20
0
Frequency (GHz)
S11 (
dB
)
Simulation CST
Normal incidence (00)
Pyramid
New shape TE
New shape TM
2 4 6 8 10 12 14 16 18-80
-60
-40
-20
0
Frequency (GHz)
S11 (
dB
)
Simulation CST
Oblique incidence (300)
Pyramid
New shape TE
New shape TM
2 4 6 8 10 12 14 16 18-80
-60
-40
-20
0
Frequency (GHz)
S11 (
dB
)
Simulation CST
Oblique incidence (450)
Pyramid
New shape TE
New shape TM
2 4 6 8 10 12 14 16 180
5
10
15
20
Frequency (GHz)
Eps
1% Permittivity - Free space
Real part
Losses
2 4 6 8 10 12 14 16 18-80
-60
-40
-20
0
Frequency (GHz)
S11 (
dB
)
Simulation CST
Normal incidence (00)
Pyramid
New shape
2 4 6 8 10 12 14 16 18-80
-60
-40
-20
0
Frequency (GHz)
S11 (
dB
)
Simulation CST
Oblique incidence (300)
Pyramid
New shape
2 4 6 8 10 12 14 16 18-80
-60
-40
-20
0
Frequency (GHz)
S11 (
dB
)
Simulation CST
Oblique incidence (450)
Pyramid
New shape
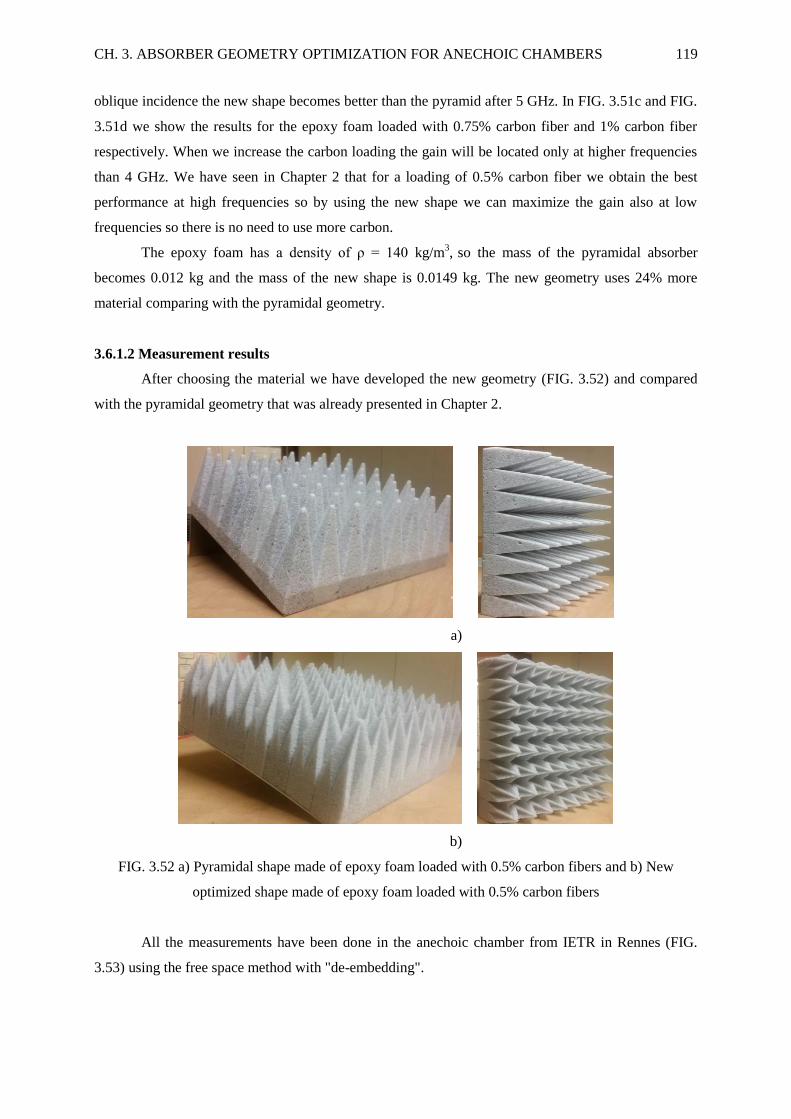
CH. 3. ABSORBER GEOMETRY OPTIMIZATION FOR ANECHOIC CHAMBERS 119
oblique incidence the new shape becomes better than the pyramid after 5 GHz. In FIG. 3.51c and FIG.
3.51d we show the results for the epoxy foam loaded with 0.75% carbon fiber and 1% carbon fiber
respectively. When we increase the carbon loading the gain will be located only at higher frequencies
than 4 GHz. We have seen in Chapter 2 that for a loading of 0.5% carbon fiber we obtain the best
performance at high frequencies so by using the new shape we can maximize the gain also at low
frequencies so there is no need to use more carbon.
The epoxy foam has a density of ρ = 140 kg/m3, so the mass of the pyramidal absorber
becomes 0.012 kg and the mass of the new shape is 0.0149 kg. The new geometry uses 24% more
material comparing with the pyramidal geometry.
3.6.1.2 Measurement results
After choosing the material we have developed the new geometry (FIG. 3.52) and compared
with the pyramidal geometry that was already presented in Chapter 2.
a)
b)
FIG. 3.52 a) Pyramidal shape made of epoxy foam loaded with 0.5% carbon fibers and b) New
optimized shape made of epoxy foam loaded with 0.5% carbon fibers
All the measurements have been done in the anechoic chamber from IETR in Rennes (FIG.
3.53) using the free space method with "de-embedding".
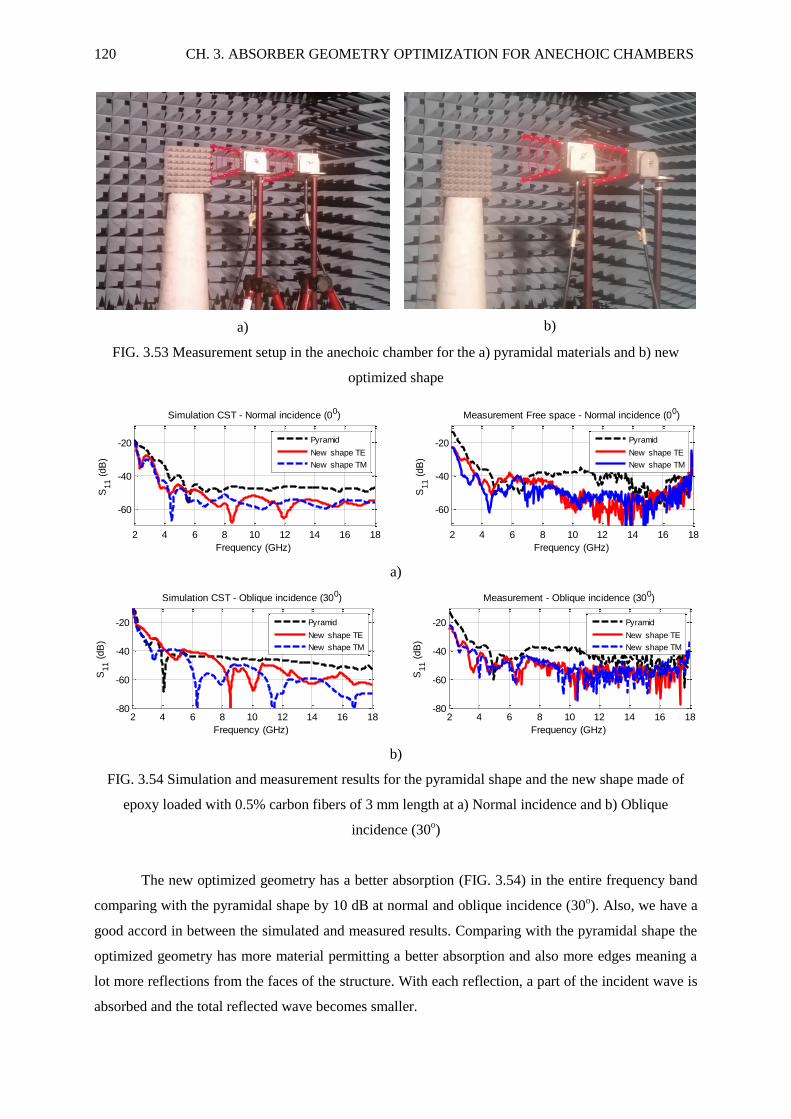
120 CH. 3. ABSORBER GEOMETRY OPTIMIZATION FOR ANECHOIC CHAMBERS
a)
b)
FIG. 3.53 Measurement setup in the anechoic chamber for the a) pyramidal materials and b) new
optimized shape
a)
b)
FIG. 3.54 Simulation and measurement results for the pyramidal shape and the new shape made of
epoxy loaded with 0.5% carbon fibers of 3 mm length at a) Normal incidence and b) Oblique
incidence (30o)
The new optimized geometry has a better absorption (FIG. 3.54) in the entire frequency band
comparing with the pyramidal shape by 10 dB at normal and oblique incidence (30o). Also, we have a
good accord in between the simulated and measured results. Comparing with the pyramidal shape the
optimized geometry has more material permitting a better absorption and also more edges meaning a
lot more reflections from the faces of the structure. With each reflection, a part of the incident wave is
absorbed and the total reflected wave becomes smaller.
2 4 6 8 10 12 14 16 18
-60
-40
-20
Frequency (GHz)
S11 (
dB
)
Simulation CST - Normal incidence (00)
Pyramid
New shape TE
New shape TM
2 4 6 8 10 12 14 16 18
-60
-40
-20
Frequency (GHz)
S11 (
dB
)Measurement Free space - Normal incidence (00)
Pyramid
New shape TE
New shape TM
2 4 6 8 10 12 14 16 18-80
-60
-40
-20
Frequency (GHz)
S11 (
dB
)
Simulation CST - Oblique incidence (300)
Pyramid
New shape TE
New shape TM
2 4 6 8 10 12 14 16 18-80
-60
-40
-20
Frequency (GHz)
S11 (
dB
)
Measurement - Oblique incidence (300)
Pyramid
New shape TE
New shape TM

CH. 3. ABSORBER GEOMETRY OPTIMIZATION FOR ANECHOIC CHAMBERS 121
3.7 Conclusion
Even today scientists are trying to improve either the material or the geometry used in an
anechoic chamber. So far, multiple geometries and materials exist that can improve the reflection loss
in anechoic chambers. A new geometry design has been presented and measured in this chapter. The
usage of the shape can increase the performance of the classical pyramidal absorber. Using a material
with good mechanical properties we can achieve very complicated shapes that could improve the
performance in a free space anechoic chamber.
We have seen that geometries can be optimized and also that depending on the material used
we can obtain a lower reflection loss. We have conducted various studies at normal and oblique
incidence and seen that the optimization result is conserved.

122 CH. 3. ABSORBER GEOMETRY OPTIMIZATION FOR ANECHOIC CHAMBERS

123
Chapter 4
Optimization of Microwave Absorbers Using Metamaterials
4.1 Introduction
The objective of this chapter is to address the combination of natural material absorber with
metamaterial in order to enhance their absorption properties and compactness.
The design of resonant metamaterial absorbers has attracted intense attention in the last few
years [110 - 117]. The design idea of this Microwave Material Absorber (MMA) is to adjust the
effective ε(ω) and (ω) independently by varying the dimensions of the electric resonant component and
the magnetic resonant component in the unit cell so as to match the effective impedance of MMA to
free space and achieve a large resonant dissipation in the meantime. Thus, wave transmission and
reflection are minimized simultaneously, and absorption is maximized. Metamaterials have small-
scale dimensions. At the resonant frequency the length and width of the metamaterial is usually /10.
Compared with conventional absorbers [95], this kind of MMAs exhibit some advantages including
the ultra-thin thickness, lossless surface, simple as well as light configuration and easily-extendable
absorbing frequencies.
This chapter is organized as follows: after a brief state of art about broadband metamaterials
and metamaterials associated with natural absorbers we present the configuration of the unit cells
considered, as well as the design of the interleaved metamaterial array. The combination of an
absorber material backed by this array is described. Measurement and simulation results for different
polarizations are then presented. Afterwards, we expose multilayer techniques to enlarge the
bandwidth of the metamaterial. In the last part of this chapter, the configuration of dual polarized
metamaterial unit cell is proposed and the design of the corresponding interleaved metamaterial array
is tested.
4.2 Metamaterial types and their association with natural absorber materials
In recent years, metamaterials have attracted a lot of attention and have been used in various
fields. In the following paragraph we are going to present some of the broadband metamaterials that
have been developed in the recent years by researchers.
FIG. 4 presents some examples of band enhanced metamaterials. The first example (FIG. 4.1a)
is a triple band metamaterial that resonates in between 5 and 13 GHz [115]. The first and second
resonance peaks (Peaks A and B) are caused by the surface current that flows along the major and the
minor axes of the cut-wire bar. The third-harmonic magnetic resonance of the major axis and the pairs
of antiparallel currents parallel or antiparallel to the incident EM wave created the third and fourth
resonance peaks (Peak C and D) presented in FIG. 4.1a [115].

124 CH. 4 OPTIMIZATION OF MICROWAVE ABSORBERS USING METAMATERIALS
a) b)
c)
FIG. 4.1 Examples of broadband metamaterials
The second example of a broadband metamaterial (FIG. 4.1b) resonates in between 13 and 14
GHz [116] shown in FIG. 4.1b. The metamaterial is composed of E-shaped dielectric resonators and
with a metallic plate placed behind. The metamaterial also works at oblique incidence in between 0o
and 70o. The E-shaped dielectric resonator structure is made of SrTiO3, with a permittivity of 300 and
tangent loss of 0.005 [116].
In the last example (FIG. 4.1c) we have a microwave ultra-broadband polarization
independent metamaterial that has a perfect absorption coefficient between 8 and 14 GHz [117]. This
metamaterial is composed of pyramids formed by metallic/dielectric multilayer's. The used metal is
copper and the dielectric material is FR4 with the relative permittivity and loss tangent of 4.4 and 0.02,
respectively. A pyramid is composed of 20 metal patches (layers) and every two adjacent metal
patches are separated by a dielectric patch [117].
We have presented only three examples of broadband metamaterials, where we have verified
ourselves the results obtained but there are a lot more articles in literature that speak about this type of
artificial materials. We can mention: a broadband Archimedean spiral antenna above a thin modified
electromagnetic band gap substrate that works in between 0.9 and 9.9 GHz [118]; the thesis of F. Lint
that speaks about high impedance surfaces [119]; a triple-band ultrathin metamaterial absorber that is
polarization independent and works in a wide-angle range at 3.25, 9.45 and 10.9 GHz [120]; a
broadband metamaterial absorbing panel with a resistive pattern made of ink with graphene
nanoplatelets with a thickness of 5 mm that works in between 5 and 18 GHz [121]; a nonlinear
metamaterial capable of transitioning between a broadband reflective and broadband nonreflective
state depending on the incident power level in the frequency band 2 to 4 GHz [122]; an ultra-thin,
ultra-broadband metamaterial absorber that uses slotted metal loops with multi-layers having a total
thickness of 3.4 mm and has an absorption higher than 90% in the frequency range 8.4 - 23.6 GHz

CH. 4 OPTIMIZATION OF MICROWAVE ABSORBERS USING METAMATERIALS 125
[123]; a wide-band broadband microwave metamaterial absorber with octave bandwidth that works
between 6.86 and 15.16 GHz [124]; an innovative multi-layer metamaterial that uses 3D printing
technology having a total thickness of 2.89 mm and has a reflectivity lower than -10 dB in between 8
and 18 GHz [125]; a broadband flexible metamaterial absorber based on high-impedance surface made
of rubber with a thickness of 2.5 mm that has a higher than 90% absorption in between 7.9 and 18.74
GHz [126]; a flexible metamaterial absorber using a hollow octagon and hollow similar square with
the same centre structure that works as a broadband, polarization - insensitive and wide - angle
absorber is presented in [127] and has an absorption higher than 90% in between 6.84 and 17.44 GHz;
a cross dumbbell - shaped structure loaded with lumped resisters that achieves an absorption of 90%
from 5 to 12.1 GHz [128] and last but not least an innovative broadband metamaterial microwave
absorber made of water droplets that has a thickness of 3 mm and works in between 6.5 and 14.57
GHz [129].
Recently, it has been demonstrated that the inclusion of frequency selective surfaces (FSS)
within the back layer of the absorber can significantly improve the low frequency performance [130 -
133].
In the first example, presented in FIG. 4.2a [132], the authors used a truncated pyramidal
absorber and the metamaterial is placed on the top of the structure. This increased the reflection loss
performance in between 15 and 20 GHz. The substrate of the metamaterial is Taconic TLX 906207
with a dielectric constant of 2.5. If the outer split ring gap has a width of 0.02 then this results in the
best refection loss performance [132].
In the second example, presented in FIG. 4.2b [133], the metamaterial is placed inside the base
of the pyramidal geometry. Here, the absorption is improved at lower frequencies in between 2 and 6
GHz. The absorber used was the VHP-4 from Emerson and Cuming and the metamaterial was
obtained by optimization using Genetic Algorithm in combination with CST Microwave Studio. When
the polarization of incident waves remains fixed, the used of an optimized binary FSS is able to
improve the performance of the natural absorber alone [133].

126 CH. 4 OPTIMIZATION OF MICROWAVE ABSORBERS USING METAMATERIALS
a)
b)
FIG. 4.2 Examples of incorporating an artificial material on natural pyramidal absorber
4.3 Metamaterial structure
In the next part of this chapter an interleaved metamaterial array will be proposed, analyzed
and measured.
4.3.1 Geometry of the metamaterial
The patterned layer consists of two different resonators with rectangular lattice, and each of
them operates at different frequency bands. The first unit cell, referenced A, is an existing snake shape
metamaterial [134] optimized here to fit our needs, that resonates at 2 GHz for vertical polarization.
The second unit cell used is a spiral metamaterial, referenced as B, that has multiple resonant
frequencies in between 2 and 12 GHz depending on polarization. The resonant cells are printed on one
side of the Arlon 880 substrate (εr = 2.2) where the other side is metalized and considered as a ground
plane.
a)
b)
0.5 2 4 6 8 10 12 14 16 18-25
-20
-15
-10
-5
0
Frequency (GHz)
S11
(dB) - Normal incidence
TE
TH
0.5 2 4 6 8 10 12 14 16 18-25
-20
-15
-10
-5
0
Frequency (GHz)
S11
(dB) - Normal incidence
TE
TH
x, H
x, E k
x, H
x, E k

CH. 4 OPTIMIZATION OF MICROWAVE ABSORBERS USING METAMATERIALS 127
FIG. 4.3 The two resonator shapes and Reflection coefficient versus frequency for vertical and
horizontal polarization for a) Snake shape cell and b) Spiral shape cell
A study on the periodicity has been conducted in CST and was determined that 0.2 mm is the
optima value for having a resonant peak at a low frequencies with a reflection coefficient as low as
possible (FIG. 4.4).
FIG. 4.4 Periodicity of the small resonators
Since the unit cell is periodic in the array, Floquet theory [135] is applied to analyze the
radiation performance of the metamaterial array. A schematic of the used structure is depicted in FIG.
4.5.
We can see that each cell resonates at specific frequencies (FIG. 4.3) but by combining the
two small resonators we obtain the final Interleaved Metamaterial Array (IMA) that can operate in
several frequency bands (FIG. 4.6).
0.5 2 4 6 8 10 12 14 16 18-25
-20
-15
-10
-5
0
Frequency (GHz)
p (
mm
)
MM vertical polarization
p=0
p=0.1
p=0.2
p=0.3
p=0.4
p=0.7
p=1.2
p=1.7
p=2.7
0.5 2 4 6 8 10 12 14 16 18-25
-20
-15
-10
-5
0
Frequency (GHz)
p (
mm
)
MM horizontal polarization
p=0
p=0.1
p=0.2
p=0.3
p=0.4
p=0.7
p=1.2
p=1.7
p=2.7
0.5 2 4 6 8 10 12 14 16 18-25
-20
-15
-10
-5
0
Frequency (GHz)
p (
mm
)
MM vertical polarization
p=0
p=0.1
p=0.2
p=0.3
p=0.4
p=0.7
p=1.2
p=1.7
p=2.7
0.5 2 4 6 8 10 12 14 16 18-25
-20
-15
-10
-5
0
Frequency (GHz)
p (
mm
)
MM horizontal polarization
p=0
p=0.1
p=0.2
p=0.3
p=0.4
p=0.7
p=1.2
p=1.7
p=2.7

128 CH. 4 OPTIMIZATION OF MICROWAVE ABSORBERS USING METAMATERIALS
FIG. 4.5 Interleaved metamaterial array
FIG. 4.6 Simulated results for the final IMA at normal incidence depending on polarization
In order to confirm what is the optimal distance determined between cells so that we can have
a broad frequency band we've done a parametric study (FIG. 4.7). If we increase the distance (here p),
the resonance peaks, for vertical polarization are conserved between 12 and 15 GHz. Only for a
distance of 0.2 mm we had optimum absorption in a larger frequency band, between 8 and 16 GHz. At
this distance for the other polarization of the electric field we have resonant frequencies in between 4
and 6 GHz. Because the structure is not symmetrical we obtain different results for each polarization.
FIG. 4.7 Optimal distance in between the two small cells
2 4 6 8 10 12 14 16 18-25
-20
-15
-10
-5
0
Frequency (GHz)
S11
(dB) - Normal incidence
Vertical polarization
Simulation
2 4 6 8 10 12 14 16 18-25
-20
-15
-10
-5
0
Frequency (GHz)
S11
(dB) - Normal incidence
Horizontal polarization
Simulation
Frequency (GHz)
p (
mm
)
MM vertical polarization
0.5 5 10 18
0
0.5
1
1.5
2
2.5
-5
-4.5
-4
-3.5
-3
-2.5
-2
-1.5
-1
-0.5
0
Frequency (GHz)
p (
mm
)
MM horizontal polarization
0.5 5 10 18
0
0.5
1
1.5
2
2.5
-5
-4.5
-4
-3.5
-3
-2.5
-2
-1.5
-1
-0.5
0

CH. 4 OPTIMIZATION OF MICROWAVE ABSORBERS USING METAMATERIALS 129
The current distribution of the principal resonant frequencies for the top layer has been plotted
so we can have a better understanding of the resonant system.
The results obtained for the most prominent absorption peaks are depicted here. The resonant
frequencies are associated with the top layer of the structure.
For horizontal polarization, we have only one important resonant frequency at 4.74 GHz and
all four spiral geometries are associated with it just like can be observed in FIG. 4.8.
FIG. 4.8 Current distribution for the top layer of the IMA for horizontal polarization at 4.74 GHz
a)
b)
c)
2 4 6 8 10 12 14 16 18-25
-20
-15
-10
-5
0
Frequency (GHz)
S11
(dB) - Normal incidence
Horizontal polarization
Simulation
2 4 6 8 10 12 14 16 18-25
-20
-15
-10
-5
0
Frequency (GHz)
S11
(dB) - Normal incidence
Vertical polarization
Simulation

130 CH. 4 OPTIMIZATION OF MICROWAVE ABSORBERS USING METAMATERIALS
d)
FIG. 4.9 Current distributions for the top layer of the IMA for vertical polarization at a) 7.149 GHz, b)
8.89 GHz, c) 9.78 GHz and d) 14.04 GHz
For vertical polarization (FIG. 4.9) the first resonant frequency is caused by the snake shape
and the spiral shape geometries. The last three resonant frequencies are caused mainly by the spiral
shape. At 8.89 GHz the top and bottom spiral shapes have the most effect and at 9.78 GHz the left and
right spiral affect the resonant frequencies.
Also, different configurations for the IMA have been tried for both polarizations so that we
can obtain the best broadband coverage. In FIG. 4.10 we have some of the many configurations.
Original IMA Only snake shaped
Metamaterial
Only spiral shaped
Metamaterial
Rotated snake shaped IMA Rotated spiral shaped IMA Reversed place in between
the cells of the IMA

CH. 4 OPTIMIZATION OF MICROWAVE ABSORBERS USING METAMATERIALS 131
Double layer IMA
Triple layer IMA
FIG. 4.10 Different configurations of the IMA
We are going to take each of the configurations presented in FIG. 4.10 and simulate using two
thicknesses for the substrate: 0.8 and 1.5 mm. The thickness of the substrate is standard.
We start with the snake shaped metamaterial. For the first configuration presented in FIG. 4.11
the snake shaped cell is placed on a 38 x 38 mm2
Arlon substrate. The blue curve represents the
original IMA with the design presented in FIG. 4.5 depending on polarization. If we use only the
snake shaped metamaterial with different thicknesses for the substrate and compare with the original
IMA we can see that we do not have a large bandwidth and also for TM polarization the resonant
peaks are located at higher frequencies after 6.5 GHz.
FIG. 4.11 Only snake shaped metamaterial configuration 1
If we change the location of the snake shaped metallization on the substrate like can be seen in
FIG. 4.12 we start to have a larger bandwidth but after 12 GHz for TE polarization (curves green and
red) and no improvement for TM polarization comparing with the arrangement from FIG. 4.11.
2 4 6 8 10 12 14 16 18-50
-40
-30
-20
-10
0
Frequency (GHz)
S11 (
dB
)
Normal incidence TE polarization
IMA original
IMA only snake t=0.8 mm/substrate
IMA only snake t=1.5 mm/substrate
2 4 6 8 10 12 14 16 18-50
-40
-30
-20
-10
0
Frequency (GHz)
S11 (
dB
)
Normal incidence TM polarization
IMA original
IMA only snake t=0.8 mm/substrate
IMA only snake t=1.5 mm/substrate
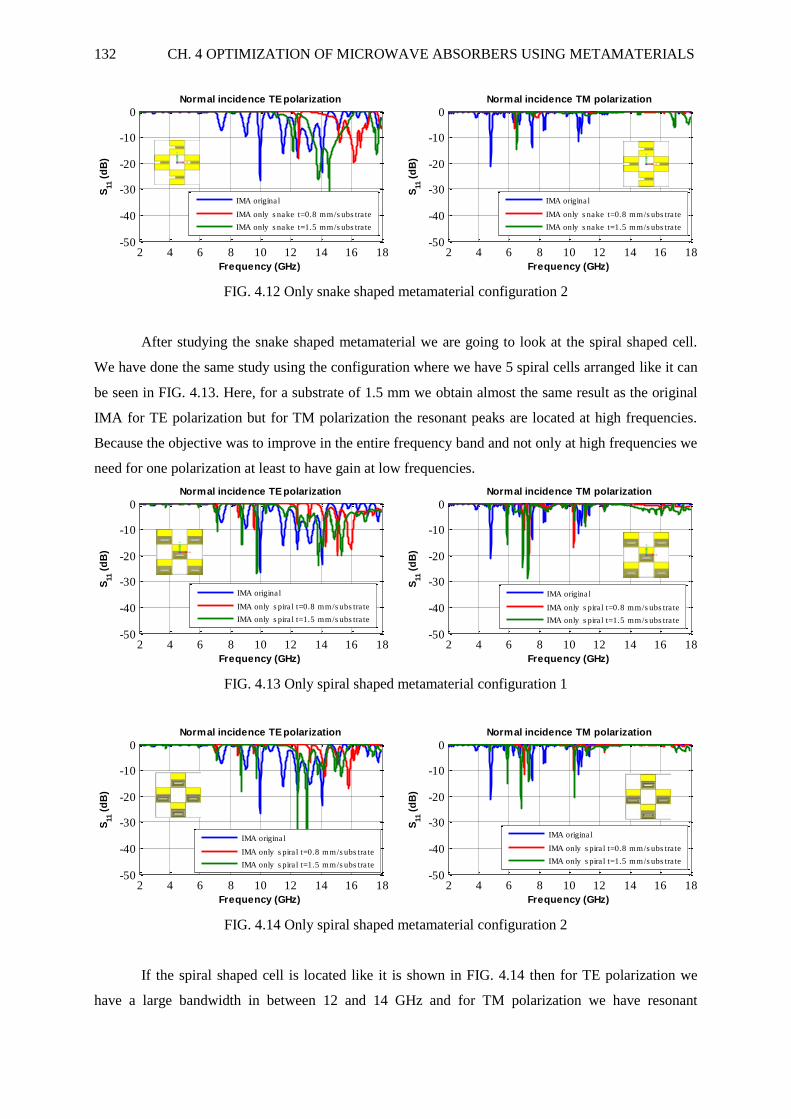
132 CH. 4 OPTIMIZATION OF MICROWAVE ABSORBERS USING METAMATERIALS
FIG. 4.12 Only snake shaped metamaterial configuration 2
After studying the snake shaped metamaterial we are going to look at the spiral shaped cell.
We have done the same study using the configuration where we have 5 spiral cells arranged like it can
be seen in FIG. 4.13. Here, for a substrate of 1.5 mm we obtain almost the same result as the original
IMA for TE polarization but for TM polarization the resonant peaks are located at high frequencies.
Because the objective was to improve in the entire frequency band and not only at high frequencies we
need for one polarization at least to have gain at low frequencies.
FIG. 4.13 Only spiral shaped metamaterial configuration 1
FIG. 4.14 Only spiral shaped metamaterial configuration 2
If the spiral shaped cell is located like it is shown in FIG. 4.14 then for TE polarization we
have a large bandwidth in between 12 and 14 GHz and for TM polarization we have resonant
2 4 6 8 10 12 14 16 18-50
-40
-30
-20
-10
0
Frequency (GHz)
S11 (
dB
)Normal incidence TE polarization
IMA original
IMA only snake t=0.8 mm/substrate
IMA only snake t=1.5 mm/substrate
2 4 6 8 10 12 14 16 18-50
-40
-30
-20
-10
0
Frequency (GHz)
S11 (
dB
)
Normal incidence TM polarization
IMA original
IMA only snake t=0.8 mm/substrate
IMA only snake t=1.5 mm/substrate
2 4 6 8 10 12 14 16 18-50
-40
-30
-20
-10
0
Frequency (GHz)
S11 (
dB
)
Normal incidence TE polarization
IMA original
IMA only spiral t=0.8 mm/substrate
IMA only spiral t=1.5 mm/substrate
2 4 6 8 10 12 14 16 18-50
-40
-30
-20
-10
0
Frequency (GHz)
S11 (
dB
)
Normal incidence TM polarization
IMA original
IMA only spiral t=0.8 mm/substrate
IMA only spiral t=1.5 mm/substrate
2 4 6 8 10 12 14 16 18-50
-40
-30
-20
-10
0
Frequency (GHz)
S11 (
dB
)
Normal incidence TE polarization
IMA original
IMA only spiral t=0.8 mm/substrate
IMA only spiral t=1.5 mm/substrate
2 4 6 8 10 12 14 16 18-50
-40
-30
-20
-10
0
Frequency (GHz)
S11 (
dB
)
Normal incidence TM polarization
IMA original
IMA only spiral t=0.8 mm/substrate
IMA only spiral t=1.5 mm/substrate

CH. 4 OPTIMIZATION OF MICROWAVE ABSORBERS USING METAMATERIALS 133
frequencies after 6 GHz. If the substrate has a thickness of 0.8 mm then the gain is too small compared
with using a substrate of 1.5 mm.
FIG. 4.15 Rotated snake shaped IMA
By using only one of the two cells we have seen that the results are comparable with the
original IMA so the next step is to modify the IMA with two cells by changing the place of the cells in
between them. A first study was done by rotating only the snake shaped cells like it can be seen in
FIG. 4.15. For a substrate thickness of 0.8 mm the resonant peaks are rare and we have no large
bandwidth for any of the polarizations. If we double the thickness, for 1.5 mm substrate thickness, we
start to see a better gain but comparing with the original arrangement IMA the results are not
improved.
FIG. 4.16 Rotated spiral shaped IMA
After rotating only the snake shaped cell we are going to do a study by only rotating the spiral
shaped metamaterial (FIG. 4.16). The behavior is almost the same as for the case with the rotated
snake cell: small gain and no broadband effect.
2 4 6 8 10 12 14 16 18-50
-40
-30
-20
-10
0
Frequency (GHz)
S11 (
dB
)
Normal incidence TE polarization
IMA original
IMA rotated snake t=0.8 mm/substrate
IMA rotated snake t=1.5 mm/substrate
2 4 6 8 10 12 14 16 18-50
-40
-30
-20
-10
0
Frequency (GHz)
S11 (
dB
)
Normal incidence TM polarization
IMA original
IMA rotated snake t=0.8 mm/substrate
IMA rotated snake t=1.5 mm/substrate
2 4 6 8 10 12 14 16 18-50
-40
-30
-20
-10
0
Frequency (GHz)
S11 (
dB
)
Normal incidence TE polarization
IMA original
IMA rotated spiral t=0.8 mm/substrate
IMA rotated spiral t=1.5 mm/substrate
2 4 6 8 10 12 14 16 18-50
-40
-30
-20
-10
0
Frequency (GHz)
S11 (
dB
)
Normal incidence TM polarization
IMA original
IMA rotated spiral t=0.8 mm/substrate
IMA rotated spiral t=1.5 mm/substrate

134 CH. 4 OPTIMIZATION OF MICROWAVE ABSORBERS USING METAMATERIALS
FIG. 4.17 Reversed place in between the cells of the IMA
We can think about changing the place in between the two cells and see if the coupling in
between them affects the final result. For a substrate of 1.5 mm we can see in FIG. 4.17 (curve green)
that the results are the same for the original IMA and the reversed arrangement.
FIG. 4.18 Double layer IMA with the top layer rotated at 900
A final study has been conducted by using two and three metamaterial layers. On the original
IMA we have a substrate having the same thickness as the original and then we placed the
metallization rotated by 900 in order to tray and obtain the same result for both polarizations and have
a symmetrical structure. We can see in FIG. 4.18 that by having two layers we obtain a new resonant
peak at 4 GHz and we have a large bandwidth in between 12 and 14 GHz for TE polarization but for
TM polarization the resonant frequency located initially at 4.74 GHz moves at 4 GHz but the gain is
smaller than 10 dB.
We've also changed the thickness of each substrate but the results were always better when the
thickness was the same for both substrates.
2 4 6 8 10 12 14 16 18-50
-40
-30
-20
-10
0
Frequency (GHz)
S11 (
dB
)Normal incidence TE polarization
IMA original
IMA inv ersed shapes t=0.8 mm/substrate
IMA inv ersed shapes t=1.5 mm/substrate
2 4 6 8 10 12 14 16 18-50
-40
-30
-20
-10
0
Frequency (GHz)
S11 (
dB
)
Normal incidence TM polarization
IMA original
IMA inv ersed shapes t=0.8 mm/substrate
IMA inv ersed shapes t=1.5 mm/substrate
2 4 6 8 10 12 14 16 18-50
-40
-30
-20
-10
0
Frequency (GHz)
S11 (
dB
)
Normal incidence TE polarization
IMA one lay er
IMA two lay ers t=0.8 mm/substrate
IMA two lay ers t=1.5 mm/substrate
2 4 6 8 10 12 14 16 18-50
-40
-30
-20
-10
0
Frequency (GHz)
S11 (
dB
)
Normal incidence TM polarization
IMA one lay er
IMA two lay ers t=0.8 mm/substrate
IMA two lay ers t=1.5 mm/substrate
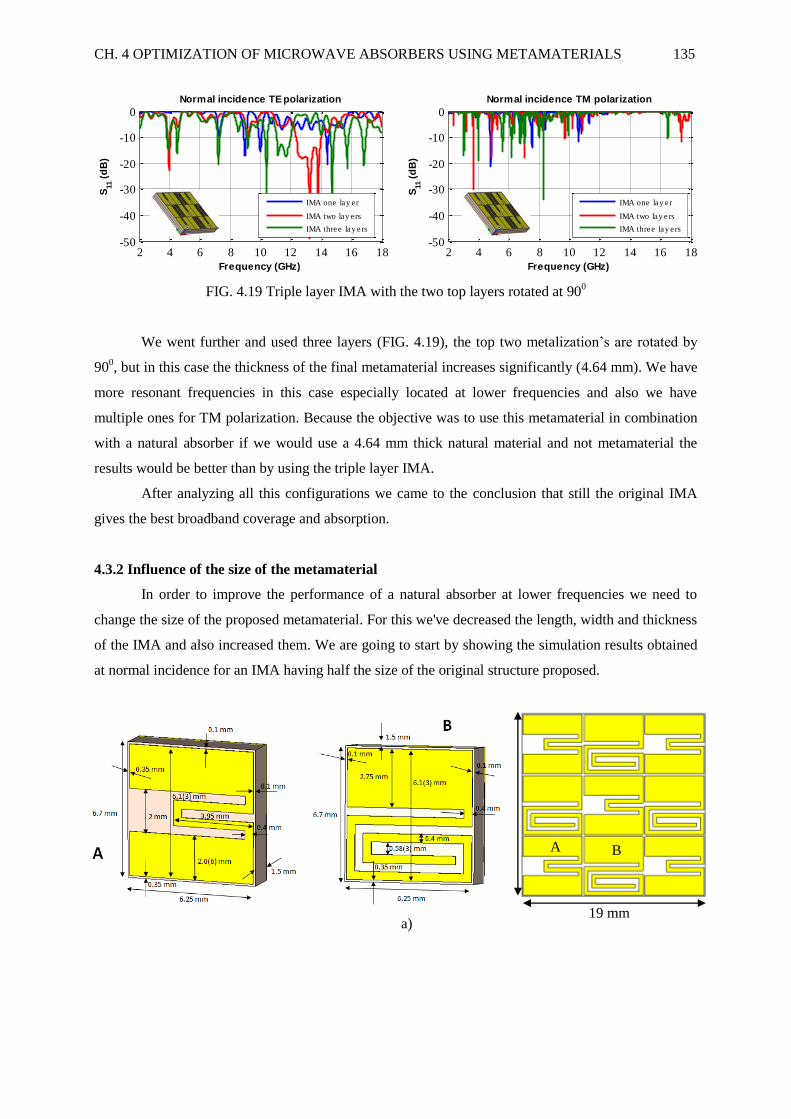
CH. 4 OPTIMIZATION OF MICROWAVE ABSORBERS USING METAMATERIALS 135
FIG. 4.19 Triple layer IMA with the two top layers rotated at 900
We went further and used three layers (FIG. 4.19), the top two metalization’s are rotated by
900, but in this case the thickness of the final metamaterial increases significantly (4.64 mm). We have
more resonant frequencies in this case especially located at lower frequencies and also we have
multiple ones for TM polarization. Because the objective was to use this metamaterial in combination
with a natural absorber if we would use a 4.64 mm thick natural material and not metamaterial the
results would be better than by using the triple layer IMA.
After analyzing all this configurations we came to the conclusion that still the original IMA
gives the best broadband coverage and absorption.
4.3.2 Influence of the size of the metamaterial
In order to improve the performance of a natural absorber at lower frequencies we need to
change the size of the proposed metamaterial. For this we've decreased the length, width and thickness
of the IMA and also increased them. We are going to start by showing the simulation results obtained
at normal incidence for an IMA having half the size of the original structure proposed.
a)
2 4 6 8 10 12 14 16 18-50
-40
-30
-20
-10
0
Frequency (GHz)
S11 (
dB
)Normal incidence TE polarization
IMA one lay er
IMA two lay ers
IMA three lay ers
2 4 6 8 10 12 14 16 18-50
-40
-30
-20
-10
0
Frequency (GHz)
S11 (
dB
)
Normal incidence TM polarization
IMA one lay er
IMA two lay ers
IMA three lay ers
19 mm
A B
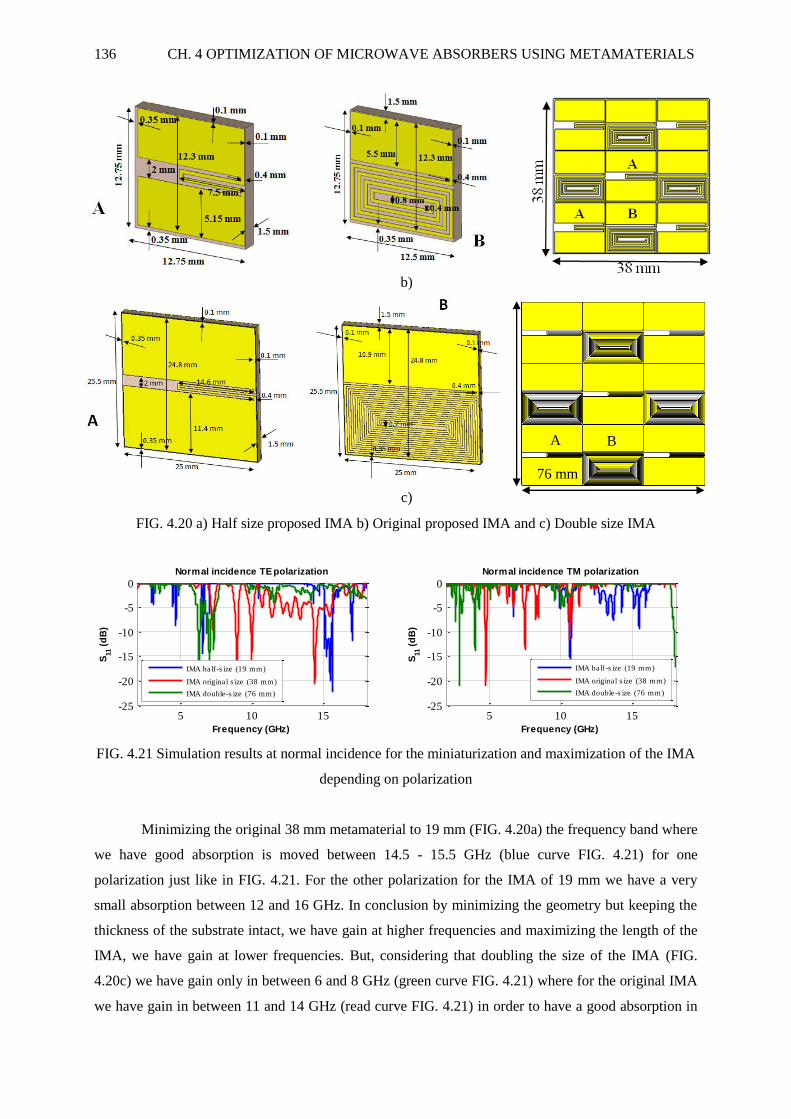
136 CH. 4 OPTIMIZATION OF MICROWAVE ABSORBERS USING METAMATERIALS
b)
c)
FIG. 4.20 a) Half size proposed IMA b) Original proposed IMA and c) Double size IMA
FIG. 4.21 Simulation results at normal incidence for the miniaturization and maximization of the IMA
depending on polarization
Minimizing the original 38 mm metamaterial to 19 mm (FIG. 4.20a) the frequency band where
we have good absorption is moved between 14.5 - 15.5 GHz (blue curve FIG. 4.21) for one
polarization just like in FIG. 4.21. For the other polarization for the IMA of 19 mm we have a very
small absorption between 12 and 16 GHz. In conclusion by minimizing the geometry but keeping the
thickness of the substrate intact, we have gain at higher frequencies and maximizing the length of the
IMA, we have gain at lower frequencies. But, considering that doubling the size of the IMA (FIG.
4.20c) we have gain only in between 6 and 8 GHz (green curve FIG. 4.21) where for the original IMA
we have gain in between 11 and 14 GHz (read curve FIG. 4.21) in order to have a good absorption in
5 10 15-25
-20
-15
-10
-5
0
Frequency (GHz)
S11 (
dB
)
Normal incidence TE polarization
IMA half -size (19 mm)
IMA original size (38 mm)
IMA double-size (76 mm)
5 10 15-25
-20
-15
-10
-5
0
Frequency (GHz)
S11 (
dB
)
Normal incidence TM polarization
IMA half -size (19 mm)
IMA original size (38 mm)
IMA double-size (76 mm)
76 mm
A B

CH. 4 OPTIMIZATION OF MICROWAVE ABSORBERS USING METAMATERIALS 137
between 0.5 and 1 GHz we would need an IMA 6 times bigger than the original 38 mm IMA. Also, if
we increase the length and conserve the thickness of the metamaterial at 1.5 mm we can see that the
broadband effect is obtained in a smaller frequency band.
4.3.3 Measurement results
A prototype of the proposed IMA has been achieved and shown in FIG. 4.22a. The overall
dimensions are 19 cm x 19 cm. The artificial material has been measured, using the free space method
[5, 136] in two anechoic chambers: one at IETR (FIG. 4.22b) and one at CHEOPS (FIG. 4.22c) from
CELAR (DGA) [137].
a) b) c)
FIG. 4.22 a) Photo of the fabricated sample, b) Anechoic chamber measurement at INSA - IETR of
Rennes, France and c) CHEOPS Anechoic chamber from CELAR (DGA), France
a) b)
FIG. 4.23 Simulated and measured reflection coefficient of the IMA at a) vertical polarization and b)
horizontal polarization
The simulated and measured reflection coefficient at normal incidence, in vertical and
horizontal polarization configurations, of the interleaved metamaterial array are shown in FIG. 4.23.
As can be seen, the array operates at several frequency bands predicted by simulation. The difference
2 4 6 8 10 12 14 16 18-25
-20
-15
-10
-5
0
Frequency (GHz)
S11
(dB) - Normal incidence
Simulation
Measurement - IETR
Measurement - CHEOPS
2 4 6 8 10 12 14 16 18-25
-20
-15
-10
-5
0
Frequency (GHz)
S11
(dB) - Normal incidence
Simulation
Measurement - IETR
Measurement - CHEOPS

138 CH. 4 OPTIMIZATION OF MICROWAVE ABSORBERS USING METAMATERIALS
between measurement and simulation is principally due to the fact that in measurement we have a
finite structure of the array while in simulation we characterize the array in an infinite configuration.
We have also performed measurements at oblique incidence for 15o, 30
o, 45
o and 60
o.
Vertical polarization Horizontal polarization
a)
b)
c)
d)
FIG. 4.24 Simulated and measured results for the IMA at oblique incidence depending on polarization
for a)15o, b) 30
o, c) 45
o and d) 60
o
2 4 6 8 10 12 14 16 18-30
-20
-10
0
Frequency (GHz)
S11
(dB) - Oblique incidence (150)
Simulation
Measurement
2 4 6 8 10 12 14 16 18-30
-20
-10
0
Frequency (GHz)
S11
(dB) - Oblique incidence (150)
Simulation
Measurement
2 4 6 8 10 12 14 16 18-30
-20
-10
0
Frequency (GHz)
S11
(dB) - Oblique incidence (300)
Simulation
Measurement
2 4 6 8 10 12 14 16 18-30
-20
-10
0
Frequency (GHz)
S11
(dB) - Oblique incidence (300)
Simulation
Measurement
2 4 6 8 10 12 14 16 18-30
-20
-10
0
Frequency (GHz)
S11
(dB) - Oblique incidence (450)
Simulation
Measurement
2 4 6 8 10 12 14 16 18-30
-20
-10
0
Frequency (GHz)
S11
(dB) - Oblique incidence (450)
Simulation
Measurement
2 4 6 8 10 12 14 16 18-30
-20
-10
0
Frequency (GHz)
S11
(dB) - Oblique incidence (600)
Simulation
Measurement
2 4 6 8 10 12 14 16 18-30
-20
-10
0
Frequency (GHz)
S11
(dB) - Oblique incidence (600)
Simulation
Measurement

CH. 4 OPTIMIZATION OF MICROWAVE ABSORBERS USING METAMATERIALS 139
For each angle of incidence we have compared the measured and simulated results (FIG.
4.24). The metamaterial has been created to work at oblique incidence and as we can see from the
results at 45o we have optimum coverage for both polarizations. The metamaterial has resonant
frequencies after 10 GHz. For horizontal polarization, we can observe that the metamaterial works at
lower frequencies between 4 and 6 GHz. It can be noted here that we have a good concordance in
between the simulation and the measurement results.
The radar cross section (RCS) was measured in the CHEOPS anechoic chamber from CELAR
(DGA), in between -60o and 60
o. The results are presented below in FIG. 4.25. We have also
presented the RCS for a metallic plate so that we can compare with the metamaterial.
In FIG. 4.25a we have a representation of the RCS of a metallic plate with the size 19 x 19 x
0.2 cm3. RCS is the measure of a target's ability to reflect radar signals in the direction of the radar
receiver. A flat metallic plate has almost no RCS except when it's aligned directly towards the radar
receiver. This is exactly what we observe in FIG. 4.25a.
FIG. 4.25b and 4.25c show the RCS for the metamaterial depending on polarization. In FIG.
4.25b we have the metamaterial results for vertical polarization. As seen from the numerical results,
the RCS reduction occurs after 8 GHz. We have multiple resonant frequencies and also side lobes at
normal and oblique incidence. For horizontal polarization, FIG. 4.25c, the RCS shows a resonant
frequency at 4.74 GHz.
a)
Frequency (GHz)
ph
i (d
eg
rees)
RCS Metallic plate 19 cm
Vertical polarization
2 4 6 8 10 12 14 16 18
-60
-50
-40
-30
-20
-10
0
10
20
30
40
50
60 -10
-8
-6
-4
-2
0
Frequency (GHz)
ph
i (d
eg
rees)
RCS Metallic plate 19 cm
Horizontal polarization
2 4 6 8 10 12 14 16 18
-60
-50
-40
-30
-20
-10
0
10
20
30
40
50
60 -10
-8
-6
-4
-2
0
dB
m2
dB
m2

140 CH. 4 OPTIMIZATION OF MICROWAVE ABSORBERS USING METAMATERIALS
b)
c)
FIG. 4.25 Radar cross section of a) A perfect electric conductor (metallic plate of 2 mm thickness),
b) Metamaterial for vertical polarization and c) Metamaterial for horizontal polarization
From the RCS we can extract the reflection coefficient of the metamaterial by dividing the
complex values of the Metamaterial RCS at all the angles of incidence by the complex RCS of the
metallic plate only at normal incidence. In FIG. 4.26 we have shown the results obtained at normal and
oblique incidence of the metamaterial for both polarizations. At vertical polarization, FIG. 4.26a, we
can see a more pronounced blue color meaning a lower reflection coefficient but a higher absorption.
The absorption is at high frequencies between 8 and 16 GHz. In FIG. 4.26b we have the reflection
coefficient of the metamaterial at vertical polarization. Here the metamaterial has only one important
resonant frequency that can clearly be seen by the more pronounced color blue at 4.74 GHz.
a)
b)
FIG. 4.26 Reflection coefficient of the metamaterial depending on the angle of incidence between -60o
- 60o and frequency for a) Vertical polarization and b) Horizontal polarization
Frequency (GHz)
ph
i (d
eg
rees)
RCS MM 19 cm
Vertical polarization
2 4 6 8 10 12 14 16 18
-60
-50
-40
-30
-20
-10
0
10
20
30
40
50
60 -10
-8
-6
-4
-2
0
Frequency (GHz)
ph
i (d
eg
rees)
RCS MM 19 cm
Horizontal polarization
2 4 6 8 10 12 14 16 18
-60
-50
-40
-30
-20
-10
0
10
20
30
40
50
60 -10
-8
-6
-4
-2
0
Frequency (GHz)
ph
i (d
eg
rees)
S11
MM 19 cm
Vertical polarization
2 4 6 8 10 12 14 16 18
-60
-50
-40
-30
-20
-10
0
10
20
30
40
50
60 -10
-8
-6
-4
-2
0
Frequency (GHz)
ph
i (d
eg
rees)
S11
MM 19 cm
Horizontal polarization
2 4 6 8 10 12 14 16 18
-60
-50
-40
-30
-20
-10
0
10
20
30
40
50
60 -10
-8
-6
-4
-2
0
dB
m2
dB
m2
dB
dB
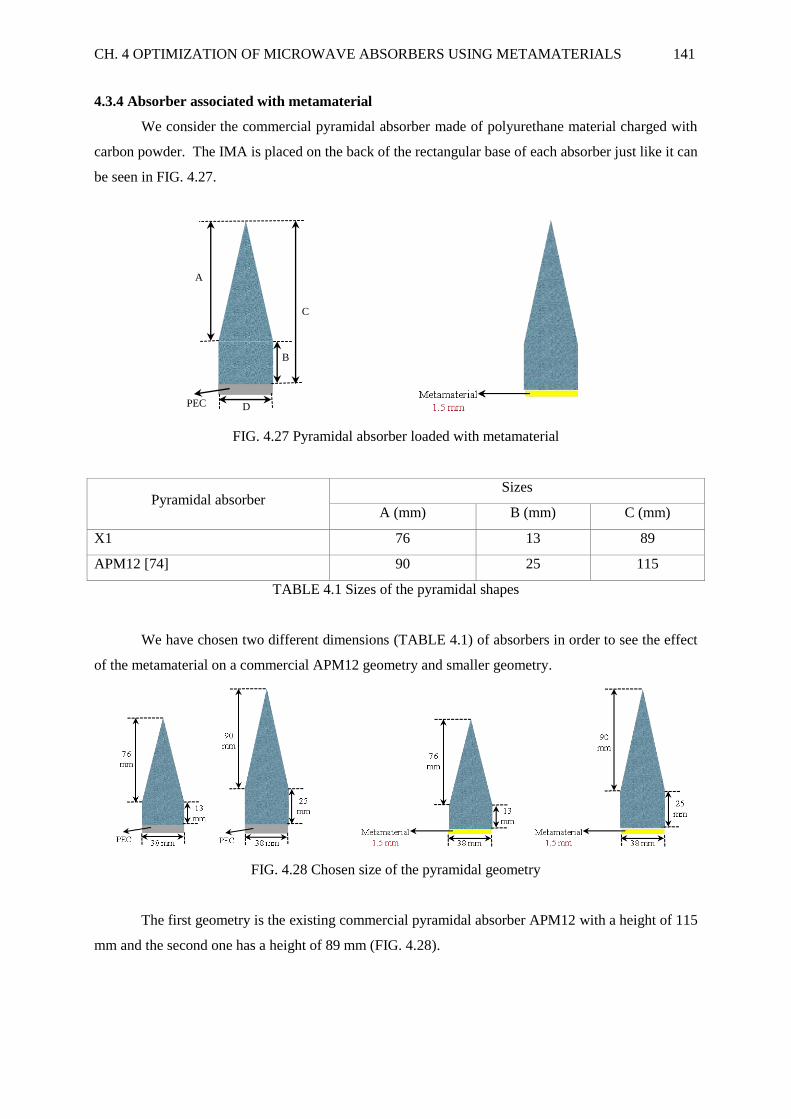
CH. 4 OPTIMIZATION OF MICROWAVE ABSORBERS USING METAMATERIALS 141
4.3.4 Absorber associated with metamaterial
We consider the commercial pyramidal absorber made of polyurethane material charged with
carbon powder. The IMA is placed on the back of the rectangular base of each absorber just like it can
be seen in FIG. 4.27.
FIG. 4.27 Pyramidal absorber loaded with metamaterial
Pyramidal absorber Sizes
A (mm) B (mm) C (mm)
X1 76 13 89
APM12 [74] 90 25 115
TABLE 4.1 Sizes of the pyramidal shapes
We have chosen two different dimensions (TABLE 4.1) of absorbers in order to see the effect
of the metamaterial on a commercial APM12 geometry and smaller geometry.
FIG. 4.28 Chosen size of the pyramidal geometry
The first geometry is the existing commercial pyramidal absorber APM12 with a height of 115
mm and the second one has a height of 89 mm (FIG. 4.28).
A
B
D PEC
C

142 CH. 4 OPTIMIZATION OF MICROWAVE ABSORBERS USING METAMATERIALS
FIG. 4.29 Skin depth and attenuation of the natural absorber G1
The contribution of the IMA is directly related to the absorber thickness. In fact, from the skin
depth of the commercial material G1, we can describe this lossy media in terms of Attenuation in
dB/cm (FIG. 4.29). This means that for thick materials the metamaterial will not have any effect over
the reflection coefficient.
In FIG. 4.30 we show the simulated and measured reflection coefficient for the first pyramidal
absorber APM12 with or without the IMA one where the electric field is parallel with the x-axis. We
observe that in the first case, we improve the absorption behavior between 8 and 15 GHz with a gain
up to 5 dB. These phenomena can be explained by the resonant frequencies of the overall
metamaterial. At oblique incidence and for this polarization there is no important gain.
a)
b)
FIG. 4.30 Measurement and simulation results at Vertical polarization for the pyramidal absorber
APM12 with IMA at a) Normal incidence and b) Oblique incidence (45o)
2 4 6 8 10 12 14 16 182
2.5
3
3.5
4
Frequency (GHz)
Skin
depth
(cm
)
2.4 2.6 2.8 3 3.2 3.4 3.6
-3.5
-3
-2.5
Skin depth (cm)
Att
enuation (
dB
/cm
)
2 4 6 8 10 12 14 16 18-70
-60
-50
-40
-30
-20
Frequency (GHz)
S11
(dB) - Normal incidence - Vertical polarization
Simulation - APM12 + MP
Simulation - APM12 + MM
2 4 6 8 10 12 14 16 18-70
-60
-50
-40
-30
-20
Frequency (GHz)
S11
(dB) - Normal incidence - Vertical polarization
Measurement - APM12 + MP
Measurement - APM12 + MM
2 4 6 8 10 12 14 16 18-70
-60
-50
-40
-30
-20
Frequency (GHz)
S11
(dB) - Oblique incidence (450) - Vertical polarization
Simulation - APM12 + MP
Simulation - APM12 + MM
2 4 6 8 10 12 14 16 18-70
-60
-50
-40
-30
-20
Frequency (GHz)
S11
(dB) - Oblique incidence (450) - Vertical polarization
Measurement - APM12 + MP
Measurement - APM12 + MM

CH. 4 OPTIMIZATION OF MICROWAVE ABSORBERS USING METAMATERIALS 143
In FIG. 4.31 we show the simulated and measured reflection coefficient for the first pyramidal
absorber APM12 with or without the IMA one where the electric field is parallel with the y-axis. We
observe that from 3 to 6 GHz we have a gain of maximum 15 dB for normal incidence. At oblique
incidence we have better absorption in the entire frequency range from 2 to 18 GHz.
a)
b)
FIG. 4.31 Measurement and simulation results at Horizontal polarization for the pyramidal absorber
APM12 with IMA at a) Normal incidence and b) Oblique incidence (45o)
a)
2 4 6 8 10 12 14 16 18-70
-60
-50
-40
-30
-20
Frequency (GHz)
S11
(dB) - Normal incidence - Horizontal polarization
Simulation - APM12 + MP
Simulation - APM12 + MM
2 4 6 8 10 12 14 16 18-70
-60
-50
-40
-30
-20
Frequency (GHz)
S11
(dB) - Normal incidence - Horizontal polarization
Measurement - APM12 + MP
Measurement - APM12 + MM
2 4 6 8 10 12 14 16 18-70
-60
-50
-40
-30
-20
Frequency (GHz)
S11
(dB) - Oblique incidence (450) - Horizontal polarization
Simulation - APM12 + MP
Simulation - APM12 + MM
2 4 6 8 10 12 14 16 18-70
-60
-50
-40
-30
-20
Frequency (GHz)
S11
(dB) - Oblique incidence (450) - Horizontal polarization
Measurement - APM12 + MP
Measurement - APM12 + MM
Frequency (GHz)
ph
i (d
eg
rees)
Simulation APM12
metallic plate
2 5 10 1518
20
30
40
50
60 -60
-50
-40
-30
-20
-10
0
10
Frequency (GHz)
ph
i (d
eg
rees)
Simulation APM12
Vertical polarization
2 5 10 1518
20
30
40
50
60 -60
-50
-40
-30
-20
-10
0
10
Frequency (GHz)
ph
i (d
eg
rees)
Simulation APM12
Horizontal polarization
2 5 10 1518
20
30
40
50
60 -60
-50
-40
-30
-20
-10
0
10
dB

144 CH. 4 OPTIMIZATION OF MICROWAVE ABSORBERS USING METAMATERIALS
b)
FIG. 4.32 a) Simulations and b) measurements at oblique incidence between 15o - 60
o for APM12 +
IMA
In FIG. 4.32a we have all the simulation results obtained using a metallic plate, the
metamaterial for vertical polarization and the metamaterial for horizontal polarization. In FIG. 4.32b
we have the measurement results obtained using the same configurations. We can see that in between
measurement and simulation there is a good acceptance if we compare the "pyramidal geometry +
metallic plate" with the "pyramid + metamaterial" we can see that we have a more pronounced blue
meaning a lower reflection coefficient.
Now, if we consider a pyramidal absorber X1 with a smaller thickness of 89 mm (TABLE 4.1)
compared with the first presented pyramidal geometry that had 115 mm this geometry is smaller by 26
mm.
a)
0
0
0
0
0
0
10
Frequency (GHz)
ph
i (d
eg
rees)
Measurement APM12
metallic plate
2 5 10 1518
20
30
40
50
60 -60
-50
-40
-30
-20
-10
0
10
Frequency (GHz)
ph
i (d
eg
rees)
Measurement APM12
Vertical polarization
2 5 10 1518
20
30
40
50
60 -60
-50
-40
-30
-20
-10
0
10
Frequency (GHz)
ph
i (d
eg
rees)
Measurement APM12
Horizontal polarization
2 5 10 1518
20
30
40
50
60 -60
-50
-40
-30
-20
-10
0
10
2 4 6 8 10 12 14 16 18-50
-40
-30
-20
-10
0
Frequency (GHz)
S11
(dB) - Normal incidence - Vertical polarization
Simulation - X1 + Metallic plate
Simulation - X1 + MM
2 4 6 8 10 12 14 16 18-50
-40
-30
-20
-10
0
Frequency (GHz)
S11
(dB) - Normal incidence - Vertical polarization
Measurement - X1 + Metallic plate
Measurement - X1 + MM
dB

CH. 4 OPTIMIZATION OF MICROWAVE ABSORBERS USING METAMATERIALS 145
b)
FIG. 4.33 Measurement and simulation results at Vertical polarization for the pyramidal absorber X1
with IMA at a) Normal incidence and b) Oblique incidence (45o)
Here, in FIG. 4.33, we have the results obtained in simulation and measurement for vertical
polarization at normal incidence and oblique incidence 45o. From these results we can see the
difference in between a geometry with metallic plate and a geometry with metamaterial. We have an
improvement of absorption between 8 and 15 GHz with a gain up to 20 dB at normal and oblique
incidence. Also we have a good accordance between measurement and simulation.
a)
b)
FIG. 4.34 Measurement and simulation results at Horizontal polarization for the pyramidal absorber
X1 with IMA at a) Normal incidence and b) Oblique incidence (45o)
Because the metamaterial has resonant frequencies for this polarization in between 4 and 6
GHz the gain using the pyramid will also be located in this range. We have a better absorption for the
geometry with metamaterial with a gain up to 15 dB as can be seen in FIG. 4.34.
2 4 6 8 10 12 14 16 18-50
-40
-30
-20
Frequency (GHz)
S11
(dB) - Oblique incidence (450) - Vertical polarization
Simulation - X1 + Metallic plate
Simulation - X1 + MM
2 4 6 8 10 12 14 16 18-50
-40
-30
-20
Frequency (GHz)
S11
(dB) - Oblique incidence (450) - Vertical polarization
Measurement - X1 + Metallic plate
Measurement - X1 + MM
2 4 6 8 10 12 14 16 18-50
-40
-30
-20
-10
0
Frequency (GHz)
S11
(dB) - Normal incidence - Horizontal polarization
Simulation - X1 + Metallic plate
Simulation - X1 + MM
2 4 6 8 10 12 14 16 18-50
-40
-30
-20
-10
0
Frequency (GHz)
S11
(dB) - Normal incidence - Horizontal polarization
Measurement - X1 + Metallic plate
Measurement - X1 + MM
2 4 6 8 10 12 14 16 18-50
-40
-30
-20
Frequency (GHz)
S11
(dB) - Oblique incidence (450) - Horizontal polarization
Simulation - X1 + Metallic plate
Simulation - X1 + MM
2 4 6 8 10 12 14 16 18-50
-40
-30
-20
Frequency (GHz)
S11
(dB) - Oblique incidence (450) - Horizontal polarization
Measurement - X1 + Metallic plate
Measurement - X1 + MM

146 CH. 4 OPTIMIZATION OF MICROWAVE ABSORBERS USING METAMATERIALS
a)
b)
FIG. 4.35 Measurements at oblique incidence between 15o - 60
o for X1 + IMA
In this case, we have also measured the reflection coefficient at oblique incidence in between
15o and 60
o and the results are represented in FIG. 4.35. We have a lot more blue for the pyramid with
metamaterial than for the pyramid with ground plane. We need to remember that the metamaterial has
a continuous cooper layer on the back meaning no transmission just like in the case of a metallic plate
usage.
To validate the results obtained in the anechoic chamber from INSA we have also done
measurements in the CHEOPS anechoic chamber from CELAR (DGA). Here we have obtained the
RCS and also the reflection coefficient of the pyramidal absorbers loaded with metamaterial. We are
going to show first the results obtained for the APM12 geometry. The RCS presented in FIG. 4.36 tells
us that the power reradiated from the APM12 pyramidal geometry with metamaterial at vertical
polarization is stronger at higher frequencies between 8 and 16 GHz. For horizontal polarization we
have a stronger RCS at lower frequencies in between 4 and 6 GHz.
Frequency (GHz)
ph
i (d
eg
rees)
Simulation X1
Metallic plate
2 5 10 1518
20
30
40
50
60
-40
-30
-20
-10
0
Frequency (GHz)p
hi (d
eg
rees)
Simulation X1
Vertical polarization
2 5 10 1518
20
30
40
50
60
-40
-30
-20
-10
0
Frequency (GHz)
ph
i (d
eg
rees)
Simulation X1
Horizontal polarization
2 5 10 1518
20
30
40
50
60
-40
-30
-20
-10
0
ph
i (d
eg
rees)
0
0
0
0
Frequency (GHz)
ph
i (d
eg
rees)
Measurement X1
Metallic plate
2 5 10 1518
20
30
40
50
60
-40
-30
-20
-10
0
Frequency (GHz)
ph
i (d
eg
rees)
Measurement X1
Vertical polarization
2 5 10 1518
20
30
40
50
60
-40
-30
-20
-10
0
Frequency (GHz)
ph
i (d
eg
rees)
Measurement X1
Horizontal polarization
2 5 10 1518
20
30
40
50
60
-40
-30
-20
-10
0
dB
dB

CH. 4 OPTIMIZATION OF MICROWAVE ABSORBERS USING METAMATERIALS 147
a)
b)
c)
FIG. 4.36 Radar cross section results obtained in the CHEOPS anechoic chamber from CELAR
(DGA) for a) Pyramidal geometry APM12, b) Pyramidal geometry APM12 with MM at Vertical
polarization and c) Pyramidal geometry APM12 with MM at Horizontal polarization
From the RCS we extract the reflection coefficient at normal and oblique incidence for the
pyramid APM12 with metamaterial. The results are represented in FIG. 4.37. Comparing the reflection
coefficient of the pyramidal geometry alone shown in FIG. 4.37a with the reflection coefficient of the
pyramidal geometry APM12 with metamaterial at Vertical polarization we can see that we have a
more pronounced blue color at high frequencies between 8 and 16 GHz for multiple angles of
incidence. For horizontal polarization the gain is located at specific frequencies such as it can be seen
in FIG. 4.37c where the color blue is more pronounced for multiple angles of incidence between 4 and
6 GHz.
In FIG. 4.37d and FIG. 4.37e we have represented the exact curves at normal incidence for the
"pyramidal geometry + metallic plate" and the "pyramidal geometry + metamaterial" at vertical and
horizontal polarization, respectively. We have a gain of maximum 5 dB depending on polarization and
frequency for the pyramidal geometry backed by metamaterial at normal incidence.
Frequency (GHz)
ph
i (d
eg
rees)
RCS Pyramid APM12 G1
Vertical polarization
2 4 6 8 10 12 14 16 18
-60
-50
-40
-30
-20
-10
0
10
20
30
40
50
60 -25
-20
-15
Frequency (GHz)
ph
i (d
eg
rees)
RCS Pyramid APM12 G1
Horizontal polarization
2 4 6 8 10 12 14 16 18
-60
-50
-40
-30
-20
-10
0
10
20
30
40
50
60 -25
-20
-15
Frequency (GHz)
ph
i (d
eg
rees)
RCS Pyramid APM12 G1 + MM
Vertical polarization
2 4 6 8 10 12 14 16 18
-60
-50
-40
-30
-20
-10
0
10
20
30
40
50
60 -25
-20
-15
Frequency (GHz)
ph
i (d
eg
rees)
RCS Pyramid APM12 G1 + MM
Horizontal polarization
2 4 6 8 10 12 14 16 18
-60
-50
-40
-30
-20
-10
0
10
20
30
40
50
60 -25
-20
-15
dB
m2
dB
m2
dB
m2
dB
m2

148 CH. 4 OPTIMIZATION OF MICROWAVE ABSORBERS USING METAMATERIALS
a)
b) c)
d)
e)
FIG. 4.37 Reflection coefficient of a) Pyramidal geometry APM12, b) Pyramidal geometry APM12
with metamaterial at Vertical polarization, c) Pyramidal geometry APM12 with metamaterial at
Horizontal polarization, d) Pyramidal geometry APM12 with metamaterial at Vertical polarization
(curve representation) and e) APM12 with metamaterial at Horizontal polarization (curve
representation)
Secondly, we have the results obtained for the X1 geometry. We have also shown in this case
the RCS and also the reflection coefficient. Because the X1 has a smaller thickness the gain can be
Frequency (GHz)
ph
i (d
eg
rees)
S11
Pyramid APM12 G1
Vertical polarization
2 4 6 8 10 12 14 16 18
-60
-50
-40
-30
-20
-10
0
10
20
30
40
50
60 -25
-20
-15
Frequency (GHz)
ph
i (d
eg
rees)
S11
Pyramid APM12 G1
Horizontal polarization
2 4 6 8 10 12 14 16 18
-60
-50
-40
-30
-20
-10
0
10
20
30
40
50
60 -25
-20
-15
Frequency (GHz)
ph
i (d
eg
rees)
S11
Pyramid APM12 G1 + MM
Vertical polarization
2 4 6 8 10 12 14 16 18
-60
-50
-40
-30
-20
-10
0
10
20
30
40
50
60 -25
-20
-15
Frequency (GHz)
ph
i (d
eg
rees)
S11
Pyramid APM12 G1 + MM
Horizontal polarization
2 4 6 8 10 12 14 16 18
-60
-50
-40
-30
-20
-10
0
10
20
30
40
50
60 -25
-20
-15
2 4 6 8 10 12 14 16 18-60
-40
-20
0
Frequency (GHz)
S11
(dB) - Normal incidence - Vertical polarization
Measurement CHEOPS - APM12 + Metallic plate
Measurement CHEOPS - APM12 + MM
2 4 6 8 10 12 14 16 18-60
-40
-20
0
Frequency (GHz)
S11
(dB) - Normal incidence - Horizontal polarization
Measurement CHEOPS - APM12 + Metallic plate
Measurement CHEOPS - APM12 + MM
dB
dB
dB
dB

CH. 4 OPTIMIZATION OF MICROWAVE ABSORBERS USING METAMATERIALS 149
seen more clearly. The RCS shown in FIG. 4.38 is more pronounced for the X1 with metamaterial at
vertical polarization between 8 and 16 GHz. For horizontal polarization, FIG. 4.38c, the power
reradiated in stronger in between 4 and 6 GHz.
a)
b)
c)
FIG. 4.38 Radar cross section results obtained in the CHEOPS anechoic chamber from CELAR
(DGA) for a) Pyramidal geometry X1, b) Pyramidal geometry X1 with MM at Vertical polarization
and c) Pyramidal geometry X1 with MM at Horizontal polarization
From the extracted reflection coefficient, FIG. 4.39, we can conclude that the pyramidal
geometry backed by the metamaterial at vertical polarization has the gain located between 8 and 16
GHz for a wide range of incidence angles and at horizontal polarization the gain is between 4 and 6
GHz.
Frequency (GHz)
ph
i (d
eg
rees)
RCS Pyramid X1 G1
Vertical polarization
2 4 6 8 10 12 14 16 18
-60
-50
-40
-30
-20
-10
0
10
20
30
40
50
60 -25
-20
-15
Frequency (GHz)
ph
i (d
eg
rees)
RCS Pyramid X1 G1
Horizontal polarization
2 4 6 8 10 12 14 16 18
-60
-50
-40
-30
-20
-10
0
10
20
30
40
50
60 -25
-20
-15
Frequency (GHz)
ph
i (d
eg
rees)
RCS Pyramid X1 G1 + MM
Vertical polarization
2 4 6 8 10 12 14 16 18
-60
-50
-40
-30
-20
-10
0
10
20
30
40
50
60 -25
-20
-15
Frequency (GHz)
ph
i (d
eg
rees)
RCS Pyramid X1 G1 + MM
Horizontal polarization
2 4 6 8 10 12 14 16 18
-60
-50
-40
-30
-20
-10
0
10
20
30
40
50
60 -25
-20
-15
dB
m2
dB
m2
dB
m2
dB
m2
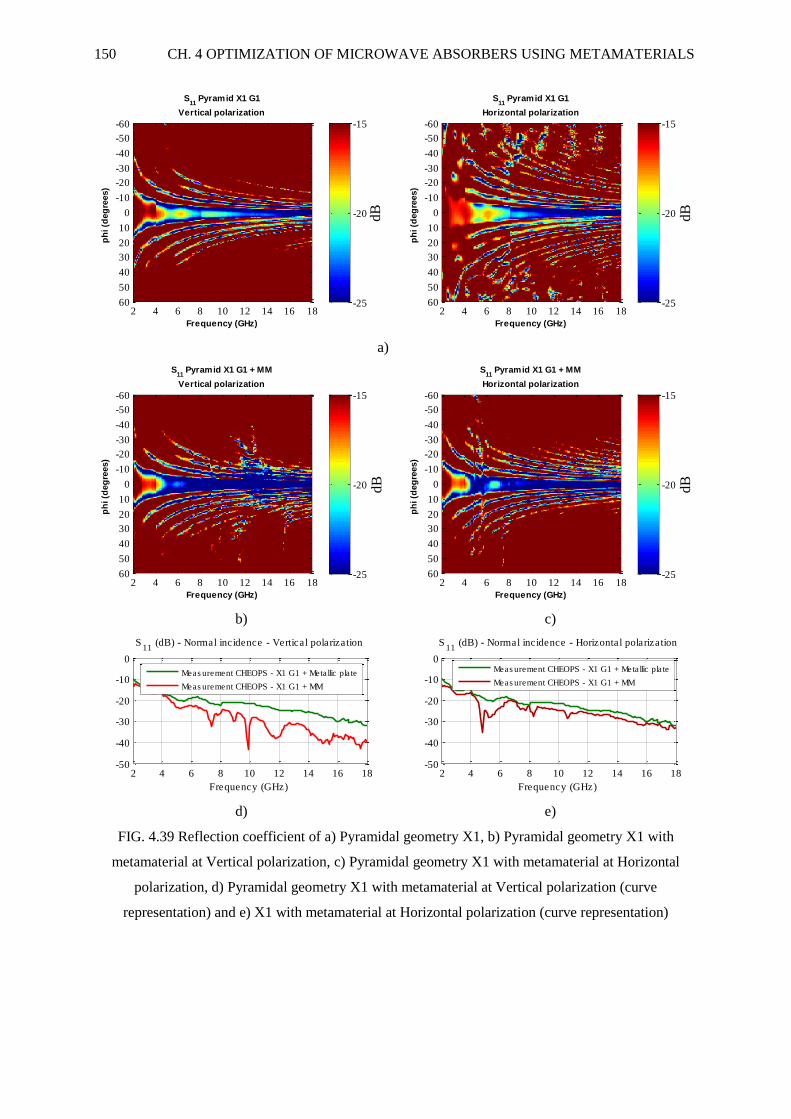
150 CH. 4 OPTIMIZATION OF MICROWAVE ABSORBERS USING METAMATERIALS
a)
b)
c)
d)
e)
FIG. 4.39 Reflection coefficient of a) Pyramidal geometry X1, b) Pyramidal geometry X1 with
metamaterial at Vertical polarization, c) Pyramidal geometry X1 with metamaterial at Horizontal
polarization, d) Pyramidal geometry X1 with metamaterial at Vertical polarization (curve
representation) and e) X1 with metamaterial at Horizontal polarization (curve representation)
Frequency (GHz)
ph
i (d
eg
rees)
S11
Pyramid X1 G1
Vertical polarization
2 4 6 8 10 12 14 16 18
-60
-50
-40
-30
-20
-10
0
10
20
30
40
50
60 -25
-20
-15
Frequency (GHz)
ph
i (d
eg
rees)
S11
Pyramid X1 G1
Horizontal polarization
2 4 6 8 10 12 14 16 18
-60
-50
-40
-30
-20
-10
0
10
20
30
40
50
60 -25
-20
-15
Frequency (GHz)
ph
i (d
eg
rees)
S11
Pyramid X1 G1 + MM
Vertical polarization
2 4 6 8 10 12 14 16 18
-60
-50
-40
-30
-20
-10
0
10
20
30
40
50
60 -25
-20
-15
Frequency (GHz)
ph
i (d
eg
rees)
S11
Pyramid X1 G1 + MM
Horizontal polarization
2 4 6 8 10 12 14 16 18
-60
-50
-40
-30
-20
-10
0
10
20
30
40
50
60 -25
-20
-15
2 4 6 8 10 12 14 16 18-50
-40
-30
-20
-10
0
Frequency (GHz)
S11
(dB) - Normal incidence - Vertical polarization
Measurement CHEOPS - X1 G1 + Metallic plate
Measurement CHEOPS - X1 G1 + MM
2 4 6 8 10 12 14 16 18-50
-40
-30
-20
-10
0
Frequency (GHz)
S11
(dB) - Normal incidence - Horizontal polarization
Measurement CHEOPS - X1 G1 + Metallic plate
Measurement CHEOPS - X1 G1 + MM
dB
dB
dB
dB

CH. 4 OPTIMIZATION OF MICROWAVE ABSORBERS USING METAMATERIALS 151
4.3.5 Symmetrical metamaterial
The metamaterial discussed above has a different behavior for each polarization because the
structure is not symmetrical. In the next part of the chapter a symmetrical metamaterial with thin
thickness and that works in a broadband capacity, between 2 and 18 GHz, will be proposed. We are
going to keep the design composed of a snake shaped structure and a spiral structure but the pattern
will be different. First, we present the unit cells separately and then we show what happens if the IMA
is placed on the back of a pyramidal absorber.
Name Size (mm) Name Size (mm) Name Size (mm)
M1 12.5 M7 0.4 M13 3.4
M2 12.3 M8 1.2 M14 5.5
M3 8.3 M9 6.7 M15 6.9
M4 7.1 M10 0.4 M16 1.3
M5 5.9 M11 0.1 M17 8.5
M6 6.3 M12 4.3 Substrate
thickness
1.5
TABLE. 4.2 Dimensions for the two cells
a)
b)
FIG. 4.40 The two resonators: Reflection coefficient versus frequency for vertical and horizontal
polarization for a) Symmetrical snake shape cell and b) Symmetrical spiral shape cell
2 4 6 8 10 12 14 16 18-25
-20
-15
-10
-5
0
Frequency (GHz)
S11
(dB) - Normal incidence
TE
TH
2 4 6 8 10 12 14 16 18-25
-20
-15
-10
-5
0
Frequency (GHz)
S11
(dB) - Normal incidence
TE
TH
x, H
x, E k
x, H
x, E k
M10
M11
M5 M8
M7
M1 M2
M3
M9
M4 M6
M12
mm
M7
M16
M13
M1
M15 M14
M10
M11
M17

152 CH. 4 OPTIMIZATION OF MICROWAVE ABSORBERS USING METAMATERIALS
The proposed snake shape metamaterial (FIG. 4.40a) has a broadband effect in between 9 - 13
GHz and we have some resonant frequencies below 10 GHz, at 4 GHz, 6.5 GHz, 8.5 GHz and 9.7
GHz. Also, the snake shape cell is symmetrical. The spiral metamaterial (FIG. 4.40b) has a large
bandwidth between 10 - 12 GHz and 15 - 17 GHz. The cells are used to obtain the final IMA that is
shown in FIG. 4.41. The achieved prototype is this IMA is shown in FIG. 4.41b.
FIG. 4.41 a) Interleaved metamaterial array and b) Prototype of the IMA
a)
b)
FIG. 4.42 Simulated and measured results for the final IMA at normal incidence depending on
polarization: a) Vertical polarization and b) Horizontal polarization
The proposed design has the same behavior as the original IMA presented in Chapter 4.3 for
vertical polarization. We have a broadband effect in between 9 and 16 GHz just like it can be observed
in FIG. 4.42a. For horizontal polarization (FIG. 4.42b), if the IMA presented in chapter 4.3 resonated
between 4 and 6 GHz this new pattern has resonant peaks at 3 GHz, 6.5 GHz and also a large
bandwidth in between 12 – 18 GHz. If for one polarization the results would not change from what we
obtained so far, for the other polarization we can increase the gain in a larger frequency band using
this new pattern.
2 4 6 8 10 12 14 16 18-40
-30
-20
-10
0
Frequency (GHz)
S11
(dB) - Normal incidence
Vertical polarization
Simulation
Measurement IETR
2 4 6 8 10 12 14 16 18-40
-30
-20
-10
0
Frequency (GHz)
S11
(dB) - Normal incidence
Horizontal polarization
Simulation
Measurement IETR
38
38 mm

CH. 4 OPTIMIZATION OF MICROWAVE ABSORBERS USING METAMATERIALS 153
In the next section we are going to show what happens if this new IMA is used in combination
with a classical pyramidal absorber. For this we have used CST Microwave Studio in Frequency
domain and Floquet theory. The pyramidal absorber used is X1 and was presented before in Chapter
4.3. In FIG. 4.43 the size of the absorber is presented.
FIG. 4.43 Chosen size of the pyramidal geometry
a)
b)
FIG. 4.44 Simulation and measurement results for the pyramidal absorber X1 with IMA for Vertical
polarization at a) normal incidence and b) oblique incidence (45o)
In FIG. 4.44a at normal incidence, for vertical polarization, the pyramidal absorber with
metamaterial shows a gain of 5 dB located in between 8 and 16 GHz.
2 4 6 8 10 12 14 16 18-50
-40
-30
-20
-10
Frequency (GHz)
S11
(dB) - Normal incidence - Vertical polarization
Simulation - X1 + MP
Simulation - X1 + MM
2 4 6 8 10 12 14 16 18-50
-40
-30
-20
-10
0
Frequency (GHz)
S11
(dB) - Normal incidence - Vertical polarization
Measurement- X1 + MP
Measurement - X1 + MM
2 4 6 8 10 12 14 16 18-50
-40
-30
-20
-10
Frequency (GHz)
S11
(dB) - Oblique incidence (450) - Vertical polarization
Simulation - X1 + MP
Simulation - X1 + MM
2 4 6 8 10 12 14 16 18-50
-40
-30
-20
-10
Frequency (GHz)
S11
(dB) - Oblique incidence (450) - Vertical polarization
Measurement - X1 + MP
Measurement - X1 + MM

154 CH. 4 OPTIMIZATION OF MICROWAVE ABSORBERS USING METAMATERIALS
a)
b)
FIG. 4.45 Simulation and measurement results for the pyramidal absorber X1 with IMA for Horizontal
polarization at a) normal incidence and b) oblique incidence (45o)
For horizontal polarization at normal incidence (FIG. 4.45a) we have a gain of 5 dB in
between 4 and 6 GHz and also between 11 and 18 GHz.
At oblique incidence (45o) for vertical and horizontal polarization we have a gain of maximum
5 dB depending on frequency (FIG.4.44b and FIG. 4.45b).
For a better absorption at low frequencies we need a two layer metamaterial. For this we have
used two metamaterials one over the other resulting in a final IMA with a thickness of 3.105 mm. In
FIG. 4.46 we show the results at normal incidence for a pyramidal absorber backed by a two layer
metamaterial. The top metamaterial layer has no continuous cooper layer on the back so that we can
have transmission through the sample.
For a 3.105 mm thickness IMA we have an important gain at lower frequencies between 2 and
10 GHz higher than 5 dB for vertical polarization at normal incidence (FIG. 4.46a).
2 4 6 8 10 12 14 16 18-50
-40
-30
-20
-10
Frequency (GHz)
S11
(dB) - Normal incidence - Horizontal polarization
Simulation - X1 + MP
Simulation - X1 + MM
2 4 6 8 10 12 14 16 18-50
-40
-30
-20
-10
0
Frequency (GHz)
S11
(dB) - Normal incidence - Horizontal polarization
Measurement- X1 + MP
Measurement - X1 + MM
2 4 6 8 10 12 14 16 18-50
-40
-30
-20
-10
Frequency (GHz)
S11
(dB) - Oblique incidence (450) - Horizontal polarization
Simulation - X1 + MP
Simulation - X1 + MM
2 4 6 8 10 12 14 16 18-50
-40
-30
-20
-10
Frequency (GHz)
S11
(dB) - Oblique incidence (450) - Horizontal polarization
Measurement - X1 + MP
Measurement - X1 + MM

CH. 4 OPTIMIZATION OF MICROWAVE ABSORBERS USING METAMATERIALS 155
a)
b)
FIG. 4.46 Simulation results for the pyramidal absorber X1 with 2 layers IMA for Vertical
polarization at a) Normal incidence and b) Oblique incidence (45o)
a)
2 4 6 8 10 12 14 16 18-50
-40
-30
-20
-10
Frequency (GHz)
S11
(dB) - Normal incidence - Vertical polarization
Simulation - X1 + MP
Simulation - X1 + MM double
2 4 6 8 10 12 14 16 18-50
-40
-30
-20
-10
Frequency (GHz)
S11
(dB) - Normal incidence - Vertical polarization
Measurement- X1 + MP
Measure. - X1 + MM double
2 4 6 8 10 12 14 16 18-50
-40
-30
-20
-10
Frequency (GHz)
S11
(dB) - Oblique incidence (450) - Vertical polarization
Simulation - X1 + MP
Simulation - X1 + MM double
2 4 6 8 10 12 14 16 18-50
-40
-30
-20
-10
Frequency (GHz)
S11
(dB) - Oblique incidence (450) - Vertical polarization
Measurement - X1 + MP
Measure. - X1 + MM double
2 4 6 8 10 12 14 16 18-50
-40
-30
-20
-10
Frequency (GHz)
S11
(dB) - Normal incidence - Horizontal polarization
Simulation - X1 + MP
Simulation - X1 + MM double
2 4 6 8 10 12 14 16 18-50
-40
-30
-20
-10
Frequency (GHz)
S11
(dB) - Normal incidence - Horizontal polarization
Measurement- X1 + MP
Measure. - X1 + MM double

156 CH. 4 OPTIMIZATION OF MICROWAVE ABSORBERS USING METAMATERIALS
b)
FIG. 4.47 Simulation results for the pyramidal absorber X1 with 2 layers IMA for Horizontal
polarization at a) Normal incidence and b) Oblique incidence (45o)
If the original metamaterial presented in Chapter 4.32 had only gain at lower frequencies
between 4 and 6 GHz, this 2 layer IMA shows a better absorption not only between 2 and 6 GHz but
also between 8 and 18 GHz of 7 dB for horizontal polarization (FIG. 4.47a).
At oblique incidence (FIG. 4.46b and FIG. 4.47b) we have a gain of 5 dB for vertical and
horizontal polarization in the entire frequency band from 2 to 18 GHz.
After analyzing the double layer metamaterial for the same orientation of the top design
metallization as the bottom design metallization we have conducted a study for when we rotate the top
layer by 900. In this case the design becomes the one described in FIG. 4.48.
a)
2 4 6 8 10 12 14 16 18-50
-40
-30
-20
-10
Frequency (GHz)
S11
(dB) - Oblique incidence (450) - Horizontal polarization
Simulation - X1 + MP
Simulation - X1 + MM double
2 4 6 8 10 12 14 16 18-50
-40
-30
-20
-10
Frequency (GHz)
S11
(dB) - Oblique incidence (450) - Horizontal polarization
Measurement - X1 + MP
Measure. - X1 + MM double
2 4 6 8 10 12 14 16 18-50
-40
-30
-20
-10
Frequency (GHz)
S11
(dB) - Normal incidence - Vertical polarization
Simulation - X1 + MP
Simulation - X1 + MM double rotated
2 4 6 8 10 12 14 16 18-50
-40
-30
-20
-10
Frequency (GHz)
S11
(dB) - Normal incidence - Vertical polarization
Measure. - X1 + MP
Measure. - X1 + MM double rotated
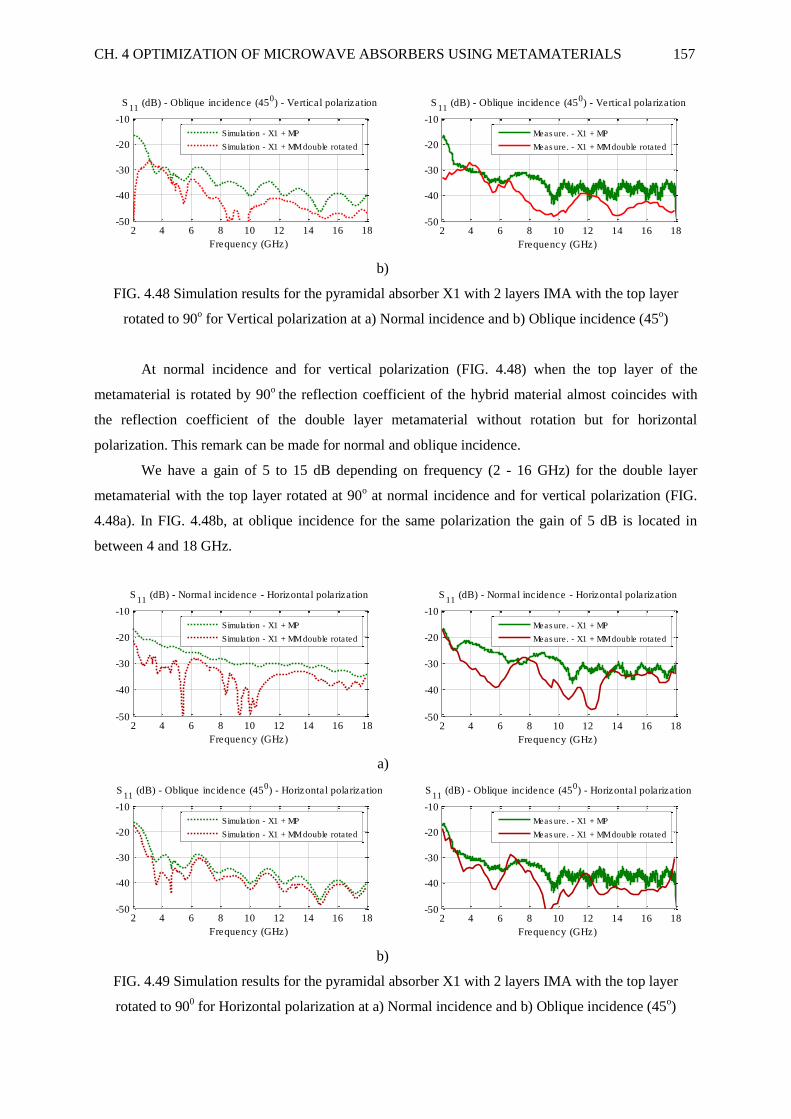
CH. 4 OPTIMIZATION OF MICROWAVE ABSORBERS USING METAMATERIALS 157
b)
FIG. 4.48 Simulation results for the pyramidal absorber X1 with 2 layers IMA with the top layer
rotated to 90o for Vertical polarization at a) Normal incidence and b) Oblique incidence (45
o)
At normal incidence and for vertical polarization (FIG. 4.48) when the top layer of the
metamaterial is rotated by 90o
the reflection coefficient of the hybrid material almost coincides with
the reflection coefficient of the double layer metamaterial without rotation but for horizontal
polarization. This remark can be made for normal and oblique incidence.
We have a gain of 5 to 15 dB depending on frequency (2 - 16 GHz) for the double layer
metamaterial with the top layer rotated at 90o at normal incidence and for vertical polarization (FIG.
4.48a). In FIG. 4.48b, at oblique incidence for the same polarization the gain of 5 dB is located in
between 4 and 18 GHz.
a)
b)
FIG. 4.49 Simulation results for the pyramidal absorber X1 with 2 layers IMA with the top layer
rotated to 900 for Horizontal polarization at a) Normal incidence and b) Oblique incidence (45
o)
2 4 6 8 10 12 14 16 18-50
-40
-30
-20
-10
Frequency (GHz)
S11
(dB) - Oblique incidence (450) - Vertical polarization
Simulation - X1 + MP
Simulation - X1 + MM double rotated
2 4 6 8 10 12 14 16 18-50
-40
-30
-20
-10
Frequency (GHz)
S11
(dB) - Oblique incidence (450) - Vertical polarization
Measure. - X1 + MP
Measure. - X1 + MM double rotated
2 4 6 8 10 12 14 16 18-50
-40
-30
-20
-10
Frequency (GHz)
S11
(dB) - Normal incidence - Horizontal polarization
Simulation - X1 + MP
Simulation - X1 + MM double rotated
2 4 6 8 10 12 14 16 18-50
-40
-30
-20
-10
Frequency (GHz)
S11
(dB) - Normal incidence - Horizontal polarization
Measure. - X1 + MP
Measure. - X1 + MM double rotated
2 4 6 8 10 12 14 16 18-50
-40
-30
-20
-10
Frequency (GHz)
S11
(dB) - Oblique incidence (450) - Horizontal polarization
Simulation - X1 + MP
Simulation - X1 + MM double rotated
2 4 6 8 10 12 14 16 18-50
-40
-30
-20
-10
Frequency (GHz)
S11
(dB) - Oblique incidence (450) - Horizontal polarization
Measure. - X1 + MP
Measure. - X1 + MM double rotated

158 CH. 4 OPTIMIZATION OF MICROWAVE ABSORBERS USING METAMATERIALS
Now, we are analyzing the metamaterial for horizontal polarization (FIG. 4.49). In this case,
the results coincide with the ones obtained for vertical polarization but when the top layer of the
metamaterial wasn't rotated. We have significant gain of 5 to 15 dB in between 2 and 16 GHz at
normal incidence (FIG. 4.49a). For an angle of incidence of 45o the gain is smaller but it can still be
observed in comparison with the natural absorber backed by a metallic plate (FIG. 4.49b).
In conclusion, we have proposed a new type of metamaterial that is symmetrical: it has thin
thickness and works in a broadband capacity between 2 and 18 GHz.
4.4 Broadband metamaterial
In this section, we aim to show the possibility to broaden the bandwidth of a metamaterial
with a compact size. For this, we propose to optimize the metamaterial geometry deduced from [117]
where we have a small pyramidal multilayer substrates separated by cooper layers. From FIG. 4.50 we
can deduce that the metamaterial has a perfect absorption coefficient between 8 and 14 GHz at normal
and oblique incidence [117]. The sizes of the metamaterial presented in [117] are: Wt=4 or 5 mm, T= 5
mm, W1=9 mm, P=11 mm, tm= 0.05 mm and td=0.2 mm. The substrate used is FR4. The top of the
pyramidal metamaterial can be 4 or 5 mm. If it's 4 mm, then we have total absorption in between 8 and
18 GHz and if it's 5 mm then we have total absorption in between 8 and 14 GHz.
FIG. 4.50 Simulation results for the broadband polarization independent metamaterial
Our objective is to increase the bandwidth of the metamaterial presented above and then use it
in combination with a natural pyramidal absorber. A first study that we have done is to optimize the
metamaterial so that we can have perfect absorption in a larger frequency band. For this we have used
0.5 2 4 6 8 10 12 14 16 18-50
-40
-30
-20
-10
0
Frequency (GHz)
S11 (
dB
)
Broadband metamaterial
Tip 4 mm
Tip 5mm
0.5 2 4 6 8 10 12 14 16 180
0.2
0.4
0.6
0.8
1
Frequency (GHz)
Ab
so
rpti
on
Broadband metamaterial
Tip 4 mm
Tip 5mm

CH. 4 OPTIMIZATION OF MICROWAVE ABSORBERS USING METAMATERIALS 159
the natural absorber provided by Siepel G1, the characteristic presented in FIG. 4.29 and placed it in
between the pyramidal metamaterials where originally we had air, as can be seen in FIG. 4.51.
FIG 4.51 Natural absorber placement on the broadband metamaterial
We have done simulations using CST Microwave studio and we can see in FIG. 4.52 where
the black curve represents the metamaterial alone just like it was presented in the paper [117], in red
we have the metamaterial with the natural absorber G1 (FIG. 4.51) and in blue we have only the
natural absorber G1 with the same thickness of 5 mm like the metamaterial. If the metamaterial alone
has a perfect absorption after 8 GHz, the metamaterial surround by the natural absorber G1 has a
perfect absorption after 5 GHz meaning an increases in bandwidth of 3 GHz.
FIG. 4.52 Simulation results for the optimized metamaterial
After optimizing the metamaterial alone we can optimize a pyramidal absorber. Our goal is to
increase the absorption of a natural absorber, in this case APM 12 (Chapter 3). We've conducted two
studies: one where the metamaterial is placed after the pyramidal base and another one where the
metamaterial is placed inside the base of the pyramidal absorber like can be seen in FIG. 4.53.
0.5 2 4 6 8 10 12 14 16 18-40
-30
-20
-10
0
Frequency (GHz)
S11 (
dB
)
Broadband metamaterial
Flat surface G1
Metamaterial alone
Metamaterial surrounded by G1
PEC G1 Broadband
metamaterial

160 CH. 4 OPTIMIZATION OF MICROWAVE ABSORBERS USING METAMATERIALS
a)
b)
FIG 4.53 Simulation results for the pyramid APM12 in combination with the broadband metamaterial
placed: a) under the pyramidal base and b) inside the pyramidal base
From FIG 4.53a we can deduce that because the metamaterial alone has a perfect absorption in
between 8 and 18 GHz, then the gain using the pyramidal geometry will also be located in the same
frequency band. This is why we have a lower reflection coefficient by -10 dB in between 8 and 18
GHz. But if we place the metamaterial inside the base of the pyramidal absorber then looking at the
results in FIG 4.52 we can see that the broadband effect is in between 5 and 18 GHz so by using the
pyramidal geometry we should see an improvement over the reflection coefficient starting at 5 GHz
which is exactly what can be observed in FIG. 4.53b. If we place the metamaterial inside the base of
the pyramidal absorber without adding anymore material then the frequency band where the reflection
coefficient is lower is increased by 3 GHz. We've also run simulations at oblique incidence and seen
that for 45o and 60
o there is no improvement over the reflection coefficient of the pyramidal geometry
alone (FIG. 4.54).
0.5 2 4 6 8 10 12 14 16 18-80
-60
-40
-20
0
Frequency (GHz)
S11 (
dB
)
Normal incidence
Pyramid APM12 - G1
Pyramid APM12 - G1 + MM under base
0.5 2 4 6 8 10 12 14 16 18-80
-60
-40
-20
0
Frequency (GHz)
S11 (
dB
)
Normal incidence
Pyramid APM12 - G1
Pyramid APM12 - G1 + MM inside base

CH. 4 OPTIMIZATION OF MICROWAVE ABSORBERS USING METAMATERIALS 161
FIG. 4.54 Simulation results at oblique incidence using the metamaterial inside the pyramidal base of
APM12
Our next step is to improve the performance of the metamaterial at lower frequencies starting
at 0.5 GHz. For this we have to optimize each layer of the multilayer pyramidal metamaterial. Another
obstacle is to use a thickness for the substrate that is standard and also to have a maximum length of
one pyramidal metamaterial of 38 mm which corresponds to the commercial pyramidal absorber
APM12. We optimize each pyramid independently so that we can have the same performance for both
polarizations. In this case we use a 0.8 mm FR4 substrate. We've used a genetic algorithm in CST
Microwave Studio to optimize the length of the substrate and the cooper layer of the last layer of the
broadband metamaterial. The optimized metamaterial is presented in FIG. 4.55.
FIG. 4.55 Simulation results at normal and oblique incidence for the optimized bottom layer of the
metamaterial
0.5 2 4 6 8 10 12 14 16 18-80
-60
-40
-20
0
Frequency (GHz)
S11 (
dB
)
Oblique incidence (300)
Pyramid APM12 - G1
Pyramid APM12 - G1 + MM inside base
0.5 2 4 6 8 10 12 14 16 18-80
-60
-40
-20
0
Frequency (GHz)
S11 (
dB
)
Oblique incidence (450)
Pyramid APM12 - G1
Pyramid APM12 - G1 + MM inside base
0.5 2 4 6 8 10 12 14 16 18-60
-40
-20
0
Frequency (GHz)
S11 (
dB
)
Oblique incidence (600)
Pyramid APM12 - G1
Pyramid APM12 - G1 + MM inside base
1.5 1.6 1.7 1.8 1.9 2
-40
-30
-20
-10
0
Frequency (GHz)
S11 (
dB
)
S11
(dB)
Normal incidence
Oblique incidence (300)
Oblique incidence (450)
Oblique incidence (600)
38 mm
37 mm

162 CH. 4 OPTIMIZATION OF MICROWAVE ABSORBERS USING METAMATERIALS
The optimized bottom layer of the metamaterial has a length of 38 mm, the thickness of the
substrate is 0.8 mm and the top cooper layer has a length of 37 mm. This metamaterial resonates at 1.9
GHz. We've added 28 more layers on top of this. Also with each layer the length of the structure
decreases with 1 mm. The thickness of the cooper layer is 17 m. After optimizing we have the first
resonant frequency at 1.9 GHz. Having 29 layers and each substrate layer has a thickness of 0.8 mm
means that we have a total thickness for the metamaterial of 23.71 mm (0.8*29 layers +0.017*30
layers). We can see the final broadband metamaterial and simulation results of the optimized
metamaterial in FIG 4.56.
FIG. 4.56 Simulation results for the optimized metamaterial that has resonant frequencies from 1.9
GHz
After, we have optimized the metamaterial so we can use it in combination with a natural
pyramidal absorber, here APM12 (presented in Chapter 3).
0.5 2 4 6 8 10-60
-50
-40
-30
-20
-10
0
Frequency (GHz)
S11 (
dB
)
S11
(dB)
Normal incidence
Oblique incidence (300)
Oblique incidence (450)
Oblique incidence (600)
0.5 2 4 6 8-60
-40
-20
0
Frequency (GHz)
S11 (
dB
)
Normal incidence
Pyramid APM12 - G1
Pyramid APM12 - G1 + MM Optimized
0.5 2 4 6 8-60
-40
-20
0
Frequency (GHz)
S11 (
dB
)
Oblique incidence (300)
Pyramid APM12 - G1
Pyramid APM12 - G1 + MM Optimized
38 mm 9 mm
23.71 mm
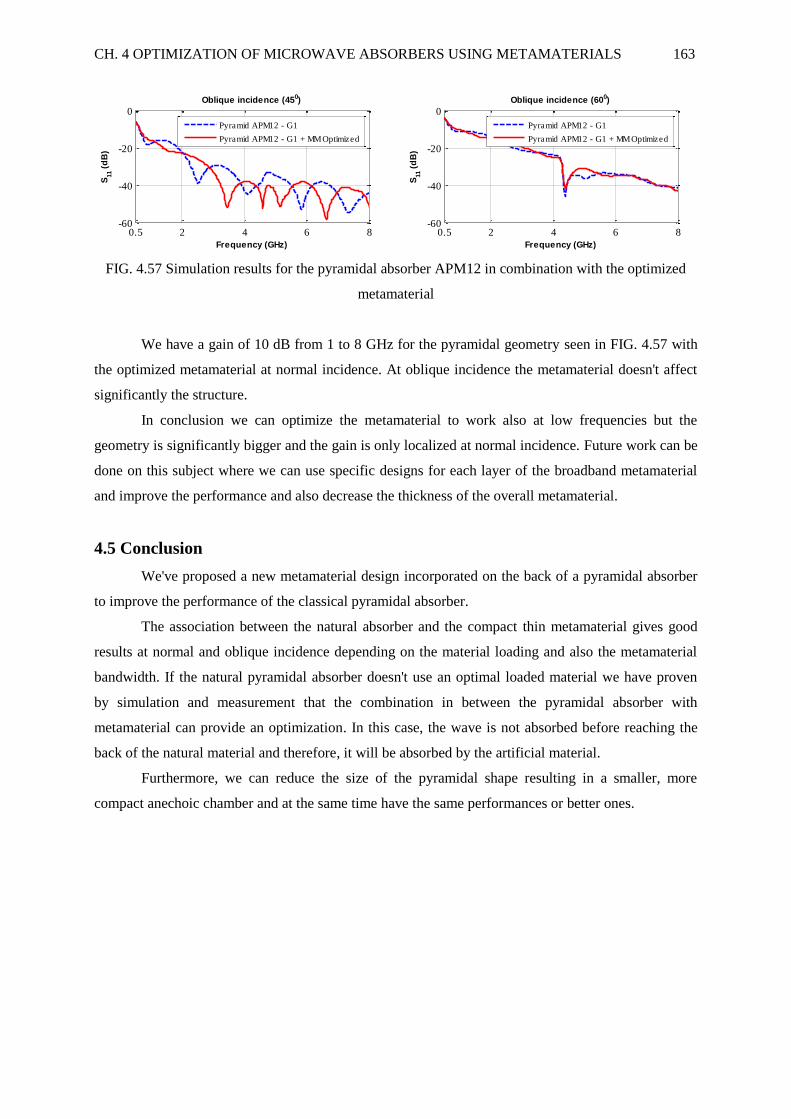
CH. 4 OPTIMIZATION OF MICROWAVE ABSORBERS USING METAMATERIALS 163
FIG. 4.57 Simulation results for the pyramidal absorber APM12 in combination with the optimized
metamaterial
We have a gain of 10 dB from 1 to 8 GHz for the pyramidal geometry seen in FIG. 4.57 with
the optimized metamaterial at normal incidence. At oblique incidence the metamaterial doesn't affect
significantly the structure.
In conclusion we can optimize the metamaterial to work also at low frequencies but the
geometry is significantly bigger and the gain is only localized at normal incidence. Future work can be
done on this subject where we can use specific designs for each layer of the broadband metamaterial
and improve the performance and also decrease the thickness of the overall metamaterial.
4.5 Conclusion
We've proposed a new metamaterial design incorporated on the back of a pyramidal absorber
to improve the performance of the classical pyramidal absorber.
The association between the natural absorber and the compact thin metamaterial gives good
results at normal and oblique incidence depending on the material loading and also the metamaterial
bandwidth. If the natural pyramidal absorber doesn't use an optimal loaded material we have proven
by simulation and measurement that the combination in between the pyramidal absorber with
metamaterial can provide an optimization. In this case, the wave is not absorbed before reaching the
back of the natural material and therefore, it will be absorbed by the artificial material.
Furthermore, we can reduce the size of the pyramidal shape resulting in a smaller, more
compact anechoic chamber and at the same time have the same performances or better ones.
0.5 2 4 6 8-60
-40
-20
0
Frequency (GHz)
S11 (
dB
)Oblique incidence (450)
Pyramid APM12 - G1
Pyramid APM12 - G1 + MM Optimized
0.5 2 4 6 8-60
-40
-20
0
Frequency (GHz)
S11 (
dB
)
Oblique incidence (600)
Pyramid APM12 - G1
Pyramid APM12 - G1 + MM Optimized

164 CH. 4 OPTIMIZATION OF MICROWAVE ABSORBERS USING METAMATERIALS

165
General conclusion
The work presented in this manuscript deals with the optimization of the performance of the
pyramidal absorbers used in anechoic chambers.
Different solutions are presented and tested in order to obtain good performances at low and
high frequencies. We have seen the potentiality of using a new absorber material based on carbon
fibers loaded epoxy foam, optimized absorber shapes (wedge, pyramid and hexagon) and combined
natural with artificial absorbers. An innovative characterization technique has been also proposed.
The characterizations in free space often require an environment without disruption, as an
anechoic chamber, to extract the properties of the measured material. Here, a technique of
measurement in a "normal" and non-anechoic environment has been proposed. This technique requires
the measurement of the reflection coefficient at different distances sample/antennas. Measurements
with and without metallic plate are required to extract the dielectric properties of the material, using
the ”de-embedding” method. Three materials were used to validate this new technique, with three
commercial materials (Teflon, absorbent ECCOSORB LS22 and Epoxy foam loaded with 0.25% wt.
carbon fibers). Results showed a good extraction of the permittivity for different materials. Extracted
losses show a high uncertainty, especially for low-loss materials, but an improvement of the extraction
method can be considered to overcome this.
Two types of absorbents are used in anechoic chambers: ferrites plates for the absorption of
waves at low frequencies below 1 GHz and pyramidal absorbers for the absorption at frequencies
higher than 1 GHz. The latter are often based on polyurethane foam loaded with carbon particles. They
have different advantages such as a strong absorption rate in a broad frequency range, a low weight,
simplifying their installation in anechoic rooms, and also a low cost. But they have some
disadvantages such as an inhomogeneity composition, mainly due to their elaboration method, which
consists of impregnation of the foams in a carbon solution. Another disadvantage is their flexibility,
which makes them non-reproducible in machining and especially, doesn’t allow the fabrication of
complex shapes which are needed to further enhance the absorption performance. In this thesis, we've
tried to address these drawbacks by proposing several optimization solutions.
The first proposed solution was the use of a novel composition to bypass the polyurethane
foam flexibility problem. For this, a new rigid and absorbent composite was used. This material was
designed in the Matériaux Fonctionnels team of IETR located in St-Brieuc. It is based on the epoxy
resin, which brings a better mechanical rigidity, shaped as foams, to bring a light weight and better
impedance adaptation at air/material interface.
The epoxy foam matrix was combined with long carbon fibers (3 mm length) to ensure the
absorption property. This charge has the advantage of providing a higher absorption performance for
low load rates compared to carbon particles. Different compositions of the new material (carbon fibers

166 GENERAL CONCLUSION
rate from 0.25% wt. to 1 % wt.) have been characterized using the anechoic chamber method. The
dielectric characteristics (permittivity and dielectric losses) were then extracted.
In order to estimate the absorption performance of the composites, their dielectric
characteristics were used for the simulation of pyramidal absorbers having the same geometry as a
commercial one often used in anechoic chamber. The simulations highlighted an optimum
composition of 0.5% wt. carbon fiber load. These results are very promising for an application as
electromagnetic pyramidal absorber. The characterization of the achieved prototype with the optimum
composition confirmed the simulation results. Indeed, comparing this prototype to the APM12
commercial one (from Siepel and with same geometry) showed an increment of the reflection
coefficient in the case of the epoxy prototype. This promising result, associated to the optimization
under test of this composite, encourages the consideration of this newly developed material to replace
materials currently used in anechoic chamber.
Another way of optimization has been tested. As the epoxy foam does not have a machining
limit, thanks to its better mechanical properties than those of the polyurethane foam, an optimization
of the absorber shapes (wedge, pyramid and hexagon) has been performed. More complex forms are
proposed. A second prototype, exhibiting one of the novel proposed geometries was achieved using
the optimum composition of the carbon fibers loaded epoxy foam composite. The characterization of
the second absorber prototype confirmed the simulation results showing a significant improvement
compared to the first achieved pyramidal prototype. These very promising results, associated with an
optimization of the loaded epoxy composite will envisage producing much more complex shapes in
order to improve the absorption performance. Reduced dimensions may be also considered, in order to
reach a more compact anechoic chamber and keep, if possible, its absorption property close to the one
of the polyurethane absorbers.
In parallel with the previous studies, another optimization solution has been proposed. It is
based on the combination of natural pyramidal absorbers to artificial metamaterials to constitute
hybrid absorbers. Usually, metamaterials usually suffer from high losses and this disadvantage has
been beneficially used in recent studies to employ them as absorbers. In this thesis, we proposed to
associate metamaterials to natural pyramidal absorbers. Simulation and characterization of the
achieved prototypes led us to conclude that this type of metamaterial can bring improvement if the
natural absorber is not optimum, i.e. has a lower amount of load than the optimized commercial
materials. In this case, the metamaterial, placed at the back of the pyramidal absorber, can provide an
optimization since a part of the wave is not absorbed by the pyramid and will therefore be absorbed by
the metamaterial.

GENERAL CONCLUSION 167
Perspectives
The perspectives regarding this subject are limitless and they are presented in this manuscript
depending on the application. We have detailed only the perspectives that can improve the results
presented here.
Regarding the characterization of materials the non-anechoic environment method can be
improved by developing a way to determine the losses for low loss materials.
For future work, regarding the materials used in anechoic chambers, other materials (other
composition than the epoxy) that are rigid, have very good mechanical properties, can be
manufactured easily, can be mixed using different loadings, are homogeneous and have a low
reflectivity and high tangent delta (especially at low frequencies) can be proposed.
In order to design new shapes to replace the pyramidal absorbers in anechoic chambers we can
focus in future work on the oblique incidence results and create more complicated geometries using
proposed materials that have very good mechanical properties.
A commercial pyramidal geometry can be optimized by using Genetic Algorithm and also a
new type of technique can be implemented where the optimization is not done only by cutting the
geometry vertically or horizontally but where the optimization is done at normal and oblique incidence
simultaneously or an optimization where the material characteristic and the geometry are optimized at
the same time. We have a lot of possibilities for optimizing the absorber shapes used in anechoic
chambers. For each solution, a deep study should be done to get the optimized shape with the
optimized loading.
For metamaterial we can develop an IMA that is symmetrical, has ultra-thin thickness and
works in a broadband capacity, especially at lower frequencies than 2 GHz. Also, we can make hybrid
materials using other geometries than pyramid.

168 GENERAL CONCLUSION

169
Annexes
A. Electromagnetic wave propagation in lossy multilayer structures
In order to obtain the reflection and transmission coefficient from the material characteristic
we need to simulate or create a program that can give us the result that we need.
Here we are explaining how we can obtain these coefficients without using a simulation
program like CST Microwave Studio, just Matlab. The calculus has been done for an infinite structure
and can be used for lossless and lossy mediums. In the first part we are focusing on the equations at
normal incidence and then we explain the process at oblique incidence.
Considering that the electric field has the amplitude E0 we can write the incidence, electric and
transmitted components as [24]:
FIG. A.1 Orientation of the electric field
(A.1)
(A.2)
(A.3)
where and are the elementary reflection and transmission coefficients at the surface of
the material.
These coefficients can be determined by applying the boundary conditions:
(A.4)
(A.5)
Hr H
i
Ei
Er
MUT
R
y
x

170 ANNEXES
A.1 Reflection coefficient for a single dielectric slab
Now, knowing these formulas we can determine what the reflection coefficient for a single
dielectric slab is alone or backed by a metallic plate [138]:
FIG. A.2 Single dielectric slab
(A.6)
(A.7)
Where:
(A.8)
(A.9)
(A.10)
(A.11)
(A.12) (A.13)
Mat
eria
l
d
Air
a=1
Air
a=1
Z1
S11
Z2
S22
1 , k1
2, T2
E
1, T1

ANNEXES 171
If the material is backed by a metallic plate then we do not have transmission and the
impedance at the back of the material becomes 0.
FIG. A.3 Single dielectric slab backed by a metallic plate
(A.14)
(A.15)
Where:
(A.16)
(A.17)
(A.18)
(A.19)
1, T1
2, T2
Air
a=1
PEC
b=0
d Z1
S11
Z2
S22
1 , k1
E
Mat
eria
l

172 ANNEXES
A.2 Reflection coefficient for two dielectric slabs
If we have two dielectric slabs we can determine the reflection coefficient this way:
FIG. A.4 Two dielectric slabs
(A.20)
Where:
(A.21)
(A.22)
(A.23)
(A.24)
(A.25)
(A.26)
(A.27)
is used when the double layer structure is backed by a metallic plate and in this case
and we do not have transmission.
1, T1
2, T2
Air
a=1
d1 Z1
S11
Z2
S22
1 , k1
E
Mat
eria
l 1
Air / PEC
a=1 / b=0
2, k2
Mat
eria
l 2
Z3
S33
3, T3
d2

ANNEXES 173
A.3 Infinite number of layers
We can consider an infinite number of layers and in this case the reflection coefficient
becomes:
FIG A.5 Infinite number of dielectric slabs
(A.28)
Where:
(A.29)
(A.30)
(A.31)
1, T1
2, T2
Air
a=1
d1 Z1
S11
Z2
S22
1 , k1
E M
ater
ial
1
Air / PEC
a=1 / b=0
2, k2
Mat
eria
l 2
Z3
S33
3, T3
d2

174 ANNEXES
A.4 Reflection and transmission coefficients for propagation at oblique incidence
We can determinate the reflection and transmission coefficient of a single dielectric slab by
introducing the Fresnel reflection coefficients. In this case we have two possibilities: perpendicular
(horizontal or E) polarization and parallel (vertical or H) polarization [24].
FIG A.6 Propagation at oblique incidence
For perpendicular polarization we have:
(A.32)
(A.33)
For parallel polarization we have:
(A.34)
(A.35)
i
ε1, μ1
ε2, μ2
r t
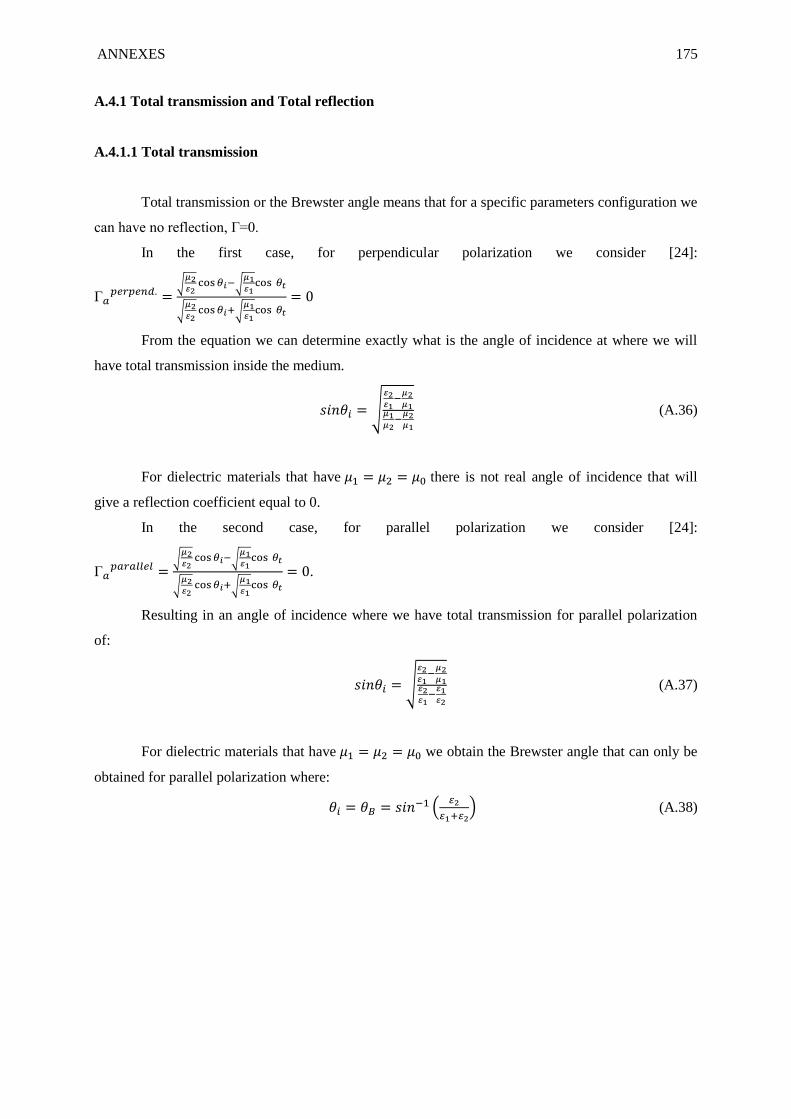
ANNEXES 175
A.4.1 Total transmission and Total reflection
A.4.1.1 Total transmission
Total transmission or the Brewster angle means that for a specific parameters configuration we
can have no reflection, =0.
In the first case, for perpendicular polarization we consider [24]:
From the equation we can determine exactly what is the angle of incidence at where we will
have total transmission inside the medium.
(A.36)
For dielectric materials that have there is not real angle of incidence that will
give a reflection coefficient equal to 0.
In the second case, for parallel polarization we consider [24]:
.
Resulting in an angle of incidence where we have total transmission for parallel polarization
of:
(A.37)
For dielectric materials that have we obtain the Brewster angle that can only be
obtained for parallel polarization where: (A.38)

176 ANNEXES
A.4.1.2 Total reflection
Total reflection or critical angle is the same for both polarizations. In order to obtain total
reflection we need to consider the case where so:
The critical angle becomes: (A.39)
If we have a dielectric material where the critical angle is: .
Using the procedures described here we can determine without a simulation program like CST
Microwave Studio the reflection and transmission coefficients for material slabs using only Matlab.
We have used these formulas to determine the reflection and transmission coefficients at normal
incidence for different materials and compared with the results obtained in CST Microwave Studio.
The advantage is that it takes only a few seconds to run the program in Matlab and obtain the
result comparing with CST where we need a few minutes. The formulas are good only for infinite
structures where we already know the permittivity and permeability of the materials used.

ANNEXES 177
B. Review of material characterization techniques
B.1 Introduction
A material can be characterized by determining the permittivity and permeability. The
permittivity gives us the effect of the material over the electric field in the electromagnetic wave and
the permeability gives us the effect of the material over the magnetic field in the electromagnetic
wave.
In the first part of this chapter we are discussing the parameters of the material and in the
second part we show the different methods of obtaining the material properties and also a new method
created by us.
B.2 Characterization of ε
Dielectric materials are characterized by their permittivity as a function of frequency. In the
microwave field the permittivity has the following behavior depending on frequency (see FIG. B.1).
FIG. B.1 Frequency dependence of permittivity in the microwave field [24]
At resonant frequencies the permittivity exhibits a strange behavior. We have a peak for ε" at
resonant frequencies where ε' exhibits a negative slope. For frequencies that are not resonant ε' has a
positive slope that is called a normal dispersion.
The permittivity can be viewed as a complex value:
(B.1)

178 ANNEXES
where ε' is called the dielectric value and as can been seen in FIG. 1.1 varies with frequency
and ε" is a measure of the attenuation of the electric field inside the material. This equation is called
the dispersion equation for complex permittivity.
The losses inside the material can be obtained using the following formula:
(B.2)
When we have bigger losses it means that the attenuation is bigger inside the material.
The units for permittivity are farads/meter. All the permittivity values obtained for a dielectric
material are compared to the permittivity of vacuum.
For dielectric materials the Maxwell equation is defined as:
(B.3)
where represents the conduction current and is the displacement current.
For good dielectrics we can assume that . This leads to:
Attenuation constant (B.4)
Phase constant (B.5)
Intrinsic impedance (B.6)
Wavelength (B.7)
Skin depth (B.8)

ANNEXES 179
B.3 Characterization of μ
Magnetic materials are characterized by their permeability. The frequency dependence of
magnetic materials is very complicated (Smit 1971; Fuller 1987). Usually metallic magnetic materials
are used as magnetic materials at microwave frequencies.
FIG. B.2 Frequency variation of complex permeability in a ferrite (ω=20π GHz, ωm=11.2π GHz,
α=0.0η) [24, 139]
The permeability is also a complex value just like the permittivity that depends on frequency.
(B.9)
With magnetic losses:
(B.10)
Measuring the permeability we detect the effect of the material on the magnetic field.
Additionally, the magnetic losses will attenuate the energy in the wave.
The units for permeability are henrys/meter. In vacuum we have a value of:

180 ANNEXES
If the permeability and the permittivity of a material are known then we can completely
characterize the material.
For good conductor we can assume that . This leads to:
Attenuation constant (B.11)
Phase constant (B.12)
Intrinsic impedance (B.13)
Wavelength (B.14)
Skin depth (B.15)

ANNEXES 181
C. Nicolson - Ross - Weir (NRW) method
In order to extract the material properties from the waveguide measurement we need to use an
algorithm. In this paper the method presented was created by Nicolson - Ross and improved by Weir.
From the waveguide measurement we obtain the S11 and S21 coefficients. Using these results we
determine the permittivity and permeability of the materials like this:
FIG. C.1 Process for the NRW method
Using the reflection coefficient we obtain
the transmission coefficient T
Calculate the coefficient where L is the
thickness of the sample
If then
Calculate the permeability of the material
Obtain the S11, s21, s12 and s22 from the
VNA using the rectangular waveguide
Using the complex value of S11, S21 or S22
and S12 we calculate K
Using K we can obtain the reflection
coefficient
Calculate the permittivity of the material

182 ANNEXES
where represents the wavelength using the frequency range and is the cutoff wavelength
at the cutoff frequency (for WR90 fc=6.56 GHz).
The original equation
proposed by Nicolson-Ross-Weir is ambiguous
because the phase of the transmission coefficient T does not change when the length of the material is
a multiple of one-half wavelength in the material [6, 7]. Cloete [140] has defined an improvement for
the NRW method that can resolve the mathematical ambiguity. Because T is a complex number then
ln(1/T) must add a term of j2πn. The n from j2πn suggested by Cloete is:
(C.1)
where f is the frequency, tg= represents the group delay measured through the sample,
is the total phase and is the imaginary part of ln(1/T). We are using the function floor() because it
rounds towards minus infinity meaning that n must be taken into account only if the sample is bigger
than one-half wavelength. After resolving the ambiguity we can write just like in FIG. C.1.

183
Communications and publications
1. Journal papers
- «Method for Material Characterization in a Non-Anechoic Environment», Laura Pometcu, Ala
Sharaiha, Ratiba Benzerga, Philippe Pouliguen, Appl. Phys. Lett. 108, 161604 (2016),
http://dx.doi.org/10.1063/1.4947100 .
- «On the choice of the dielectric characterization method for foam composite absorber material»,
Laura Pometcu, Chloé Méjean, Ala Sharaiha, Ratiba Benzerga, Philippe Pouliguen, submitted to
Materials Research Bulletin.
- «Combination of natural and artificial materials for microwave absorption improvement», Laura
Pometcu, Ala Sharaiha, Ratiba Benzerga, Philippe Pouliguen, submitted to Materials Research
Bulletin.
- «Innovative electromagnetic absorber material made of carbon fibers loaded epoxy foam», Chloé
Méjean, Laura Pometcu, Ratiba Benzerga, Ala Sharaiha, Claire Le Paven-Thivet, Mathieu Badard,
Philippe Pouliguen, submitted to Journal of Alloys and Compounds.
2. International conferences
- «Straight Wedge Absorber Geometry Optimization for Normal and Oblique Incidence», Laura
Pometcu, Ala Sharaiha, Ratiba Benzerga, Philippe Pouliguen, 2015 Loughborough Antennas &
Propagation Conference (LAPC). Poster presentation.
- «Improved Microwave Absorption of Pyramidal Absorber Using Metamaterial», Laura Pometcu,
Ala Sharaiha, Ratiba Benzerga, Philippe Pouliguen, Gwenaël Dun, EuCAP 2016, 10-15 April 2016,
Suisse. Oral presentation.
- «New Electromagnetic Absorber Material Made of Epoxy Foam Loaded with Carbon Fibers», Laura
Pometcu, Chloé Méjean, Ala Sharaiha, Ratiba Benzerga, Philippe Pouliguen, LAPC 2016, 14 - 15
November 2016, Loughborough, UK, accepted.
- «Combination of natural and artificial materials for microwave absorption improvement», Laura
Pometcu, Ala Sharaiha, Ratiba Benzerga, Philippe Pouliguen, Gwenaël Dun, MMA 2016, 3 - 6 July,
Seoul, Korea. Poster presentation.

184 COMMUNICATIONS AND PUBLICATIONS
3. National conferences
- «Nouveaux matériaux absorbants à base de mousse époxy et de fibres de carbone», Chloé Méjean,
Laura Pometcu, Ratiba Benzerga, Ala Sharaiha, C. Le Paven-Thivet, M. Badard, Philippe Pouliguen,
18ème Colloque International et Exposition sur la Compatibilité ÉlectroMagnétique (CEM 2016), 11-
13 juil., Rennes, France. Poster presentation.
- «Optimisation de la géométrie de dièdres absorbants pour une meilleure performance en incidence
normale et oblique», Laura Pometcu, Ala Sharaiha, Ratiba Benzerga, Philippe Pouliguen, XIXèmes
Journées Nationales Microondes 3-4-5 Juin 2015, Bordeaux, France. Oral presentation.
- «Caractérisation des Matériaux en Environnement Non Anéchoïque», Laura Pometcu, Ala Sharaiha,
Ratiba Benzerga, Razvan D. Tamas, Philippe Pouliguen, XIXèmes Journées Nationales Microondes 3-
4-5 Juin 2015, Bordeaux, France. Oral presentation.
4. Journée nationale
- «Caractérisation des Matériaux en Environnement Non Anéchoïque», Laura Pometcu, Ala Sharaiha,
Ratiba Benzerga, Razvan D. Tamas, Philippe Pouliguen, Journées scientifiques 2015 d'URSI-France
«Sonder la matière par les ondes électromagnétiques». Poster presentation.
- «Caractérisation des Matériaux en Environnement Non Anéchoïque», Laura Pometcu, Ala Sharaiha,
Ratiba Benzerga, Razvan D. Tamas, Philippe Pouliguen, GDR ONDES "Interférences d'Ondes", 18 -
21 Octobre 2015, Lyon, France. Poster presentation.
- «Amélioration des performances des absorbants pyramidaux par l’utilisation de métamatériaux»,
Laura Pometcu, Ala Sharaiha, Ratiba Benzerga, Philippe Pouliguen, Gwenaël Dun, 14èmes Journées
de Caractérisation Microondes et Matériaux, 23-25 Mars 2016, France. Poster presentation.
- «Nouveaux matériaux absorbants à base de mousse époxy et de fibres de carbone», Chloé Méjean,
Laura Pometcu, Ratiba Benzerga, Ala Sharaiha, C. Le Paven-Thivet, M. Badard, Philippe Pouliguen,
14èmes Journées de Caractérisation Microondes et Matériaux, 23-25 Mars 2016, France. Oral
presentation.
5. Awards: Best Poster Presentation Award: "MMA 2016", «Combination of natural and artificial
materials for microwave absorption improvement», Laura Pometcu, Ratiba Benzerga, Ala Sharaiha,
Philippe Pouliguen.

185
Bibliography
[1] N. Gagnon, J. Shaker, P. Berini, L. Roy, A. Petosa, "Material characterization using a quasi-
optical measurement system", IEEE Transactions on Instrumentation and Measurement, vol. 52,
no.2, pp. 333-336, April 2003.
[2] Application Note, "Solutions for Measuring Permittivity and Permeability with LCR Meters and
Impedance Analyzers", Agilent Literature Number 5980-2862EN.
See: http://cp.literature.agilent.com/litweb/pdf/5980-2862EN.pdf.
[3] J. W. Schultz, S. P. Blaloch, E. J. Hopkins, "Laboratory measurement of microwave scatter
coefficient: calibration and validation", Georgia Tech Research Institute, Atlanta, USA.
[4] I. Zivkovic, A. Murk, "Characterization of magnetically loaded microwave absorbers", Progress
in electromagnetics Research B, vol.33, pp. 277-289, 2011.
[5] A. Brancaccio, G. D'Alterio, E. De Stefano, L. Di Guida, M. Feo, S. Luce, "A free-space method
for microwave characterization of materials in aerospace application", Metrology for Aerospace
(MetroAeroSpace), 2014 IEEE, pp. 423 - 427.
[6] A. M. Nicolson, G. F. Ross, "Measurement of the Intrisic Properties of Materials by Time-
domain Techniques", IEEE Transactions on Instrumentation and Measurement vol. 19,
November 1970, pp.377-382.
[7] W. B. Weir, "Automatic Measurement of Complex Dielectric Constant and Permeability at
Microwave Frequencies", Proceedings of the IEEE vol. 62, January 1974, pp.33-36.
[8] See: http://www.ainfoinc.com/en/p_spacer.asp and
http://www.rfcafe.com/references/electrical/waveguide-chart.htm for more information about the
dimensions of the waveguides.
[9] See: http://www.keysight.com/en/pd-304506-pn-85070E/dielectric-probe-kit?cc=FR&lc=fre for
more information about the dielectric probe used in our study.
[10] See: http://www.keysight.com/en/pd-1000002059%3Aepsg%3Apro-pn-8510C/vector-network
analyzer?cc=FR&lc=fre for more information about the VNA used.
[11] J. Baker-Jarvis, E. J. Vanzura, W. A. Kissick, "Improved technique for determining complex
permittivity with the transmission/reflection method", IEEE Transactions on Microwave Theory
and Techniques, vol. 38, no. 8, pp. 1096-1103, August 1990.
[12] F. H. Wee, P. J. Soh, A. H. M. Suhaizal, H. Nornikman, A. A. M. Ezanuddin, "Free space
measurement technique on dielectric properties of agricultural residues at microwave
frequencies", University of Malaysia, IEEE, 2009.
[13] D. Ghodgaonkar, V. Varadan, "Free-space measurement of complex permittivity and complex
permeability of magnetic materials at microwave frequencies", Instrumentation and
Measurement, IEEE Transactions on, vol. 39, no. 2, pp. 387-394, Apr. 1990.

186 BIBLIOGRAPHY
[14] G. W. Hanson, J. Grimm, D. Nyquist, "An improved de-embedding technique for the
measurement of the complex constitutive parameters of materials using a stripline field
applicator", Instrumentation and Measurement, IEEE Transactions on, vol. 42, no. 3, pp. 740-
745, June 1993.
[15] R. A. Fenner, E. J. Rothwell, L. L. Frasch, "A Comprehensive Analysis of Free-space and
Guided-wave Techniques for Extracting the Permittivity and Permeability of Materials Using
Reflection-only Measurements", Radio Science vol. 47, 18 January 2012, pp.1-13.
[16] See: http://www.ets-lindgren.com/3115 for more information about the broadband antennas
used for the anechoic chamber measurements.
[17] See: http://www.eccosorb.eu/technical-notes for more information about the ECCOSORB
commercial absorber materials used.
[18] C. A. Balanis, Antenna Theory Analysis and Design Third Edition, pp. 28-96 (2005).
[19] Wuiyupatfunukorn, C.; Purini, C.G., "Theoretical and experimental investigations of using
time domain gating in antenna pattern measurements", International Conference on Antennas
and Propagation, vol. 1, pp. 327 -330, 1993.
[20] A. Henderson, J.R. James, P. Newham, G. Morris, "Analysis of gating errors in time domain
antenna measurements", IEE Proc.-Microwave, Ant. and Propagation, Vol. 136.4, pp. 311 -320,
Aug. 1989.
[21] Yu-Ting Hsiao, Yo-Yi Lin, Yu-Cheng Lu and Hsi-Tseng Chou, "Applications of Time-Gating
Method to Improve the Measurement Accuracy of Antenna Radiation inside an Anechoic
Chamber", Antennas and Propagation Society International Symposium, IEEE Vol. 3, pp. 794 -
797, 22-27 June 2003.
[22] M. H. Umari, D. K. Ghodgaonkar, V. V. Varadan, V. K. Varadan, " A free-space bistatic
calibration technique for the measurement of parallel and perpendicular reflection coefficients of
planar samples", IEEE Transactions on Instrumentation and Measurement, vol. 40, no. 1, pp. 19-
24, February 1991.
[23] See http://www.steatiteqpar-antennas.co.uk/products/horn-antennas.html for more information
about the broadband horn antennas; (last accessed December 22, 2015).
[24] C. A. Balanis, Advanced engineering electromagnetics, John Wiley & Sons, 1989.
[25] J. W. Schultz in Focused beam methods: Measuring microwave materials in free space, pp.
36-41, Atlanta, USA (2012).
[26] See: http://www.eccosorb.com/products-eccosorb-ls.htm for more information about the
polyurethane absorber ECCOSORB LS 22; (last accessed Mars 24, 2016).
[27] See: http://www.keysight.com/en/pd-304506-pn-85070E/dielectric-probe-kit for more
information about the coaxial probe used; (last accessed April 5, 2016).
[28] J. Y. Chung, "Broadband characterization techniques for RF materials and engineers
composites", Ohio State University, 2010.

BIBLIOGRAPHY 187
[29] J. A. Krupka, "Frequency Domain Complex Permittivity at Microwave Frequencies",
Measurement Science and Technology 17, R55-R70, June 2006.
[30] E. A. Drake, V. Rajamani, C. F. Bunting, J. C. West, B. Archambeault, and S. Connor,
"Extension and verification of absorbing material effectiveness on reducing electromagnetic
emissions", IEEE, Electromagnetic Compatibility and Signal Integrity (2015) 226–230.
[31] Bowen Bai, Xiaoping Li, Jin Xu, and Yanming Liu, "Reflections of Electromagnetic Waves
Obliquely Incident on a Multilayer Stealth Structure With Plasma and Radar Absorbing
Material", IEEE Transactions on Plasma Science, 43 (2015) 2588–2597.
[32] W. Duan, H. Chen, M. Sun, Y. Ding, X. Sun, C. Cai, and X. Sun, "A composite
electromagnetic absorber for anechoic chambers", Proceedings of the International Symposium
on Antennas & Propagation, 1 (2013) 412–414.
[33] S. Toshifumi, H. Yoshihito, K. Hiroshi, and Y. Motonari, "Electromagnetic wave absorber and
electromagnetic wave anechoic chamber", (2015) US/2015/0340766.
[34] D.D.L. Chung. "Electromagnetic interference shielding effectiveness of carbon materials",
Carbon. 39 (2001) 279-285.
[35] F. Qin and C. Brosseau, "A review and analysis of microwave absorption in polymer
composites filled with carbonaceous particles", Journal of Applied Physics, 111 (2012) 061301-
1-24.
[36] J.H. Oh, K.S. Oh, C.G.Kim, C.S. Hong, "Design of radar absorbing structures using
glass/epoxy composite containing carbon black in X-band frequency ranges", Composites : Part
B 35 (2004) 49-56.
[37] S.M. Abbas, Mahesh Chandra, A. Verma, R. Chatterjee, T.C. Goel, "Complex permittivity and
microwave absorption properties of a composite dielectric absorber", Composites : Part A. 37
(2006) 2148-2154.
[38] W.S. Chin. D. G. Lee, "Development of the composite RAS (radar absorbing structure) for the
X-band frequency range", Composite Structures. 77 (2005) 457-465.
[39] X. Liu, Z. Zhang, Y. Wu, "Absorption properties of carbon black/silicon carbide microwave
absorbers", Composites: Part B. 42 (2011) 326-329.
[40] J.B. Kim, S.K. Lee, C.G Kim, "Comparison study on the effect of carbon nano materials for
single-layer microwave absorbers in X-band", Composite Science and Technology. 68 (2008)
2909-2916.
[41] G. Dupupet. Fibres de carbone. Techniques de l’Ingénieur. am5134. 2008.
[42] S.H. Kim, Y.G. Park, S.S. Kim. "Double-layered microwave absorbers composed of ferrite
and carbon fibers composite laminates". Physica Status Solidi. 4,12 (2007) 4602-4605.
[43] C. P. Neo and V. K. Varadan, "Optimization of carbon fiber composite for microwave
absorber", IEEE Transactions on Electromagnetic Compatibility, 46 (2004) 102–106.

188 BIBLIOGRAPHY
[44] M. Paligová, J. Vilčákova, P. Sáha, V. Křesálek, J. Stejskal, and O. Quadrat, "Electromagnetic
shielding of epoxy resin composites containing carbon fibers coated with polyaniline base",
Physica A: Statistical Mechanics and its Applications, vol. 335, no. 3–4 (2004) 421–429.
[45] A. Ameli, P.U. Jung, C.B. Park. "Electrical properties and electromagnetic interference
shielding effectiveness of polypropylene/carbon fiber composite foams", Carbon. 60 (2013) 379-
391.
[46] M. S. Cao, W. L. Song, Z. L. Hou, B. Wen , J. Yuan. "The effects of temperature and
frequency on the dielectric properties, electromagnetic interference shielding and microwave-
absorption of short carbon fiber/silica composites", CARBON 48 (2010) 788–796.
[47] J. Wu, L. Kong. "High microwave permittivity of multiwalled carbon nanotube composites",
Applied Physics Letters. 84, 24 (2004) 4956-4958.
[48] P. Zhihua, P. Jingcui, P. Yanfeng, O. Yangyu, N. Yantao. "Complex permittivity and
microwave absorption properties of carbon nanotubes/polymer composite: A numerical study".
Physics Letters A. 372 (2008) 3714-3718.
[49] P. Bollen, N.Quiévy, I.Huynen, C. Bailly, C.Detrembleur, J.M. Thomassin, T. Pardoen.
"Multifunctional architecture materials for electromagnetic absorption", Scriptra Materialia.
68:50-54. 2013.
[50] A. Saib, L. Bednarz, R. Daussin, C. Bailly, X. Lou, J.M. Thomassin, C. Pagnoulle, C.
Detrembleur, R. Jérôme, and I. Huynen. "Carbon nanotube composites for broadband microwave
absorbing materials", European Microwave Conference. DOI:10.1109/EUMC.2005.1608849.
2005.
[51] See: http://www.sigmaaldrich.com/catalog/product/aldrich/805033?lang=fr®ion=FR for
more information about carbon nanotubes materials.
[52] Photo NTC see:
http://www.sigmaaldrich.com/catalog/product/aldrich/687812?lang=fr®ion=FR for more
information about carbon nanotubes array materials.
[53] F. He, W. Ren, , G. Liang, P. Shi, X. Wu, X. Chen. "Structure and dielectric properties of
barium titanate thin films for capacitor applications". Ceramics International, 39 (2013) 481–
485.
[54] Y. Corredores, A. Le Febvrier, X. Castel, R. Sauleau, R. Benzerga, S. Députier, M. Guilloux-
Viry, A. Mekadmini, N. Martin, G. Tanné. "Study of ferroelectric / dielectric multilayers for
tunable stub resonator applications at microwaves". Thin Solid Films, 553 (2014) 109–113.
[55] W. Yang, S. Yu, R. Sun, R. Du. "Effects of BaTiO3 and FeAlSi as fillers on the magnetic,
dielectric and microwave absorption characteristics of the epoxy-based composites". Ceramics
International, 38 (2012) 3553–3562.
[56] Z. Ma, C. Cao, J. Yuan, Q. Liu, J. Wang. "Enhanced microwave absorption of BaTiO3-based
ferroelectric/ferromagnetic nanocomposite". Applied Surface Science, 258 (2012) 7556– 7561.

BIBLIOGRAPHY 189
[57] C. Singh, H. Kaur, S. B. Narang, P. Kaur, R. Kaur, T. Dhiman. "Investigation of microwave
absorption and DC electrical properties of Mn2+
and Ti4+
substituted SrMnxTixFe(12-2x)O19 ferrite".
Journal of Alloys and Compounds 683 (2016) 302-307.
[58] X. Huang, J. Zhang, M. Lai, T.Sang, "Preparation and microwave absorption mechanisms of
the NiZn ferrite nanofibers", Journal of Alloys and Compounds 627 (2015) 367–373.
[59] S.B. Narang, P. Kaur, S. Bahel, C. Singh, "Microwave characterization of Co–Ti substituted
barium hexagonal ferrites in X-band", Journal of Magnetism and Magnetic Materials 405, pp.
17–21, 2016.
[60] Y. Iijima, Y. Houjou, R. Sato. "Millimeter wave absorber using M-type hexagonal ferrite".
IEEE. (2000) 547-549.
[61] S. M. Abbas, A. K. Dixit, R. Chatterjee, and T. C. Goel, "Complex permittivity, complex
permeability and microwave absorption properties of ferrite–polymer composites", Journal of
Magnetism and Magnetic Materials, 309 (2007) 20–24.
[62] M.R. Meshram, N. K. Agrawal, B. Sinha, P.S. Misra, "Characterization of M-type barium
hexagonal ferrite-based wide band microwave absorber", Journal of Magnetism and Magnetic
Materials 271 (2004) 207–214.
[63] R. Dosoudil, M. Usakova, J. Franek, J. Slama, and A. Gruskova, "Particle Size and
Concentration Effect on Permeability and EM-Wave Absorption Properties of Hybrid Ferrite
Polymer Composites", IEEE Transactions on Magnetics, 46 (2010) 436–439.
[64] S. S. S. Afghahi1, M. Jafarian, Y. Atassi. "Novel approach for designing a thin and broadband
microwave absorber in Ku band based on substituted M-hexaferrites", Journal of Magnetism and
Magnetic Materials.
[65] G. Shen, M. Xu, Z. Xu. "Double-layer microwave absorber based on ferrite and short carbon
fiber composites". Materials Chemistry and Physics. 105 (2007) 268-272.
[66] Q. Yuchang, Z. Wancheng, L. Fa, Z. Dongmei. "Optimization of electromagnetic matching of
carbonyl iron/BaTiO3 composites for microwave absorption". Journal of Magnetism and
Magnetic Materials. 323 (2011) 600-606.
[67] W. Meng, D. Yuping, L. Shunhua, L. Xiaogang, J. Zhijiang. "Absorption properties of
carbonyl-iron/carbon black double layer microwave absorbers". Journal of Magnetism and
Magnetic Materials. 321 (2009) 3442-3446.
[68] S. Vinayasree , M.A. Soloman, V. Sunny, P. Mohanan, P. Kurian, M.R. Anantharaman. "A
microwave absorber based on strontium ferrite–carbon black–nitrile rubber for S and X-band
applications". Composites Science and Technology 82 (2013) 69–75.
[69] Y. Duan, Y. Yang, M. He, S. Liu, X. Cui, H. Chen. "Absorbing properties of α-manganese
dioxide/carbon black double-layer composites". Journal of Physics D: Applied Physics. 41
(2008) 125403.
190 BIBLIOGRAPHY
[70] F. Xu, L. Maa, Q. Huo, M. Gan, J. Tang. Microwave absorbing properties and structural
design of microwave absorbers based on polyaniline and polyaniline/ magnetite nanocomposite".
Journal of Magnetism and Magnetic Materials 374 (2015) 311–316.
[71] Y. Wang, F. Luo,W. Zhou,D. Zhu. "Dielectric and electromagnetic wave absorbing properties
of TiC/epoxy composites in the GHz range". Ceramics International 40 (2014) 10749–10754.
[72] A. Priou. "Matériaux composites en électromagnétisme – Matériaux chargés, matériaux
électroniques et métamatériaux". Techniques de l’ingénieur. E 1165 :1-35. 2009.
[73] X. B. Xu, Z. M. Li, L. Shi. X.C. Bian, and Z. D. Xiang. "Ultralight conductive carbon-
nanotube–polymer composite". Small, 3, 3 (2007) 408 – 411.
[74] See: http://www.siepel.com/en/siepel-international/product/pyramidal-foam-apm-apx for more
information about the SIEPEL commercial absorber materials used.
[75] See: http://www.ets-lindgren.com/RFAbsorbers for more information about the LINDGREN
commercial absorber materials used.
[76] See: http://www.eccosorb.eu/products/eccosorb for more information about the ECCOSORB
commercial materials used.
[77] See: http://www.eccosorb.eu/products/eccosorb/eccosorb for more information about the
ECCOSORB AN commercial absorber material used.
[78] S. Kent and I. Catalkaya, "Optimized geometry pyramidal absorber for normal incidence
case", IEEE, Recent Advances in Space Technologies proceeding, pp. 177–179, 2013.
[79] L. Pometcu, A. Sharaiha, R. Benzerga, and P. Pouliguen, "Straight wedge absorber geometry
optimization for normal and oblique incidence", IEEE, Antennas and Propagation Conference
proceeding, pp. 633–636, 2014.
[80] R. Brayner, F. Fiévet, and T. Coradin, Eds., "Nanomaterials: A Danger or a Promise?"
London: Springer London, 2013.
[81] See: http://www.comtest.eu/products/anechoic-chambers/absorbers for more information
about the COMTEST commercial absorber materials.
[82] Z.S. Farhany, F. Malek, H. Nornikman, N.A. Mohd Affendi, L. Mohanmed, N. Saudin, A.A.
Ali, "Potential of dried banana leaves for pyramidal microwave absorber design", IEEE
Symposium on Wirefess Technology and Applications. (2012) pp. 60-65.
[83] A.A.Yusof, W. K. Wan Ali, T. Abd Rahman, F.N. Ani. "Microwave and reflection properties
of palm shell carbon-polyester conductive composite absorber". Jurnal Tecknologi. 42 A (2005)
pp. 59-74.
[84] M.K.M. Salleh, M. Yahya, Z. Awang, W.N.W. Muhamad, A.M. Mozi, N. Yaacob.
"Experimental verification of multi-layer coconut shell-derived microwave absorbers". IEEE
International RF and Microwave Conference. (2011) pp. 115-118.

BIBLIOGRAPHY 191
[85] L. Zahid, F. Malek, H. Nornikman, N.A. Mohd Affendi, N. Hussin, B.H. Ahmad, M.Z.A. Abd
Aziz. "Development of pyramidal microwave absorber using sugar cane bagasse". Progress In
Electromagnetics Research. 137 (2013), pp. 687-702.
[86] Y.S. Lee, F. Malek, E.M. Cheng, W.W. Liu, K.Y. You, M.N. Iqbal, F.H. Wee, S.F. Khor, L.
Zahid, M.F.B.H. Abd Malek. "Experimental determination of the performance of rice husk-
carbon nanotube composites for absorbing microwave signals in the frequency range of 12.4-
18GHz". Progress In Electromagnetics Research. 140 (2013), pp. 795-812.
[87] H. Nornikman, F. Malek, P.J Soh, A.A.H. Azremi, S.A. Ghani. "Potential of Rice Husk for
Pyramidal Microwave Absorber Design", The 2nd International Conference of Institution of
Engineering and Technology (IET) Brunei Darussalam Network (ICIET 2010).
[88] J.J.M Halls, C. A. Walsh, N. C. Greenham, E. A. Marseglia, R. H. Friend, S. C. Moratti, A. B.
Holmes, "Efficient photodiodes from interpenetrating polymer networks", Nature, vol. 376
(6540), pp. 498-500, 1995.
[89] J. C. Dubois, O. Sagnes O, F. Henry, "Polyheterocyclic conducting polymers and composites
derivatives", Synt.Met., vol. 28(1-2), pp. C871-C878, 1989.
[90] J. Roncali, R. Garreau, D. Delabouglise, F. Garnier, M. Lemaire, "Communıcatıons
modification of the structure and electrochemical properties of poly(thiophene) by ether groups",
J. Chem.Soc-Chem., vol. 11, pp. 679-781, 1989.
[91] A. Shah, Y. Wang, H. Huang, L. Zhang, D. Wang, L. Zhou, Y. Duan, X. Dong, and Z. Zhang,
"Microwave absorption and flexural properties of Fe nanoparticle/carbon fiber/epoxy resin
composite plates", Composite Structures, 131 (2015) 1132–1141.
[92] A. Shah, A. Ding, Y. Wang, L. Zhang, D. Wang, J. Muhammad, H. Huang, Y. Duan, X.
Dong, and Z. Zhang, "Enhanced microwave absorption by arrayed carbon fibers and gradient
dispersion of Fe nanoparticles in epoxy resin composites", Carbon, 96 (2016) pp. 987–997.
[93] J. Wang, J. Wang, B. Zhang, Y. Sun, W. Chen, and T. Wang, "Combined use of lightweight
magnetic Fe3O4-coated hollow glass spheres and electrically conductive reduced graphene oxide
in an epoxy matrix for microwave absorption", Journal of Magnetism and Magnetic Materials,
401 (2016) pp. 209–216.
[94] S.Y. Zhang, Q.X. Cao, Y.R. Xue, and Y.-X. Zhou, "Microwave absorption performance of the
absorber based on epsilon-Fe3N/epoxy and carbonyl iron/epoxy composites", Journal of
Magnetism and Magnetic Materials, 374 (2015), pp. 755–761.
[95] P. Saville, Review of radar absorbing materials, DTIC Document, 2005.
[96] Sicomin, PB 170, PB 250, PB 400, PB 600 Cellular Epoxy Foam Production System. 2014.
[97] American National Standards Institute, ANSI C63.5, "American National Standard for
Calibration of Atennas Used for Radiated Emission Measurements in Electromagnetic
Interference (EMI) Control", 16 June 1988.

192 BIBLIOGRAPHY
[98] Z.-M. Dang, J.-P. Wu, H.-P. Xu, S.-H. Yao, M.-J. Jiang, and J. Bai, "Dielectric properties of
upright carbon fiber filled poly(vinylidene fluoride) composite with low percolation threshold
and weak temperature dependence", Applied Physics Letters, 91 (2007) 72912.
[99] F. Malek, Z. Liyana, F. H. Wee, H. Nornikman, "Reflection loss performance of double
pyramidal microwave absorber", Telecommunication Technologies (ISTT), 2012 International
Symposium, pp. 6-10, 26-28 Nov. 2012.
[100] L.H. Hemming, Electromagnetic anechoic chambers A fundamental Design and Specification
Guide, John Wiley & Sons, 1999.
[101] H. Nornikman, P.J Soh, A.A.H Azremi, " Performance of Different Polygonal Microwave
Absorber Designs Using Novel Material", The 2009 International Symposium on Antennas and
Propagation (ISAP 2009) October 20-23, 2009, Bangkok, Thailand.
[102] H. Nornikman, F. Malek, P.J Soh, A.A.H Azremi, A. Ismahayati, "Reflection Loss
Performance of Triangular Microwave Absorber", International Symposium on Antennas and
Propagation (ISAP 2010), 2010.
[103] H.Nornikman, F. Malek, P.J.Soh, A.A.H Azremi, "Reflection Loss Performance of Hexagonal
Base Pyramid Microwave Absorber using Different Agricultural Waste Material", 2010
Loughborough Antennas & Propagation Conference 8-9 November 2010, Loughborough, UK.
[104] V. Rodriguez, "Basic Rules for Anechoic Chamber Design, Part One: RF Absorber
Approximations", Microwave Journal, January 2016.
[105] I. Catalkaya and S. Kent, "Analysis of multiple wedge electromagnetic wave absorbers",
Progress In Electromagnetics Research M, Vol. 26, 1-9, 2012.
[106] V. Kubytskyi, B. Sapoval, G. Dun and J.-F. Rosnarho, "Fast optimization of microwave
absorbers", Microwave and Optical Technology Letters Vol. 54, Issue 11, pages 2472–2477,
November 2012.
[107] K. J. Vinoy and R. M. Jha, Radar absorbing materials – from theory to design and
characterization, Kluwer academic publisher, Boston, 1996.
[108] Hossein Mosallaei, Yahya Rahmat-Samii, “RCS Reduction of Canonical Targets Using
Genetic Algorithm Synthesized RAM,” IEEE Transactions Antennas Propagation, Vol. 48, N.
10, 2000.
[109] See: http://www.siepel.com/en/siepel-international/product/wedge-adm for more information
about the SIEPEL wedge commercial absorber materials.
[110] A. Mallik, S. Kundu and Md. O. Goni, " Gain and SAR Improvement of a Conventional Patch
Antenna using a Novel Pi-shaped DNG Metamaterial", International Conference on Electrical
Information and Communication Technology (EICT), 2013.
[111] D. Schurig, J. J. Mock, B. J. Justice, S. A. Cummer, J. B. Pendry, A. F. Starr and D. R. Smith,
"Metamaterial Electromagnetic Cloak at Microwave Frequencies", Science, vol. 314, no. 5801,
pp. 977-980, 10 November 2006.

BIBLIOGRAPHY 193
[112] H. Nornikman, B. H. Ahmad, M. Z. A. Abdul Aziz, M. F. B. A. Malek, H. Imran and A. R.
Othman, "Study and simulation of an edge couple split ring resonator (ec-SRR) on truncated
pyramidal microwave absorber", Progress In Electromagnetics Research, vol. 127, pp. 319-334,
2012.
[113] H. Nornikman, B. H. Ahmad, M. Z. A. Abdul Aziz, M. R. Kamarudirr, A. R. Othman, "Effect
of Spiral Ring Resonator(S-SRR) structure on Truncated Pyramidal Microwave Absorber
Design", Proceedings of ISAP2012, Nagoya, Japan, 2012.
[114] M. R. Soheilifar, R. A. Sadeghzadeh, "Design, fabrication and characterization of stacked
layers planar broadband metamaterial absorber at microwave frequency", AEU - International
Journal of Electronics and Communications, vol. 69, no. 1, pp. 126-132, 2015.
[115] Y. J. Yoo, Y. J. Kim, J. S. Hwang, J. Y. Rhee, K. W. Kim, Y. H. Kim, H. Cheong, L. Y. Chen,
and Y. P. Lee, "Triple-band perfect metamaterial absorption, based on single cut-wire bar",
2015.
[116] L. Li, J. Wang, H. Du, J. Wang, S. Qu, Z. Xu, "A band enhanced metamaterial absorber based
on E-shaped all-dielectric resonators", 2015.
[117] F. Ding, Y. Cui, X. Ge, Y. Jin, S. He, "Ultra-broadband microwave metamaterial absorber",
2012.
[118] L. Schreider, X. Begaud, M. Soiron, B. Perpere, "Design of a broadband Archimedean spiral
antenna above a thin modified Electromagnetic Band Gap substrate", 2006 First European
Conference on Antennas and Propagation, 6-10 November 2006.
[119] Fabrice Lint, "Apport des Surfaces a Haute Impedance a la conception d'antennes reseaux
compactes et d'antennes reseaux a tres large bande passante", Doctorat de Telecom Paris-Tech,
Thesis defended on 07.04.2011.
[120] H. Zhai, C. Zhan, Z. Li and C. Liang, "A Triple-Band Ultrathin Metamaterial Absorber With
Wide-Angle and Polarization Stability", IEEE Antennas and Wireless Propagation
Letters,Vol.14, pp. 241-244, 1 October 2014.
[121] M. Olszewska, B. Salski, W. Gwarek, P. Bajurko, Y. Yashchyshyn, M. Jakubowska, D.
Janczak, "A broadband metamaterial absorbing panel with a resistive pattern made of ink with
graphene nanoplatelets", Microwave Conference (EuMC), 2013 European, pp. 1039 - 1042, 6 -
10 October 2013.
[122] W. S. Wall, S. M. Rudolph, S. K. Hong, K. L. Morgan, "Broadband Switching Nonlinear
Metamaterial", IEEE Antennas and Wireless Propagation Letters, Vol. 13, pp. 427 - 430, 27
February 2014.
[123] Z. Yu, G. Lu, "Ultra-broadband Metamaterial Absorber Using Slotted. Metal Loops with
Multi-layers and its ECM Analysis", 2015 IEEE 6th International Symposium on Microwave,
Antenna, Propagation, and EMC Technologies (MAPE), pp. 426 - 428, 28 - 30 October 2015.

194 BIBLIOGRAPHY
[124] S. Bhattacharyya, S. Ghosh, D. Chaurasiya, K. V. Srivastava, "Wide-angle broadband
microwave metamaterial absorber with octave bandwidth", IET Microwaves Antennas &
Propagation, Vol. 9, Issue: 11, pp. 1160 - 1166, 20 August 2015.
[125] D. Zhou, X. Huang, Z. Du, "Analysis and Design of Multi-layered Broadband Radar
Absorbing Metamaterial Using 3D Printing Technology-based Method", IEEE Antennas and
Wireless Propagation Letters, Vol. PP, Issue: 99, 29 April 2016.
[126] L. Wang, S. Liu, X. Kong, H. Zhang, G. Ding, L. Liu, "A broadband flexible metamaterial
absorber based on high-impedance surface", 2016 IEEE International Workshop on
Electromagnetics: Applications and Student Innovation Competition (iWEM), 16 - 18 May
2016.
[127] W. Shi, S. Liu, B. Zheng, X. Kong, H. Zhang, S. Liu, "Broadband perfect metamaterial
absorption, based on flexible material", 2016 IEEE International Workshop on Electromagnetics:
Applications and Student Innovation Competition (iWEM), 16 - 18 May 2016.
[128] L. Liu, S. Liu, H. Zhang, X. Kong, L. Wang, "A novel broadband metamaterial absorber based
on cross dumbbell-shaped structure", 2016 IEEE International Workshop on Electromagnetics:
Applications and Student Innovation Competition (iWEM), 16 - 18 May 2016.
[129] S. Wei, J. Zhao, Z. Sun, K. Chen, Y. Feng, "Water droplets: Toward broadband metamaterial
microwave absorber", 2016 IEEE International Workshop on Electromagnetics: Applications
and Student Innovation Competition (iWEM), 16 - 18 May 2016.
[130] D. G. Holtby, K. L. Ford and B. Chambers, "Optimization of a stepped permittivity impedance
loaded (SPIL) absorber", Antennas and Propagation, EuCAP, pp. 2691-2693, 23-27 March 2009.
[131] K. L. Ford, D. G. Holtby and B. Chambers, "Optimization of a pyramidal geometric transition
radar absorbing material loaded with a resistive frequency selective surface", IET Radar, Sonar
& Navigation, Vol. 3, No 6, pp. 596-600, 2009.
[132] H. Nornikman, B. H. Ahmad, M. Z. A. Abdul Aziz, M. F. B. A. Malek, H. Imran and A. R.
Othman, "Study and simulation of an edge couple split ring resonator (ec-SRR) on truncated
pyramidal microwave Absorber”, 2012.
[133] D. G. Holtby, K. L. Ford and B. Chambers, "Genetic algorithm optimization of dual polarized
pyramidal absorbers loaded with a binary FSS", 2009 ", Loughborough Antennas & Propagation
Conference, pp. 217-220, 16-17 November 2009.
[134] Y. J. Yoo, H. Y. Zheng, Y. J. Kim, J. Y. Rhee, J. H. Kang, K. W. Kim, H. Cheong, Y. H. Kim
and Y. P. Lee, "Flexible and Elastic Metamaterial Absorber for Low Frequency, Based on Small-
size Unit Cell", Applied physics letters 105, 2014.
[135] A. Demir, "Floquet theory and non-linear perturbation analysis for oscillators with
differential-algebraic equations", International Journal of Circuit Theory and Applications, vol.
28, Issue 2, pp. 163-185, (2000)

BIBLIOGRAPHY 195
[136] L. Pometcu, A. Sharaiha, R. Benzerga, R. D. Tamas, P. Pouliguen, ” Method for material
characterization in a non-anechoic environment”, Appl. Phys. Lett. 108, 161604, 2016.
[137] See: http://antem.free.fr/product_4.html. The CHEOPS du CELAR anechoic chamber (DGA).
[138] Sophocles J. Orfanidis, Electromagnetic Waves and Antennas, ECE Department Rutgers
University 94 Brett Road Piscataway, NJ 08854-8058.
[139] R. E. Collin, Foundations for Microwave engineering, McGraw-Hill Book Co., 1966.
[140] W. J. Louw, "Microwave Heating of Multiphase Materials: Modeling and Measurement",
University of Stellenbosch, December 2005.

196 BIBLIOGRAPHY


Résumé
Les matériaux absorbants des ondes électromagnétiques sont des éléments importants pour
l'évaluation de nombreux systèmes électroniques militaires mais également civils. Ces matériaux sont
utilisés, par exemple, pour la réduction des interférences électromagnétiques (EMI) dans divers
composants sans fils, la réduction de la surface équivalente radar (SER) ou comme absorbants à
l'intérieur des chambres de mesures. C’est cette dernière application qui est visée par les travaux de
cette thèse. L’objectif de mes travaux de thèse est d’optimiser des matériaux absorbants utilisés dans
les chambres anéchoïques. La géométrie et la composition du matériau absorbant sont les deux
paramètres qui influencent la capacité d’absorption de l’onde électromagnétique par un matériau. Ce
seront donc les deux pistes d’optimisation explorés durant cette thèse. Notre but est d’obtenir les
absorbants présentant les plus faibles coefficients de réflexion et de transmission, soit une absorption
élevée, ceci dans une large bande de fréquence.
Mots clés: antennes; l'algorithme d'optimisation; chambre anéchoïque; coefficient de réflexion;
incidence normale; incidence oblique; mesure de la transmission; mousse de polymère; permittivité
Abstract
The electromagnetic absorber materials are important elements for evaluating various
electronic and civil systems. These materials are used, for example, for minimizing electromagnetic
interferences (EMI) in different wireless components, for minimizing the radar cross section (RCS) or
for usage in anechoic chambers. The latter application is the targeted work in this thesis. The objective
of this work is to optimize the absorber materials used in anechoic chambers. The geometry and the
material composition are the two parameters that influence the absorption of the electromagnetic wave
inside the material itself. This are the two topics of optimization explored in this thesis. Our objective
is to obtain material absorbers that have low reflection and transmission coefficients and high
absorption in a large frequency band.
Keywords: anechoic chamber; antennas; normal incidence; oblique incidence; optimization algorithm;
permittivity; polymer foam; transmission measurement; reflection coefficient