innovative long-term monitoring of the great belt bridge
TRANSCRIPT

Full Terms & Conditions of access and use can be found athttps://www.tandfonline.com/action/journalInformation?journalCode=tsei20
Structural Engineering International
ISSN: 1016-8664 (Print) 1683-0350 (Online) Journal homepage: https://www.tandfonline.com/loi/tsei20
Innovative Long-Term Monitoring of the GreatBelt Bridge Expansion Joint Using Digital ImageCorrelation
Jan Winkler Dr, Chief Specialist & Martin Duus Hansen MaintenanceManager
To cite this article: Jan Winkler Dr, Chief Specialist & Martin Duus Hansen MaintenanceManager (2018) Innovative Long-Term Monitoring of the Great Belt Bridge Expansion JointUsing Digital Image Correlation, Structural Engineering International, 28:3, 347-352, DOI:10.1080/10168664.2018.1461539
To link to this article: https://doi.org/10.1080/10168664.2018.1461539
Published online: 19 Jul 2018.
Submit your article to this journal
Article views: 106
View Crossmark data
Innovative Long-Term Monitoring of the Great Belt BridgeExpansion Joint Using Digital Image CorrelationJan Winkler, Dr, Chief Specialist, ATKINS SNC-Lavalin—Transportation, Copenhagen, Denmark; Martin Duus Hansen, Maintenance
Manager, Sund & Bælt Holding A/S—Structures and Landworks, Copenhagen, Denmark. Contact: [email protected]
DOI: 10.1080/10168664.2018.1461539
Abstract
Making informed decisions on timelyintervention for effective bridgemaintenance activities relies on goodquality, accurate, reliable data.Although the proper functioning ofexpansion joints is critical to bridgeperformance, long-term monitoring oftheir condition is challenging due tothe cost of sensors and dataprocessing. Digital image correlation(DIC) is a non-contact photo-grammetry technique that can image abridge component periodically andcompute strain and deformation fromimages previously recorded. Thispaper describes a one-month-longmonitoring campaign wherein a DICsystem was used as a cost-effective toolfor gathering data on the movementand rotation of one of the Great BeltBridge’s expansion joints. Themonitoring provided previouslyunavailable data, helped improveunderstanding of the behaviour of thejoint and informed the next steps forthe maintenance strategy. The resultsshow good agreement between theDIC data and measured temperaturedata. A mathematical model wasestablished which relates the airtemperature to expansion jointdeformation, enabling the real-timeevaluation of monitoring data and thecost-efficient identification of problemsin the functioning of expansion joints.This is one of the first applications of aDIC technique to the long-termmonitoring of a suspension bridge.
Keywords: suspensionbridge; expansionjoint; monitoring; digital imagecorrelation; performance assessment;asset management; probabilisticmodelling
Introduction
The principal difficulty with addinglots of monitoring systems to bridgesis that they produce a vast quantityof data. Bridge operators typicallydo not know what to do with these
data unless there is a very clear defi-nition of both the trigger levels forthe data and interventions for howto proceed if these levels areexceeded. This means that the struc-tural engineer needs to identify whatthe most likely deterioration mechan-isms are for a particular bridge andthen design bespoke monitoring thatcan be used to specifically measureperformance in such a way that anacceptable level can be set andchecked.
Instruments such as strain gauges,accelerometers, fibre-optic sensorsand displacement transducers arebecoming increasingly common instructural-health monitoring. Thesetypes of sensor can however possessdrawbacks such as the need for exter-nal power, cabling and antenna fordata collection and transmission, highdata-acquisition channel counts andthe limitation of only measuring at dis-crete points or along a line, so it isnecessary to have an idea of where toexpect damage when placing theinstrumentation. These sensors can beused effectively to continuouslymonitor for abnormalities that indicatedamage, but the type and severity ofthe damage can still be difficult toidentify from discrete point measure-ments. Furthermore, asset managersare continuously searching for newtechnologies that will allow them togather information about their struc-tures without causing disruption tothe traffic flow.
Digital Image Correlation (DIC)
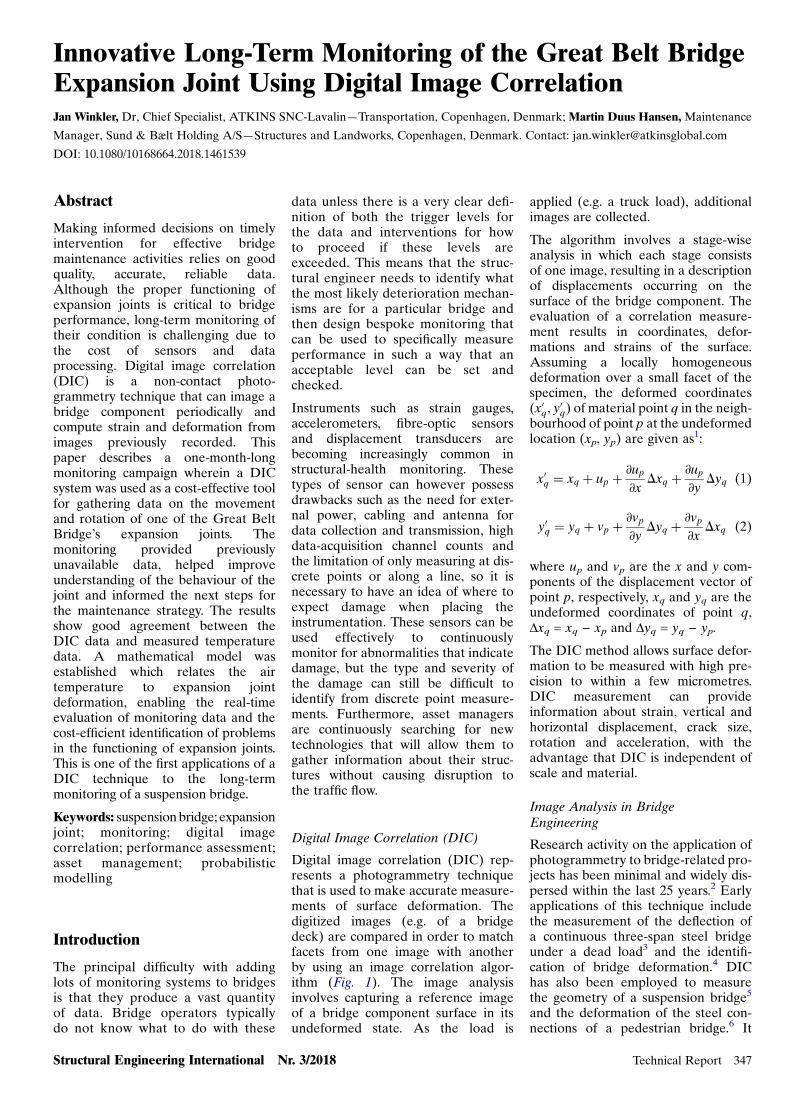
Digital image correlation (DIC) rep-resents a photogrammetry techniquethat is used to make accurate measure-ments of surface deformation. Thedigitized images (e.g. of a bridgedeck) are compared in order to matchfacets from one image with anotherby using an image correlation algor-ithm (Fig. 1). The image analysisinvolves capturing a reference imageof a bridge component surface in itsundeformed state. As the load is
applied (e.g. a truck load), additionalimages are collected.
The algorithm involves a stage-wiseanalysis in which each stage consistsof one image, resulting in a descriptionof displacements occurring on thesurface of the bridge component. Theevaluation of a correlation measure-ment results in coordinates, defor-mations and strains of the surface.Assuming a locally homogeneousdeformation over a small facet of thespecimen, the deformed coordinates(x′q, y
′q) of material point q in the neigh-
bourhood of point p at the undeformedlocation (xp, yp) are given as1:
x′q = xq + up + ∂up∂x
Dxq + ∂up∂y
Dyq (1)
y′q = yq + vp + ∂vp∂y
Dyq + ∂vp∂x
Dxq (2)
where up and vp are the x and y com-ponents of the displacement vector ofpoint p, respectively, xq and yq are theundeformed coordinates of point q,Δxq = xq − xp and Δyq = yq − yp.
The DIC method allows surface defor-mation to be measured with high pre-cision to within a few micrometres.DIC measurement can provideinformation about strain, vertical andhorizontal displacement, crack size,rotation and acceleration, with theadvantage that DIC is independent ofscale and material.
Image Analysis in BridgeEngineering
Research activity on the application ofphotogrammetry to bridge-related pro-jects has been minimal and widely dis-persed within the last 25 years.2 Earlyapplications of this technique includethe measurement of the deflection ofa continuous three-span steel bridgeunder a dead load3 and the identifi-cation of bridge deformation.4 DIChas also been employed to measurethe geometry of a suspension bridge5
and the deformation of the steel con-nections of a pedestrian bridge.6 It
Structural Engineering International Nr. 3/2018 Technical Report 347
has been shown that DIC techniquescomplement conventional measuringsystems such as Linear Variable Differ-ential Transformer (LVDT) and straingauges. The last few years have seenthe increased application of DIC tothe measurement of the vertical deflec-tions of steel and concrete bridges dueto traffic7–13 and train transit.14 Ingeneral, it has been concluded thatDIC system accuracy is comparable toexisting displacement measurementtechniques and that DIC is an easierway to measure the displacement ofmultiple points at once. DIC has alsobeen proposed as a method for asses-sing the dynamic characteristics ofhanger cables on suspension bridges;in Ref. [15], a non-contact sensingmethod is proposed for the purposeof estimating the tension of hanger
cables with digital image processingbased on the use of a portable digitalcamcorder. Moreover, DIC techniqueshave been used to record the strain onconcrete girders during a full-scalebridge failure test16 and to measurethe displacement field on a crackedconcrete girder during a bridge-loading test.17 In both cases the photo-grammetry method was successfullyused to detect changes in the loadingcondition and locate cracks. Onerecent application of DIC is its useto fatigue test the monostrands ofbridge stay cables. It was found thatthe vision-based system allows for themeasurement of the interwire move-ment (fretting fatigue), which is thegoverning mechanism of fatigue lifereduction in modern stay-cable assem-blies.18,19 DIC has also been employed
in structural monitoring to measure thestrain in fatigue-sensitive bridge com-ponents with a view to finding a wayto avoid the need for strengthening.20
The present report describes theoutcome of a one-month-long monitor-ing campaign wherein a DIC systemwas used as a cost-effective tool for gath-ering data on the movement androtation of one of the Great BeltBridge’s expansion joints. The outcomesof the monitoring provided previouslyunavailable data, helped to form abetter understanding of the behaviourof the joint and informed the next stepswith respect to themaintenance strategy.
The Great Belt Bridge
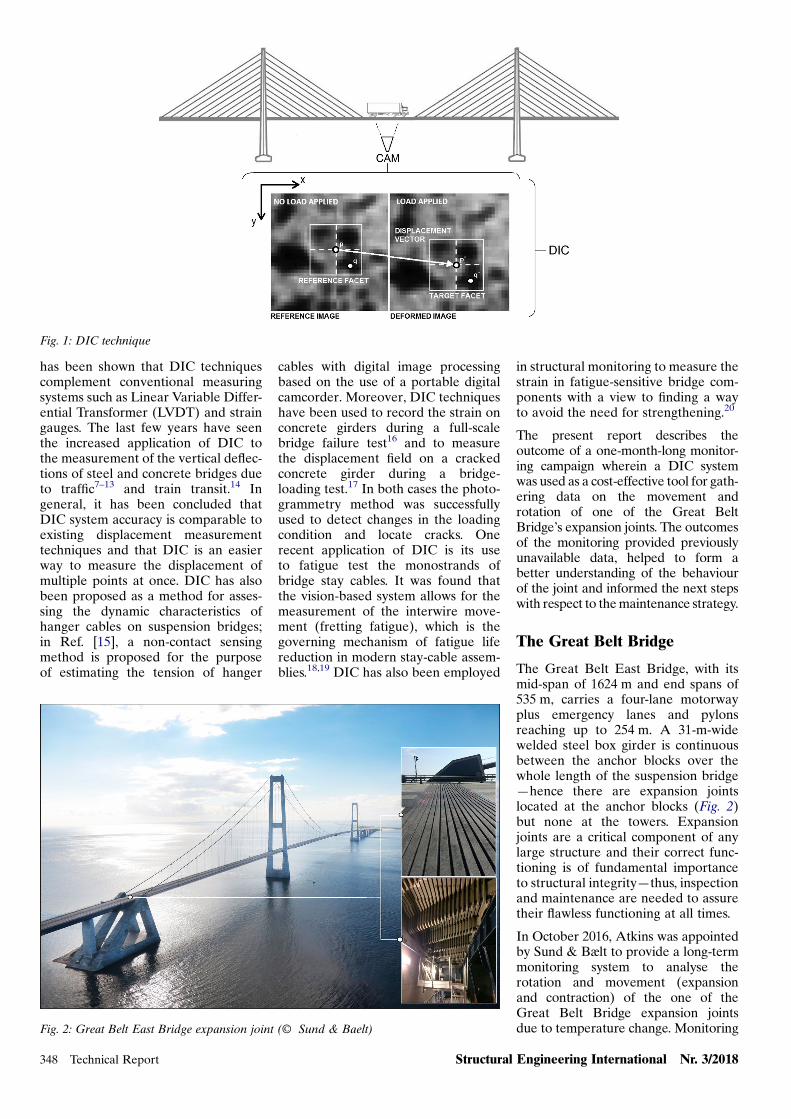
The Great Belt East Bridge, with itsmid-span of 1624 m and end spans of535 m, carries a four-lane motorwayplus emergency lanes and pylonsreaching up to 254 m. A 31-m-widewelded steel box girder is continuousbetween the anchor blocks over thewhole length of the suspension bridge—hence there are expansion jointslocated at the anchor blocks (Fig. 2)but none at the towers. Expansionjoints are a critical component of anylarge structure and their correct func-tioning is of fundamental importanceto structural integrity—thus, inspectionand maintenance are needed to assuretheir flawless functioning at all times.
In October 2016, Atkins was appointedby Sund & Bælt to provide a long-termmonitoring system to analyse therotation and movement (expansionand contraction) of the one of theGreat Belt Bridge expansion jointsdue to temperature change. Monitoring
Fig. 1: DIC technique
Fig. 2: Great Belt East Bridge expansion joint (© Sund & Baelt)
348 Technical Report Structural Engineering International Nr. 3/2018

was undertaken during the course of aone-month period (November–Decem-ber 2016). The long-term DIC monitor-ing system was designed and set upwithin three weeks; it was remotely con-trolled via LAN connection from theAtkins office and the scope of workcomprised of the synchronized monitor-ing of the movement and rotation ofone of the edge beams.
The expansion joint is an assemblycomprised of centre beams and edgebeams that run parallel to the struc-tural edges (Fig. 3a). In order toavoid material fatigue, the trafficloads are transmitted to the adjoiningreinforced concrete structure viaanchor plates, which are rigidly con-nected to the edge beams. Dependingon the degree of movement, numerouscentre beams are arranged betweenthe edge beams. The beams slide on
obliquely arranged swivelling supportbars that rest on elastic sliding bearings(Fig. 3b). The monitoring data describethe movement and rotation of theselected edge beam.
Measurement Methodology
A synchronized camera system with aselection of lenses was designed toprovide sufficient resolution fortaking measurements. The system wasset up to capture the movement androtation of the selected expansionjoint periodically (every 30 min). Thecamera location varied dependingupon the measurement requirements.Normalized greyscale correlationtracking algorithms were used for theimage analysis. The camera wasmounted on a steel plate designed toprovide the required field of view. Cali-bration was achieved by measuring
distances within the image, whichallowed the bridge component (theexpansion joint) to be defined in realunits for measurement purposes. Noediting of the raw data wasundertaken.
Validation and Calibration of theDIC System
Image processing and analysis of theedge beam’s movement was carriedout using a programming language.General validation (cross-checking) ofthe image-based sensors had pre-viously been conducted by theauthor.18 Calibration is a measuringprocess during which the coordinatesframe of the image pixels is adjustedsuch that dimensional consistency isensured. The field of view (the areaof the structure captured by thecamera) was treated as a grid of
Fig. 3: Expansion joint (a) top view and (b) front view. (Units: mm)
Structural Engineering International Nr. 3/2018 Technical Report 349

discrete elements and the calibrationwas carried out by specifying real-world distances between points in animage. The relevant distances weretaken from the bridge design drawings.The locations of interest in a field ofview are described as a system of con-tinuously varying coordinates.
Measurement Location andDIC Set-Up
DIC monitoring was carried out onone of the edge beams (Fig. 4a).
The camera gathering the data onmovement was set up perpendicularto the beam and the camera gather-ing the data on rotation was set upalong the beam length; both fieldsof view are shown in Fig. 4. TheDIC system allowed for the simul-taneous monitoring of all move-ments, deformations and rotationsinduced by temperature differencesand was remotely controlled fromthe Atkins office via LAN through-out the entire course of the monitor-ing period.
Results
This section presents the outcomes ofthe long-term DIC monitoring ofmovement and rotation performed onthe selected edge beam. The DICdata are presented together with therelevant temperature readingsobtained from the Danish Meteorolo-gical Institute (DMI).
Edge Beam Rotation and Movement
Figure 5 presents the combined move-ment and rotation measurements ofthe selected edge beam and the corre-sponding temperature data. It can beseen that there is good agreementbetween the data obtained from theDIC system (Fig. 5a) and the tempera-ture data received from the DMI(Fig. 5b). Within one day, the increasesand decreases in temperature were fol-lowed by movement of the expansionjoint under examination. A very highresolution of 0.01° was achieved forthe DIC rotation measurements, andthe DIC data show that the beamexperienced a maximum daily rotationof 1.05°. The data also indicate that thebeam is both moving and rotating atthe same time.
Statistical Analysis andProbabilistic Considerations
The following section presents thestatistical analysis performed on thecollected data with a view to estab-lishing a mathematical model whichrelates air temperature to expansionjoint deformation. The proposed
Fig. 4: (a) Location of DIC measurement area; (b) edge-beam movement; (c) edge-beamrotation
Fig. 5: Data for the one-month-long monitoring of the Great Belt Bridge: (a) DIC data on the movement and rotation of the selected edgebeam; (b) DMI temperature data
350 Technical Report Structural Engineering International Nr. 3/2018

model for the movement of expansionjoint beams based on temperature isexpressed using the followingequations:
M(t, Dt6h) = mm(t)+ f (Dt6h) (3)
mm(t) = 4.302 · t − 33.61 (4)
f (Dt6h) = 4.99 · Dt6h − 0.161 (5)
where t is the temperature, mm(t) isthe mean movement trend andf (Dt6h) is the mean offset from mm(t).
The mean movement trend, mm(t), iscomputed from the observations
collected over the one-month periodand shows an approximate averagemovement at a given temperature. Alinear equation was chosen, as thedifference between the goodness-of-fit R2 of a second-order polynomialto a linear equation is small:(R2
linear = 0.401 andR2second = 0.406).
A statistical analysis was performed onthe deviation between the actualmeasurements and the movementtrend mm(t). Figure 6 shows a histo-gram of the deviation, together withthe fitted normal distribution. Iffurther probabilistic analysis isdesired (e.g. a Monte Carlo simulationfor fatigue analysis) then the randomvariable accounting for the deviationshould be added to the mean trendmm(t). The variable has a normal distri-bution with a mean value of 0.00 mmand a standard deviation of 12.16 mm.
The effect of temperature change onthe measured movements in relationto the mean trend was analysed.Figure 7 illustrates the correlationbetween the temperature changes andthe measured movement in relationto mm(t), where Dt6h is defined as thetemperature change over a period of6 h (the difference between the temp-erature at a certain hour and the temp-erature 6 h earlier).
Figure 8 shows the proposed modelM(t, Dt6h) (plotted considering 95%confidence intervals) together withthe monitoring data. The correlationbetween the model and the measureddata is 77%. The daily peak move-ments are shown in Fig. 8 and a statisti-cal analysis was performed. If anextreme value analysis is desired, themean value of the daily extremes isestimated as 11.96 mm with a standarddeviation of 9.29 mm. AGumbel distri-bution (which is independent of temp-erature) can then be assumed formodelling the daily peak movement.
Conclusions
In October 2016, Atkins was appointedby Sund & Bælt to provide a long-termmonitoring system for analysing themovement and rotation of one of theGreat Belt Bridge’s expansion jointsdue to temperature change, and aDIC system was chosen as a cost-effec-tive tool for gathering the data. Thelong-term DIC monitoring system,which was designed and set up withinthree weeks, was remotely controlledvia LAN connection from the Atkins
Fig. 6: Analysis of the measured data offset in relation to mm(t)
Fig. 8: The proposed model M(t, Dt6h) against measured data and peak movements
Fig. 7: Correlation of temperature changes with the measured movement in relation to mm(t)
Structural Engineering International Nr. 3/2018 Technical Report 351

office. The monitoring project wasdelivered on time and on budget,despite a very tight time-frame.
The monitoring project provided pre-viously unavailable data, helped tobetter understand the behaviour of theexpansion joint and informed the nextsteps of the maintenance strategy.There is good agreement between thedata collected using the DIC methodand the temperature data receivedfrom the DMI. A mathematical modelwas formulated based on the collecteddata which relates the air temperatureto expansion joint deformation. Thismodel can be used for further probabil-istic analysis and allows for the real-time evaluation of monitoring dataand the cost-efficient identification ofproblems in the functioning of expan-sion joints. To the authors’ knowledge,this is one of the first applications ofDIC technology to the long-term moni-toring of a suspension bridge.
Acknowledgements
Atkins SNC Lavalin would like to acknowl-edge excellent collaboration with Sund &Bælt throughout the entire time of theproject.
References
[1] Berfield TA, Patel JK, Shimmin RG, BraunPV, Lambros J, Sottos NR. Micro- and nanoscaledeformation measurement of surface andinternal planes via digital image correlation.Exp. Mech. 2007; 47(1): 51–62.
[2] Jiang R, Jauregui DV, White KR. Close-range photogrammetry applications in bridgemeasurement: literature review. Measurement2008; 41(8): 823–834.
[3] Jauregui DV, White KR, Woodward PE,Leitch KR. Non contact photogrammetricmeasurement of vertical bridge deflection.J. Bridge Eng. 2003; 8(4): 212–222.
[4] Bales FB. Close-range photogrammetryfor bridge measurement. Transportation ResearchRecord, Washington, DC, 1985; 950: 39–44.
[5] Li JC, Yuan BZ. Using vision technique forbridge deformation detection. Proc.,International Conference on Acoustic, Speechand Signal Processing, New York, 1988; 912–915.
[6] Johnson GW. Digital close-range photogram-metry – a portable measurement tool for publicworks. Proc., 2001 Coordinate MeasurementSystems Committee Conf., CoordinateMeasurement Systems Committee, 2001.
[7] De Roover C, Vantomme J, Wastiels J,Taerwe L. Deformation analysis of a modularconnection system by digital image correlation.Exp. Tech. 2002; 26(6): 37–40.
[8] Lee JJ, Shinozuka M. A vision-based systemfor remote sensing of bridge displacement.NDT&E Int. 2006a; 39(5): 425–431.
[9] Lee JJ, Shinozuka M. Real-time displace-ment measurement of a flexible bridge usingdigital image processing techniques. Exp. Mech.2006b; 46(1): 105–114.
[10] Santini-Bell E, Brogan P, Lefebvre P,Peddle J, Brenner B, Sanayei M. Digitalimaging for bridge deflection measurement of asteel girder composite bridge. TransportationResearch Board (TRB 90th Annual Meeting),Washington, DC, USA, 2011.
[11] Chiang C, Shih M, Chen W, Yu C.Displacement measurements of highwaybridges using digital image correlation methods.Proc. SPIE – Int. Soc. Opt. Eng. 2011; 8321(1):83211G–6.
[12] Yoneyama S, Ueda H. Bridge deflectionmeasurement using digital image correlationwith camera movement correction. Mater.Trans. 2012; 53(2): 285–290.
[13] Yoneyama S, Kitagawa A, Iwata S, Tani K,Kikuta H. Bridge deflection measurement usingdigital image correlation. Exp. Tech. 2007; 31(1): 34–40.
[14] Busca G, Cigada A, Mazzoleni P, Zappa E,Franzi M. Cameras as displacement sensors toget the dynamic motion of a bridge: performanceevaluation against traditional approaches. Proc.,6th International Conference on Bridge mainten-ance, Safety and Management (IABMAS 2012),Stresa, Italy, 2012.
[15] Kim S, Kim N. Dynamic characteristics ofsuspension bridge hanger cables using digitalimage processing. NDT &E Int. 2013; 59:25–33.
[16] Sas G, Blanksvärd T, Enochsson O,Täljsten B, Elfgren L. Photographic strain moni-toring during full-scale failure testing ofÖrnsköldsvik bridge. Struct. Health Monit.2012; 11(4): 489–498.
[17] Küntz M, Jolin M, Bastien J, Perez, F, Hild F.Digital image correlation analysis of crack behaviorin a reinforced concrete beam during a load test.Can. J. Civ. Eng. 2006; 33(11): 1418–1425.
[18] Winkler J, Fischer G, Georgakis CT.Measurement of local deformations in steelmonostrands using digital image correlation.J. Bridge Eng. (ASCE) 2014; 19(10).
[19] Winkler J, Georgakis CT, Fischer G, WoodS, Ghannoum W. Structural response of a multi-strand stay cable to cyclic bending load. J.Struct. Eng. Int. 2/2015 2015. doi:10.2749/101686614X14043795570138
[20] Winkler J, Hendy C. Improved structuralhealth monitoring of London’s docklands lightrailway bridges using digital image correlation.Struct. Eng. Int. 2017; 27(3): 435–440.
352 Technical Report Structural Engineering International Nr. 3/2018