innovative eco-logical research: highlights of the ... · transportation research board (trb) •...
TRANSCRIPT

Innovative Eco-Logical Research: Highlights of the Upcoming Transportation
Research Board (TRB) Annual Meeting
Presenters • Todd Lickfett, U.S. Fish and Wildlife
Service • Mehmet Egemen Ozbek, Ph.D., Colorado
State University • Mike Culp, Federal Highway
Administration (FHWA), Office of Natural Environment
Thursday, January 12, 2012 2:00 – 3:30 PM Eastern
Moderated by: Mary Gray, FHWA Office of Project Development and Environmental Review

Transportation Research Board (TRB) • One of six major divisions of the National Research Council
• 91st Annual Meeting: January 22-26, 2012, Washington, D.C.
• Mission: “To provide leadership in transportation innovation and progress through research and information exchange, conducted within a setting that is objective, interdisciplinary, and multimodal.”
• Services: • Information exchanges • Research and related
programs
• Policy analyses and
recommendations • Publications
www.trb.org

• Addresses challenges in planning for ecosystems and infrastructure: – Duplication of efforts – Uncertainty and lack of predictability – Results: piecemeal mitigation
Eco-Logical: An Ecosystem Approach to Developing Infrastructure Projects
3
Ecological Session at TRB
Enabling Planning-Level Ecological Decision Making Monday Jan 23, 1:30 pm - 3:15 pm Hilton, Connecticut Ave. DC • US Fish and Wildlife Service LEAP and
NiSource • US Army Corps of Engineers Watershed
Investment Tools • USEPA/USGS National Atlas of Sustainability
Measures • California Statewide Advance Mitigation
Initiative

TRB Strategic Highway Research Program (SHRP 2) Integration of Conservation, Highway Planning, and
Environmental Permitting
Using an Outcome-Based Ecosystem Approach 1. Integrated Ecological Framework 2. Agency specific integrated approach to
conservation and transportation planning Through Development of an Outcome-Based Ecosystem-Scale Approach and Corresponding Credit System 1. Cumulative Effects and Alternatives Analysis 2. Regulatory Assurances 3. Ecosystem Crediting

Ecosystem-Based Decisionmaking
Led by FHWA Led by TRB
Implementation/ Delivery
Tested through FHWA Grant Program
SHRP2 C06 Eco-Logical Program
Developed in support of/to learn more about
Tested through C21 Pilots
TRB to support tools or pilots based on tools based on C06 outputs in coordination with FHWA
Integration of C06 strategically into the Eco-Logical program

Questions?
Eco-Logical: http://www.environment.fhwa.dot.gov/ecological/eco_entry.asp Eco-Logical Webinar Series: http://www.environment.fhwa.dot.gov/ecological/eco_webinar_series.asp

USFWS Landscape-scale Energy Action Plan (LEAP)
Presentation on Online Information Systems and Data Tools for Eco-Logical Decision-making
January 12, 2012
Todd Lickfett
R6 Ecological Services [email protected]

Avoid, minimize, and mitigate impacts to Trust Resources by providing biologists and planners with information, analyses, and decision support tools to inform project siting early in the planning process
LEAP Objectives
www.fort.usgs.gov
www.wired.com
LEAP products: Landscape-scale Vulnerability Assessments (LVAs) Trust Resource Lists & Information Policy Information Conservation Frameworks (Internal Document) Conservation Measure Reports Report Builders (Biological Assessments etc.) LEAP Data Portal @ USGS ScienceBase

DRAFT LEAP Landscape Vulnerability Assessment (LVA)
Conservation Value & Landscape Condition
Predicted Landscape Change
Landscape Vulnerability Assessment
f (Value, Change)
Low Value, Change Likely
High Value, Change Likely
Low Value, Change
Less Likely
High Value, Change
Less Likely
Conservation Value (weighted by condition)
Low Value
High Value
Conservation Value (weighted by condition)
Change Likely
Change Less Likely
Pred
icte
d
Cha
nge
Pred
icte
d
Cha
nge
Landscape Context
Priority Conservation Areas
Listed/Other Species of Concern
Condition Model
Climate Change Effects
Exploitable Resources
Planned/Proposed Development
Build-out Models

LEAP Integration with IPaC
Conservation Measure Reports
-provide species/project-specific BMPs Landscape-scale Vulnerability Assessments
-maps delivered through interactive mapper -project area “scores” for comparison -list of LVA elements -links to LEAP Data Portal
Trust Resource Lists
-expanded to include non-listed Trust species (migratory birds, raptors)
LEAP products will be delivered to the public through the ECOS-IPaC system

LEAP Data Portal @ USGS ScienceBase
Searchable catalog of spatial data Integrates with other data management platforms LEAP assessment data: LVA data bundles Data processing scripts Documentation Other data themes: Species Distribution & Range Land Use/Land Cover Land Ownership & Protection Landscape Context & Metrics Current Development & Disturbance Proposed Development Predictive Models
www.earthmatturs.info
Wyoming Toad, Bufo baxteri (Endangered)

Applications to Transportation Planning
LEAP products will facilitate the Eco-Logical approach by providing information for landscape-scale decision-making
-where to site projects -what resources will be affected -how to avoid, minimize, and mitigate impacts
Enhanced coordination with FWS Faster project delivery More efficient use of $$ Improved conservation
www.dipity.com/ctownsley
Highway 40, under construction in Vallejo, California, in 1958.

LEAP Status Wyoming pilot completion in 2012
-expand to include all R6 (MT, WY, CO, UT, ND, SD, NE, KS)
Opportunities for cooperation with FWS
-data sharing & collection -peer-review of spatial analyses -partnerships
2012 TRB Annual Meeting
Session 331: Enabling Planning-Level Ecological Decision Making: Recent Progress in the Development of National Online Information Systems and Environmental Performance Measures
Monday, January 23, 1:30 – 3:15PM @ Hilton
LEAP Contacts:
Todd Lickfett [email protected]
Pam Repp

A Quantitative Decision-making Framework to Evaluate Environmental Commitment Tracking Systems for the Colorado Department of Transportation
Eco-Logical Webinar Series
January 12, 2012
Presentation based on: TRB Paper 12-1533 and
CDOT Research Report 2011-13
Mehmet E. Ozbek, Ph.D. Assistant Professor and Graduate Program Coordinator Department of Const Mang. Colorado State University
Caroline M. Clevenger, Ph.D. Assistant Professor Department of Const. Mang. Colorado State University

Background
• Environmental commitments are actions that are intended to avoid, minimize, or mitigate environmental impacts of a project
• Environmental commitments are required as conditions of project
approval during the environmental review process • The purpose of an Environmental Commitment Tracking System (ETS)
is to provide a means of tracking the status of environmental commitments as well as maintaining necessary information tied to those commitments
• Implementation of an effective ETS can provide the means necessary to demonstrate to all stakeholders that commitments have been met

Research Need and Purpose
• NEED: – Colorado Department of Transportation’s (CDOT) need
to adopt an ETS to implement statewide • PURPOSE:
– To evaluate the ETSs used by a number of state DOTs to determine which ETS would be the most beneficial for long-term implementation at CDOT

Research Approach A quantitative decision-making framework was developed consisting of four steps:
Step 1- Conduct interviews with stakeholders to identify the features that CDOT prefers to have in its ETS
Step 2 - Assign weights to those features to establish their importance relative to each other based on CDOT’s preferences using a rigorous quantitative method (i.e., Analytic Hierarchy Process)
Step 3 - Collect data from eight state DOTs through surveys to identify which features their ETSs have
Step 4 - Perform a quantitative evaluation of those ETSs according to the features preferred by CDOT and their respective weights to assign a quantitative score to each state DOT’s ETS
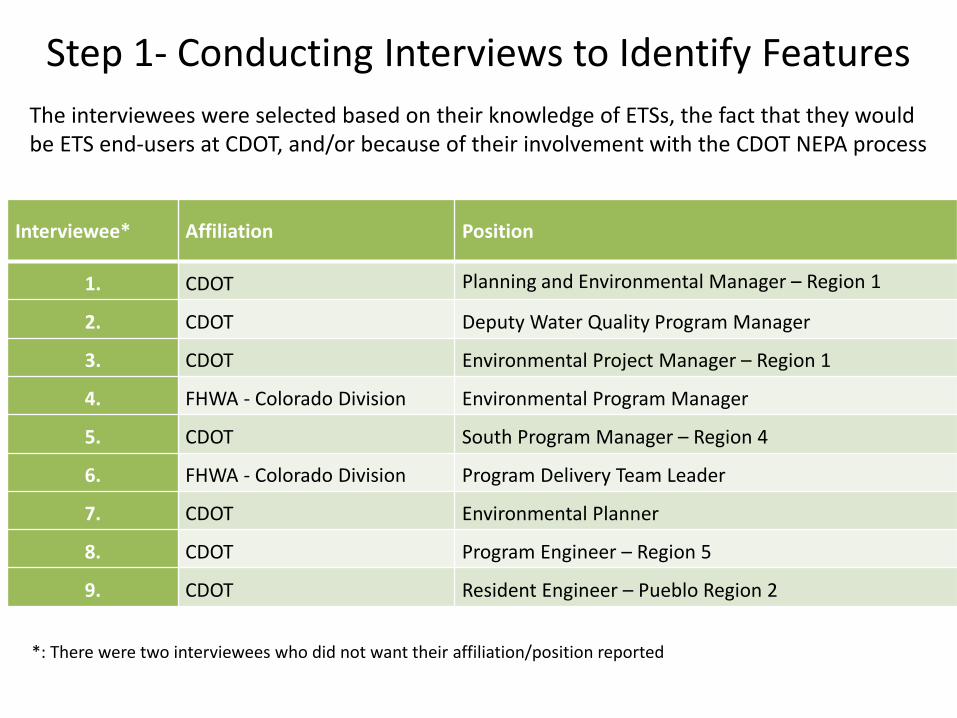
Step 1- Conducting Interviews to Identify Features
Interviewee* Affiliation Position
1. CDOT Planning and Environmental Manager – Region 1
2. CDOT Deputy Water Quality Program Manager
3. CDOT Environmental Project Manager – Region 1
4. FHWA - Colorado Division Environmental Program Manager
5. CDOT South Program Manager – Region 4
6. FHWA - Colorado Division Program Delivery Team Leader
7. CDOT Environmental Planner
8. CDOT Program Engineer – Region 5
9. CDOT Resident Engineer – Pueblo Region 2
The interviewees were selected based on their knowledge of ETSs, the fact that they would be ETS end-users at CDOT, and/or because of their involvement with the CDOT NEPA process
*: There were two interviewees who did not want their affiliation/position reported

1) Allow external stakeholders to input/edit information: ETS allows for external project stakeholders (e.g., agencies like FHWA, contractor, etc.) to input/edit information in the tracking system for those projects which they are involved with. 2) Control which CDOT employees can view information: ETS has the capability to assign permissions to a select group of CDOT employees allowing only them to view tracking data for a given project. 3) Document Management: ETS has the capability to manage documents (i.e., storing and linking related documents such as word and pdf files for easy retrieval and/or versioning control). 4) GIS compatible: ETS has the capability of integrating with GIS. … 18) Sort and filter data: Users can find and view only the commitments and permits that are relevant to a particular person or project.
Step 1- Conducting Interviews to Identify Features

Step 2- Assigning Weights to Features • A well-structured quantitative multi-criteria decision analysis method, Analytic Hierarchy
Process (AHP), was utilized • Pairwise comparisons between two elements at a time: “Which of the two is more
important, and how much more important is it?” • Once all comparisons are made, mathematical computations (based on matrix
algebra) are performed to assign weights to those elements • AHP also requires the calculation of the consistency ratio (C.R.). C.R. is a measure to
identify how consistent the participant was
• 18 features 153 pairwise comparisons performed by six respondents • C.R. of the group=0.028 (<0.10 is acceptable)
9 7 5 3 1 9 7 5 3
Very Strong Importance
Extreme Importance Equal
Strong Importance
Moderate Importance
Extreme Importance
Moderate Importance
Strong Importance
Very Strong Importance
GIS compatible
Document Management

Metric Weight Track deleted or modified commitments 0.1468 Track permits 0.1406 Standard Reports 0.0979 Sort and filter data 0.0975 Generate notifications 0.0693 Document Management 0.0537 GIS compatible 0.0526 Control which CDOT employees can input/edit information 0.0495 Integrate with ProjectWise 0.0432 Store data in a single centralized file 0.0395 Differentiate between CAT X, EA, & EIS 0.0371 Web based 0.0368 Allow multiple CDOT employees to input/edit information 0.0361 Integrate with SharePoint 0.0269 Allow ALL CDOT employees to view information 0.0208 Allow external stakeholders to view information 0.0194 Control which CDOT employees can view information 0.0170 Allow external stakeholders to input/edit information 0.0153
Step 2- Assigning Weights to Features

Step 3- Collecting Data from State DOTs about their ETSs
Features
Col
orad
o
(CDO
T)
Calif
orni
a
(Cal
tran
s)
Flor
ida
(F
DOT)
Kent
ucky
(K
YTC)
New
Yor
k (N
YSDO
T)
Tenn
esse
e (T
DOT)
Te
xas
(TxD
OT)
Vi
rgin
ia
(VDO
T)
Was
hing
ton
Sta
te
(WSD
OT)
Track deleted or modified commitments X X X X X X X Track permits X X X X X X X X Standard Reports X X X X X X X X Sort and filter data X X X X X X X X Generate notifications X X X X X
Document Management X X X X X GIS compatible X X
Control which DOT employees can input/edit information X X X X X X X X Integrate with ProjectWise
Store data in a single centralized file X X X X X X Differentiate between CAT X, EA, & EISs X X X X X X X X Web based X X X X X X
Allow multiple DOT employees to input/edit information X X X X X X X Integrate with SharePoint X
Allow ALL DOT employees to view information X X X X X X Allow external stakeholders to view information X X
Control which DOT employees can view information X X X X X X X X
Allow external stakeholders to input/edit information X X

Technical Features Col
orad
o
(CDO
T)
Calif
orni
a
(Cal
tran
s)
Flor
ida
(F
DOT)
Kent
ucky
(K
YTC)
New
Yor
k (N
YSDO
T)
Tenn
esse
e (T
DOT)
Texa
s (T
xDO
T)
Virg
inia
(V
DOT)
Was
hing
ton
St
ate
(WSD
OT)
Track deleted or modified commitments 0.1468 0.1468 0.1468 0.1468 0.1468 0.1468 0.1468 Track permits 0.1406 0.1406 0.1406 0.1406 0.1406 0.1406 0.1406 0.1406 Standard Reports 0.0979 0.0979 0.0979 0.0979 0.0979 0.0979 0.0979 0.0979 Sort and filter data 0.0975 0.0975 0.0975 0.0975 0.0975 0.0975 0.0975 0.0975 Generate notifications 0.0693 0.0693 0.0693 0.0693 0.0693
Document Management 0.0537 0.0537 0.0537 0.0537 0.0537 GIS compatible 0.0526 0.0526 Control which DOT employees can input/edit information
0.0495 0.0495 0.0495 0.0495 0.0495 0.0495 0.0495 0.0495
Integrate with ProjectWise
Store data in a single centralized file 0.0395 0.0395 0.0395 0.0395 0.0395 0.0395 Differentiate between CAT X, EA, & EISs .0371 0.0371 0.0371 0.0371 0.0371 0.0371 0.0371 0.0371 Web based 0.0368 0.0368 0.0368 0.0368 0.0368 0.0368 Allow multiple DOT employees to input/edit information
0.0361 0.0361 0.0361 0.0361 0.0361
0.0361 0.0361 Integrate with SharePoint 0.0269 Allow ALL DOT employees to view information 0.0208 0.0208 0.0208 0.0208 0.0208 0.0208 Allow external stakeholders to view information 0.0194 0.0194 Control which DOT employees can view information 0.0170 0.0170 0.0170 0.0170 0.0170 0.0170 0.0170 0.0170 Allow external stakeholders to input/edit information
0.0153
0.0153
TOTAL 0.34 0.66 0.93 0.72 0.48 0.57 0.85 0.90 0.76 Ranking 9 6 1 5 8 7 3 2 4
Step 4- Quantitative Evaluation of ETSs

Conclusions and Future Research • Recommend further exploration of
• FDOT’s ETS (supports 93% of CDOT’s preferences) • VDOT’s ETS- 90% • TxDOT’s ETS- 85% • CDOT’s existing ETS- 34%
• The analysis and recommendations are intended to minimize ETS development costs and
ultimately to provide CDOT with an effective, efficient, and reliable ETS to track environmental commitment completion on projects
• The quantitative decision-making framework can be used by any state DOT. The implementation of the framework requires a minimal amount of resources, mainly in the form of time commitment
• Future research should investigate: • Ease of use • User satisfaction • First cost and Operational cost

Please hold all questions until the end of the webinar.
ACKNOWLEDGMENT The research work described herein has been funded by CDOT. The opinions and findings are those of the authors and do not necessarily represent the views of CDOT. Authors would like to thank the CDOT Study Panel members and interview participants for their invaluable suggestions and contributions to this research.

FHWA’s Sustainable Highways Self-
Evaluation Tool (INVEST)
Mike Culp Team Leader, Sustainable Transport and Climate Change Team
Office of Planning, Environment & Realty
Eco-Logical Webinar January 12, 2012

What is a Sustainable Highway System?
• Satisfies functional requirements – Fulfills transportation goals and
needs – Addresses development and
economic growth • Avoids, minimizes, reduces
impacts – Environment – Consumption of resources
• Addresses environmental, economic, and social equity dimensions (triple bottom line)
• Sustainability addressed throughout the project lifecycle

Sustainability and the Project Lifecycle
• For sustainability to be fully integrated into highway and transit programs, it must be considered throughout the project lifecycle
• Must address sustainability from planning through operations

Examples of Sustainable Practices • System Planning
– Integrated Planning – Mitigation banking – Fiscal planning
• Project Development – Cost Benefit Analysis – Construction Equipment
Emission Reduction – Recycling and Reuse of
materials
• Operations and Maintenance – Strong asset management – Roadside vegetation
management – Infrastructure maintenance

Sustainability and FHWA
• Deliver Federal Aid Highway Program in a more sustainable way
• Make wise investment decisions w/ limited resources • Take advantage of opportunities to include
sustainability throughout the decision making process • Encourage change in professional practice • Stress more sustainable practices, get them to be
applied/implemented • Go beyond compliance • Seek Balanced solutions

Overview of INVEST
• Voluntary Web-based Tool • Lists “sustainable criteria” based on best practices
for three project phases: – Systems Planning (SP) – Project Development (PD) – Systems Management, Operations and Maintenance
(OM) • Each criterion assigned a points based on expected
sustainability impact • In coordination with ASCE/ACEC/APWA effort

INVEST Goals
• Encourage sustainable highway practices – Internal improvement – External recognition
• Help agencies measure sustainability and quantify tradeoffs
• Provide a framework for communicating with stakeholders about sustainability
• Establish a method for evaluating sustainable highway systems, projects, programs

Support for Eco-Logical Principals
• Encourages integrated planning, PEL approaches
• Promotes engagement of resource and regulatory agencies
• Encourages links b/n planning and project decision making

System Planning Criteria SP-1 Integrated Planning: Land Use
and Economic Development SP-2 Integrated Planning: Natural
Environment SP-3 Integrated Planning:
Community SP-4 Accessibility SP-5 Safety Planning SP-6 Multimodal Transportation SP-7 Freight Planning SP-8 Travel Demand Management
SP-9 Air Quality SP-10 Energy and Fuels SP-11 Financial Sustainability SP-12 Analysis Methods SP-13 Congestion Management SP-14 Linking Asset Management and
Planning SP-15 Linking Planning and NEPA SP-16 Infrastructure Resiliency

SP-2 Integrated Planning: Natural Environment Goal Integrate ecological considerations into long range transportation plans
(LRTP), corridor plans, and the TIP/STIP process. Proactively support and enhance sustainable ecological function through the coordination of transportation and natural resource planning.
Points 1-10 Points
Requirements 3 points. Develop and adopt policies that encourage metropolitan or statewide transportation planning to incorporate ecological considerations into transportation plans and the planning process. 3 points. Develop institutional mechanisms that engage natural resource and regulatory agencies regularly in creating plans and programs (e.g. technical advisory committees). 4 points. Assemble data on natural resources and apply system or landscape scale evaluation techniques (e.g. the Eco-Logical Ecosystem Approach/Regional Ecosystem Framework ) to assess ecological conditions and avoid and/or minimize potential impacts of planned transportation projects to the natural environment.

SP-15 Linking Planning and NEPA Goal Incorporate planning documents and decisions from the transportation
planning process into the environmental review process.
Points 2 - 10 points
Requirements 2 points. The Agency has a program to consult with NEPA practitioners throughout the system-level planning process to ensure the material produced 1) Can be incorporated into subsequent NEPA documents in accordance with FHWA and CEQ regulations; 2) Will aid in establishing or evaluating the purpose and need of the projects, reasonable alternatives, impacts on the built and natural environment, or mitigation measures, and 3) Is in a form that is accessible during the NEPA scoping process and can be appended or referenced in the NEPA document. 4 points. Agency has documented procedures for linking the system-level planning process with NEPA. 4 points. Agency successfully incorporates analysis, decisions, and documents from the system-level planning process on specific NEPA projects. The planning studies can produce analyses and decisions for FHWA review and consideration.

www.sustainablehighways.org

• Pilot Testing – PD criteria – done – OM criteria – complete in January 2012 – SP criteria – complete in February 2012
• Weighting & Scoring review - ongoing • Updates to Website - ongoing • Version 1.0 Release – Spring 2012
Next Steps for INVEST

Pilots

www.sustainablehighways.org
Thank You!
FHWA Sustainable Highways Team:
Michael Culp [email protected]
Connie Hill [email protected]
Heather Holsinger [email protected]