innovative approaches for the clinico … · abstract (italian version) 5 frequenti negli ultimi...
TRANSCRIPT
UNIVERSITA’ DEGLI STUDI DI MILANO
PhD Course in Veterinary and Animal Science
Class XXIX
INNOVATIVE APPROACHES
FOR THE CLINICO-PATHOLOGICAL DIAGNOSIS
OF FELINE INFECTIOUS PERITONITIS
AND FELINE CORONAVIRUS INFECTION
PhD Candidate: Angelica Stranieri
R10485
Tutor: Prof. Saverio Paltrinieri
Academic Year 2016-2017

1
Abstract ................................................................................................................................................. 3
Abstract (italian version) ........................................................................................................................ 4
List of Publications ................................................................................................................................. 6
SCIENTIFIC BACKGROUND ...................................................................................................................... 8
Introduction ........................................................................................................................................... 9
Feline coronavirus ................................................................................................................................ 10
Feline infectious peritonitis .................................................................................................................. 14
Role of FCoV mutations ............................................................................................................................... 14
Epidemiology, shedding and transmission .................................................................................................. 17
Pathogenesis of FIP...................................................................................................................................... 18
Pathological findings.................................................................................................................................... 20
Clinical and diagnostic features ................................................................................................................... 22
Hematology and serum biochemistry ......................................................................................................... 23
Analysis of effusions .................................................................................................................................... 24
Serology ....................................................................................................................................................... 25
Viral detection ............................................................................................................................................. 25
FIP management .......................................................................................................................................... 26
Therapies ................................................................................................................................................. 26
Prevention ............................................................................................................................................... 27
AIMS.................................................................................................................................................... 29
Aims of the thesis ................................................................................................................................ 30
Specific aims ................................................................................................................................................ 30
DESCRIPTION OF STUDIES I-VI............................................................................................................... 32
I. High diagnostic accuracy of the Sysmex XT-2000iV delta total nucleated cells on effusions for feline
infectious peritonitis ............................................................................................................................ 33
Material and methods ................................................................................................................................. 33
Results ......................................................................................................................................................... 35

2
Discussion .................................................................................................................................................... 41
II. Diagnosing feline infectious peritonitis using the Sysmex XT-2000iV based on frozen supernatants
from cavitary effusions ......................................................................................................................... 42
Material and methods ................................................................................................................................. 42
Results and discussion ................................................................................................................................. 44
III. Frequency of electrophoretic changes consistent with feline infectious peritonitis in two different
time periods (2004-2009 vs 2013-2014) ................................................................................................ 49
Material and methods ................................................................................................................................. 49
Results ......................................................................................................................................................... 51
Discussion .................................................................................................................................................... 55
IV. Comparison of the diagnostic performances of laboratory tests for the diagnosis of feline infectious
peritonitis ............................................................................................................................................ 58
Material and methods ................................................................................................................................. 58
Results ......................................................................................................................................................... 64
Discussion .................................................................................................................................................... 65
V. Reverse transcriptase loop-mediated isothermal amplification for the detection of feline coronavirus
70
Material and methods ................................................................................................................................. 70
Results and discussion ................................................................................................................................. 72
VI. Feline coronavirus spike protein in cats with and without feline infectious peritonitis .................... 74
Material and methods ................................................................................................................................. 74
VI.1. Feline coronavirus shedding in cats with and without feline infectious peritonitis. ...................... 78
Results and discussion ................................................................................................................................. 78
CONCLUSIONS ...................................................................................................................................... 80
Publications ......................................................................................................................................... 83
References ........................................................................................................................................... 85
Abstract
3
Abstract
Feline infectious peritonitis (FIP) is a deadly disease of felids with a viral and immune-mediated
pathogenesis. The nature of the etiological agent – feline coronavirus, FCoV – and the non specific
clinical presentation make this disease particularly challenging both from a pathogenetic and a
diagnostic point of view. Many aspects still represent an issue, like not knowing the mutation(s)
responsible for the development of FIP, the lack of a gold standard for the diagnosis of FIP in vivo
and the absence of an effective treatment. This thesis was aimed to clarify some of these aspects,
specifically: a novel test on effusions was developed (namely, Δ total nucleated cell count – ΔTNC
– i.e. the ratio between the two white blood cell count provided by the Sysmex XT-2000iV
analyzer) (studies I and II); the frequency of atypical serum protein electrophoresis (SPE) patterns
in cats with FIP, anecdotally reported during our diagnostic activity (study III) was investigated, a
comparison of clinico-pathological and molecular tests for the diagnosis of FIP (study IV) was
performed, a loop isothermal amplification method (LAMP) for the detection of FCoV was
developed(study V) and an investigation on the prevalence of two mutations of the spike (S)
protein gene in a wide number of samples from FIP and non-FIP cats was carried out (this latter
study developed during an externship at the University of Bristol in collaboration with Prof.
Séverine Tasker and Dr. Emi Barker) (study VI). The results of studies I and II demonstrated that
the ΔTNC is a reliable method to support the diagnosis of FIP either on fresh or on frozen
effusions. Study III confirmed that SPE profiles consistent with FIP are less frequent in recent years
than in the past, possibly due to changes in the pathogenic characteristics of the FCoVs. However,
study IV demonstrated that: on blood molecular tests may support a clinical diagnosis of FIP but
none of the test, except the measurement of α1 acid-glycoprotein (AGP) may rule out this disease;
cytology should be preferred on effusions either to exclude or confirm the disease and, on tissues,
S gene sequencing should be preferred when histology is highly consistent with FIP while 3’ UTR
PCR when FIP is less likely; the LAMP method developed in study V may be used to confirm the
presence of FCoVs in the samples but is poorly sensitive and cannot exclude the presence of
FCoVs. Finally, pyrosequencing of FCoV performed in study VI demonstrated the presence of gene
S mutations also in FCoVs from fecal samples. The analysis of sequences recorded in this latter
study, however, is still ongoing and future results may provide new insights on the pathogenesis
and diagnosis of FIP.

Abstract (italian version)
4
Abstract (italian version)
La peritonite infettiva felina (FIP) è una patologia letale dei felidi, a patogenesi virale ed
immunomediata. La propensione dell’agente eziologico alle mutazioni – coronavirus felino, FCoV –
e la sintomatologia spesso aspecifica, rendono questa patologia complessa sia dal punto di vista
diagnostico che patogenetico. Non si è ancora a conoscenza, infatti, della mutazione virale
responsabile della patologia, non esiste ancora un gold standard per la diagnosi intra vitam e non
è ancora disponibile una terapia valida. Lo scopo di questa tesi è di tentare di chiarire alcuni di
questi aspetti. I primi due obiettivi (studio I e II) erano diretti allo sviluppo di un test per la diagnosi
di FIP in forma effusiva. In particolare, è stata valutata l’accuratezza diagnostica del valore
ottenuto dal rapporto tra le due conte leucocitarie fornite dal Sysmex XT-2000iV (Δ total nucleated
cell count – TNCC) su campioni di versamento FIP indotto. Successivamente, è stato valutata la
possibilità di effettuare lo stesso test su surnatanti di versamenti dopo aggiunta di sangue intero
felino, in modo da poter ottenere questo valore su campioni congelati o con risultati dubbi ad altri
esami. Il terzo scopo (studio III) era volto a confermare o smentire la presenza di pattern
elettroforetici atipici in corso di FIP, come registrato nel nostro laboratorio negli ultimi anni. E’
stato quindi svolto uno studio retrospettivo per confrontare pattern elettroforetici in due periodi
di tempo diversi. Il quarto obiettivo (studio IV) si prefissava di valutare l’accuratezza diagnostica di
diversi test, sia clinico patologici che molecolari, per trovare il miglior test o la miglior
combinazione di test per la diagnosi di FIP in vivo. Nello stesso studio è stato anche valutato il
sequenziamento del gene spike (S), ultimamente proposto come discriminante, quando mutato,
tra i due patotipi del FCoV. Il quinto scopo (studio V) era di mettere a punto una metodica
molecolare isotermica (loop isothermal amplification method – LAMP) per il rilevamento del FCoV.
Questa metodica, essendo veloce ed economica, potrebbe facilitare l’identificazione dei gatti
eliminatori del FCoV o, per alcuni campioni, la diagnosi di FIP. Durante il mio percorso di dottorato
ho anche partecipato ad un progetto sotto la supervisione della prof. Séverine Tasker e della
dott.ssa Emi Barker dell’università di Bristol. Questo progetto (studi VI e VI.1) ha lo scopo di
scoprire la vera prevalenza, in un ampio numero di tessuti, fluidi e feci ottenute da gatti affetti e
non affetti da FIP, di due mutazioni del gene spike considerate ultimamente come co-responsabili
della FIP.
Gli studi I e II hanno dimostrato che il ΔTNC può essere usato per diagnosticare la FIP con buona
accuratezza. Lo studio III ha confermato che i pattern elettroforetici tipici di FIP sono meno

Abstract (italian version)
5
frequenti negli ultimi anni, possibilmente per modificazioni nella patogenicità dei FCoVs. Dallo
studio IV si evince che i test molecolari possono confermare la diagnosi di FIP, ma che solo l’AGP
puo’ escluderla; l’esame citologico dei versamenti dovrebbe essere il test di scelta sui versamenti,
mentre sui tessuti il sequenziamento del gene S dovrebbe essere usato per confermare la
diagnosi, mentre la PCR 3’ UTR PCR quando la FIP è meno probabile. La metodica LAMP
sviluppata nello studio V si è rivelata molto specifica ma poco sensibile, dimostrandosi un buon
test per confermare la presenza di FCoV in campioni biologici, ma non per escluderla. Infine, lo
studio VI ha messo in evidenza la presenza di coronavirus mutati anche nelle feci di gatti non
affetti da FIP, mostrando che i successivi progressi in questo studio metteranno in evidenza nuovi
aspetti della patogenesi della FIP.

List of Publications
6
List of Publications
The works presented in this thesis are based on the following publications:
I. Giordano, A., Stranieri, A., Rossi, G., Paltrinieri, S, 2015. High diagnostic accuracy of the Sysmex
XT-2000iV delta total nucleated cells on effusions for feline infectious peritonitis. Veterinary
Clinical Pathology, 44(2): 295-302.
II. Stranieri, A., Paltrinieri, S., Giordano, A., 2016. Diagnosing feline infectious peritonitis using the
Sysmex XT-2000iV based on frozen supernatants from cavitary effusions. Journal of Veterinary
Diagnostic Investigation, E-pub ahead of print. doi: 10.1177/1040638716689115
III. Stranieri, A., Giordano, A., Bo, S., Braghiroli, C., Paltrinieri, S., 2016. Frequency of electrophoretic
changes consistent with feline infectious peritonitis in two different time periods (2004-2009 vs
2013-2014). Journal of Feline Medicine and Surgery, E-pub ahead of print. doi:
10.1177/1098612X16664389.
IV. Stranieri A., Giordano, A., Paltrinieri, S., Giudice, C., Cannito, V., Lauzi, S., 2016. Comparison of the
diagnostic performances of laboratory tests for the diagnosis of feline infectious peritonitis.
Veterinary Record [under review].
V. Stranieri, A., Lauzi, S., Giordano, A., Paltrinieri, S., 2016. Reverse transcriptase loop-mediated
isothermal amplification for the detection of feline coronavirus. Journal of Virological Methods,
243: 105-108. [E-pub ahead of print].
Angelica Stranieri also participated to a project led by Prof. Séverine Tasker and Dr. Emi Barker of
the University of Bristol.
VI. Feline coronavirus spike protein in cats with and without feline infectious peritonitis. Preliminary
results were presented at the fourth international meeting of the International Society for
Companion Animal Infectious Diseases (ISCAID) with the abstract:
VI.1. Barker, E.N., Stranieri, A., Helps, C.R., Porter, E., Davidson, A.D., Day, M.J., Kipar, A., Tasker,
S., 2016. Feline coronavirus shedding in cats with and without feline infectious peritonitis.

List of Publications
7
The contribution of Angelica Stranieri to the listed papers and projects are the following:
I. Took minor part in the laboratory work, had the main responsibility of writing the paper after
revision.
II. Took major part in study design, performed most of the laboratory work (samples collection and
test optimization), interpreted the results together with supervisor and co-authors and had the
main responsibility of writing the paper.
III. Took major part in the study design and in the retrospective analysis of data, interpreted the
results together with supervisor and co-authors, had major part in writing the paper.
IV. Took major part in the study design, performed most of the necropsies and sample collection, RNA
extraction and clinic-pathological analyses. Regarding post mortem analyses, the candidate
prepared the samples for paraffin embedding, assisted the technician for the microtomic sections
preparations and performed immunohistochemistry with the supervision of co-authors. The
candidate also interpreted the results together with supervisor and co-authors and had major part
in writing the paper.
V. Took major part in the study design (primers and work conditions design) and in the laboratory
work (RNA extraction, gel preparation and LAMP experiment with co-authors); interpreted the
results together with supervisor and co-authors and had major part in writing the paper.
VI. Took major part in the sample collection and processing and in the RNA extraction. Took minor
part in the PCR and pyrosequencing and interpreted the results with the supervisors.

SCIENTIFIC BACKGROUND
8
SCIENTIFIC BACKGROUND

Introduction
9
Introduction
It was 1963 when the soon to be known feline infectious peritonitis (FIP), a world-wide spread,
fatal disease of felids, appeared in the scientific milieu as one “important disorder of cats”
(Holzworth, 1963). Even if the etiological agent of this disease was at that time unknown, some of
the characteristics described by the Author are still actual, like the frequent occurrence of FIP in
young cats and the sadly actual lack of any effective treatment (Holzworth, 1963; Pedersen, 2009).
In the following years, a viral etiology was first proposed by Wolfe and Griesemer (1966) and later
experimentally confirmed and ascribed to the feline coronavirus (Zook et al., 1968; Ward, 1970;
Horzinek et al., 1977; Pedersen et al., 1978). Feline Infectious Peritonitis (FIP) is believed to be a
major cause of infectious disease-associated deaths in the feline population (Hartmann, 2005). FIP
was and still is an extensively studied disease but, despite the enormous progresses made, several
aspects about both the pathogenesis and the diagnosis of FIP are still yet to be known, making FIP
one of the most feared as well as challenging disease of felids (Kipar and Meli, 2014; Pedersen,
2014a).

Feline coronavirus
10
Feline coronavirus
Coronaviruses are well known for their impact on both human and animal health, being the
causative agents of diseases like severe acute respiratory syndrome (SARS), middle eastern
respiratory syndrome (MERS), infectious bronchitis in chickens and transmissible gastroenteritis in
pigs (Weiss and Navas-Martin, 2005; Hilgenfeld and Peiris, 2013). Feline coronaviruses (family
Coronaviridae, order Nidovirales) are enveloped, single-stranded positive sense RNA viruses
belonging to the species Alphacoronavirus 1, genus Alphacoronavirus of the sub family
Coronavirinae (Gonzales et al., 2003). Feline coronavirus genome is about 30 kb long and
organized in 11 open reading frames (ORFs) (Figure 1). The majority of the genome is represented
by the two 5’ proximal, overlapping ORF 1a and ORF 1b, which are translated as polyproteins
pp1ab and pp1a by frame-shifting and non frame-shifting mechanisms respectively (Sawicki et al.,
2005; Pedersen, 2014a). These polyproteins include 16 non-structural proteins (nsps) which have
replication associated activities (genome replication, proteolytic processing and multiple
subgenomic mRNA synthesis) and form a membrane-bound replication-transcription complex
through interaction with the endoplasmic reticulum and Golgi apparatus of the infected cell
(Prentice et al., 2004). The remaining 9 ORFs encode for four structural proteins (envelope, E;
membrane, M; nucleocapsid, N and spike, S) and for 5 group-specific, accessory proteins (3a-c,
located between the S and the E genes, and 7a-b, located at the 3’ end of the genome) (Haijema et
al., 2004).
Figure 1. FCoV genome organization. From 1-16 the non structural proteins translated by the ORF1a and 1b
are represented (Lewis et al., 2015).
These proteins are expressed from a set of 3' coterminal subgenomic (sg) mRNAs generated via
discontinuous transcription during subgenome-length minus-strand RNA synthesis (Hagemeijer et
al., 2012). The E, M and S proteins constitute the viral envelope, which surrounds the viral RNA
Feline coronavirus
11
genome in association with the nucleocapsid protein (Li, 2016). The Envelope (E) proteins are
small (around 9 kDa) hydrophobic, non glycosilated viroporins which mainly distribute between
the endoplasmic reticulum and the Golgi apparatus membranes of the infected cell, where they
actively participate in virion assembly, morphogenesis and egress (Dye and Siddell, 2005;
Venkatagopalan et al., 2015). The membrane (M) proteins, despite their low molecular weight
(around 30 kDa), are the most abundant protein in the viral envelope, with three transmembrane
(TM) domains and a conserved overall structure among coronaviruses. Together with the E
proteins, they play important roles in the virions morphogenesis, assembly and budding (Dye and
Siddell, 2005; Ujike and Taguchi, 2015). The nucleocapsid (N) protein has a molecular weight of
around 43 kDa and its primal role is to package the viral RNA in into long, flexible, helical
complexes called nucleocapsids, which are incorporated during the budding process of the viral
infection. It is dynamically associated with the replication-transcription complex and it also plays
an essential role in the viral genome replication and in the sub genomic RNA synthesis (Dye and
Siddell, 2005; Gorbalenya et al.,2006; Verheije et al., 2010; McBride et al., 2014). The N protein is
the most immune-dominant FCoV antigen and several studies demonstrated its potential role in
the protection against FIP, being responsible of a cell-mediated immune response (Hodatsu et al.,
2003; Battilani et al., 2010; Rossi et al., 2011). The spike (S) proteins (160 kDa) are responsible for
the name coronavirus (corona is the latin word for crown), since they form 20 nm long protrusions
that extend from the viral envelope (Bosch et al., 2003; Dye and Siddell, 2005; Li, 2016). They are
class I virus fusion proteins formed by three segments: a large ectodomain composed by a
receptor-binding subunit (S1) and by a membrane-fusion subunit (S2), a single-pass
transmembrane anchor, and a short intracellular tail. The S1 subunit is responsible of binding to
receptors on the host cell surface for the virus entry, while the S2 subunit allows the viral genome
to enter the host cell, through fusion of the host and viral membranes (Li, 2016). Coronaviruses
accessory proteins are thought to be not essential for in vitro replication, but to play essential
roles for virus-host interactions, viral virulence and pathogenesis. To this day, feline coronavirus
accessory proteins exact roles are still unclear (Dedeurwaerder et al., 2013; Liu et al., 2014). The
3a and 3b accessory proteins consist of 71 amino acids (aa) and they probably have intracellular
functions, due to the lack of signal peptides or transmembrane domains. The 3c protein is a class
III triplemembrane spanning protein of 238-244 aa, resembling the M protein of the FCoVS and
the 3a protein of the SARS-CoV (Dedeurwaerder et al., 2013). This protein seems to be necessary
for the survival and replication of the virus in the enteric environment (Chang et al., 2010). The 7a

Feline coronavirus
12
protein is a hydrophobic, well conserved among FCoVs protein of 101 AA. The 7b protein consists
of 207 aa and has showed several single amino acid polymorphisms among FCoV strains. It is
secreted from infected cells and it is probably involved in the modulation of the host immune
response (Herrewegh et al., 1995a; Dedeurwaerder et al., 2013). 7a and 7b proteins appear to be
essential for an efficient replication in vitro as well as for virulence in vivo (Haijema et al., 2004;
Dedeurwaerder et al., 2013). It was also recently showed that the 7a protein could protect the
virus survival acting as a type I interferon (I IFN) antagonist, but it can exert its antagonistic
functions only through the presence of the 3a-c proteins (Dedeurwaerder et al., 2014).
After the S protein-mediated recognition and binding of the virus to the host cell, the coronavirus
envelope must fuse with the target cell membrane in order to release the viral genome in the host
cell cytoplasm (Cavanagh, 2005). This process seems to be mediated by cleavage of the S1/S1
subunits that, in feline coronaviruses, is performed by specific monocytes/macrophages proteases
not yet fully characterized (Licitra et al., 2013). After the entry in the host cell, coronaviruses
induce the formation of membranous structures called double membrane vesicles (DMVs),
described only for SARS-CoV and mouse hepatitis virus (MHV) and in a not still completely
understood manner, on which the replication transcription complex is anchored and the RNA
synthesis occurs (van Hemert et al., 2008; Perlman and Netland, 2009; Hagemeijer et al., 2012).
The replication takes place through RNA-dependent RNA polymerase (RdRp). The genomic
positive-sense RNA is copied into a negative-sense template until it reaches a transcription-
regulation sequence (TRS). At this point, RNA synthesis may either continue or the negative-sense
sgRNA is completed after the relocation of the RdRp to the 5' end of the genome. The synthetized
RNA is then incorporated into the virions on membranes located between the endoplasmatic
reticulum (ER) and the Golgi apparatus (ER-Golgi intermediated compartment: ERGIC) (Hagemeijer
et al., 2012). After the translocation of the RNA and the N protein to the ERGIC and the Golgi
region, where the viral glycoproteins are located, the newly formed virion is released from the
host cell through the budding process (Stertz et al., 2007).
Among the RNA viruses, coronaviruses possess the largest genome and they lack of a proofreading
activity, making mutations easy to occur. Even if mechanisms of “alternative” proofreading have
been experimentally demonstrated (the inactivation of the nsp14, which encodes for an
exonuclease, of SARS-CoV and MHV leads to a 15- to 20-fold increased mutation rates), mutations
do happen and induce some of the most important characteristic of RNA viruses: the ability to
adapt themselves to different environments and to change cell or even host tropism. The result of

Feline coronavirus
13
this process is the formation of quasispecies, which are related but not identical genomes,
subjected to not stopping processes of genetic variations, competition and selection (Denison et
al., 2011; Domingo et al., 2012). The concepts of quasispecies formation and genetic
recombination typical of coronaviruses are important in order to understand feline coronaviruses
behavior and their subdivision in two serotypes (FCoV I and FCoV II) as well as in two pathotypes
(feline enteric coronavirus, FECV; feline infectious peritonitis virus, FIPV). The two FCoV serotypes
can, in fact, be recognized based on their link with canine coronavirus (CCoV). Virus-neutralizing
antibody reactions and comparison of amino acid sequences of the spike protein demonstrated
that the FCoV II is the result of a genome recombination between the CCoV and the FCoV, where
the CCoV spike gene was incorporated into FCoV type I (Herrewegh et al., 1995a; Motokawa et al.,
1996). Type I FCoV grows poorly in vitro, while type II strains grow well and are, for this reason,
more used for experimental studies. This is in contrast with what happens in the field, since type I
FCoVs are more globally diffused, while type II FCoVs are less diffused and represent the 10-20% of
FCoVs isolated in Asia (Rottier, 1999; Sharif, et al., 2010; Pedersen, 2014a). The two strains also
differ for the receptor used to enter the cells. Feline aminopeptidase N is as a receptor for type II
FCoV, but not for type I FCoV. Type I FCoV uses a feline dendritic cell-specific intercellular adhesion
molecule-grabbing nonintegrin (fDC-SIGN) as a co-receptor, together with a mannose-binding
lectin or another receptor of still unknown origins (Regan et al., 2010; van Hamme et al., 2011).

Feline infectious peritonitis
14
Feline infectious peritonitis
Role of FCoV mutations
The two pathotypes of FCoV refer to their capability of causing FIP. This because while it is now
fully accepted the hypothesis for which FIPV derives from mutations of the FECV within each cat, it
is still not understood which is the real mutation responsible for this switch. As reported by Gunn-
Moore et al. (1999): “FCoV exists within individual cats as complex viral populations”. When one of
the quasispecies generated during the replication-transcription process acquires the capability of
changing cell tropism from enterocytes to monocytes/macrophages, along with an impaired
immune response of the host, FIP occurs (Pedersen, 2009). FECV, in fact, is primarily confined to
the intestinal tract, where it causes a mild enteritis (Rottier, 1999). The FECV was believed for
years to be confined to the host intestinal epithelium, but several studies have demonstrated that
FECV can spread systematically through monocytes-associated viremia in infected, but healthy,
cats (Gunn-Moore et al., 1998a). Nevertheless, the FECV was also demonstrated not only to be
carried, but also to freely replicate in the host monocytes, when this was believed to be only a
FIPV trait. Moreover, cats shed FCoV in the feces after been inoculated intraperitoneally with the
FECV, even if to a lesser extent compared with cats inoculated with FIPVs. Thus, the real difference
between the two pathotypes seems to be the higher and more effective rate of replication inside
the blood monocytes of the FIPV compared with the FECV (Simons et al., 2005; Can-Sanha et al.,
2007; Pedersen et al., 2012).
The first gene taken into account for its role in the FECV-to-FIPV switch was the accessory 3c gene.
The majority of the FIPVs isolated from FIP cats showed deletions in the 3c gene (Vennema et al.,
1998). Structural and accessory genes of FIPV strains obtained from affected tissues were
sequenced, showing that the highest number of mutations were located in the 3c gene and were
represented mostly by randomly scattered single nucleotide polymorphisms (SNPs) that led to
variable truncations of the 3c protein. These mutations were also present in the FECVs obtained
from the feces of the same cats, but to a lesser extent. Interestingly, the type and number of
nucleotide deletions were always different between the different strains, confirming that each
mutation arises independently in each cat (Pedersen et al., 2009). When the 3c genes were
sequenced from a higher number of FIPVs and FECVs, mutations in the 3c gene were found in the
majority, but not in all, the FIPVs, while none of the FECVs obtained from feces showed the
mutations. The authors concluded that an intact 3c gene is essential for the replication in the host

Feline infectious peritonitis
15
intestine, but also that 3c gene mutations are not the only responsible for the FECV-to-FIPV switch
(Chang et al., 2010). This latter finding was later on confirmed, since FIPVs with mutated 3c genes
were not shed in the feces after oronasal inoculation, while FIPVs with an intact 3c gene were.
Again, the 3c gene mutation was confirmed not to be the only cause of FIP, since both mutated
and non mutated 3c gene FIPVs were capable of inducing FIP after oronasal or intraperitoneal
inoculation. Additionally, FIPVs with an intact 3c gene contained more amino acidic changes in the
3c protein than FECVs, making this gene very variable between different strains (Pedersen et al.,
2012). A more recent study investigated the clonal diversity of 3c genes obtained from FIP and non
FIP cats, with the aim to detect not only the dominant sequences but a higher number of
sequences that may harbor the mutation. As a result, all the FIPVs showed the truncated 3c gene,
in contrast with what previously reported and consequently defining the 3c gene as a promising
marker for the FECV-to-FIPV switch (Hora et al., 2016). The real function of the 3c gene is,
however, still not clear. Due to its hydropathy profile similar to that of the SARS-CoV 3a protein, it
was postulated that the 3c protein could have similar functions (pro-apoptotic properties and
virion release), but this still remains only a hypothesis (Pedersen, 2014a). A recent study showed
that the 3c protein could have a virulence suppressing effect, aimed to maintain the symbiosis
between the host and the virus, using a pathway not involved with autophagy. It was also
hypothesized that a truncated 3c protein could subsequently enhance the viral replication in
macrophage-like cells (Hsieh et al., 2013).
The ORF 7a/7b were also early investigated as potential markers of virulence. A first study by
Herrewegh et al. (1995a) showed that while the 7a protein was well conserved among FCoV
strains, the 7b protein amino acid sequences were less similar between strains. Moreover, when
comparing avirulent FIPVs strains with FCoVs 7b sequences after tissue culture passages,
nucleotide deletions of different lengths were found in the avirulent FIPVs strains. When the same
comparison was performed on samples collected from naturally infected and FIP affected cats, the
deletion in the ORF 7b were not present. The authors concluded that while the ORF7b is not
necessary for in vitro replication, thus easily lost, it somehow gives advantages for in vivo
replication and that deletions in this protein could diminish the virus virulence (Herrewegh et al.,
1995a). The same findings were confirmed by another study, where viruses with a truncated 7b
gene have been associated with enteric coronaviruses only (Vennema et al., 1998), but when the
expression of the 7b protein was investigated as its mutation could really be a distinctive tract
between FECV and FIPV, the results were quite different. A study aimed to evaluate the antibody

Feline infectious peritonitis
16
response against the 7b protein in FIP affected cats demonstrated that both FIP, non FIP and
healthy cats had antibodies against this protein (Kennnedy et al., 2008). In a following study, 7b
proteins with deletions were found both in FCoV from fecal samples of infected, healthy cats and
in effusions of FIP affected cats. Thus, the presence of deletions in 7b protein is not correlated
with the viral pathogenicity and cannot be used to distinguish FECVs from FIPVs (Lin et al., 2009).
The role of the spike gene in the pathogenesis of FIP has began to be thoroughly investigated in
the last few years, precisely after a paper published in 2012 by Chang et al. In this study, 11 FCoVs
obtained from tissues of FIP affected cats and 11 FCoVs obtained from feces of healthy cats were
sequenced and subjected to a screening for nucleotide differences among the two pathotypes. In
the 10% of the genome positions, the nucleotide identity in at least 1 of the 11 FIPVs did not occur
in any of the 11 FECVs and almost a half of these differences were due to differences in the spike
gene. One nucleotide difference was found in 9/11 FIPVs (nucleotide T or C at position 23531) and
in none of the FECVs (nucleotide A at position 23531). The mutation of this single nucleotide leads
to the modification of one amino acid (from methionine to leucine at position 1058) in the fusion
peptide of the spike protein. When analyzed on a larger scale, the same finding was present in the
96% of FIP cats, while another single nucleotide mutation in close proximity (mutation S1060A)
allowed to additionally distinguish FIPVs from FECVs. Given the functions of the spike protein in
coronaviruses (cell targeting and cell entry) the authors concluded that this mutation is probably
associated with the FIPV pathogenicity, but that is also most likely not the only responsible for the
FECV-FIPV switch (Chang et al., 2012). A year later, a study from Licitra et al. (2013) showed a set
of at least one nucleotide mutations in the S1/S2 furin cleavage site of FIPVs, but not in the FECVs.
In particular, more than 40 % of FIPVs showed mutations (e.g. deletions) in the arginine residue of
the P1 position of the cleavage site. The next more common mutations of the FIPVs was in the P2
position. These mutations, however, even if believed to be associated with an enhanced tropism
for monocytes and macrophages, were found only in two thirds of the genomes analyzed and led
also to a sometimes higher, sometimes lower cleavage efficiency, leaving doubts about the real
meaning of these findings (Licitra et al., 2013). The same author extended this work by additionally
investigating possible mutations at the S2’ cleavage site, which is the second cleavage activation
site of the S protein, from FECVs obtained from feces of healthy cats and from FIPVs collected by
FIP clinically and sometimes immunohistochemically diagnosed cats. Again, mutations were
present in both the cleavage sites obtained from FIPVs, but the patterns were complex and often

Feline infectious peritonitis
17
different between the different cats or even samples from the same cat, both in terms of
interested position and in terms of amino acid change in the same position (Licitra et al., 2014).
In a more recent study, the main mutation described by Chang et al. was investigated in an
extended cohort of fecal and tissue samples from both FIP and non FIP cats. Surprisingly, 9% of the
tissue from FIP cats did not showed the mutations proposed by Chang et al. (2012) and, at the
same time, 89% of tissues from non FIP cats showed the mutation M1058L described by Chang as
typical of FIP. This result can be explained with a possible association of the mutation with a
systematic spread of the FCoV, rather than to a pathogenic role of the mutated gene (Porter et al.,
2014).
Epidemiology, shedding and transmission
Even if with wide variability among different countries, feline coronavirus is worldwide spread as
well as feline infectious peritonitis (Drechseler et al., 2011). The prevalence of FCoV is extremely
high, especially in multicat environments, where the seroprevalence can reach more than 90%,
while in single-cat households it is between 10-50% (Horzinek and Osterhaus, 1979; Addie and
Jarrett, 1992; Addie et al., 2000; Pedersen et al., 2004). Feline coronavirus is fecally-orally
transmitted, therefore the risk of becoming infected increases in crowded conditions (Cave et al.,
2004). Due to its high prevalence, FIP could be expected to be a very common disease. Conversely,
its incidence is low, and only 5-12% of FCoV infected cats develop FIP (Drechsler et al., 2011). The
viral fecal shedding usually begins a week after experimental infection with FECVs or at 9-10 weeks
of age for kittens born from infected queens, and continues for up to 10 months, after which the
pattern of shedding can follow three ways. About 5% of the cats develop a strong immune
response and stop the shedding after an average time of 12 months; about 70-80% of the cats
discontinuously shed the virus (intermittent shedders) and 10% of the cats persistently shed the
virus for more than 24 months and possibly lifelong (Foley et al., 1997; Addie and Jarrett, 2001;
Pedersen et al., 2008). The persistent shedders seem to be persistently infected with the same
strain of the virus, while cats that recover from the infection are susceptible to be re-infected,
either with the same or different viral strains (Addie et al., 2003). Persistent, healthy shedders,
with the colon as the main site of viral persistence, play a key role in the epidemiology of FIP (Meli
et al., 2004; Kipar et al., 2010).
Viral shedding is also correlated with the antibody titer, since cats shedding the virus usually have
higher titers in comparison with non shedders (Pedersen et al., 2008). There are several risk

Feline infectious peritonitis
18
factors for the development of FIP. FIP usually occurs in young cats, typically after 5-6 weeks of
age, when the maternal antibodies decrease. Stressful events (e.g. surgery, moving, co-infections)
can be risk factors, as well as the proportion of shedders in the cattery, since the entrance of FCoV
infected cats in multi-cat environments can increase the viral shedding from 10- to 1 million-fold in
one week only. It has been in fact postulated that higher levels of viral replication could lead to the
occurrence virulent mutants among the quasispecies generated by infected animals due to the
high rate of viral mutations (Foley et al., 1997; Gunn-Moore et al., 1999; Hartmann, 2005).
Moreover, FIP seems to occur more often in male, intact cats and during fall-winter, probably due
to the fact that cats tend to share the same environments (Rohrbach et al., 2001; Pedersen et al.,
2004). Certain breeds are reported to be more likely to develop FIP: Birman, Ragdoll, Rex,
Abyssinian and Himalayan breeds (Pesteanu-Somogyi et al., 2006).
FIP usually arises as an enzootic disease, with rare and unpredictable losses, usually of 1-5%
distributed in a 5 year or longer period. Occasionally, however, it can arise as an epizootic disease,
with typical FIP outbreaks characterized by the occurrence of FIP in about 10% of the cats,
depending on the general prevalence of FIP in the given environment. The causes of FIP outbreaks
are multifactorial and due to overcrowding, increased intestinal replication rate and a general
increased stress level (Pedersen, 2009; Drechsler et al., 2011). Outbreaks events, even if rare,
could suggest the presence of virulent strains capable of inducing FIP in a given population (Brown
et al., 2009). This hypothesis was recently proved wrong, when it was demonstrated that the viral
strains isolated during an FIP outbreak from FIP and FCoV infected cats were very closely related
and that no evidence of circulating virulent-avirulent strains was found (Barker et al., 2013).
Pathogenesis of FIP
There are several unclear aspects about the pathogenesis of FIP. As stated above, it is still
unknown, for example, the mutation responsible for the FECV-to-FIPV switch. Several studies
published in the last years allow to recognize some key factors in the pathogenesis of FIP, which
are the change of tropism of the FCoV from enterocytes to monocytes, the acquired capability of
actively replicating in these cells, and an imbalance between the host cell-mediated and humoral
immune response (Kipar and Meli, 2014). After oral experimental infection, FCoV targets the
intestinal columnar epithelial cells. It is then probably taken up by enteric macrophages to the
lymph node, from where they can be systemically spread and detected in the blood as well as in
Feline infectious peritonitis
19
the tissues resident macrophages (Kipar et al., 2010). The site of FECV-to-FIPV switch is still
unknown, but the blood monocytes could intermediate this process (Pedersen, 2014a).
The manifestation of FIP and how it clinically manifests depend on the host immune response.
FCoV infected cats develop antibodies against the virus, no matter on the following course of the
infection but, while some animals clear the infection, many remain infected or develop FIP (Vogel
et al., 2010). The humoral response has, in fact, a supportive role in the development of FIP, while
a strong cellular immune response has a protective role against the disease (Pedersen and Black,
1983). Cats with FIP show a decreased Th1 protective response, with a general decrease in the
lymphocyte number and a specific decrease in the T cell subsets, which occurs very early after
experimental infection and correlates with viral replication in blood (Gunn-Moore et al., 1998b;
Kipar et al., 1998; Kipar et al., 2001; Paltrinieri et al., 2003; De Groot-Mijnes et al., 2005).
The cytokine patterns found in FIP cats support these findings, since an inhibition of the cellular
immune response due to the lack of the interleukin 12 (IL-12) leads to activation of monocytes and
macrophages and, eventually, to FIP. On the other hand, FCoV-infected, healthy cats can avoid this
hyperactivation thanks to the up-regulation of the interleukin 10 (IL-10), a cytokine with anti-
inflammatory activities (Kipar et al., 2006a). Moreover, an upregulation of the tumor necrosis
factor α (TNF- α) and a decrease in the interferon γ (IFN-γ) are generally found in FIP cats, since
these two cytokines have an inducive and a protective role in the development of FIP, respectively
(Kiss et al., 2004; Gelain et al.,2006). TNF-α, in fact, could be responsible for both induction of
apoptosis in T cells, primarily CD8+ T cells, and for the increased expression of feline
aminopeptidase N, the receptor used by FIPV II for entering the monocytes (Takano et al., 2007a;
Takano et al., 2007b). In other studies, similar concentrations of IFN-γ were found in the blood of
FIP and healthy cats, while high level were found both in FIP effusions and lesions. It is therefore
more likely that this cytokine is released at the lesion level, where it increases macrophages
hyperactivation and viral uptake (Berg et al., 2005; Giordano and Paltrinieri, 2009).
Humoral response has been shown to support FIP development through a antibody-mediated
enhancement (ADE) process. Antibodies against the spike protein facilitate the uptake of the virus
from the monocytes through Fc receptors. This finding, however, seems to be more evident in
vitro than in vivo (Olsen et al., 1992; Addie et al., 1995). If ADE plays only a secondary role in the
infection in vivo, the question why the infected monocytes are not able to clear the infection
remains open. A recent study investigated the role of the innate immune response, showing that
FIP affected cats have a drastic decrease in the natural killers (NK) and T regulatory (Tregs) cells in

Feline infectious peritonitis
20
blood, lymph nodes and spleen. NK have anti-viral activities, while Tregs modulate the immune
response and their decrease could explain the incapability of inducing both a decrease of the viral
load and the monocytes activation. Curiously, intralesional NKs do not change in number and
show activation, but this finding does not translate in an increased cytolytic activities, possibly due
to changes in NK cell biology or activation (Vermeulen et al., 2013). It is clear that the picture of
FIP pathogenesis is still complex.
What is known is that the infected monocytes/macrophages activation start a sequence of events
that, depending on the host immune response, will determine the manifestation of the disease.
Pathological findings
A strong humoral immune response causes the effusive (or ‘wet’) form of FIP. The pathological
features of effusive FIP were firstly linked to a type III hypersensitivity. The immune-complexes
resulting from the linking of antibodies with viral particles and viral laden macrophages cause an
Arthus-like reaction, associated with the deposition of the complexes around small venules, which
trigger the release of macrophage produced factors that cause tissue damages and the
development of an inflammatory process characterized by pyogranulomas, vasculitis, necrosis and
effusions (Weiss and Scott, 1981; Pedersen, 2009). The activation of macrophages, mediated by
the production of IFN-γ, results in the increased viral replication which, in turn, further fosters the
inflammatory process (Berg et al., 2005). It was also recently demonstrated that FIPV-infected
macrophages induce the endothelial cells to express P-selectin, E-selectin, intercellular adhesion
molecule 1 (ICAM-1) and vascular cell adhesion molecule 1 (VCAM-1) which, in turn, support the
adhesion of leukocytes to endothelial cells and their transmigration. This could explain not only
the systemic spread of FIP lesions, but could also give further insights about the development of
typical FIP lesions (Acar et al., 2016). Some aspects of FIP lesions do not correlate with type III
hypersensitivity, like the involvement of arteries in the inflammatory process. FIP vasculitis, in fact,
is usually confined to small and medium size veins (Kipar et al., 2005).
Pyogranulomas are considered the histological hallmark of effusive FIP. Their localization follows
the course of the cranial mesenteric artery and the lesions are therefore more concentrated on
the omentum and on the abdominal serosal surfaces, but pleura and pericardium can also be
involved. Histologically, pyogranulomas are composed by a high number of macrophages
containing a large amount of internalized viruses, few surrounding plasma cells, lymphocytes and
a variable number of neutrophils depending on the amount of necrosis (Kipar et al., 1998; Berg et

Feline infectious peritonitis
21
al., 2005; Pedersen, 2009). Effusive FIP is also associated with the presence of large volumes of a
yellow, thick, proteinaceous effusion rich in plasma proteins and hemoglobin breakdown products,
often containing fibrin clumps (Drechsler et al., 2011). Effusion is typically abdominal, but the
thorax and, less frequently the pericardium, can also be involved (Hartmann, 2005). A critical role
in the effusive form is played by the vascular endothelial growth factor (VEGF) produced by FIPV
infected macrophages, which seems to induce hyperpermeability of feline vascular endothelial
cells (Takano et al., 2011).
The different pathogenesis of non effusive FIP reflects also the different pathological features,
characterized by granulomas. Type IV sensitivity may play a role in the development of non
effusive, granulomatous FIP lesions, due to the presence, in the focal lesions, of CD4+
lymphocytes, neutrophils and macrophages (Paltrinieri et al., 1998). Compared with
pyogranulomas, macrophages in granulomas contain less or none viral antigen (Kipar et al., 1998;
Pedersen, 2009). Abdominal and thoracic lesions of non effusive FIP probably originates from the
serosa/pleura and then infiltrate the underlying parenchyma (Pedersen, 2009). Eyes and central
nervous system (CNS), with lesions on the uvea and meninges/ependyma respectively, are usually
more interested than in the effusive form of FIP (Drechsler et al., 2011).
The effusive and non effusive form are not always two pathological distinct forms, since at gross
examination the effusions can be present along with granulomatous lesions typical of non effusive
FIP. Also, vasculitis, which should be more typical of effusive FIP, can be observed in kidneys with
granulomatous lesions caused by non effusive FIP (Berg et al, 2005; Kipar and Meli, 2014).
Uncommon manifestations of FIP are also described. Intestinal solitary lesions due to FIP,
manifesting as unusually enlarged lymph-nodes or as intramural, solitary masses in the colon or in
the ileocecocolic junction, resembling a neoplasm, have been described (Harvey et al., 1996; Kipar
et al., 1999). An uncommon “encapsulation” of the pleural effusion, resembling a mediastinal cyst,
was also described (Vigani, et al., 2009). Peritonitis can involve the tunica vaginalis, causing scrotal
enlargement, and testicles or penis can be involved in the inflammatory process as well (Pedersen,
1995; Sigurðardóttir et al., 2001; Rota et al., 2008). Skin lesions caused by FIP have been also
described (Trotman et al., 2007; Declercq et al., 2008; Bauer et al., 2013).

Feline infectious peritonitis
22
Clinical and diagnostic features
The diagnosis of FIP is a very important step, both for the unavoidability of the poor prognosis and
for the psychological and economic impact on owners and cat breeders. Nevertheless, this step is
still considered challenging and even frustrating for the veterinarian, since at this day there is still
not a gold standard for the diagnosis in vivo (Pedersen, 2014b). One of the main reason for this, is
the impossibility to distinguish between the FECV and the FIPV either using serology or using
polymerase chain reaction (PCR)/sequencing-based approaches and the fact that the majority of
cats (i.e. also those with symptoms consistent with FIP but due to diseases other than FIP) is
infected with the FCoV makes the picture even more complex (Addie et al., 2009; Pedersen,
2014b). Another important reason is the non specificity of the clinical signs, especially in the non
effusive form, in which the symptoms are correlated with the organs involved by the granulomas.
For these reasons, the diagnosis of FIP must be based on a detailed signalment and anamnesis and
on a panel of laboratory tests that sometimes can be not conclusive.
FIP is more frequent in young cats, usually between 4 and 36 months and typically under 2 years
of age (Norris et al., 2005; Pedersen, 2014b; Riemer et al., 2015). Typical and non specific signs are
persistent, antibiotic unresponsive fever, lethargy, general discomfort, jaundice, inappetence and
weight loss. Sometimes, however, signs can be absent and FIP lesions can become apparent only
during routine surgery (Addie et al., 2009; Pedersen, 2009). In the effusive form, ascites with
abdominal distension is the most common finding. Pleural effusion, alone or in concomitance with
ascites, can cause dyspnea (Addie et al., 2009). Signs of non effusive FIP depend on which organ is
affected by the lesions. Abdominal palpation may reveal just a thickened intestinal area or lymph
nodes enlargement, while sometimes it can reveal the presence of granulomatous lesions as
irregularities on the kidneys surface (Drechsler et al., 2011). Ocular involvement is frequent in non
effusive FIP, and it manifests with retinal vasculitis, with perivascular cuffing of inflammatory cells
and sometimes retinal detachment, and uveitis, with fibrin and keratic precipitates in the anterior
chamber (Maggs, 2009; Stiles, 2014). Neurological signs are also more frequent in non effusive FIP,
reflecting the type and scale of involvement of the brain, meninges and spinal cord. Consequently,
the range of clinical signs is wide and comprises behavioural changes, hyperesthesia, cranial
nerves abnormalities, caudal paresis, ataxia and seizures (Foley et al., 1998; Gunn-Moore and
Reed, 2011). After the emission of a clinical suspicion of FIP, the clinician must deal with a range of
laboratory tests, more vast in effusive FIP, that might increase the odds of making the right
diagnosis.

Feline infectious peritonitis
23
Hematology and serum biochemistry
Non regenerative anemia, ascribable to a chronic inflammatory illness, is usually found in FIP.
Other complete blood count (CBC) alterations are leukocytosis with absolute neutrophilia and
lymphopenia. These two findings, however, can also be found in the stress leukogram that can be
due to many other diseases (Paltrinieri et al., 2001; Addie et al., 2009; Pedersen, 2009). In a recent
study performed on a large cohort of FIP cats, lymphopenia was observed in only half of the cats
and significantly more often in cats with effusive FIP (Riemer et al., 2015).
In serum, an increase in hepatic enzymes, urea and creatinine may reflect the involvement of liver
and kidneys, if present, but these changes are usually not helpful in formulating a diagnosis (Addie
et al., 2009). Hyperbilirubinemia and sometimes hyperbiliverdinemia are often present, not in
correlation with jaundice or liver involvement. These findings are more common in the effusive
form and reflect the recycling of hemoglobin products derived by the leakage and destruction of
erythrocytes in the effusions and lesions (Pedersen, 2009).
More useful information for the diagnosis of FIP can be obtained from the analysis of serum
proteins. One common finding is hyperproteinemia, generally caused by the increase of the γ-
globulins concentration. This finding, however, is common also in diseases other than FIP, and was
found in low percentages of FIP cats when a large number of cases was analyzed (Paltrinieri et al.,
2002; Norris et al., 2005; Tsai et al., 2011; Riemer et al., 2015). One more consistent finding is the
decrease of the albumin:globulin (A:G) ratio, which was described to have a greater diagnostic
value in comparison with total proteins and γ-globulins concentration increase and, when lower
than 0.8, a good predictor for FIP (Hartmann et al., 2003). The A:G ratio, however, must be
considered in relation with the disease prevalence, since in a population with a low prevalence of
FIP, the negative predictive value (NPP) is high, allowing to exclude the disease, while the positive
predictive value is very low even at a cut-off of 0.6 (Jeffery et al., 2012). Other consistent findings
are changes in the globulin concentrations and typical electrophoretic patterns since during FIP,
both α2 and γ-globulins concentrations increase and the electrophoretogram usually reveals
polyclonal hypergammaglobulinaemia as well as an increase in α2 fraction (Stoddart et al., 1988;
Sparkes et al., 1991; Paltrinieri et al., 1998; Paltrinieri et al., 2001; Addie et al., 2009; Taylor et al.,
2010; Riemer et al., 2015). Hypergammaglobulinemia is not related to an increase of the
antibodies levels but probably with the increase of some serum proteins with γ motility, probably
complement factors, while the increase of the α2 fraction is due to the presence of high levels of
acute phase proteins, mostly haptoglobin (Stoddart et al., 1988; Paltrinieri et al., 1998; Pedersen,

Feline infectious peritonitis
24
2009). A Recent study found an increase of the γ-globulin concentrations, manifested as polyclonal
gammopathy, in most of FIP cats, while only a small percentage of cats showed an increase of the
α2-globulins concentrations (Taylor et al., 2010).
The acute phase protein α1-acid glycoprotein (AGP) is a very useful marker for the diagnosis of
FIP. Extensive studies have been performed on its concentration in FIP cats and in cats from multi-
cat environments exposed to feline coronavirus after its increase was found in experimentally
induced FIP (Stoddart et al., 1988; Duthie et al., 1997). When FIP appears in a multi-cat
environment, there are fluctuations of acute phase proteins and especially of AGP in healthy cats,
maybe as a sign of inflammatory response in reaction to the presence of FCoV mutants in the
environment, while in cats that develop the disease, the AGP concentrations remain high
(Giordano et al., 2004). Being a protein that can increase due to diseases other than FIP, the
diagnostic value of AGP for FIP was assessed by several studies. According to Duthie et al. (1997),
an AGP concentration of 1.5 mg/mL supports the diagnosis of FIP. A further study demonstrated
that an AGP concentration of 1.5-2 mg/mL can be helpful in discerning between FIP and cats with
other diseases when the anamnesis and clinical features are consistent with FIP, while a
concentration above 3 mg/mL can support the diagnosis of FIP even if the pre-test probabilities
are low (Paltrinieri et al., 2007). In a recent study, a small number of clinical challenging FIP cases
was analyzed, and AGP was in perfect concordance with histopathology (Giori et al., 2011).
Besides increased its concentrations, AGP is also hyposialylated in FIP cats compared with healthy
cats or cats affected with other diseases, down-regulating in this way the phagocytic activity of
feline neutrophils and probably contributing to the cell-mediated immune response deficit typical
of FIP (Rossi et al., 2013).
Analysis of effusions
Effusions should always be evaluated, since tests on effusions have a higher diagnostic accuracy
compared with tests on blood (Hartmann, 2005; Addie et al., 2009). FIP effusions are usually
cloudy, yellowish and with egg-white consistency, often presenting fibrin clots or strands
(Pedersen, 2014b). Protein content is high (>3.5 g/dL), while cellular content is variable, but
usually low (<5000 white blood cells/µL). At cytology, a mixed population of not nerated
neutrophils, lymphocytes, macrophages and mesothelials cells on a granular proteinaceous
background is usually seen. Cytology has a good sensitivity but a moderate specificity, since the FIP
pattern is common of non specific inflammatory processes (Paltrinieri et al., 1999). On the other

Feline infectious peritonitis
25
hand, in cats with diseases other than FIP it allows to quickly recognize septic or neoplastic
effusions, therefore it should be always performed (Addie et al., 2004). The Rivalta’s test, a test
developed a century ago and initially used to differentiate exudates from transudates in human
body cavity effusions, may be useful to identify FIP effusions. In the presence of high protein
concentrations and probably of inflammatory mediators typical of FIP, in fact, the effusions form a
visible clot when added to an acetic solution. The Rivalta’s test diagnostic accuracy was recently
re-discussed, and found lower than previously reported (Hartmann, 2005; Fischer et al., 2012).
Moreover, the test is subjective and operator-dependent (Fischer et al., 2013).
Serology
The main issue with antibodies detection, is that FECV and FIPV are antigenically identical
therefore causing the same antibody response (Pedersen, 2009). Therefore, FCoV-infected,
healthy cats, can result positive at serological tests (Addie et al., 2009). Titers above 1:1.600, in
combination with other findings suggestive of FIP, may increase the odds of diagnosing FIP. Cats
from environments where the FCoV is endemic, however, may have high titers as well. Values
above 1:3.200 are considered highly suggestive of FIP, but also in these cases serology should
always be evaluated in combination with other tests (Hartmann et al., 2003; Hartmann et al.,
2005; Pedersen, 2014b). Another issue is the low sensitivity of serological tests. This finding was
recently ascribed to the presence of high viral load that would bind the antibodies, making them
no more available for the test. However, sera and effusions with low coronavirus antibody titers
were positive at PCR, making this explanation not sufficient for the low sensitivity of serology (Meli
et al., 2012).
Viral detection
Immunohistochemical demonstration of the antigen inside the lesions is considered the gold
standard for the diagnosis of FIP (Tammer et al., 1995). There are, anyway, some cases where it
can be falsely negative, depending on the quality of tissues, reagents and quantity of infected
macrophages (Pedersen, 2014b). Immunochemistry can be performed also in vivo on biopsies or
fine needle aspirates (FNAs), but the sensitivity is influenced by the type of sampling, the type of
lesion and the cellularity. The sensitivity, however, can increase when biopsies and FNAs from the
same tissue are considered together (Giordano et al., 2005). Immunocytochemistry or
immunofluorescence on effusions have been always considered helpful to confirm the disease but

Feline infectious peritonitis
26
not to exclude it, since this test is influenced by the cellularity of the sample and by the amount of
virus in the macrophages (Paltrinieri et al., 1999; Hartmann et al., 2003; Addie et al., 2004). Recent
studies, however, have shown for these tests a specificity lower than previously reported, possibly
due to the leakage, in presence of inflammation, of FCoV infected monocytes in the effusions
(Litster et al., 2013; Felten et al., 2016).
Polymerase chain reaction (PCR) is a direct test with undeniable usefulness for the detection of
shedders when the test is performed on the feces (Addie et al., 2004). Nonetheless, its value for
the diagnosis of FIP is still argument of debate. In fact, while the PCR on feces is known to have no
diagnostic value for FIP, its application on body fluids has been recently discussed. PCR on
cerebrospinal fluid (CSF) and on other body effusions has shown optimal specificity but a low or
suboptimal sensitivity, showing this to be a good test to confirm FIP but not to exclude it
(Pedersen et al., 2014b; Doenges et al., 2015; Longstaff et al., 2015; Doenges et al., 2016). It is also
known that FIP cats may have low or absent viral load in blood, and only 44% of suspected FIP
cases have been recently shown to be PCR positive on effusions (Herrewegh et al., 1995b; Addie et
al., 2004; Soma et al., 2013).
The spike protein gene sequencing proposed by Chang et al. (2012) has been recently described by
Kipar and Meli (2014) as “one of the most diagnostic potential tool involving the direct virus
detection” and it is currently used by some laboratories for the diagnosis of FIP, even though only
two studies about its diagnostic accuracy have been published. In particular, the diagnostic
accuracy of the sequencing aimed to detect the M1058L mutation was investigated on effusion
samples. While in one study the specificity could have not been investigated, another study
showed an absolute specificity. On the other hand, the sensitivity resulted similarly low (Felten et
al., 2015; Longstaff et al., 2015).
FIP management
Therapies
A large number of different therapies have been attempted over the years for the treatment of
FIP, but to this day none has been proven effective. Three main approaches have been used:
inhibition of viral replication, inhibition of the inflammatory response and non specific modulation
of the immune system (Pedersen, 2014b). Viral encoded proteases that cleave viral polyproteins
into functional single proteins are the target of recently discovered anti viral drugs. In a very
recent study, a 3C-like (3CLpro) protease inhibitor that previously showed anti-FIPV in vitro was

Feline infectious peritonitis
27
tested in vivo in experimentally induce FIP. The treatment caused the regression of clinical
symptoms and the reduction of viral load in macrophages from ascites in 6/8 cats (Kim et al., 2013;
Kim et al., 2015; Kim et al., 2016). Three small molecule inhibitors (chloroquine, mefloquine, and
hexamethylene amiloride) demonstrated a marked inhibitory effect on FCoV replication in vitro
but not yet in vivo, except for chloroquine, which demonstrated some improvement in the clinical
signs of FIPV infected cats, but caused hepatotoxicity at the same time (Takano et al., 2013;
McDonagh et al., 2014). Human IFN-α and -β inhibit FIPV in vitro, and feline IFN-ω has the same
effect without causing the production of antibodies against the molecule, as it happens with the
human interferon (Hartmann et al., 2005). Feline IFN-ω was at first reported to induce remissions
in the majority of FIP cats, but in a study involving a larger group of cats, IFN-ω showed no
advantage effect in treating FIP (Ishida et al., 2004; Ritz et al., 2007).
Prednisolone was and still is one of the classic treatment of choice when there is the suspicion of
FIP, but it does not treat the disease (Addie et al., 2009). TNF inhibitors have been used to limit the
inflammatory and pro-vasculitis effects of this cytokine, but with no difference neither in the
survival time or in the amount of the effusions between treated and untreated cats (Fischer et al.,
2011). In a more recent study, the administration of anti-feline TNF-α monoclonal murine
antibodies increased the survival time of 2/3 FIP experimentally induced cats. The cats, however,
may develop anti-mouse antibodies causing an anaphylactic reaction, therefore the authors
started to develop a mouse-feline chimeric antibody against TNF-α (Doki et al., 2016).
A wide number of different immune stimulant compounds (staphylococcal A protein,
Propriobacterium acnes, mucopolysaccharide extract of Aloe vera, a lymphocyte T cell
immunomodulator and Polyprenyl immunostimulant) have been used, often off label and without
evidence of a real benefit for the cat (Pedersen, 2014b).
Prevention
Due to the numerous failed attempts of developing an effective vaccine, the key for preventing FIP
is to avoid FCoV infection through identification and isolation of the shedders and through the
hygiene of the environment since the higher the proportion of shedding coronavirus at a given
time, the more likely cats will develop FIP (Foley et al, 1997). Multi-cat environments (e.g.
breeding catteries, shelters, multi-cat households) are undoubtedly high-risk environments, where
infected cats can shed the virus for months or even life-long and where stress deriving from
overcrowding or concurrent diseases is bigger (Addie et al., 2003; Pedersen, 2009). One way to

Feline infectious peritonitis
28
prevent FCoV infection is the strict quarantine of queens 2 weeks before birth and the separation
and early weaning of kittens around 5-6 weeks of age, before the decrease of maternal antibodies.
If kittens do not have antibodies at 12 weeks of age, they can be considered free from infection
(Addie et al., 2004; Pedersen, 2009). This procedure, however, is not simple due to the strict
control of exposure, to the costs for assuring enough free spaces for quarantine and for the
potential problems of socialization associated with early weaning. Moreover, FCoV free kittens,
could be easily become infected as soon as they are placed in another environment contaminated
by FCoVs (Addie et al., 2004, Hartmann, 2005).
Another method to control the infection is to separate the shedders from negative cats. Shedders
can be detected with PCR on feces, but multiple testing every 2 weeks for two months or more is
necessary due to the nature of FCoV shedding (Addie et al., 2001). An indirect way to identify the
shedders is the antibody testing, since cats with low antibody titers (e.g., 1:25 or below) usually,
but not always, are shedding very low or no virus, while cats with high antibody titers (e.g., 1:400)
do. As with PCR, repeat testing is necessary to keep track of the intermittent shedders (Hartmann
et al., 2005; Pedersen, 2014b).

AIMS
29
AIMS

Aims of the thesis
30
Aims of the thesis
The general aim of this thesis was to contribute to the development of new tests for the diagnosis
intra-vitam of feline infectious peritonitis and feline coronavirus infections (including the
collection of updated information regarding the diagnostic potential of pre-existing
clinicopathological tests) and, to a lesser extent, to deepen some aspects of feline infectious
peritonitis pathogenesis.
Specific aims
I. To determine the diagnostic accuracy of the Δ total nucleated cells (ΔTNC) measurement, which is
the ratio between the two total nucleated cell counts (TNCC) in the DIFF and BASO channels of the
hematology laser counter Sysmex XT-2000iV, for FIP effusions. The ΔTNC is based on the same
principle of the Rivalta test, which is subjective and biased by several pre-analytical or analytical
factors. The availability of a more objective approach such as the ΔTNC would improve the ability
to correctly classify effusions as consistent with FIP.
II. To determine if the ΔTNC measurement can be performed on supernatants of FIP effusions after
the addition of feline blood and to assess the diagnostic accuracy of this method, as well as the
influence of protein content, total cell count of the added blood and magnitude of dilution. The
development of such a modified technique would in fact allow to investigate the ΔTNC also on
frozen supernatants, thus allowing the collection of accurate diagnostic information also when
samples cannot be immediately analyzed.
III. To investigate the atypical serum electrophoretic (SPE) patterns recorded in FIP cats in the recent
years and to compare them with SPE patterns from FIP and non FIP cats in a less recent time span.
This information would be particularly useful since SPE is considered one of the most reliable tests
to support a clinical diagnosis of FIP. However, anecdotal reports suggest that this diagnostic
potential is diminished in recent years, due to the frequent occurrence of “false negative” results
(i.e. electrophoretograms not consistent with FIP in cats actually affected by this disease).
IV. To compare the diagnostic performances of clinico-pathological and molecular tests (in particular:
SPE, α1-acid glycoprotein - AGP - measurement, RT-nPCR and spike gene sequencing on blood;
cytology, evaluation of the ΔTNC, RT-nPCR 3’UTR and spike gene sequencing on cavitary effusions
and RT-nPCR and spike gene sequencing on tissues specimens) for the ante-mortem diagnosis of
FIP. The rationale of this comparison is that despite the numerous studies published in recent

Aims of the thesis
31
years on each of these techniques, no studies have compared the diagnostic potential of the
different tests. This information would be extremely useful to know the clinical scenarios on which
each of the test may provide the most reliable diagnostic information.
V. To develop a reverse transcriptase loop mediated isothermal amplification (RT-LAMP) for the
detection of FCoV in the specimens most frequently used in clinical practice for both screening and
diagnostic purposes. This method is more rapid and cheap than conventional PCR and therefore it
would facilitate the extensive use of molecular techniques to investigate the presence of
coronavirus genomes in different clinical specimens.
VI. To sequence a wide number of FCoVs obtained from different specimens (tissues, body fluids,
feces) of histochemically confirmed FIP and non-FIP cats and to better understand the correlation
between the spike gene mutations described by Chang et al. (2012) and FIP development.
Sequences of viral strains collected from cats with and without FIP are widely investigated in
recent times but often performed on a limited number of samples. The rationale of this specific
aim is that any additional information on the genomic variability of viral strains may be relevant in
terms of basic knowledge of host-virus interaction.
VI.1. To assess possible differences in the frequency of FCoV shedding in cats affected or non
affected by FIP, and to investigate any spike protein mutations present. Also in this case, this
information would enrich the currently available information on the characteristics of viral
shedding and it may be a preliminary step for future studies on the development of diagnostic
tests or of tests potentially applicable in pathogenic studies.

DESCRIPTION OF STUDIES I-VI
32
DESCRIPTION OF STUDIES I-VI

High diagnostic accuracy of the Sysmex XT-2000iV delta total nucleated cells on effusions
for feline infectious peritonitis
33
I. High diagnostic accuracy of the Sysmex XT-2000iV delta total nucleated cells on
effusions for feline infectious peritonitis
Material and methods
Case selection
This retrospective study was performed on data obtained from effusions submitted for diagnostic
purposes and under informed consent of the owners to the Department of Veterinary Medicine of
the University of Milan (DIMEVET). Feline intracavitary effusions analyzed with the Sysmex XT-
2000iV from June 2009 to June 2013 were selected from the DIMEVET database and used for data
analysis if fulfilling the criteria reported in the following table 1.
Inclusion criteria Exclusion criteria
Available complete documentation of physico-
chemical analysis of the effusion Absence of follow-up
Available extensive information about the final
diagnosis Absence of cytologic information
Available cyto-centrifuged slides in the archive of
DIMEVET for those cases where no cytologic report
was available
Absence of slides to verify the cytologic pattern in
cases without cytology report in the database.
Unclear or non-conclusive cytologic findings in
cases with archived slides but without information
in the database
Table 1. Inclusion and exclusion criteria used for this study.
Cats were defined as FIP if histopathology was consistent with FIP and if immunohistochemistry
against FCoV was positive. Cats were considered as non-FIP if another disease was diagnosed
through effusion analysis, eventually confirmed by necropsy and histology, or for clinical
improvement after treatment.
Sysmex XT-2000iV
Only effusions collected in EDTA tubes and submitted no later than 12–18 hours after sampling
were analyzed on the Sysmex XT-2000iV (Sysmex EuropeGmbH, Norderstedt, Germany) analyzer
to determine TNCC provided by both the DIFF (TNCC-DIFF) and BASO (TNCC-BASO) channels, as
well as the ΔTNC. Specifically, the DIFF channel classifies all nucleated cells based on complexity

High diagnostic accuracy of the Sysmex XT-2000iV delta total nucleated cells on effusions
for feline infectious peritonitis
34
and nucleic acid content. The BASO channel classifies nucleated cells based on volume and the
complexity of cellular residues produced after contact with an acidic reagent that, in human blood,
condenses all the nucleated cells except basophils (Lilliehook and Tvedten, 2011). Since effusions
include cells other than WBC, the total WBC count and the ΔWBC generated by the instrument
were defined as TNCC and ΔTNC.
Statistical analyses
The Analyse-it software (Analyse-it Software Ltd, Leeds, UK) was used. A nonparametric t-test
(Mann–Whitney U-test), using the 95% confidence interval (CI) as a measure of uncertainty was
used to compare to each other TNCC-DIFF, the TNCC-BASO, and ΔTNC results from FIP and non-FIP
cats. To assess the diagnostic accuracy of ΔTNC, the number of true positive (TP), false-positive
(FP), true-negative (TN), and false-negative (FN) results were calculated as follows: TP, effusions
from FIP cats with a ΔTNC higher than each operating point; TN, effusions from non-FIP cats with a
ΔTNC lower than each operating point; FP, effusions from non-FIP cats with a ΔTNC higher than
each operating point; and FN, effusions from FIP-cats with a ΔTNC lower than each operating
point. Sensitivity and specificity were calculated using standard formulas and using the 95% CI as a
measure of uncertainty (Christenson, 2007). Positive and negative likelihood ratios (LR+ and LR-,
respectively) were calculated using the formulas: LR+= sensitivity/(1-specificity) and
LR- = (1-sensitivity)/specificity, respectively (Gardner and Greiner, 2006).
Finally, receiver operating characteristic (ROC) curves were designed by plotting sensitivity vs 1-
specificity to determine the discriminating power of ΔTNC in identifying cats with FIP (Gardner and
Greiner, 2006). The optimal cut-off value was identified as the operating point closer to the upper
left corner of the graph.
Analytical precision and accuracy
Since there is no information about repeatability and linearity under dilution of Sysmex readings of
TNCC-DIFF and TNCC-BASO of effusions from cats with FIP, in the current study, repeatability was
assessed on 2 FIP samples with a high ΔTNC and on 2 specimens with a normal ΔTNC in 5
consecutive measurements on one day, and by calculating the CV with the formula: CV= mean/SD
x 100. To assess linearity under dilution, one specimen with high and one with normal ΔTNC were
each serially diluted at 1:1, 1:3, 1:7, and 1:15 (vol/vol) with isotonic saline, resulting in dilutions
corresponding to 50%, 25%, 12.5%, and 6.25% of the original effusion, respectively. After being

High diagnostic accuracy of the Sysmex XT-2000iV delta total nucleated cells on effusions
for feline infectious peritonitis
35
analysed on the Sysmex, linearity was determined by comparing the expected values for each
dilution to the values provided by the instrument in a linear regression analysis.
Results
Retrospective study population and distribution of cases per group
The results of the retrospective search are reported in figure 1. The 51 selected effusions were
grouped as follows:
Group A, FIP (20 cats). In all these cases except 2, the physico-chemical features and cytology of
the effusions were consistent with FIP. The 2 cases of FIP with “atypical” findings in the effusion
included cat 5 with polyclonal gammopathy and very high serum AGP concentration, but an
effusion with a low protein concentration (17 g/L), low specific gravity (1.010), and low cellularity
(0.13x10⁹/L), with rare neutrophils and mesothelial cells in the absence of the typical
proteinaceous background. The pericardial effusion of cat 25 revealed a high number of reactive
mesothelial cells, sometimes with evident cytophagia and a weakly proteinaceous background.
However, in all the 20 cases, the diagnosis of FIP was confirmed by histology and by the
immunohistochemical detection of intralesional FCoV.
Figure 1. Inclusion and exclusion criteria adopted for the selection of cases from the database and
the final assignment to the study groups.

High diagnostic accuracy of the Sysmex XT-2000iV delta total nucleated cells on effusions
for feline infectious peritonitis
36
Group B, non-FIP (31 cats). Details about the diagnosis of each cat are reported in table 2.
Unfortunately, the non-FIP group contained a high number of neoplastic effusions that were not
as challenging for a differential diagnosis from FIP, being easily recognizable by cytology.
Type n° Subtype Diagnosis
Tumours
(20)
10 Lymphomas Cytology and imaging
8 Epithelial tumors Cytology and imaging
1 Thymoma Cytology and imaging
1 Hemangiosarcoma Cytology, imaging, PM, histology
Inflammatory
(5)
3 Septic Bacteriology
2 Cholangiohepatitis Laboratory findings
Chylous 3 Heart failure Cytology and imaging
Modified transudate
(3)
2 Abdominal neoplasia PM, histology
1 Cardiomyopathy Imaging, remission after treatment
Table 2. Subdivision of the non FIP effusions in the different subtypes and diagnostic methods
adopted. PM: post mortem examination.
Repeatability and linearity under dilution
Repeatability of specimens with normal ΔTNC was better for both DIFF and BASO counts as well as
for ΔTNC, with CV < 2.56%. Conversely, CV was higher and extremely variable for the specimens
with high ΔTNC, due to a high variability in both BASO and DIFF counts (table 3). Linearity under
dilution provided excellent results for TNCC-DIFF and TNCC-BASO of the specimens with normal
ΔTNC, with correlation coefficients of 0.99 and 1.00, respectively (P < 0.001). Consequently, ΔTNC
remained constant over the different dilutions. Conversely, the linearity under dilution of
specimens with high ΔTNC was satisfactory only for DIFF-TNCC (table 4, figure 2,3).

High diagnostic accuracy of the Sysmex XT-2000iV delta total nucleated cells on effusions
for feline infectious peritonitis
37
Repeatability
Cat #1 (FIP) Cat # 2 (FIP) Cat # 2 (lymphoma) Cat # 4 (Inflammation)
DIFF BASO ∆TNC DIFF BASO ∆TNC DIFF BASO ∆TNC DIFF BASO ∆TNC
Run 1 1.47 0.11 13.364 0.72 0.09 8.000 5.59 5.58 1.002 12.41 11.98 1.036
Run 2 2.01 0.13 15.462 0.81 0.05 16.200 5.48 5.66 0.968 12.19 12.04 1.012
Run 3 2.05 0.12 17.083 0.74 0.05 14.800 5.58 5.55 1.005 12.62 12.04 1.048
Run 4 2.14 0.14 15.286 0.79 0.07 11.286 5.57 5.63 0.989 12.59 11.96 1.053
Run 5 2.45 0.12 20.417 0.78 0.07 11.143 5.36 5.67 0.945 12.54 12.21 1.027
Mean 2.02 0.12 16.32 0.77 0.11 12.29 5.52 5.62 0.98 12.47 12.05 1.04
SD 0.35 0.01 2.64 0.04 0.02 3.25 0.10 0.05 0.03 0.18 0.10 0.02
CV (%) 17.52 9.19 16.18 4.82 15.21 26.47 1.77 0.92 2.56 1.41 0.82 1.57
Table 3. Results regarding repeatability recorded in two cats with high ΔTNC associated with FIP and in two
cats with normal ΔTNC.
Linearity under dilution
Cat # 2 (FIP) Cat # 2 (lymphoma)
DIFF BASO ΔTNC DIFF BASO ΔTNC
Undiluted 0.97 0.11 8.818 5.67 5.53 1.025
50% 0.48 0.1 4.800 2.54 2.54 1.000
25% 0.2 0.11 1.818 1.05 1.16 0.905
12.5% 0.21 0.1 2.100 0.67 0.73 0.918
6.25% 0.12 0.12 1.000 0.34 0.4 0.850
Table 4. Results regarding linearity under dilution recorded in a cat with high ΔTNC associated with FIP and
in a cat with normal ΔTNC.

High diagnostic accuracy of the Sysmex XT-2000iV delta total nucleated cells on effusions
for feline infectious peritonitis
38
Figure 2. Linearity under dilution (LUD) recorded in serially diluted effusion specimens from a cat with
lymphoma (A, DIFF-TNCC; B, BASO –TNCC; C, ΔTNC). Values on the y-axes refers to observed values, while
values on the x-axes refers to expected values.
Figure 3. Linearity under dilution (LUD) recorded in serially diluted effusion specimens from a cat with FIP
(A, DIFF-TNCC; B, BASO –TNCC; C, ΔTNC). Values on the y-axes refers to observed values, while values on
the x-axes refers to expected values.
Comparison of TNCC-DIFF, TNCC-BASO, and ΔTNC between cats with and without FIP
The TNCC-BASO and TNCC-DIFF counts were significantly lower (P < 0.001 and P < 0.05,
respectively) in cats with FIP (TNCC-BASO = 0.2; 0.0–5.3; TNCC-DIFF = 1.5; 0.1–26.3) than in non-
FIP cats (TNCC-BASO = 10.1; 0.0–707.9; TNCC-DIFF = 9.1; 0.1–921.8; Figure 4), with a high inter-
individual variability in the latter group, likely due to the heterogeneity of the diseases. The ΔΤΝC
was significantly higher (P < 0.001) in cats with FIP (median: 9.3; min–max: 0.5–36.4) than in non-
FIP cats (1.0; 0.5–2.5). All the cats with FIP had a ΔTNC > 3.0, except for the 2 “atypical” FIP
effusions (cat 5, ΔTNC 0.538; cat 25, ΔTNC 1.165). One of the cats showing “atypical” FIP effusion
had hypoalbuminemia and a hemorrhagic syndrome, which are changes with liver failure that may
induce also hypofibrinogenemia, likely preventing clotting in the BASO reagent. In the other case,

High diagnostic accuracy of the Sysmex XT-2000iV delta total nucleated cells on effusions
for feline infectious peritonitis
39
the cytologic pattern of the effusion was complicated by the presence of “atypical” mesothelial
cells that are usually not abundant in FIP effusions. In both cases, the false-negative results of
ΔTNC may be related to atypical features of the effusion rather than the low analytical sensitivity.
All non-FIP cats had a ΔTNC < 3.0. More specifically, the only 2 specimens from all 31 cats without
FIP with a ΔTNC > 1.7 but < 3.0 were a cat with lymphoma and a highly cellular effusion (TNCC-
DIFF: 25.45 cellsx109/L), and an almost non cellular modified transudate from a cardiopathic cat
(TNCC-DIFF: 0.05 cellsX109/L). Lymphomas can sometimes provide positive Rivalta’s test results in
people (Sakai et al., 2004) while the high ΔTNC in the second case, was clearly a mathematical
artifact due to the analytical sensitivity of the instrument.
These results demonstrate that cells are entrapped in clots formed by fibrinogen precipitation in
the BASO channel, therefore cell counts in the BASO channel are usually lower than those of the
DIFF channel. This mechanism explains why the ΔTNC (in the Sysmex referred to as ΔWBC)
increases in such specimens.
Diagnostic accuracy of ΔTNC
The area under the ROC curve for ΔTNC (figure 5) was 0.94 (95% CI = 0.84–1.00, P < 0.001
compared with the line of no discrimination). The best cut-off for ΔTNC determined by the ROC
curve analysis was 1.7. At this value, sensitivity was 90.0% (95% CI = 68.3–98.8%), specificity was
93.5% (95% CI = 78.6–99.2%), LR+ was 13.9 (95% CI = 4.6–86.3), and LR- was 0.11 (95% CI = 0.0–
0.3). When using a cutoff of ΔTNC = 2.5, specificity increased to 100%. Thus, ΔTNC has a high
diagnostic accuracy for FIP. Specifically, a ΔTNC > 1.7 makes it 14 times more likely that an
effusion originates from a cat with FIP rather than a different disease. Conversely, with a ΔTNC
< 1.7, the probability that the effusion comes from a cat with FIP is about one-tenth of the
probability that the effusion comes from a cat with a different disease.

High diagnostic accuracy of the Sysmex XT-2000iV delta total nucleated cells on effusions
for feline infectious peritonitis
40
Figure 4. Values of TNCC-DIFF (A), TNCC-BASO (B), and the ratio between total nucleated cell counts in the
DIFF and BASO channel of Sysmex XT-2000iV, reported as ΔWBC by the instrument but termed ΔTNC in this
study (C) recorded in cats FIP and non-FIP cats. The boxes indicate the I–III interquartile range (IQR), the
horizontal line indicates the median, whiskers extend to within the I quartile minus 1.5*IQR or to within the
III quartile plus 1.5*IQR. Dots indicate the values recorded in this study. The TNCC-DIFF and the TNCC-BASO
graphs do not include the result of a neoplastic non-FIP specimen that had extremely high TNCC-DIFF and
TNCC-BASO counts (921.8 and 707.9 cells x 109/L). The black bolded asterisks reported below the X-axis
indicate a significant difference between groups (*P < .05; ***P < .001).
Figure 5. Receiver operating
characteristic (ROC) curves of the ratio
between total nucleated cells in the DIFF
and BASO channel of Sysmex XT-2000iV,
reported as ΔWBC by the instrument but
termed ΔTNC in this study, for the
diagnosis of FIP.
The gray line indicates the line of no
discrimination.

High diagnostic accuracy of the Sysmex XT-2000iV delta total nucleated cells on effusions
for feline infectious peritonitis
41
Discussion
The results of the current study suggest that the instrumental analysis with the Sysmex XT-2000iV
may represent an additional reliable method for confirmation of FIP in the analysis of effusions.
A possible limitation of this study was the low number of non neoplastic effusions that in routine
practice may benefit from an additional test to distinguish FIP from other types of inflammatory or
reactive effusions. However, also in a previous feline effusions study, all the specimens from cats
with inflammatory effusions other than FIP had a ΔTNC < 1, confirming that a ΔTNC > 1 has a high
diagnostic accuracy for FIP (Pinto da Cunha et al., 2009).
Independently on the few FN and FP cases, the analysis of effusions with the Sysmex XT-2000iV
counter evidenced a sensitivity and a specificity comparable to or even higher than that previously
reported for the Rivalta’s test (Fischer et al., 2012). Moreover, the Rivalta’s test is rapid, cheap,
and accurate, but it may be limited due to inappropriate techniques or intrinsic factors of the
reagents such as concentration of acetic acid, different temperatures of the effusion,
and the acetic acid solution (Fischer et al., 2013). Additionally, the Rivalta’s test provides semi-
quantitative results and does not allow grading the severity of the change. Finally, the evaluation
of the test is subjective and a high inter-observer variability is observed (Fischer et al., 2013).
Conversely, the analysis with the Sysmex XT-2000iV counter is more standardized and rapid and
provides, in addition to the cell count, a provisional information on the cell types based on the
scattergram (Pinto da Cunha et al., 2009). However, it must be stressed that the linearity under
dilution test performed in this study demonstrated that the more accurate cell count provided by
the instrument is the DIFF-TNCC, which is not affected by the entrapment of cells in the clots
formed after contact with the BASO reagent. Therefore, in routine practice, it is not recommended
to use the default WBC counts that are generated by the BASO channel. Precision and linearity
were not satisfactory at high ΔTNC values. However, this does not affect the clinical decision since
the difference between ΔTNC values recorded in cats with and without FIP was higher than the
imprecision or bias of the method.
In conclusion, this study evidenced a very high diagnostic accuracy of the Sysmex-generated ΔTNC,
where values > 1.7 are highly suggestive of FIP, and a ΔTNC > 3.4 which, although higher than the
cut-off with the maximum specificity recorded in this study, was the threshold confirmatory for FIP
in a previously published study (Pinto da Cunha et al., 2009), may be considered diagnostic for FIP.
Diagnosing feline infectious peritonitis using the Sysmex XT-2000iV based on frozen
supernatants from cavitary effusions
42
II. Diagnosing feline infectious peritonitis using the Sysmex XT-2000iV based on
frozen supernatants from cavitary effusions
Material and methods
Thirty-four feline effusions were collected for diagnostic purposes and submitted to the DIMEVET
laboratory according to standard veterinary procedures, therefore without the need of a formal
approval of the Institutional Ethical Committee.
Nineteen effusions were classified as FIP based on post mortem histology and
immunohistochemistry (18/19) or through histology and immunohistochemistry of biopsies (1/19).
FIP was excluded based on postmortem findings in 5 of the 15 cats without FIP. These 5 cats were
diagnosed with pleuropericardial chronic fibrosis (cat 20), pleural undifferentiated pleomorphic
sarcoma (cat 21), abdominal hemangiosarcoma (cat 24), undifferentiated liver neoplasia (cat 27),
and acute leukemia (cat 33). In 4/15 cats without FIP, a diagnosis of neoplasia was obtained
through cytology (cats 22, 23, 30, 34) and confirmed through histology (cats 30, 34). In the
remaining 6 of 15 cats without FIP, the following diagnoses were obtained in vivo: cats 25 and 29
were diagnosed with cardiomyopathy and cat 32 with pancreatitis, all responding to the specific
treatment. Cats 26, 28, and 31 were diagnosed with chylothorax through cytology and diagnostic
imaging.
Twenty-seven samples were collected in EDTA tubes and analyzed with the Sysmex XT-2000iV
within 12–18 h. After the ΔTNC measurement, the effusions were centrifuged (3,000 × g, 5 min)
and the supernatants transferred to other tubes and frozen at –20°C (~1–8 weeks). Seven samples
(1, 10, 16, 18, 19, 28, 29) were centrifuged by the referring veterinarians, and the supernatants
sent to our laboratory where immediately frozen (~1–8 weeks).
Twenty μL of fresh feline blood (ΔWBC of 1.00 ± 0.15; mean ± standard deviation), obtained from
the routine caseload of the DIMEVET laboratory, were added to 180 μL of thawed supernatants to
obtain a dilution of 1:10 (figure 1).

Diagnosing feline infectious peritonitis using the Sysmex XT-2000iV based on frozen
supernatants from cavitary effusions
43
Figure 1. Procedure for the evaluation of the modified ΔTNC measurement. A. collection of the effusion in
EDTA tubes. B. Centrifugation of the sample followed by the removal of the supernatant. C. Freezing
and thawing of the supernatant in a other tube. D. Addition of feline blood in a 1:10 dilution.
Specifically, 15 different blood samples were used (WBC counts: 5.11–154 × 109 WBC/L). Each
blood sample was used to spike 1–4 effusions (Table 1).
After gentle mixing, the samples were analyzed with the Sysmex XT-2000iV. WBC-DIFF and WBC-
BASO counts and ΔTNC were recorded. Samples were then classified as positive or negative using
a ΔTNC of 1.7 and a ΔTNC of 3.4 as cut-offs. Using both the cut-offs and based on the final
diagnosis (FIP vs. non-FIP), the numbers of TP, TN, FP, or FN results were counted. Specificity,
sensitivity, positive predictive value (PPV), and negative predictive value (NPV) were then
calculated.

Diagnosing feline infectious peritonitis using the Sysmex XT-2000iV based on frozen
supernatants from cavitary effusions
44
Added blood
sample
WBC count in added blood
(× 109/L) FIP effusion cats Non-FIP effusion cats
1 5.1 2, 4, 6, 7
2 11.4 13
3 13.0
29
4 13.4 3, 18 21, 22
5 14.1 19 26, 27, 34
6 15.3 33
7 19.4 16 20, 28
8 20.1 14 32
9 26.8 9
10 34.1 17
11 36.2 25
12 39.9 1, 5, 10, 15
13 44.6 11, 12
14 65.0 8 23, 24
15 154 30, 31
Table 1. White blood cell (WBC) counts of the 15 blood samples added to the effusions of the 34 cats
included in the study.
Results and discussion
The addition of blood did not generate a matrix effect that interfered with the cell counts, as
demonstrated by the fact that the WBC-DIFF in the effusion was close to 10% of the added blood
cell count, as expected using the 1:10 dilution (10.9 ± 1.2 in the whole caseload; 11.1 ± 1.2 in FIP
effusions; 10.8 ± 1.2 in non-FIP effusions). This was found in all the cases but one, were the WBC-
DIFF count recorded in the effusions added with blood was 24.6% compared with the WBC count
in blood.
In 12 of 27 cases that were analyzed with both methods (cats 2–4, 6, 7, 13, 15, 17, 21, 31, 32, 34),
the modified ΔTNC was lower than the original one (Fig. 2).

Diagnosing feline infectious peritonitis using the Sysmex XT-2000iV based on frozen
supernatants from cavitary effusions
45
Figure 2. Results of the delta total nucleated cells (ΔTNC) on fresh effusions with the original method
(white bars) and on frozen–thawed supernatants using the modified method described in this study (gray
bars) in cats with feline infectious peritonitis (cats 1-19) or without FIP (cats 20-34). The horizontal dashed
black line and the horizontal dotted line indicate the cutoffs that have been defined, respectively, as
“suggestive for FIP” (1.7) and “consistent with FIP” (3.4) in the previous study.
* Effusions in which the WBC-DIFF count was lower in the modified method than in the original method.
† Effusions in which the WBC-DIFF count was higher in the modified method than in the original method.
‡ Effusions in which the WBC-DIFF count was unchanged in the modified method compared with the
original method.
In 8 of these cases, the WBC-DIFF count resulted from the addition of blood, was lower than in the
fresh sample. Conversely, in 6 of 27 cases (cats 5, 9, 11, 12, 14, 26), the modified ΔTNC was higher
than the original, and in 3 of these cases the WBC-DIFF count was higher than that of the fresh
sample. In 9 of 27 cases (cats 8, 20, 22–25, 27, 30, 33), 8 of which belonged to the non-FIP group,
the modified ΔTNC remained unchanged compared with the original ΔTNC (<10% variation
compared with the original ΔTNC), despite the WBC-DIFF count being higher in 6 of these cases
compared with the fresh sample. Therefore, the modified method induced variations of the ΔTNC
in approximately two-thirds of samples (16 of 27 cases).
Results obtained with the 2 methods were compared using a Wilcoxon signed rank test, and no
significant differences were recorded, suggesting that frozen supernatants provide results similar
to fresh samples (figure 3).

Diagnosing feline infectious peritonitis using the Sysmex XT-2000iV based on frozen
supernatants from cavitary effusions
46
Moreover, the increase or decrease of the ΔTNC does not seem to be proportional to the values of
the WBC-DIFF counts recorded after mixing blood with supernatants; in approximately one-third
of samples, the ΔTNC did not change, despite a marked difference between the WBC-DIFF count of
fresh samples and the WBC-DIFF count recorded after mixing blood with the supernatants. This
suggests that the final WBC-DIFF count obtained after dilution does not directly influence the
ΔTNC. The design of our study does not allow to determine the number of WBCs needed in a feline
blood sample to optimize the test. However, the fact that effusions added with the same blood
sample often had different ΔTNC values, supports the hypothesis that the ΔTNC is influenced by
the type of effusion rather than by the cell count of the added blood. However, it is possible that
blood samples with leukopenia, not included in our study, lead to a WBC-DIFF count in the
effusion so low as to hamper the possibility of having, in FIP cats, a ΔTNC sufficiently high to
Figure 3. Comparison of results
obtained in fresh effusions processed
with the original method or in frozen
effusions using the modified method
(A and B) or in frozen samples with
different blood effusion ratios (C and
D). The ∆TNC recorded in cats with FIP
are reported in A and C; The ∆TNC
recorded in cats without FIP are
reported in B and D.
The boxes indicate the I–III
interquartile range (IQR), the
horizontal line indicates median
values, whiskers extend to further
observation within the I quartile minus
1.5xIQR or within the III quartile plus
1.5xIQR.

Diagnosing feline infectious peritonitis using the Sysmex XT-2000iV based on frozen
supernatants from cavitary effusions
47
support a clinical diagnosis of FIP. Hence, the use of leukopenic blood samples to spike frozen
effusions cannot be recommended based on our results.
In order to assess the effect of dilution, 9 samples (4 from cats with FIP and 5 from cats without
FIP) were tested using 2 dilutions of blood: 1:10, as described above, and 1:5 (i.e., 40 μL of blood
in 160 μL of supernatant). Also in this case, no significant differences were found with the 2
dilutions either in the FIP group or in the non-FIP group, and the classification of samples as
consistent or not consistent with FIP did not change at the 1:5 dilution compared with the 1:10
dilution (figure 4).
The 4 FIP effusions were also analyzed using a 1:2 dilution (100 µL of blood in 100 µL of
supernatant) and, even though no significant differences or changes in the classification of
samples were found in this comparison, the ΔTNC decreased in all 4 cases (from 12.6 to 7.7, from
4.10 to 1.22, from 4.75 to 0.74, from 0.98 to 0.97 in a 1:10 and 1:2 dilution, respectively). These
data suggest that when the supernatant:blood ratio is low, the amount of fibrin (and other
inflammatory proteins) is too low to induce cell clumping given the dilution of proteins responsible
for WBC clumping. Therefore, the 1:5 and 1:10 dilution provide similar results, and the 1:10
dilution should be preferred to facilitate the calculation of volumes.
The total protein content of the effusions was high independently on the final diagnosis (2.7 to 6.0
g/dL in non FIP effusions; 3.3 to 7.2 g/dL in FIP effusions) hence it did not influence the ΔTNC
values with either the original or the modified method, suggesting that it is not the overall amount
of protein that is responsible for the increased ΔTNC, but rather the presence of a particular
protein pattern. Using the 1:10 dilution, independently of the differences in ΔTNC values between
fresh and frozen–thawed samples, all the effusions from cats without FIP had a ΔTNC <1.7 using
Figure 4. Comparison of the results
obtained in frozen-thawed samples
with different blood effusion ratios.
The ΔTNC recorded in cats with FIP are
reported in A, while the ΔTNC recorded
in cats without FIP are reported in B.
The boxes indicate the I–III
interquartile range (IQR), the horizontal
line indicates median values, whiskers
extend to further observation within
the I quartile minus 1.5xIQR or within
the III quartile plus 1.5xIQR.

Diagnosing feline infectious peritonitis using the Sysmex XT-2000iV based on frozen
supernatants from cavitary effusions
48
both methods. Conversely, on fresh effusions from cats with FIP, 4 of 14 samples (cats 2, 8, 9, 17)
had a ΔTNC <1.7, 3 of 14 samples (cats 11–13) had a ΔTNC of 1.7–3.4, and 7 of 14 samples (cats 3–
7, 14, 15) had a ΔTNC consistent with FIP (>3.4). Using the modified technique, 2 of the 4 “false-
negatives” (ΔTNC <1.7; cats 2, 8) remained falsely negative, 1 of 4 (cat 17) increased to values
suggestive of FIP (ΔTNC of 1.7–3.4), and 1 of 4 (cat 9) resulted as positive (ΔTNC >3.4). Only 1 true-
positive sample based on the fresh sample (cat 13; which, however, had a ΔTNC of 1.89, close to
the lowest cutoff of 1.7) resulted as a false-negative (ΔTNC <1.7) using the modified technique.
The 2 other samples that on fresh effusions had a ΔTNC of 1.7–3.4 (cats 11, 12) resulted as positive
(ΔTNC >3.4) using the modified technique. Therefore, in cats with FIP, using the modified
technique, 3 of 19 samples (cats 2, 8, 13) had a ΔTNC <1.7, 1 of 19 (cat 17) had a ΔTNC of 1.7–3.4,
and all the other samples had a ΔTNC >3.4. Hence, both methods, independently of the cutoff,
show absolute specificity and PPV (100.0%). The sensitivity and NPV of the modified method
(84.2% and 83.3% at the cutoff of 1.7; 78.9% and 78.9% at the cutoff of 3.4) were higher than that
of the original method (78.6% and 81.3% at the cutoff of 1.7; 57.1% and 68.4% at the cutoff of
3.4). Thus, the diagnostic interpretation of ΔTNC using the cutoffs that in study I were considered
suggestive of FIP (ΔTNC >1.7) or consistent with FIP (ΔTNC >3.4) indicates that the modified
method minimally affects the classification of samples as “FIP” or “non-FIP,” independently of the
ΔTNC value obtained from fresh samples. Three samples from cats with FIP had a low ΔTNC count
either with both the techniques, probably due to intrinsic properties of the effusions, as noted in
the previous study. Thus, if the ΔTNC is negative using both methods, FIP must be confirmed using
tests other than the ΔTNC.
The results of our study demonstrated that the modified ΔTNC is an alternative, reliable tool to
diagnose effusive FIP in those cases where cytology of the effusion or other biochemical tests on
the supernatants cannot be performed immediately after sampling. This method can be
performed on frozen supernatants, thus allowing retrospective analyses of stored fluids.
Supernatants from FIP effusions, likely because of their protein pattern, retain the ability to clump
cells derived from blood samples, whereas the non-FIP effusions do not. Therefore, it may be best
to centrifuge effusions that cannot be analyzed immediately, and to remove and send the
supernatant to the laboratory. Future studies focused on determining the minimum number of
WBCs needed to obtain a positive result may further improve the performance of this alternative
method.

Frequency of electrophoretic changes consistent with feline infectious peritonitis in two
different time periods (2004-2009 vs 2013-2014)
49
III. Frequency of electrophoretic changes consistent with feline infectious
peritonitis in two different time periods (2004-2009 vs 2013-2014)
Material and methods
Retrospective search of the database
The database of the DIMEVET laboratory was retrospectively analysed. All the results of serum
protein electrophoresis, either data referred to capillary zone electrophoresis (CZE) or data
referred to agarose gel electrophoresis (AGE), performed between 2004 and 2014 were
downloaded in an Excel sheet for the following selection procedures. Results referred to the two
electrophoretic techniques were separately analysed.
Electrophoretic methods and groups formation
Agarose gel electrophoresis and capillary zone electrophoresis were performed using automated
systems and kits provided by the manufacturer of the instruments, Hydrasis and Minicap
respectively (Sebia Italia Srl, Bagno a Ripoli, Florence, Italy). For AGE, after 10 μl of each serum
sample were manually loaded in the applicator, a 0.8% agarose gel was run in trisbarbital buffer at
pH 8.6, with a migration time of 7 mins at 20 W Gels were then dried (10 mins at 65°C),
automatically stained with Amido Schwarz, destained and dried again for scanning by the
appropriate gel scanner. For CZE, serum samples were aspirated from the anode end of a silica
capillary; proteins were then separated at 35°C by migration for 2.5 mins at high voltage
(9000 V) in an alkaline buffer (pH 9.9). For AGE, data were then transferred to the software
(Phoresis, Sebia Italia Srl) which analyses the density of each band, creating a corresponding peak,
and separates each fraction based on the slopes of the curves. For CZE, variations of absorbance
due to the protein flow were read through a spectrophotometer at 240 nm wavelength and
recorded in real time by the software program (Phoresis) producing the typical electrophoretic
peaks.
For both the techniques, albumin, α1-, α2-, β1-, β2- and γ-globulin fractions were generated. For the
purpose of this study, only data regarding electrophoretic fractions important for the diagnosis of
FIP (total protein, albumin, α2-, and γ-globulin, total globulin and A/G ratio) were recorded and
statistically analyzed. Absolute protein concentrations (g/dL) for each electrophoretic fraction
were calculated based on the percentage of the area under each peak and on total serum protein

Frequency of electrophoretic changes consistent with feline infectious peritonitis in two
different time periods (2004-2009 vs 2013-2014)
50
concentrations measured through an automated spectrophotometer (Cobas Mira, Roche) using
the biuret method, except for 6 cases (5 processed with AGE and 1 with CZE), on which total
proteins were not measured. In these cases, only the percentages of the different fractions were
included in the statistical analysis.
Data regarding SPE were divided in two groups:
FIP: cats with necropsy and histology consistent with FIP and with intralesional coronaviruses
detected by immunohistochemistry,
Healthy cats: samples included in this group were submitted for annual wellness visits or for
preoperative examinations or were included as a control group in previous studies and had
unremarkable clinical or laboratory findings (Paltrinieri et al., 2014a; Paltrinieri et al., 2014b).
Statistical analysis
Statistical analysis was performed in an Excel (Microsoft Corp, Redmond, WA, USA) spreadsheet
using the Analyse-it v-2.1 software (Analyse-it Software Ltd, Leeds, UK).
Results obtained in the two time spans (2004-2009 vs 2013-2014) from FIP and healthy cats were
compared to each other using a nonparametric t-test for independent measurements (Mann
Whitney U test). The significance level was set at p<0.05.
For the two time periods examined in this study, the number of cats from the FIP group showing
single or combined electrophoretic changes consistent with FIP was counted (Pedersen, 2009;
Giordano and Paltrinieri, 2010). To this aim, the relative and absolute value of the electrophoretic
parameters listed above (expressed as percentage and g/L respectively) were compared with the
reference intervals described in a previous study for AGE and CZE, respectively (Giordano and
Paltrinieri, 2010).
In addition, each electrophoretogram obtained from FIP cats underwent a visual analysis
performed by two operators in a blind manner. Electrophoretograms were interpreted as
“consistent with FIP” if showing both α2- and γ-globulin polyclonal peaks; as “dubious” if showing
only one of the mentioned peaks and as “not consistent with FIP” if α2- and γ-globulin polyclonal
peaks were both absent or if alterations typical of other diseases (e.g. monoclonal gammopathy)
were detected (figure 1). In the case of disagreement between the classification of the
electrophoretograms by the two observers, each electrophoretograms were evaluated as a man to
reach a final consensual interpretation.

Frequency of electrophoretic changes consistent with feline infectious peritonitis in two
different time periods (2004-2009 vs 2013-2014)
51
Both the comparison with reference intervals and the visual analysis were used to calculate the
number of FIP cats with electrophoretic pattern consistent with FIP in order to calculate the
sensitivity of the method.
A Pearson chi-square analysis was used to evaluate the possible differences in the proportion of
changes consistent with FIP either in terms of relative or absolute changes compared with the
reference values and in terms of visual analysis.
Figure 1. Examples of electrophoretograms considered (A, D) not consistent with feline infectious
peritonitis (FIP), (B, E) dubiously consistent with FIP and (C, F) consistent with FIP, performed with (A–C)
agarose gel electrophoresis and (D–F) capillary zone electrophoresis. A, D: no electrophoretic abnormality;
B: α2-globulin but not γ-globulin increased; E: increased γ-globulin but not α2-globulin; C, F: both α2-and γ-
globulin are increased.
Results
Retrospective search and final caseload
The following selection procedure, reported in figure 2, led to a final caseload of 91 AGE
and 45 CZE. A similar proportion of effusive and non effusive forms was found in the two
study period either for AGE or for CZE (dry forms = 3/17 [17.6%] in the first period; 5/24
A
B
C
D
E
F
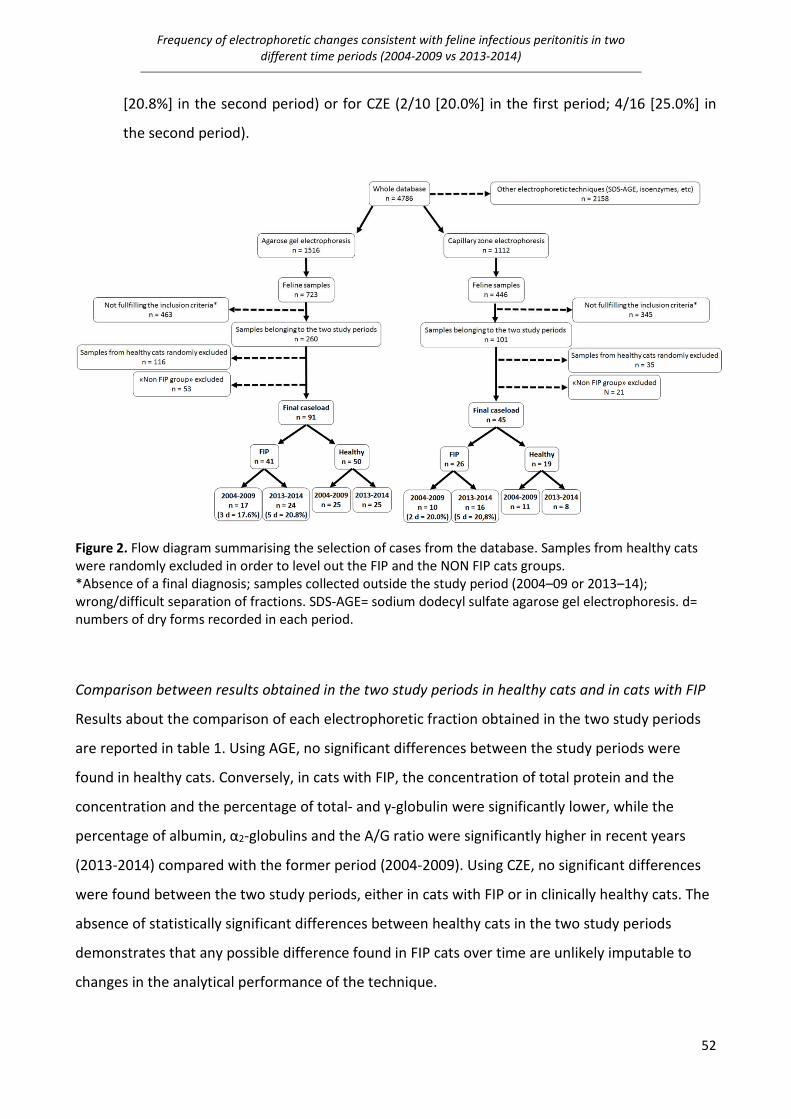
Frequency of electrophoretic changes consistent with feline infectious peritonitis in two
different time periods (2004-2009 vs 2013-2014)
52
[20.8%] in the second period) or for CZE (2/10 [20.0%] in the first period; 4/16 [25.0%] in
the second period).
Figure 2. Flow diagram summarising the selection of cases from the database. Samples from healthy cats
were randomly excluded in order to level out the FIP and the NON FIP cats groups.
*Absence of a final diagnosis; samples collected outside the study period (2004–09 or 2013–14);
wrong/difficult separation of fractions. SDS-AGE= sodium dodecyl sulfate agarose gel electrophoresis. d=
numbers of dry forms recorded in each period.
Comparison between results obtained in the two study periods in healthy cats and in cats with FIP
Results about the comparison of each electrophoretic fraction obtained in the two study periods
are reported in table 1. Using AGE, no significant differences between the study periods were
found in healthy cats. Conversely, in cats with FIP, the concentration of total protein and the
concentration and the percentage of total- and γ-globulin were significantly lower, while the
percentage of albumin, α2-globulins and the A/G ratio were significantly higher in recent years
(2013-2014) compared with the former period (2004-2009). Using CZE, no significant differences
were found between the two study periods, either in cats with FIP or in clinically healthy cats. The
absence of statistically significant differences between healthy cats in the two study periods
demonstrates that any possible difference found in FIP cats over time are unlikely imputable to
changes in the analytical performance of the technique.

Frequency of electrophoretic changes consistent with feline infectious peritonitis in two
different time periods (2004-2009 vs 2013-2014)
53
Table 1. Comparison of each electrophoretic fraction between the two study periods in cats with FIP and
healthy cats analysed with agarose gel (AGE) and capillary zone (CZE) electrophoresis. Results are
presented as mean ± SD, median (in brackets) and I–III interquartile intervals
*n = 14 for values in g/dl; †n = 22 for values in g/dl; ‡n = 9 for values in g/dl;
§P <0.001 vs 2004–2009; ¶P <0.05 vs 2004–2009 ∞P <0.01 vs 2004–2009

Frequency of electrophoretic changes consistent with feline infectious peritonitis in two
different time periods (2004-2009 vs 2013-2014)
54
Frequency of electrophoretic alterations in comparison with reference intervals
In the first period (2004-2009) all the cats with FIP tested with AGE and most of the cats with FIP
tested with CZE had hyperproteinemia (table 2), while the proportion of cats with FIP and
hyperproteinemia was lower in the second period, with a significant difference for AGE.
Independently on the electrophoretic technique, the proportion of FIP cats with a simultaneous
increase of α2- and γ-globulin was similar in the two study periods, while in the second period a
higher rate of cases characterized by an increase of α2-globulins without gammopathy and a lower
rate of cases characterized by gammopathy but not by the increases of α2-globulin were found
and, in this latter case, a significant difference was found for percentage values in samples
processed by AGE, and for absolute values in samples processed with both the techniques.
Table 2. Frequency of electrophoretic alterations compared with the reference intervals.
Results are presented as number of observations/total number of cases (%) *P <0.05 vs 2004–2009
Visual interpretation of electrophoretograms in the two time spans
The agreement between the two operators resulted absolute (100%) for AGE. Using AGE, only half
of the FIP cats showed the typical pattern of FIP, while this proportion increased using CZE,
confirming that the sensitivity of this test is not absolute (table 3). Anyway, the diagnostic
sensitivity of SPE resulted similar in the two examined time spans, while the number of the
dubious patterns increased in the second period with AGE but not with CZE. However, all these
differences were not statistically significant.

Frequency of electrophoretic changes consistent with feline infectious peritonitis in two
different time periods (2004-2009 vs 2013-2014)
55
Table 3. Results of the visual interpretation analysis performed by two operators on the
electrophoretograms of cats with feline infectious peritonitis (FIP).
Results are presented as number of observations/total number of cases (%).
Discussion
In this study, the performance of SPE was retrospectively studied in order to understand if
electrophoretic patterns not consistent with FIP, anecdotally observed in recent years in our
laboratory in FIP cats, were really more frequent than in the past.
In the FIP group, the percentage of effusive and non effusive forms was similar for the two
electrophoretic techniques examined in this study and the proportion of samples retrospectively
analysed after freezing and analysed with the two techniques was similar in the two periods, both
demonstrating that changes in the electrophoresis patterns are unlikely associated with a different
rate of effusive vs non effusive FIP and excluding that differences in the patterns could be
associated with storage artefacts, which are anyway known to minimally affect SPE (Eckersall,
2008; Stockham and Scott, 2008). Regarding FIP cats tested with AGE, total protein concentration
was significantly lower in the recent period in comparison with the previous one. In addition, total
protein concentrations in the recent period were frequently close to or lower than the reference
intervals established in our laboratory. Both the relative and the absolute concentrations of total
and γ-globulins were significantly lower in the second period. Therefore, the albumin/globulin
ratio was significantly higher and frequently within the reference interval in FIP cats in the second
period, in contrast with what reported by Sparkes et al. (1991), who recorded a high prevalence of
low albumin/globulin ratio in FIP cats.
The analysis of results obtained with CZE revealed the same trends over time either for total
proteins and for electrophoretic fractions, but the differences were not statistically significant.
Also, the comparison with the reference intervals in the two periods confirmed that the
proportion of electrophoretic alterations in FIP cats for both the electrophoretic techniques was
higher in the first period, also in this case with different statistical significance between AGE and
CZE, likely due to the different numbers of samples in the caseload. While all the FIP cats analysed

Frequency of electrophoretic changes consistent with feline infectious peritonitis in two
different time periods (2004-2009 vs 2013-2014)
56
with AGE and most of the cats analysed with CZE presented hyperproteinemia in the first period,
this alteration was less frequent in the recent years. The most frequent difference between the
two periods was the decreased frequency of hypergammaglobulinemia, which is known to be the
most typical finding in FIP cats (Pedersen, 2009). Another interesting aspect was the increased
percentage, in the second period and for both the techniques, of increased α2-globulins not
associated with a concurrent gammopathy. Theoretically, the absence of the gammopathy may be
imputable to the time of sampling since experimental studies showed that γ-globulins increase a
couple of weeks later than the increased of α2-globulins (Addie et al., 2004). In the current study,
in two cats with increased α2-globulin and normal γ-globulins tested in the first period of time (one
with AGE and one with CZE), the gammopathy appeared when electrophoresis was repeated two
weeks later. Conversely, three cats with the same electrophoretic profile tested in the second
period (two with AGE and one with CZE) did not develop the gammopathy in samplings repeated
in the following month. This suggests that in the second period of the study the high frequency of
increased α2-globulin in the absence of gammopathy may not depend on the stage of the disease.
The results of this study seem to indicate a less intense antigenic stimulation in FIP cats, reflected
by γ-globulin concentrations lower than in the past and closer to the reference intervals of our
laboratory. This finding is likely related to a lower concentration of immunoglobulins which are the
most relevant proteins known to migrate in the gamma region (Stockham and Scott, 2008). A
possible explanation for this finding is a variation of the host-coronavirus interactions, possibly
due to changes in viral immunogenicity and/or to the development of a different immune
response of the feline population analysed. The design of this study does not allow to investigate
this pathogenic aspect, but our results are encouraging to design future studies on the
characteristics of viral populations recently isolated or on host-virus interactions. Conversely,
results on repeated samplings above mentioned tend to exclude the possibility that the
differences reported over time depend on an earlier identification of symptoms as compatible
with FIP by the referring veterinarians and consequently on the analysis of samples collected in an
early stage of disease, when the antigenic response has not yet been triggered.
Also, the possible effect of drug administration on the development of gammopathy seems
unlikely since samples were submitted before the provisional diagnosis was emitted and therefore
before starting any treatment.
Even if the possible reasons for these changes were not investigated in this study, it is important
to highlight how the absence of the typical electrophoretic alterations could affect the

Frequency of electrophoretic changes consistent with feline infectious peritonitis in two
different time periods (2004-2009 vs 2013-2014)
57
interpretation of electrophoretograms and the diagnosis of FIP, especially in its non effusive form,
since in this latter form tests on effusions (e. g. immunofluorescence, Rivalta’s test), which are
known to be accurate, are not available (Hartmann, 2005; Fischer et al., 2012). Regarding this
aspect, the visual interpretation performed on the electrophoretic patterns pointed out the low
sensitivity of this approach for the diagnosis of FIP and also how the “dubious patterns” (e.g. the
presence of one of the typical alterations for FIP alone) increased in the second period for AGE.
The results obtained in this study with AGE were slightly discordant with those obtained with CZE,
likely due to the higher resolution typical of this latter technique that allows to detect higher and
narrower peaks, that may thus become visually evident also when percentage or absolute values
are closer to or lower than the upper reference limits (Giordano and Paltrinieri, 2010). This
information suggests that CZE, probably due to its analytical properties like its higher resolution
compared with AGE (Giordano and Paltrinieri, 2010), may have a better sensitivity compared to
AGE, especially in identifying the gammopathy, which seems to be less frequent in FIP cats in the
recent time span.

Comparison of the diagnostic performances of laboratory tests for the diagnosis of feline
infectious peritonitis
58
IV. Comparison of the diagnostic performances of laboratory tests for the diagnosis of
feline infectious peritonitis
Material and methods
Caseload and laboratory methods
This was a retrospective study based on the results recorded with different clinico-pathological or
molecular methods on samples submitted to the diagnostic laboratory of the DIMEVET laboratory
between 2013 to 2015. The laboratory database was analysed to select data fulfilling the following
criteria:
- Clinical suspicion of FIP, based on history and clinical signs (fever, lethargy, anorexia,
weight loss, neurological/ocular signs, effusions, etc.)
- Availability of a final diagnosis, based on post-mortem findings or on 18 months follow
up, as specified below
- Presence of at least one result regarding the clinico-pathological tests (serum protein
electrophoresis and α1-acid glycoprotein measurement on blood, cytology and ΔTNC
measurement on effusions) or the molecular tests (nRT-PCR for 3’UTR and Spike gene
sequencing on blood, effusions and tissues) included in this study.
All the samples were analysed for routine diagnostic purposes and collected under informed
consent of the owners, therefore a formal approval from the Ethical Committee was not required
(EC decision 29 Oct 2012, renewed with the protocol n° 02-2016).
Cats were assigned to the FIP group if typical histopathological findings along with a positive result
on immunohistochemistry against the FCoV in at least one tissue were present (Figure 1)
(Pedersen, 2009). Cats were assigned to the non-FIP group when histology revealed the presence
of diseases other than FIP along with negative results on immunohistochemistry on all the
sampled tissues, when the follow-up demonstrated a complete recovery (remission of the
symptoms, normalization of the recorded laboratory alterations) after 18 months from the first
diagnostic procedures, or when a definitive diagnosis was achieved through collateral laboratory
and/or imaging analyses.

Comparison of the diagnostic performances of laboratory tests for the diagnosis of feline
infectious peritonitis
59
Figure 1. Example of a positive histology and immunohistochemistry for the assignation of the cats to the
FIP group. A. Haematoxyilin-eosin stained section of a spleen showing a typical FIP lesion, with a necrotic
center surrounded by neutrophils and macrophages. B. The same section with positive result at
immunohistochemical examination, with the surrounding macrophages containing the viral antigen stained
in golden/brown.
Post-mortem examinations
Cats euthanized by the referring veterinarians due to the worsening of the clinical conditions were
kept refrigerated until subjected to necropsy within 6 hours. One specimen from all organs
affected by gross lesions was collected, fixed in 10% buffered formalin and embedded in paraffin.
Another specimen from at least one affected organ (mostly mesenteric lymph node) was
immediately frozen at -80°C for molecular analyses.
Histology was performed on microtomic sections (5 μm) stained with haematoxylin-eosin.
Immunohistochemistry was performed using a mouse monoclonal antibody anti-FCoV (FIPV3-70
clone, Serotec) and the standard avidin biotin complex (ABC- Vectastain Elite, Vector laboratories
Inc.) method (Hsu et al., 1981). As a chromogen, 3,3’-Diaminobenzidine (DAB) (Vector
Laboratories) was used. The slides were counterstained with Mayer’s haematoxylin. In each
working session, a section of kidney from a cat with confirmed FIP served as positive control.
Negative controls consisted of serial sections of tested tissues in which anti-FCoV antibody was
replaced with normal not immune mouse serum (DAKO; Glostrup Denmark).
On FIP cats, immunohistochemistry was performed on selected specimens with typical histological
lesions, while in non-FIP cats all the tissues collected during necropsy were tested with
immunohistochemistry, in order to definitively exclude the presence of FCoVs.

Comparison of the diagnostic performances of laboratory tests for the diagnosis of feline
infectious peritonitis
60
Tests on serum
Total proteins were spectrophotometrically measured using the biuret method (Cobas Mira,
Roche), then SPE was performed on agarose gel using the automated analyser Hydrasis (Sebia
Italia Srl) and a specific kit (Hydragel 15 β1- β2, Sebia Italy Srl) as previously described (Giordano
and Paltrinieri, 2010). Gels were scanned and data were analysed with the appropriate software
(Phoresis, Sebia Italia Srl).
The serum concentration of AGP was measured using a radial immunodiffusion kit (SRID, Tridelta
Development Limited) as previously described (Paltrinieri et al., 2007).
Tests on effusions
Fresh effusions were analysed with the Sysmex XT-2000iV (Sysmex Europe GmbH, Norderstedt,
Germany). The ΔTNC was recorded as reported in study I (see above).
Cytological examination was performed by an ECVCP diplomate on smears or on cytocentrifuged
samples stained with a rapid stain (Hemacolor, Merck).
Molecular tests on blood, effusions and tissues
Whole blood and effusions collected in EDTA were centrifuged (3,000 × g, 5 min) within 12 hours
and the obtained pellets were suspended in 200 μL of PBS by vigorous vortexing and immediately
stored at -20 °C for further RNA extraction.
Samples were subjected to RNA extraction using a NucleoSpin RNA commercial kit (Macherey-
Nagel), according to the manufacturer’s instruction. The extracted RNA was screened for the
presence of FCoV using a RT-nPCR targeting a 177 bp product of the highly conserved 3’ un-
translated region (3’ UTR) of the genome of both type I and type II FCoV (Herrewegh et al., 1995b).
FCoV RNA was used as positive control and RNase-free water as negative control. PCR products
were visualized under UV transilluminator on a 2% agarose gel stained with ethidium bromide.
The extracted RNA subjected to S gene sequencing was previously tested using an RT-nPCR
targeting a 142 bp product of the S gene (Chang et al., 2012). Positive samples were sequenced
using the forward and reverse primers used for the second reaction. Sequencing was performed at
an external laboratory (Parco Tecnologico Padano, Lodi, Italy) using a Big Dye Terminator version
3.1 Cycle Sequencing kit and an AB3730 DNA Analyzer (Applied Biosystems).

Comparison of the diagnostic performances of laboratory tests for the diagnosis of feline
infectious peritonitis
61
Sequence data were assembled and manually corrected using BioEdit software version 7.01.
Consensus sequences were aligned with FCoV strains bearing or not the mutations M1058L or
S1060A, retrieved from GenBank, using Clustal X in the BioEdit software.
Calculation of diagnostic performances
Samples were classified as positive when features considered as consistent with FIP based on
literature (table 1) were present, and as negative (not consistent with FIP) when findings reported
in table 1 were absent or when features considered as dubious or suggestive (but not
confirmatory) for FIP were present. Dubious features included the lack of granular background in
cytological samples, ΔTNC values between 1.7 and 3.4 (the cut-off values established in study I),
increased serum α2-globulins but normal γ-globulins or vice-versa, or AGP values between 0.56
(reference value of the laboratory) and 1.5 mg/mL (figure 2) (Paltrinieri et al., 2007).
When molecular tests were performed on more than one tissue specimen, cats were considered
as positive when at least one of the tested organs provided a positive result and negative when all
the tested organs resulted negative.
For each test, TP and FP results (results consistent with FIP in cats with and without FIP,
respectively), TN and FN results (results not consistent with FIP in cats without and with FIP,
respectively) were recorded. Sensitivity, specificity, as well as positive and negative likelihood
ratios (LR+ and LR-) were then calculated (Christenson, 2007).
1 See http://www.mbio.ncsu.edu/BioEdit/bioedit.html

Comparison of the diagnostic performances of laboratory tests for the diagnosis of feline
infectious peritonitis
62
Figure 2. Serum protein electrophoretic and cytological patterns used for the calculation of diagnostic
performances. A: SPE consistent with FIP (increased α2- and γ globulin with a polyclonal peak; B: SPE not
consistent with FIP (absence of α2- and γ globulin with a polyclonal peak); C: SPE dubious for FIP (presence
of α2-globulin peak only); D: cytological pattern consistent with FIP (presence of an inflammatory non-
specific process and of a proteinaceous background); E: cytological pattern not consistent with FIP
(adenorcarcinoma), F: cytological pattern dubious for FIP (presence of an inflammatory non-specific
process without the proteinaceous background).

Comparison of the diagnostic performances of laboratory tests for the diagnosis of feline
infectious peritonitis
63
Specimen Test Features and cut-offs consistent with FIP
Effusion
Cytology
Presence of an inflammatory non-specific process and of a
proteinaceous background
ΔTNC >3.4
RT-nPCR 3’ UTR Positive result
S gene sequencing Presence of M1058L or S1060A mutations
Blood
SPE Increased α2- and γ globulin with a polyclonal peak
AGP >1.5 mg/mL
RT-nPCR 3’ UTR Positive result
S gene sequencing Presence of M1058L or S1060A mutations
Tissues
RT-nPCR 3’ UTR Positive result
S gene sequencing Presence of M1058L or S1060A mutations
Table 1. Laboratory tests performed on the different specimens and features and/or cut-offs that were
considered consistent with FIP (Herrewegh et al., 1995b; Sparkes et al., 1991; Paltrinieri et al., 2001;
Paltrinieri et al., 2007; Pedersen, 2009; Chang et al, 2012).

Comparison of the diagnostic performances of laboratory tests for the diagnosis of feline
infectious peritonitis
64
Results
Thirty cats (age range: four months to 13 years) suspected to have FIP because of their history and
clinical signs were included in this study. The FIP group included 16 cats on which FIP was
confirmed post-mortem through histology and positive immunohistochemistry on at least one
examined tissue.
The non-FIP group included 14 cats. In three of these, FIP was ruled out based on normalization of
clinical and laboratory findings during a one-year follow-up (cats n° 20, 21 and 22, with persistent
fever, inappetence and lethargy); in three cats a disease other than FIP was diagnosed through
cytology, imaging and flow cytometry (cats n° 24 with hepatic carcinoma and cats n° 28 and 29,
both with lymphoma); in 8 cats post-mortem findings were consistent with a disease other than
FIP and no FCoVs were detected on tissues by immunohistochemistry (cats n° 17, 18, 19, 23, 25,
26, 27 and 30 with renal failure, pleuro-pericardial fibrosis, pleomorphic sarcoma, lymphocytic
cholangitis, intestinal carcinoma, myelofibrosis, polycystic kidney disease and lymphoma,
respectively).
The samples collected from each case are summarized in table 2, along with the results obtained
in the different tests performed on blood, effusions or tissues. Sensitivity, specificity, and
likelihood ratios of each test are reported in table 3.
On blood, all the tests had a high or absolute specificity and a high LR+, while the sensitivity was
low, except for the measurement of AGP. This test had the highest sensitivity and LR+ and the
lowest LR-. SPE and S gene sequencing had the highest LR- values.
On effusions, all the tests had high to absolute sensitivity and specificity and, consequently, high
to absolute LR+ and low to excellent LR-, except for the S gene sequencing that had the worst
performance in terms of sensitivity LR+ and LR-.
On tissues, the RT-nPCR 3’UTR had the best sensitivity and a low LR-, but also low specificity and
low LR+. Conversely, S gene sequencing had a high specificity and LR+ but a lower sensitivity and a
slightly higher LR-.

Comparison of the diagnostic performances of laboratory tests for the diagnosis of feline
infectious peritonitis
65
Specimen Test Sens Spec LR+ LR-
Blood
SPE 42.9% 90.0% 4.29 0.63
AGP 85.7% 81.8% 4.71 0.17
3’ UTR PCR 75.0% 100.0% nc 0.25
S gene sequencing 42.9% 100.0% nc 0.57
Effusions
Cytology 100.0% 83.3% 6.00 0.00
ΔTNC 80.0% 100.0% nc 0.20
3’ UTR PCR 100.0% 83.3% 6.00 0.00
S gene sequencing 40.0% 83.3% 2.40 0.72
Tissues
3’ UTR PCR 90.9% 50.0% 1.82 0.18
S gene sequencing 70.0% 87.5% 5.60 0.34
Table 3. Sensitivity (Sens), Specificity (Spec), positive and negative likelihood ratio (LR+ and LR-,
respectively) calculated for each test and specimens.
ΔTNC: ratio between total nucleated cells counted on the two channels of the Sysmex XT-2000iV; SPE=
serum protein electrophoresis; AGP= α1-acid glycoprotein; nc= not calculable based on the 100% specificity
Discussion
This study was designed to compare the diagnostic performances of some of the tests currently
employed for the diagnosis of FIP since only few studies compared the diagnostic accuracy of
different tests (Sparkes and others 1991, Paltrinieri and others 2001, Hartmann and others 2003,
Giori and others 2011). Strict inclusion criteria (i.e. only cases with a conclusive diagnosis or with a
complete recovery during the follow up were included in the study) were applied in order to
increase the reliability of the results, but inevitably reducing the caseload. To minimize the
negative effect of the small number of cases (and especially of “non-FIP cats”), the informative
power of each test was calculated in terms of likelihood ratios that, contrarily to predictive values,
are not influenced by the prevalence of the disease and may provide information about the tests
that may increase or decrease the post-test probability of FIP (LR+ notably >1.0 or LR- close to 0.0,
respectively).
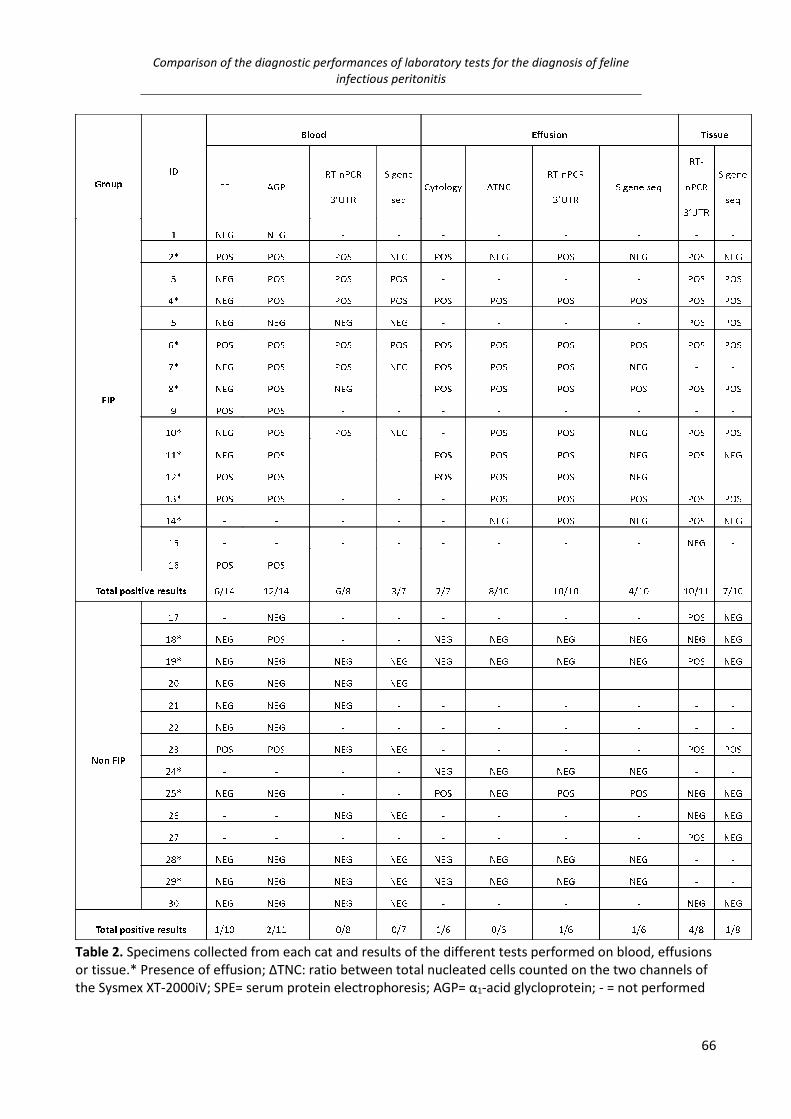
Comparison of the diagnostic performances of laboratory tests for the diagnosis of feline
infectious peritonitis
66
Table 2. Specimens collected from each cat and results of the different tests performed on blood, effusions
or tissue.* Presence of effusion; ΔTNC: ratio between total nucleated cells counted on the two channels of
the Sysmex XT-2000iV; SPE= serum protein electrophoresis; AGP= α1-acid glycloprotein; - = not performed

Comparison of the diagnostic performances of laboratory tests for the diagnosis of feline
infectious peritonitis
67
In this study, in fact, the prevalence of FIP was higher than in similar previous reports that
compared the diagnostic performances of different tests (Beatty and Barrs, 2010), since the
number of cats with signs consistent with FIP but affected by other disease was low. Additionally,
dubious results were considered as negative, since they cannot confirm the disease when taken
alone. Moreover, the low rate of inflammatory conditions in the non-FIP group may have
overestimated the specificity of tests suggestive of inflammation (cytology of the effusion, SPE,
AGP measurement). Despite these limitations, this study confirmed that none of the tests
examined in this study can be used alone to diagnose FIP.
In blood, SPE had a very low sensitivity since FIP cats showed dubious or negative patterns, in
disagreement with previous reports, and the LR ratios indicate that SPE cannot definitely rule out
FIP but it may be a confirmatory test (Sparkes et al., 1991, Riemer et al., 2016). The sensitivity of
AGP, although satisfactory and higher than that of all the other tests performed on blood, was
lower than in previous reports (Giori et al., 2011). Nevertheless, the false negative cases had
values consistent with inflammation (higher than the reference interval but lower than the cut-off
consistent with FIP) which, in conjunction with other consistent laboratory results, may support
the diagnosis of FIP. Interestingly, AGP showed also the lowest specificity and, although the LR-
was not low enough to recommend the use of this test to rule out FIP, AGP was, along with the RT-
nPCR 3’UTR, the most reliable test on blood indicating that values higher than the cut-off may
support a clinical diagnosis in presence of other changes consistent with FIP (Paltrinieri et al.,
2007). Based on the absolute specificity and on the relatively high LR-, also the molecular tests
cannot be used to rule out FIP but they may support the diagnosis of FIP in the case of positive
results.
Cytology and the RT-nPCR 3’UTR were the best test on effusion, despite the presence of false
positive results. This latter event, however, was rare (only one case in our caseload, characterized
also by a false positive cytological result) and it may be explained by the fact that non-specific
inflammatory cytological patterns are found in many inflammatory conditions (Paltrinieri et al.,
1999). Therefore, in accordance with previous reports, the cytology and the RT-nPCR 3’UTR cannot
be used to confirm FIP (Giori et al., 2011, Kipar and Meli, 2014), but based on their high LR+ these
are the tests of choice on effusion. The ΔTNC was specific but not as sensitive as expected,
possibly due to the low cell concentration of the samples that provided false negative results also
in study I. Hence, it may be used in addition to the other tests to support the diagnosis of FIP. The
spike gene sequencing had a low sensitivity. Moreover, one false positive result was recorded, as

Comparison of the diagnostic performances of laboratory tests for the diagnosis of feline
infectious peritonitis
68
described by Porter and others (2014) who found the spike gene mutations described by Chang et
al. (2012) in tissues of cats without FIP but in contrast with what reported by Longstaff et al.
(2015), who found an absolute specificity of the spike gene sequencing on effusions. Therefore,
the risk of false positive results, even if rare, make this test not optimal for the diagnosis of FIP.
In tissues the sensitivity of RT-nPCR 3’UTR was high but not absolute, while the sensitivity of the
spike gene was low. The negative results of the latter technique were due not only to the absence
of the mutated nucleotides, but also to a negative result at the Spike PCR (data not shown) and to
the resulting absence of sequencing templates. The RT-nPCR 3’UTR showed a low specificity,
confirming again what already described about the spread of the virus in cats not affected by FIP
and the resulting false positive results (Kipar et al., 2006b). On the other hand, the specificity of
the S gene sequencing was high as on the other specimens. Thus, the risk of false positive results
with the RT-nPCR 3’UTR is alarmingly high while the use of the S gene sequencing can be useful as
a confirmatory test, but its use for the exclusion of FIP should be avoided based on the results of
this study. A possible limitation of this study is that other mutations recently considered involved
in the pathogenesis of FIP, such as the mutation of the 3c genes, have not been investigated. The
inclusion of this additional molecular investigation would likely have provided more information
on the pathogenesis of the disease and possibly on the inclusion of additional tests on the
diagnostic workup. However, commercially available sequencing tests for FCoVs are currently
mostly focused on the detection of mutations in the S genes and therefore, being this a
comparative study among tests routinely introduced in diagnostic panels, we preferred to focus
our attention on tests that are already in use and well known in routine diagnostic procedures.
In conclusion, this study confirmed that the diagnosis of FIP may be challenging in practice since
none of the clinico-pathological or molecular test, alone, may diagnose FIP. However, the present
study provided useful practical information on the possible combination of tests that increases the
post-test probability of disease based on different clinical scenarios. Specifically, any test on blood,
and especially the molecular tests, may support or confirm a clinical diagnosis of FIP. However,
except for AGP, a negative result does not exclude the presence of this disease. When effusions
are present, cytology should be preferred because it is rapid, cheap and easy to perform and may
work either as confirmatory test (especially when the pre-test probability of disease is not high) or
as an exclusion test in the case of negative results. The 3’ UTR PCR has the same diagnostic
performances than cytology but it is less practical to run. Conversely, the ∆TNC may confirm but

Comparison of the diagnostic performances of laboratory tests for the diagnosis of feline
infectious peritonitis
69
not exclude FIP and gene S sequencing on effusions cannot be recommended based on its lower
performances in terms of LRs. On tissues, molecular tests may be run if immunohistochemistry is
not available or if it provided dubious results. In this case, however, S gene sequencing should be
preferred when histology is highly consistent with FIP while 3’ UTR PCR when FIP is less likely.
It would be interesting, in the future, to investigate the diagnostic performances of combined
tests, which unfortunately has not been done in this study due to the low number of cases on
which all the tests included in the study were performed.

Reverse transcriptase loop-mediated isothermal amplification for the detection of feline
coronavirus
70
V. Reverse transcriptase loop-mediated isothermal amplification for the detection of
feline coronavirus
Material and methods
Caseload and RNA extraction
Thirty-two samples from 27 cats (11 feces, 9 blood, 8 effusions, and 4 mesenteric lymph nodes)
submitted to the DIMEVET laboratory as part of a diagnostic panel for the clinical suspicion of FIP
or, regarding feces, for screening purposes, were used. RNA extraction was performed using a
NucleoSpin RNA Isolation Kit (Macherey-Nagel Bethlehem, PA). Whole blood and effusion samples
were centrifuged (3,500 x g, 5 min) and the obtained pellets were suspended in 200 μL of PBS by
vigorous vortexing and stored at -20°C for further RNA extraction. Fecal samples were suspended
at a final concentration of 10% (wt/vol) in PBS by vigorous vortexing. The supernatant was cleared
by centrifugation (5,000 x g, 4 min) and stored at -20°C for further RNA extraction. For tissues,
approximately 20 mg of sample were thinly shredded. All the further RNA extraction steps were
performed according to the manufacturer’s instruction.
RT-nPCR
The extracted RNA samples were tested for the presence of FCoV using a RT-nPCR targeting a 177
bp product of the highly conserved 3’ UTR of the genome of both type I and type II FCoV
(Herrewegh et al., 1995b). RT-nPCR positive FCoV RNA from a cat with FIP was used as positive
control and RNase-free water as negative control. PCR products were visualized under UV
transilluminator on a 2% agarose gel stained with ethidium bromide.
LAMP primers design and reaction set-up
The primers targeting the 3’UTR of the FCoVs were designed using the Primer Explorer V4
software (http://primerexplorer.jp/elamp4.0.0/index.html) based on a 296 nucleotides sequence
(28981 to 29277 bp) of the FCoV C1Je strain (accession number: DQ848678) (table 1). A Loopamp
RNA amplification kit (RT-LAMP, New England Biolabs, UK) was used to perform RT-PCR LAMP and
the reaction mixture was set up as follows: 1x Isothermal amplification buffer, 6 mM MgSO4, 1.4
mM dNTPs, 320 U/mL of warm start DNA, 300 U/mL of warm start RTx Reverse Transcriptase, 2
µM of both FIP and BIP primers, 0.2 µM of both F3 and B3 primers, 1 µM of both Loop F and Loop

Reverse transcriptase loop-mediated isothermal amplification for the detection of feline
coronavirus
71
B primers, 120 µM of Hydroxynaphtol blue (HNB) dye (Sigma-Aldrich®) and 5 µL of RNA template.
The reaction mixture was then made up to 25 µL with RNase-free water and incubated in a
thermal cycler (MyCycler, Bio-Rad Laboratories, Hercules, CA, USA) for 1 hour at
63 °C followed by 10 minutes at 80 °C for heat inactivation. The same positive control used for
traditional RT-nPCR, which tested positive also on the first RT-LAMP assay, was used as a positive
control in the following RT-LAMP assays, , while RNase-free water was used as negative control.
PRIMER GENOME TARGETING POSITION SEQUENCE (5’-3’)
F3 28982-29002 GCAACCCGATGTTTAAAACTG
B3 29179-29162 CCATTGTTGGCTCGTCAT
FIP (F1c+F2) F1c, 29065-29043; F2, 29003-29023 ACACGTGCTTACCATTCTGTACA-
GTCTTTCCGAGGAATTACTGG
BIP (B1c+B2) B1c, 29077-29101; B2, 29161-29141 CAAGCAACCCTATTGCATATTAGGA-
AGCGGATCTTTAAACTTCTCT
LOOP F 29042-29024 AGAGTAGACAGCGCGATGA
LOOP B 29103-29128 GTTTAGATTTGATTTGGCAATGCTAG
Table 1. List of the primers (Primm Biotech, Italy) used in this study, based on the FCoV strain C1Je
(GeneBank accession number: DQ848678).
The products of the reaction were then inspected both by eye, in order to detect the color turning
from violet to sky blue in case of positive results with HNB (Goto et al., 2009), and under UV
transilluminator on a 2% agarose gel stained with ethidium bromide in order to detect a ladder-
like pattern in case of positive result (Parida et al., 2008) (Figure 1). Results obtained with RT-
LAMP were then compared with those obtained with the RT-nPCR and the sensitivity and
specificity of RT-LAMP obtained with both HNB and agarose gel were calculated.
Figure 1. Evaluation methods of RT-LAMP for feline coronavirus. A. Negative result (violet) with
hydroxynaphtol blue. B. Positive result (light blue) with hydroxynapthol blue. C. Agarose gel

Reverse transcriptase loop-mediated isothermal amplification for the detection of feline
coronavirus
72
electrophoresis run showing 100 bp Ladder (lane 1); ladder like patterns typical of positive reaction
(lanes 2 and 3); negative results (lanes 4 and 5).
Results and discussion
Results recorded in the different specimens are reported in table 1.
ID Specimen PCR LAMP GEL LAMP HNB
1 Feces POS POS POS
2 Feces POS POS POS
3 Feces POS POS POS
4 Feces POS POS NEG
5 Feces POS POS NEG
6 Feces POS NEG POS
7 Feces POS NEG NEG
8 Feces POS NEG NEG
9 Feces POS NEG NEG
10 Feces POS NEG NEG
11 Feces NEG NEG NEG
Total positive results 10/11 5/11 4/11
12 Blood POS POS POS
13 Blood POS NEG POS
14 Blood POS NEG NEG
15 Blood POS NEG NEG
16 Blood NEG NEG NEG
17 Blood NEG NEG NEG
18 Blood NEG NEG NEG
19 Blood NEG NEG NEG
20 Blood NEG NEG NEG
Total positive results 4/9 1/9 2/9
21 Effusion POS POS POS
22 Effusion POS POS POS
23 Effusion POS NEG POS
24 Effusion POS NEG NEG
25 Effusion POS NEG NEG
26 Effusion NEG NEG NEG
27 Effusion NEG NEG NEG
28 Effusion NEG NEG NEG
Total positive results 5/8 2/8 3/8
29 Tissue POS POS POS
30 Tissue POS POS POS
31 Tissue POS POS POS
32 Tissue NEG NEG NEG
Total positive results 3/4 3/4 3/4
Table 1. Results obtained on the samples tested with RT-nPCR (PCR) and LAMP and evaluated with agarose
gel electrophoresis (LAMP GEL) and hydroxynaphtol blue dye (LAMP HNB).

Reverse transcriptase loop-mediated isothermal amplification for the detection of feline
coronavirus
73
All the negative samples using RT-nPCR were also negative by RT-LAMP, using both gel
electrophoresis and HNB for the visualization of the results, leading to a 100% specificity.
On the other hand, a conspicuous number of false negative results was recorded (11/22 for
agarose gel and 10/22 for HNB) and the overall sensitivity was 50% and 54.5% using gel
electrophoresis and HBN, respectively. The sensitivity of RT-LAMP was also different according to
specimens: feces showed a sensitivity of 50% and 40%, with gel electrophoresis and HNB
respectively. On blood, the sensitivity was 25% and 50%, with gel electrophoresis and HNB
respectively while on effusions the sensitivity was 40% with both the visualization methods. Only
on tissues, the sensitivity resulted to be absolute, but the number of tested samples was too low
to be discussed in terms of diagnostic accuracy. Based on the results of this pilot study, RT-LAMP
for FCoV, due to its high specificity, appears to be a solid molecular test to confirm the diagnosis
of FCoV infection, and eventually to support a clinical diagnosis of FIP, when performed on
specimens from cats with an high pre-test probability of FIP (e.g. cats with clinical signs and
laboratory findings consistent with FIP, like effusions with physico-chemical and cytological
features consistent with FIP) but its low sensitivity makes this test not reliable in case of negative
results (Pedersen, 2009). In the case the sensitivity of the test might be ameliorated through
further studies, the RT-LAMP could be extremely useful, due to its low costs and rapidity, in those
situations where the detection of FCoV must be repeated over time and on a high number of cats
(e.g. breeding catteries). An additional future perspective would be the optimization of the test to
obtain quantitative results, possibly by establishing a standard curve of color intensity using RNA
samples with known viral load (e.g. quantification of RNA copies by quantitative PCR techniques).

Feline coronavirus spike protein in cats with and without feline infectious peritonitis
74
VI. Feline coronavirus spike protein in cats with and without feline infectious
peritonitis
Material and methods
A large biobank consisting of variable clinical specimens (tissues; body cavity fluid; feces) obtained
from cats deceased for both FIP and other diseases (e.g. neoplasia, cardiac failure) and stored at
-80°C at School of Veterinary Science (University of Bristol, UK) was used. For every cat from which
samples were stored in the biobank, a full clinical evaluation along with histology and
immunohistochemistry for the detection of feline coronavirus were available.
Collection of samples
Cats euthanized due to suspected FIP or to other diseases at the Small Animal Hospital (Langford
Veterinary Services, University of Bristol) underwent necropsy and sample collection within two
hours of death. In particular, at least five samples of 0.125 cm3 (maximum 5 mm in
width/length/depth) from each of colon, small distal intestine, mesenteric lymph node, spleen,
liver, kidneys, omentum and lungs were sectioned and immediately placed in RNA preservative
RNAlater® (Life Technologies). Other kind of tissues (e.g. brain, eyes, pancreas) were also
occasionally collected based on gross findings. A sample of feces and, if present, body cavitary
effusions (abdominal, thoracic, pericardial, CSF) were also collected in plain tubes. Concurrently,
tissue samples from the organs as reported above were collected into 10% neutral-buffered
formalin for histopathology and immunohistochemistry tests. Samples collected in RNAlater were
refrigerated for 24-48 hours, prior to storage at -80°C. Fecal samples were immediately stored at -
80°C.
RNA extraction and qPCR
Regarding tissues, RNA was purified from 20 mg tissue using a NucleoSpin RNA II Kit (Macherey-
Nagel) according to manufacturer’s instructions, following disruption using a Qiagen Retsch
MM300 TissueLyser (Qiagen, Hilden, Germany). Regarding feces, RNA was purified from 10 mg
feces (100 µl of 500 mg of feces suspended in 4,5 mL of phosphate buffered saline (PBS), or fecal
swabs (resuspended in 100 µL PBS), using the Chemagic 360 instrument (Perkin-Elmer) in
combination with Chemagic body fluids NA kit (Perkin-Elmer). Regarding fluids, RNA was purified

Feline coronavirus spike protein in cats with and without feline infectious peritonitis
75
from 100 µl fluid using the Chemagic 360 instrument in combination with Chemagic body fluids NA
kit. The resulting RNA was stored at -80°C until further analysis.
All samples underwent reverse transcription (RT) on a MJ Mini Gradient Thermal Cycler using the
ImProm II Reverse Transcriptase (Promega) kit. The reaction mixture comprised 4 µL of 5X ImProm
II buffer, 1 µL of random hexamers (0.5 µg/ µL), 2.4 µL of 25 mM MgCl2, 1 µL of dNTPs (10 mM
each), 1 µL of ImProm RT enzyme, 10 µL of RNA template and was made up to 20 μL with RNase-
free water. Thermal conditions were: 20 °C for 5 minutes, 42 °C for 30 minutes, 70 °C for 15
minutes and 10 °C hold. The obtained complementary DNA was added to 30 µL of RNase-free
water and stored at -20 °C for further analyses or immediately used. For fecal RT samples, an RNA
internal amplification control was used to check the presence of RT inhibitors.
A quantitative PCR (qPCR) for the detection of FCoVs was performed on all the cDNA samples. An
Agilent Mx3005P qPCR System (Agilent Technologies) thermocycler was used. The reaction
mixture was prepared as follows: 12.5 µL of 2x GoTaq polymerase, 0.5 µL each of 10 μM forward
(P009:AGCAACTACTGCCACRGGAT, position 26655-26674 of the FCoV strain 79-11461) and reverse
(P010:GGAAGGTTCATCTCCCCAGT, position 26826-26807 of the FCoV strain 79-11461) primers,
0.125 µL of 5 µM FAM TaqMan probe, 1.25 µL of 50 nM MgCl2, 5 µL of cDNA template, and made
up to 25 μL with RNase-free water. The primers, targeting a conserved 171 bp region between the
M and the N gene, were previously described by Dye et al. (2008). The following thermal profile
was used: 95 °C for 2 minutes, followed by 40 cycles of 95 °C for 15 seconds, 55 °C for 15 seconds
and 72 °C for 15 seconds. Feline coronavirus cDNA was used as a positive control and RNase-free
water as a negative control. Reactions that did not reach the threshold cycle (Ct) value after 40
cycles were categorized as negative and a relative copy number of 1 was assigned to a Ct value of
40.
Pyrosequencing
All samples that were positive by FCoV qRT-PCR underwent conventional PCR to amplify a 153 bp
DNA fragment, which including the sequences encoding for positions 1058 and 1060 of the spike
protein. The PCR was performed on a MJ Mini Gradient Thermal Cycle with a reaction mixture
containing: 12.5 µL of 2x GoTaq polymerase, 1 µL each of 10 µM forward (F614:
GCHCARTATTAYAATGGCATAATGG, position 23436-23460 of the FCoV C1Je2 strain) and
biotinylated reverse (R766: BIO-AAGYCTRGCYTGYACTTGCAT, position 23588-23568 of the FCoV
C1Je2 strain) primers, 2 µL of the template cDNA, and made up to 25 µL with RNase-free water.

Feline coronavirus spike protein in cats with and without feline infectious peritonitis
76
The following thermal profile was used: 95 °C for 2 minutes, followed by 40 cycles at 95 °C for 15
seconds, 52 °C for 20 seconds and 72 °C for 20 seconds. The amplification products were stored at
-20 °C for further analyses or immediately pyrosequencing. Samples that did not pyrosequence
were amplified for 50 cycles.
The pyrosequencing used in this study is aimed to detect the two mutations described by Chang et
al (2012). At first, the PCR biotinylated products underwent the chemical separation in single
strands through the binding with streptavidin Sepharose beads (Fisher). For each sample, the
binding reaction mixture was prepared as follows: 40 µL of PyroMark binding buffer (Qiagen), 1 µL
of streptavidin Sepharose beads and 25 µL of PCR product, made up to 80 µL total with RNase free
water. The mixture was placed on a shaking block for 10 min at 1400 rpm. To prepare the
sequencing plate, the following reaction mixture was prepared for each sample: 38 µL of
PyroMark annealing buffer (Qiagen) and 2 µL of 10 µM sequencing primer (S680:
ACAGCCTCDTTAATAGGVGGATG, position 23502-23524 of the FCoV C1Je2 strain). Forty µL of the
sequencing mix were added to the apposite wells of the sequencing plates and the plate was
placed on the pyrosequencing workstation of the PyroMark Q96 (Qiagen).
The trays of the pyrosequencing workstation were filled with washing solution buffer (10 mM Tris-
OAc pH 7.6), denaturing solution (0.2 M NaOH), 70% ethanol and distilled water. The streptavidin
beads already bound with the S gene qPCR biotinylated products were then gently aspirated by
the pyrosequencing bead collector connected to a vacuum, after a cleaning step of the bead
collector with distilled H2O. The bead collector was then placed in the 70% ethanol for 5 seconds,
in the denaturing solution for 5 seconds and in the wash solution for 10 seconds. The vacuum was
then turned off and the bead collector was placed in the pyrosequencing plate and gently agitated
for 40 seconds to let the beads to detach. To let the primers to anneal to the the beads, the plate
was heated at 80 °C for 2 minutes on a plate holder, and then left to cool for 5 minutes in the
PyroMark Q96. In the meanwhile, the pyrosequencing cartridge was set with the following
reagents in the wells and with the volumes indicated by the PyroMark Q96 software: PyroMark
Gold Q96 enzyme, substrate and dNTPs (Qiagen). The dispensation order of the dNtPs was:
CGCTCATG. The cartridge was then placed into the PyroMark Q96 and the assay was run.
After the first experiments, the pyrosequencing of the target sequence was doubled, in order to
look for the two possible mutations in two separated work sessions. This decision was taken after
the failing of some pyrosequencing, possibly due to the formation of loops in the chosen primer or
to the variability of the sequence. The second pyrosequencing (aimed to detect the mutation
Feline coronavirus spike protein in cats with and without feline infectious peritonitis
77
S1060A) was performed on each sample after the first above described and with the same
protocol, except for the use of a different sequencing primer (S693 instead of S680) and
dispensation order of the dNTPs.
Results analysis
Cats were classified as FIP, non-FIP, or inconclusive based on histology and immunohistochemistry
results. Cats were assigned to the FIP group if histology revealed the presence of the typical
histological lesions (e.g. pyogranulomas-granulomas, vasculitis, fibrinoid necrosis) and if the FCoV
antigen was found within the lesion macrophages.
All the pyrograms have been downloaded from the PyroMark Q96 software and are currently
under evaluation. Each pyrogram will be analyzed in order to assign the corresponding codon to
the peaks. To every sample obtained from each cat, the Ct values and the presence/absence of
one or both the mutations described by Chang et al (2012) will be assigned.
Therefore, results of this part of study VI are too preliminary to provide useful information on the
pathogenesis of FIP/FCoV infection and are not included in the current version of the thesis.

Feline coronavirus spike protein in cats with and without feline infectious peritonitis
78
VI.1. Feline coronavirus shedding in cats with and without feline infectious peritonitis.
Briefly, 83 samples of feces and seven fecal swabs were collected from 90 cats for which
histopathology results were also available. Cats were classified as FIP, non-FIP, or inconclusive
based on histology and immunohistochemistry results. Cats were assigned to the FIP group if
histology revealed the presence of the typical histological lesions (e.g. pyogranulomas-
granulomas, vasculitis, fibrinoid necrosis) and if the FCoV antigen was found within the lesion
macrophages. Inconclusive cats (histology consistent with FIP but with negative results at
immunohistochemistry for FCoV) were not included in the study).
Results and discussion
Forty-eight cats were classified as FIP and 42 as non-FIP.
Thirtyone (31/48) samples from the FIP group were FCoV RT-qPCR positive as well as 12 cats
(12/42) from the non-FIP group. Pyrograms were unreadable for five FIP cats and for two non-FIP
cats. The failure in the pyrosequencing could be attributed to a failure of the sequencing primers
more than to a failure of the PCR targeting the S gene, this latter finding being confirmed with the
specific band appearance when the PCR products were run on the agarose gel. Another
explanation could be the formation of loop/helix structures in the sequencing primers, as
predicted using M-Fold web server which also recorded melting temperature higher than those
used in the pyrosequencing. The low copy numbers produced with the RT-qPCR could be another
explanation as well the presence of type II FCoVs in the feces. The spike gene protein of this
serotype, in fact, has sequences more similar to that of the CCoV and could prevent the binding of
the primers.
The remaining pyrograms were from 26 cats with FIP and from 10 without FIP. Thirteen FIP cats
(13/26) were shedding the FCoV with the M1058L mutation described by Chang et al. (2012) as
well as two (2/10) of the non-FIP cats.
The results obtained are in contrast with those reported in previous papers, where the fecal
samples obtained from non FIP cats did not show the M1058L mutation (Chang et al., 2012; Porter
et al., 2014). On the other hand, this study demonstrates that FIP cats are more likely to shed FCoV
with feces, at least twice as non-FIP cats. Moreover, it is possible that the spread of mutated
FCoVs may play a role in the pathogenesis of FIP, differently from what reported in previous
studies (Pedersen, 2009). This latter finding could have not been investigated in this study, but it

Feline coronavirus spike protein in cats with and without feline infectious peritonitis
79
would be interesting to determine the presence of 3c mutations in the same fecal samples, since
its truncations seems to increase the viral pathogenicity (Hora et al., 2016). Another approach
could be to evaluate the infectivity of these strains for enterocyte cell lines, as tried in recent
studies (Desmarets et al., 2013).

CONCLUSIONS
80
CONCLUSIONS

CONCLUSIONS
81
This thesis was aimed to find new approaches for the diagnosis of FIP and FCoV infection, since
one of the main problematic aspects of this disease is the absence of a gold standard for the
diagnosis in vivo. A new LAMP test was developed and, although further studies are needed to
completely investigate the diagnostic potential of this test, its use in clinical practice could help to
add more information during the diagnostic as well as the screening procedure, due to its
advantageous properties. Within this thesis The diagnostic potential of the ΔTNC has been fully
exploited through two sequential studies and this test may become extensively available in routine
practice, either on fresh or on frozen effusions. On the other hand, one of the classic test to
perform on serum (i.e. SPE) was found to be less reliable for the diagnosis of FIP, showing the
need for the development of additional tests and for deepening the reason of this change. The
most useful tests to perform in vivo were determined, including a molecular test recently
proposed to discriminate the two FCoV pathotypes. This latter test was also investigated in a wide
number of samples during the externship at the University of Bristol and, although most of the
results collected during the externship are very preliminary and ultimately did not allow us to
provide additional information on the pathogenesis of FIP, these results may be of interest to
further investigate the genomic variability through the completion of the analysis so far
performed, or through similar future studies on this topic. Nonetheless, the molecular study run
during the externship showed for the first time the presence of the mutated virus also in feces of
non FIP cat. This result ultimately open some interesting questions on the pathogenesis of the
disease and on the need of novel testing strategies to control the spread of infection in multicat
households.
Specifically, the main conclusions of this thesis are:
� The ΔTNC measurement on feline effusions has a high diagnostic accuracy for the diagnosis
of FIP. Two cut-offs were determined. A ΔTNC >1.7 FIP is suggestive of FIP, while a ΔTNC
>3.4 can be considered diagnostic for FIP.
� The ΔTNC measurement can be performed also on effusion supernatants (e.g. on frozen,
stored sample) after the addition of feline blood samples in 1:10 dilution.
� Serum protein electrophoresis performed in FIP cats in recent years showed a decrease in
hyperproteinemia and hypergammaglobulinemia, compared with both previous years and

CONCLUSIONS
82
with reference intervals. This finding suggests possible changes in the virus-host
interaction.
� The comparison between different tests for the diagnosis of FIP identified AGP on blood
and cytology and RT-nPCR on effusions as the best tests to perform in vivo. On tissues, RT-
PCR and spike gene sequencing may be useful to exclude and confirm the disease,
respectively.
� With the settings used in this study, RT-LAMP showed absolute specificity but poor
sensitivity in all the samples except on the few number of tissues evaluated. Thus, it could
be used as a confirmatory test but not to exclude FCoV infections.
� FIP cats are more prone to shed FCoV in feces. Moreover, the M1058L was found in feces
of cats died for FIP but also for diseases other than FIP. The shedding of mutated FCoV may
have a role in the pathogenesis of FIP.

Publications
83
Publications
International peer reviewed papers
- Giordano, A., Stranieri, A., Rossi, G., Paltrinieri, S., 2015. High diagnostic accuracy of the
Sysmex XT-2000iV delta total nucleated cells on effusions for feline infectious
peritonitis. Veterinary Clinical Pathology 44: 295-302.
- Stranieri, A., Ferrari, R., Zanzani, S., Rossi, G. 2016. Sysmex XT-2000iV scattergram
analysis in a cat with basophilia. Veterinary Clinical Pathology 45(2):225-228.
- Stranieri, A., Giordano, A., Bo, S., Braghiroli, C., Paltrinieri, S. 2016. Frequency of
electrophoretic changes consistent with feline infectious peritonitis in two different
time periods (2004-2009 vs 2013-2014). Journal of Feline Medicine and Surgery. Epub
ahead of print, doi: 1098612X16664389
- Stranieri, A., Paltrinieri, S., Giordano, A. 2016. A reliable method to diagnose feline
infectious peritonitis (FIP) on frozen supernatants from cavitary effusions. Journal of
Veterinary Diagnostic Investigation, E-pub ahead of print.
doi:10.1177/1040638716689115
- Stranieri, A., Giordano, A., Paltrinieri, S., Giudice, C., Cannito, V., Lauzi, S., 2016
Comparison of diagnostic accuracy for feline infectious peritonitis of various laboratory
tests performed on different specimens. Veterinary Record [Under review]
- Stranieri A., Lauzi, S., Giordano, A., Paltrinieri, S., 2016. Reverse transcriptase loop-
mediated isothermal amplification for the detection of feline coronavirus. Journal of
Virological Methods, 243: 105-108. [E-pub ahead of print]
Abstracts
- Ibba F., Stranieri A., Xenoulis V., Paltrinieri S., 2015. Urinary γ-glutamyltransferase
(GGT) as a marker of tubular damage in dogs with leishmaniasis, using sodium
dodecylsulphate (SDS) electrophoresis as a reference method. 16th European Society of
Veterinary Clinical Pathology (ESVCP) Annual Meeting, 1-4th October 2014, Milan, Italy .
Published in: Veterinary Clinical Pathology, 44(1): E1-E23.
- Stranieri, A., Paltrinieri, S., Giordano, A., 2014. A modified method to evaluate “Delta-
WBC” using Sysmex XT-2000iv in supernatants of centrifuged feline effusions.49th
American Society of Veterinary Clinical Pathology (ASVCP) annual meeting, 8-12th
November 2014, Atlanta, Georgia, USA. Published in: Veterinary Clinical Pathology, 43:
E8-E21.
- Stranieri A., Lauzi, S., Giudice, C., Cannito, V., Giordano, A., Paltrinieri S. (2015)
Comparison between the diagnostic accuracy of clinico-pathological and molecular
tests for feline infectious peritonitis (FIP). 25th European College of Veterinary Internal
Publications
84
Medicine-Companion Animals (ECVIM-CA) annual meeting, 10-12th September 2015,
Lisbon, Portugal. Published in: Journal of Veterinary Internal Medicine, 30(1): 348–439.
- Stranieri A., Lauzi, S., Giordano, A., Paltrinieri, S. A Reverse Transcription Loop-
Mediated Isothermal Amplification (RT-Lamp) Assay for Feline Coronavirus. ISCAID
Symposium, 16-19 October 2016, Bristol, UK
- Barker, E.N., Stranieri, A., Helps, C., Porter, E.L., Davidson, A.D., Day, M.J., Kipar, A.,
Tasker, S. Feline Coronavirus Shedding in Cats With and Without Feline Infectious
Peritonitis. ISCAID Symposium, 16-19 October 2016, Bristol, UK
Oral presentations at international meetings
- Stranieri, A., Ferrari, R., Zanzani, S., Rossi, G. (2014) “A peculiar Sysmex scattergram in a
cat affected by feline injection site sarcoma” 16th ESVCP Annual Meeting. October 1st-
4th, Milan, Italy
- Stranieri A., Lauzi, S., Giudice, C., Cannito, V., Giordano, A., Paltrinieri S. (2015)
Comparison between the diagnostic accuracy of clinico-pathological and molecular
tests for feline infectious peritonitis (FIP). 25th ECVIM-CA Congress. September 10th-
12th, Lisbon, Portugal
Co-supervision of Degree thesis
- Valentina Cannito: Peritonite infettiva felina (FIP): confronto tra test diagnostici e
potenzialita del gene Spike (S) del coronavirus in studi filogenetici. Thesis supervisor:
Saverio Paltrinieri; Thesis co-supervisor: Angelica Stranieri. December 2014
- Chiara Braghiroli: Patterns elettroforetici in gatti con fip in due differenti archi
temporali (2004-2009 e 2012-2014): variazione del potenziale diagnostico. Thesis
supervisor: Saverio Paltrinieri; Thesis co-supervisor: Angelica Stranieri. October, 2015
- Daniela Cortiana: Basofilia nel gatto: prevalenza, associazione con stati patologici e
possibili approcci strumentali. Thesis supervisor: Saverio Paltrinieri; Thesis co-
supervisor: Angelica Stranieri. October, 2015
- Granauro Silvia: Elettroforesi siero proteica e malattie parassitarie: principali patterns
elettroforetici in gatti sieropositivi e malati. Thesis supervisor: Saverio Paltrinieri; Thesis
co-supervisor: Angelica Stranieri. Maggio 2016

References
85
References
Acar, D.D., Olyslaegers, D.A., Dedeurwaerder, A., Roukaerts, I.D., Baetens, W., Van Bockstael, S.,
De Gryse, G.M., Desmarets, L.M., Nauwynck, H.J., 2016. Upregulation of endothelial cell adhesion
molecules characterizes veins close to granulomatous infiltrates in the renal cortex of cats with
feline infectious peritonitis and is indirectly triggered by feline infectious peritonitis virus-infected
monocytes in vitro. Journal of General Virology, 97(10): 2633-2642.
Addie, D.D., Jarrett, J.O., 1992. A study of naturally occurring feline coronavirus infections in
kittens. The Veterinary Record, 130: 133-137.
Addie, D.D., Toth, S., Murray, G.D., Jarrett, O., 1995. Risk of feline infectious peritonitis in cats
naturally infected with feline coronavirus. American journal of veterinary research, 56(4): 429-434.
Addie, D.D., Dennis, J.M., Toth, S., Callanan, J.J., Reid, S., Jarrett, O., 2000. Long-term impact on a
closed household of pet cats of natural infection with feline coronavirus, feline leukaemia virus
and feline immunodeficiency virus. The Veterinary Record, 146(15): 419-424.
Addie, D.D., Jarrett, O., 2001. Use of a reverse-transcriptase polymerase chain reaction for
monitoring the shedding of feline coronavirus by healthy cats. The Veterinary Record,
148(21):649-653.
Addie, D.D., Schaap, A.T., Nicolson, L., Jarrett, O., 2003. Persistence and transmission of natural
type I feline coronavirus infection. Journal of General Virology, 84: 2735-2744.
Addie, D.D., Paltrinieri, S., Pedersen, N.C., 2004. Recommendations from workshops of the second
international feline coronavirus/feline infectious peritonitis symposium. Journal of Feline Medicine
and Surgery, 6(2): 125-130.
Addie, D., Belák, S., Boucraut-Baralon, C., Egberink, H., Frymus, T., Gruffydd-Jones, T., Hartmann,
K., Hosie, M.J., Lloret, A., Lutz, H. and Marsilio, F., 2009. Feline infectious peritonitis. ABCD
guidelines on prevention and management. Journal of Feline Medicine and Surgery, 11(7): 594-
604.
Barker, E.N., Tasker, S., Gruffydd-Jones, T.J., Tuplin, C.K., Burton, K., Porter, E., Day, M.J., Harley,
R., Fews, D.,. Helps, C.R, Siddell, S.G., 2013. Phylogenetic analysis of feline coronavirus strains in an
epizootic outbreak of feline infectious peritonitis. Journal of Veterinary Internal Medicine, 27: 445-
450.
Battilani, M., Balboni, A., Bassani, M., Scagliarini, A., Paltrinieri, S., Prosperi, S., 2010. Sequence
analysis of the nucleocapsid gene of feline coronaviruses circulating in Italy. New Microbiologica,
33: 387-392.
Bauer, B.S., Kerr, M.E., Sandmeyer, L.S., Grahn, B.H., 2013. Positive immunostaining for feline
infectious peritonitis (FIP) in a Sphinx cat with cutaneous lesions and bilateral panuveitis.
Veterinary Ophtalmology, 16(1): 160-163.

References
86
Beatty, J., Barrs, V., 2010. Pleural effusion in the cat: a practical approach to determining
aetiology. Journal of Feline Medicine and Surgery, 12(9): 693-707.
Berg, A.L., Ekman, K., Belák, S., Berg., M., 2005. Cellular composition and interferon-γ expression
of the inflammatory response in feline infectious peritonitis (FIP). Veterinary Microbiology, 111(1):
15-23.
Bosch, B.J., der Zee, R., de Haan, C.A.M., Rottier, P.J.M., 2003. The coronavirus spike protein is a
class I virus fusion protein: structural and functional characterization of the fusion core complex.
Journal of Virology, 77(16): 8801-8811.
Brown, M.A., Troyer, J.L., Pecon-Slattery, J., Roelke, M.E., O’Brien, S., 2009. Genetics and
pathogenesis of feline infectious peritonitis virus. Emerging Infectious Diseases, 15: 1445-1452.
Can-Sanha, K., Soydal Ataseven, V., Pinar, D., Oğuzoğlu, T.C. 2007. The detection of feline
coronaviruses in blood samples from cats by mRNA. Journal of Feline Medicine and Surgery, 9(5):
369-372.
Cavanagh, D., 2005. Coronaviridae: a review of coronaviruses and toroviruses. In “Coronaviruses
with Special Emphasis on First Insights Concerning SARS”. Eds Schimdt, A., Weber, O., Wolff, M.H.
(pp. 1-54), Birkhäuser Verlag Basel, Switzerland.
Cave, T.A., Golder, M.C., Simpson, J., Addie, D.D., 2004. Risk factors for feline coronavirus
seropositivity in cats relinquished to a UK rescue charity. Journal of Feline Medicine and Surgery,
6(2): 53-58.
Chang, H.W., de Groot, R.J., Egberink, H.F., Rottier, P.J., 2010. Feline infectious peritonitis: insights
into feline coronaviruses pathobiogenesis and epidemiology based on genetic analysis of the viral
3c gene. Journal of General Virology, 91(2):415-420.
Chang, H.W., Egberink, H.F., Halpin, R., Spiro, D.,J., Rottier, P.J.M., 2012. Spike protein fusion
peptide and feline coronavirus virulence. Emerging Infectious Diseases, 18(7): 1089-1095.
Christenson, R.H., 2007. Evidence-based laboratory medicine-a guide for critical evaluation of in
vitro laboratory testing. Annals of clinical biochemistry, 44(2): 111-130.
De Groot-Mijnes, J.D.F., Van Dun, J.M., Van der Most, R.G., De Groot, R.J., 2005. Natural history of
a recurrent feline coronavirus infection and the role of cellular immunity in survival and disease.
Journal of Virology, 79(2): 1036-1044.
Declercq, J., De Bosschere, H., Schwarzkopf, I., Declercq, L., 2008. Papular cutaneous lesions in a
cat associated with feline infectious peritonitis. Veterinary Dermatology, 19(5): 255-258.
Dedeurwaerder, A., Desmarets, L.M., Olyslaegers, D.A.J., Vermeulen, B.L., Dewerchin, H.L.,
Nauwynck, H.J., 2013. The role of accessory proteins in the replication of feline infectious
peritonitis virus in peripheral blood monocytes. Veterinary Microbiology, 162: 447-455.

References
87
Dedeurwaerder, A., Olyslaegers, D.A., Desmarets, L.M., Roukaerts, I.D., Theuns, S., Nauwynck, H.J.,
2014. The ORF7-encoded accessory protein 7a of feline infectious peritonitis virus as a
counteragent against interferon-alpha induced antiviral response. Journal of General Virology,
95(2): 393-402.
Denison, M.R., Graham, R.L., Donaldson, E.F., Eckerle, L.D., Baric, R.S., 2011. Coronaviruses: an
RNA proofreading machine regulates replication fidelity and diversity. RNA biology, 8(2): 270-279.
Desmarets, L.M., Theuns, S., Olyslaegers, D.A., Dedeurwaeder, A., Vermeulen, B.L., Roukaerts, I.D.,
Nauwynck, H.J., 2013. Establishment of feline intestinal epithelial cell cultures for the propagations
and study of feline enteric coronaviruses. Veterinary Research, 44(1): 71.
Domingo, E., Sheldon, J., Perales, C., 2012. Viral quasispecies evolution. Microbiology and
Molecular Biology Reviews, 76(2): 159-216.
Doenges, S.J., Weber, K., Dorsch, R., Fux, R., Fischer, A., Matiasek, L.A., Matiasek, K., Hartmann, K.,
2015. Detection of feline coronavirus in cerebrospinal fluid for diagnosis of feline infectious
peritonitis in cats with and without neurological signs. Journal of Feline Medicine and Surgery, doi:
1098612X15574757.
Doenges, S.J., Weber, K., Dorsch, R., Fux, R., Hartmann, K., 2016. Comparison of real-time reverse
transcriptase polymerase chain reaction of peripheral blood mononuclear cells, serum and cell-
free body cavity effusion for the diagnosis of feline infectious peritonitis. Journal of Feline
Medicine and Surgery, doi: 1098612X15625354.
Doki, T., Takano, T., Kawagoe, K., Kito, A., Hohdatsu, T., 2016. Therapeutic effect of anti-feline TNF-
alpha monoclonal antibody for feline infectious peritonitis. Research in veterinary science, 104:
17-23.
Drechsler, Y., Alcaraz, A., Bossong, F.J., Collisson, E.W., Diniz, P.P.V.P., 2011. Feline coronavirus in
multicat environments. Veterinary Clinics of North America: Small Animal Practice, 41: 1133-1169.
Duthie, S., Eckersall, P.D., Addie, D.D., Lawrence, C.E., Jarrett, O., 1997. Value of alpha 1-acid
glycoprotein in the diagnosis of feline infectious peritonitis. The Veterinary Record, 141(12): 299-
303.
Dye, C., Siddell, S.G., 2005. Genomic RNA sequence of Feline coronavirus strain FIPV WSU-
79/1146. Journal of General Virology, 86: 2249-2253.
Dye, C., Helps, C.R., Siddell, S.G. 2008 Evaluation of real-time RT-PCR for the quantification of FCoV
shedding in the faeces of domestic cats. Journal of Feline Medicine and Surgery 10(2):167-174.
Eckersall, D.P. 2008. Proteins, proteomics, and the dysproteinemias. In: Kaneko, J.J., Harvey, J.W.,
Bruss, M.L. (eds). Clinical biochemistry of domestic animals. 6th ed. San Diego, CA, Elsevier,
pp:117-156.

References
88
Felten, S., Weider, K., Doenges, S., Gruendl, S., Matiasek, K., Hermanns, W., Mueller, E., Matiasek,
L., Fischer, A., Weber, K., Hirschberger, J., 2015. Detection of feline coronavirus spike gene
mutations as a tool to diagnose feline infectious peritonitis. Journal of Feline Medicine and
Surgery: 1098612X15623824.
Felten, S., Matiasek, K., Gruendl, S., Sangl, L., Wess, G., Hartmann, K., 2016. Investigation into the
utility of an immunocytochemical assay in body cavity effusions for diagnosis of feline infectious
peritonitis. Journal of feline medicine and surgery, doi: 1098612X16630357.
Fischer, Y., Ritz, S., Weber, K., Sauter-Louis, C., Hartmann, K., 2011. Randomized, placebo
controlled study of the effect of propentofylline on survival time and quality of life of cats with
feline infectious peritonitis. Journal of Veterinary Internal Medicine, 25(6): 1270-1276.
Fischer, Y., Sauter-Louis, C., Hartmann, K., 2012. Diagnostic accuracy of the Rivalta test for feline
infectious peritonitis. Veterinary Clinical Pathology, 41(4): 558-567.
Fischer, Y., Weber, K., Sauter-Louis, C., Hartmann, K., 2013. The Rivalta’s test as a diagnostic
variable in feline effusions–evaluation of optimum reaction and storage conditions. Tierärztliche
Praxis Kleintiere, 41(5): 297-303.
Foley, J.E., Poland, A., Carlson, J., Pedersen, N.C., 1997. Risk factors for feline infectious peritonitis
among cats in multiple-cat environments with endemic feline enteric coronavirus. Journal of the
American Veterinary Medical Association, 210(9): 1313-1318.
Foley, J.E., Lapointe, J.M., Koblik, P., Poland, A., Pedersen, N.C., 1998. Diagnostic features of
clinical neurologic feline infectious peritonitis. Journal of Veterinary Internal Medicine, 12(6): 415-
423.
Gardner, I.A., Greiner, M., 2006. Receiver-operating characteristic curves and likelihood ratios:
improvements over traditional methods for the evaluation and application of veterinary clinical
pathology tests. Veterinary clinical pathology, 35(1): 8-17.
Gelain, M.E., Meli, M., Paltrinieri, S., 2006. Whole blood cytokine profiles in cats infected by feline
coronavirus and healthy non-FCoV infected specific pathogen-free cats. Journal of Feline Medicine
and Surgery, 8(6): 389-399.
Giordano, A., Spagnolo, V., Colombo, A., Paltrinieri, S., 2004. Changes in some acute phase protein
and immunoglobulin concentrations in cats affected by feline infectious peritonitis or exposed to
feline coronavirus infection. The Veterinary Journal, 167(1): 38-44.
Giordano, A., Paltrinieri, S., Bertazzolo, W., Milesi, E., Parodi, M., 2005. Sensitivity of Tru-cut and
fine-needle aspiration biopsies of liver and kidney for diagnosis of feline infectious peritonitis.
Veterinary Clinical Pathology, 34(4): 368-374.
Giordano, A., Paltrinieri, S., 2009. Interferon-γ in the serum and effusions of cats with feline
coronavirus infection. The Veterinary Journal, 180(3): 396-398.

References
89
Giordano, A., Paltrinieri, S., 2010. Interpretation of capillary zone electrophoresis compared with
cellulose acetate and agarose gel electrophoresis: reference intervals and diagnostic efficiency in
dogs and cats. Veterinary Clinical Pathology, 39(4): 464-473.
Giori, L., Giordano, A., Giudice, C., Grieco, V., Paltrinieri, S., 2011. Performances of different
diagnostic tests for feline infectious peritonitis in challenging clinical cases. Journal of Small Animal
Practice, 52(3): 152-157.
Gonzalez, J.M., Gomez-Puertas, P., Cavanagh, D., Gorbalenya, A., Enjuanes, L., 2003. A
comparative sequence analysis to revise the current taxonomy of the family Coronaviridae.
Archives of Virology, 148(11): 2207-2235.
Gorbalenya, A.E., Enjuanes, L., Ziebuhr, J., Snijder, E.J., 2006. Nidovirales: Evolving the largest RNA
virus genome. Virus Research, 117: 17-37
Goto, M., Honda, E., Ogura, A., Nomoto, A., Hanaki, K.I., 2009. Short technical
reports. Biotechniques, 46: 167-172.
Gunn-Moore, D.A., Gruffydd-Jones, T.J., Harbour, D.A. 1998a. Detection of feline coronaviruses by
culture and reverse transcriptase–polymerase chain reaction of blood samples from healthy cats
and cats with clinical feline infectious peritonitis. Veterinary Microbiology, 62(3):193–205.
Gunn-Moore, D.A., Caney, S.M.A., Gruffydd-Jones, T.J., Helps, C.R., Harbour, D.A., 1998b. Antibody
and cytokine responses in kittens during the development of feline infectious peritonitis (FIP).
Veterinary Immunology and Immunopathology, 65: 221-242.
Gunn-Moore, D.A., Gunn-Moore, F.J., Gruffydd-Jones, T.J., Harbour, D.A., 1999. Detection of FCoV
quasispecies using denaturing gradient gel electrophoresis. Veterinary Microbiology, 69: 127-130.
Gunn-Moore, D.A. and Reed, N., 2011. CNS disease in the cat: current knowledge of infectious
causes. Journal of Feline Medicine and Surgery, 13(11): 824-836.
Hagemeijer, M.C., Rottier, P.J.M., de Haan, C.A.M., 2012. Biogenesis and dynamics of the
coronavirus replicative structures. Viruses, 4: 3245-3269.
Haijema, B.J., Volders, H., Rottier, P.J.M., 2004. Live, Attenuated Coronavirus Vaccines through the
Directed Deletion of Group-Specific Genes Provide Protection against Feline Infectious Peritonitis.
Journal of Virology, 78(8): 3863-3871.
Hartmann, K., Binder, C., Hirschberger, J., Cole, D., Reinacher, M., Schroo, S., Frost, J., Egberink, H.,
Lutz, H., Hermanns, W., 2003. Comparison of different tests to diagnose feline infectious
peritonitis. Journal of veterinary internal medicine, 17(6): 781-790.
Hartmann K. 2005. Feline infectious peritonitis. Veterinary Clinics of North America Small Animal
Practice, 35: 39-79.
References
90
Harvey, C.J., Lopez, J.W., Hendrik, M.J., 1996. An uncommon intestinal manifestation of feline
infectious peritonitis: 26 cases (1986-1993). Journal of the American Veterinary Medical
Association, 209(6): 1117-1120.
Herrewegh, A.A., Vennema, H., Horzinek, M.C., Rottier, P.J., de Groot, R.J.,1995a. The molecular
genetics of feline coronaviruses: comparative sequence analysis of the ORF7a/7b transcription
unit of different biotypes. Virology 212, 622–630.
Herrewegh, A.A., De Groot, R.J., Cepica, A., Egberink, H.F., Horzinek, M.C., Rottier, P.J., 1995b.
Detection of feline coronavirus RNA in feces, tissues, and body fluids of naturally infected cats by
reverse transcriptase PCR. Journal of Clinical Microbiology, 33(3), pp.684-689.
Hilgenfeld, R., Peiris, M., 2013. From SARS to MERS: 10 years of research on highly pathogenic
human coronaviruses. Antiviral Research, 100: 286-295.
Hohdatsu, T., Yamato, H., Ohkawa, T., Kaneko, M., Motokawa, K., Kusuhara, H., Kaneshima, T.,
Arai, S., Koyama, H., 2003. Vaccine efficacy of cell lysate with recombinant baculovirus-expressed
feline infectious peritonitis (FIP) virus nucleocapsid protein against progression of FIP. Veterinary
Microbiology, 97: 31-44.
Holzworth, J., 1963. Some important disorders of cats. The Cornell Veterinarian, 53: 157-160.
Horzinek, M.C., Osterhaus, A.D., Ellens, D.J., 1977. Feline infectious peritonitis virus. Zentralblatt
für Veterinärmedizin Reihe B, 24(5): 398-405
Horzinek, M.C., Osterhaus, A.D., 1979. Feline infectious peritonitis: a worldwide
serosurvey. American journal of veterinary research, 40(10): 1487-1492.
Hora, A.S., Tonietti, P.O., Taniwaki, S.A., Asano, K.M., Maiorka, P., Richtzenhain, L.J., Brandão, P.E.,
2016. Feline coronavirus 3c protein: a candidate for a virulence marker? BioMed Research
International, doi: 10.1155/2016/8560691
Hsieh, L.E., Huang, W.P., Tang, D.J., Wang, Y.T., Chen, C.T., Chueh, L.L., 2013. 3C protein of feline
coronavirus inhibits viral replication independently of the autophagy pathway. Research in
Veterinary Science, 95: 1241-1247.
Hsu, S.M., Raine, L., Fanger, H., 1981. Use of avidin-biotin-peroxidase complex (ABC) in
immunoperoxidase techniques: a comparison between ABC and unlabeled antibody (PAP)
procedures. Journal of Histochemistry & Cytochemistry, 29(4): 577-580.
Ishida, T., Shibanai, A., Tanaka, S., Uchida, K., Mochizuki, M., 2004. Use of recombinant feline
interferon and glucocorticoid in the treatment of feline infectious peritonitis. Journal of Feline
Medicine and Aurgery, 6(2): 107-109.
Jeffery, U., Deitz, K., Hostetter, S., 2012. Positive predictive value of albumin:globulin ratio for
feline infectious peritonitis in a mid-western referral hospital population. Journal of Feline
Medicine and Surgery, 14(12): 903-905.

References
91
Kennedy, M.A., Abd-Eldaim, M., Zika, S.E., Mankin, J., Kania, S.A., 2008. Evaluation of antibodies
against feline coronavirus 7b protein for diagnosis of feline infectious peritonitis. American Journal
Of Veterinary Research, 69(9): 1179-1182.
Kim, Y., Mandadapu, S.R., Groutas, W.C., Chang, K.O., 2013. Potent inhibition of feline
coronaviruses with peptidyl compounds targeting coronavirus 3C-like protease. Antiviral
research, 97(2): 161-168.
Kim, Y., Shivanna, V., Narayanan, S., Prior, A.M., Weerasekara, S., Hua, D.H., Kankanamalage,
A.C.G., Groutas, W.C., Chang, K.O., 2015. Broad-spectrum inhibitors against 3C-like proteases of
feline coronaviruses and feline caliciviruses. Journal of Virology, 89(9): 4942-4950.
Kim, Y., Liu, H., Kankanamalage, A.C.G., Weerasekara, S., Hua, D.H., Groutas, W.C., Chang, K.O.,
Pedersen, N.C., 2016. Reversal of the Progression of Fatal Coronavirus Infection in Cats by a Broad-
Spectrum Coronavirus Protease Inhibitor. PLoS Pathog, 12(3): e1005531.
Kipar, A., Bellmann, S., Kremendahl, J., Köhler, K., Reinacher, M., 1998. Cellular composition,
coronavirus antigen expression and production of specific antibodies in lesions in feline infectious
peritonitis. Veterinary Immunology and Immunopathology, 65: 243-257
Kipar, A., Koehler, K., Bellmann, S., Reinacher, M., 1999. Feline infectious peritonitis presenting as
a tumour in the abdominal cavity. The Veterinary Record, 144(5): 118-122.
Kipar, A., Köhler, K., Leukert, W., Reinacher,M., 2001. A comparison of lymphatic tissues from cats
with spontaneous feline infectious peritonitis (FIP), cats with FIP virus infection but no FIP, and
Cats with no Infection. Journal of Comparative Pathology, 125: 182-191.
Kipar, A., May, H., Menger, S., Weber, M., Leukert, W., Reinacher, M., 2005. Morphologic features
and development of granulomatous vasculitis in feline infectious peritonitis. Veterinary Pathology,
42(3): 321-330.
Kipar, A., Meli, M.L., Failing, K., Euler, T., Gomes-Keller, M.A., Scwartz, D., Lutz, H., Reinacher, M.,
2006a. Natural feline coronaviruss infection: differences in cytokine patterns in association with
the outcome of infection. Veterinary Immunology and Immunopathology, 112: 141-155.
Kipar, A., Baptiste, K., Barth, A., Reinacher, M., 2006b. Natural FCoV infection: cats with FIP exhibit
significantly higher viral loads than healthy infected cats. Journal of Feline Medicine and
Surgery, 8(1): 69-72.
Kipar, A., Meli, M.L., Baptiste, K.E., Bowker, L.J., Lutz, H., 2010. Sites of feline coronavirus
persistence in healthy cats. Journal of General Virology, 91: 1698-1707.
Kipar, A., Meli, M.L. 2014. Feline Infectious Peritonitis: Still an Enigma? Veterinary Pathology 51(2):
505-526.
References
92
Kiss, I., Poland, A.M., Pedersen, N.C., 2004. Disease outcome and cytokine responses in cats
immunized with an avirulent feline infectious peritonitis virus (FIPV)-UCD1 and challenge-exposed
with virulent FIPV-UCD8. Journal of Feline Medicine and Surgery, 6(2): 89-97.
Lewis, C.S., Porter, E., Matthews, D., Kipar, A., Tasker, S., Helps, C.R., Siddell, S.G., 2015.
Genotyping coronaviruses associated with feline infectious peritonitis. Journal of General Virology,
96: 1358-1368.
Li, F., 2016. Structure, function and evolution of coronavirus spike protein. Annual Review of
Virology, 3:237-261.
Licitra, B.N., Millet, J.K., Regan, A. D., Hamilton, B.S., Rinaldi, V.D., Duhamel, G.E., Whittaker, G.R.,
2013. Mutations in spike protein cleavage site and pathogenesis of feline infectious peritonitis.
Emerging Infectious Diseases, 19(7): 1066-1073.
Licitra, B.N., Sams, K.L., Lee, D.W., Whittaker, G.R., 2014. Feline coronaviruses associated with
feline infectious peritonitis have modifications to spike protein activation sites at two discrete
positions. arXiv:1412.4034
Lilliehöök, I., Tvedten, H.W., 2011. Errors in basophil enumeration with 3 veterinary hematology
systems and observations on occurrence of basophils in dogs. Veterinary Clinical Pathology, 40(4):
450-458.
Lin, C.N., Su, B.L., Huang, H.P., Lee, J.J., Hsieh, M.W., Chueh, L.L., 2009. Field strain feline
coronaviruses with small deletions in ORF7b associated with both enteric infection and feline
infectious peritonitis. Journal of Feline Medicine and Surgery, 11: 413-419.
Litster, A.L., Pogranichniy, R., Lin, T.L., 2013. Diagnostic utility of a direct immunofluorescence test
to detect feline coronavirus antigen in macrophages in effusive feline infectious peritonitis. The
Veterinary Journal, 198(2): 362-366.
Longstaff, L., Porter, E., Crossley, V.J., Hayhow, S.E., Helps, C.R., Tasker, S., 2015. Feline coronavirus
quantitative reverse transcriptase polymerase chain reaction on effusion samples in cats with and
without feline infectious peritonitis. Journal of Feline Medicine and Surgery,
doi:1098612X15606957.
Liu, D.X., Fung, T.S., Chong, K.K.L., Shukla, A. and Hilgenfeld, R., 2014. Accessory proteins of SARS-
CoV and other coronaviruses. Antiviral research, 109: 97-109.
Maggs, D., 2009. Feline uveitis An ‘intraocular lymphadenopathy’. Journal of Feline Medicine and
Surgery, 11(3): 167-182.
McBride, R., van Zyl., M., Fielding, B.C., 2014. The coronavirus nucleocapsid is a multifunctional
protein. Viruses, 6: 2991-3018.
McDonagh, P., Sheehy, P.A., Norris, J.M., 2014. Identification and characterisation of small
molecule inhibitors of feline coronavirus replication. Veterinary microbiology, 174(3): 438-447.

References
93
Meli, M., Kipar, A., Müller, C., Jenal, K., Gönczi, E.E., Borel, N., Gunn-Moore, D., Chalmers, S., Lin, F.
Reinacher, M., Lutz, H. , 2004. High viral loads despite absence of clinical and pathological findings
in cats xperimentally infected with feline coronavirus (FCoV) type I and in naturally FCoV-infected
cats. Journal of Feline Medicine and Surgery, 6(2): 69-81
Meli, M.L., Burr, P., Decaro, N., Graham, E., Jarrett, O., Lutz, H., McDonald, M., Addie, D.D., 2012.
Samples with high virus load cause a trend toward lower signal in feline coronavirus antibody
tests. Journal of feline medicine and surgery, 15: 295-299.
Motokawa, K., Hohdatsu, T., Hashimoto, H., Koyama, H., 1996. Comparison of the amino acid
sequence and phylogenetic analysis of the peplomer, integral membrane and nucleocapsid
proteins of feline, canine and porcine coronaviruses. Microbiology and immunology, 40(6): 425-
433.
Norris, J.N., Bosward, K.L., White, J.D., Baral., R.M., Catt, M.J., Malik, R., 2005. Clinicopathological
findings associated with feline infectious peritonitis in Sydney, Australia: 42 cases (1990-2002).
Australian Veterinary Journa, 83(11): 666-673.
Olsen, C.W., Corapi, W.V., Ngichabe, C.K., Baines, J.D., Scott, F.W., 1992. Monoclonal antibodies to
the spike protein of feline infectious peritonitis virus mediate antibody-dependent enhancement
of infection of feline macrophages. Journal of virology, 66(2): 956-965.
Paltrinieri, S., Parodi, M.C., Cammarata, G., Mambretti, M., 1998. Type IV Hypersensitivity in the
Pathogenesis of FIPV-Induced Lesions. Journal of Veterinary Medicine, Series B, 45(1-10): 151-159.
Paltrinieri, S., Cammarata Parodi, M., Cammarata, G., 1999. In vivo diagnosis of feline infectious
peritonitis by comparison of protein content, cytology, and direct immunofluorescence test on
peritoneal and pleural effusions. Journal of Veterinary Diagnostic Investigation, 11(4): 358-361.
Paltrinieri, S., Grieco, V., Comazzi, S., Cammarata Parodi, M., 2001. Laboratory profiles in cats with
different pathological and immunohistochemical findings due to feline infectious peritonitis
(FIP). Journal of Feline Medicine and Surgery, 3(3): 149-159.
Paltrinieri, S., Comazzi, S., Spagnolo, V., Giordano, A., 2002. Laboratory changes consistent with
feline infectious peritonitis in cats from multicat environment. Journal of Veterinary Medicine
Series A, 49(10): 503-510.
Paltrinieri, S., Ponti, W., Comazzi, S., Giordano, A., Poli, G., 2003. Shifts in circulating lymphocytes
subsets in cats with feline infectious peritonitis (FIP): pathogenic role and diagnostic revelance.
Veterinary Immunology and Immunopathology, 96: 141-148.
Paltrinieri, S., Giordano, A.,Tranquillo, V., Guazzetti, S., 2007. Critical assessment of the diagnostic
value of feline α1-acid glycoprotein for feline infectious peritonitis using the likelihood ratios
approach. Journal of Veterinary Diagnostic Investigation, 19(3): 266-272.

References
94
Paltrinieri, S., Ibba, F., Rossi, G., 2014a. Haematological and biochemical reference intervals of four
feline breeds. Journal of Feline Medicine and Surgery, 16(2): 125-136.
Paltrinieri, S., Rossi, G., Giordano, A., 2014b. Relationship between rate of infection and markers of
inflammation/immunity in Holy Birman cats with feline coronavirus. Research in Veterinary
Science, 97(2): 263-270.
Parida, M., Sannarangaiah, S., Dash, P.K., Rao, P.V.L., Morita, K., 2008. Loop mediated isothermal
amplification (LAMP): a new generation of innovative gene amplification technique; perspectives
in clinical diagnosis of infectious diseases. Reviews in Medical Virology, 18(6): 407-421.
Pedersen, N.C., Ward, J., Mengeling, W.L., 1978. Antigenic relationship of the feline infections
peritonitis virus to coronaviruses of other species. Archives of Virology, 58: 45-53.
Pedersen, N.C., Black, J.W., 1983. Attempted immunization of cats against feline infectious
peritonitis, using avirulent live virus or sublethal amounts of virulent virus. American Journal of
Veterinary Research, 44(2): 229-234.
Pedersen, N.C., 1995. An overview of feline enteric coronavirus and infectious peritonitis virus
infections. Feline Practice, 23: 46
Pedersen, N.C., Sato, R., Foley, J.E., Poland, A.M., 2004. Common virus infections in cats, before
and after being placed in shelters, with emphasis on feline enteric coronavirus. Journal of Feline
Medicine and Surgery, 6: 83-88.
Pedersen, N.C., Allen, C.E., Lyons, L.A., 2008. Pathogenesis of feline enteric coronavirus infection.
Journal of Feline Medicine and Surgery, 10: 529-541.
Pedersen, N.C. 2009. A review of feline infectious peritonitis virus infection: 1963-2008. Journal of
Feline Medicine and Surgery, 11: 225-258.
Pedersen, N.C., Liu, H., Scarlett, J., Leutenegger, C.M., Golovko, L., Kennedy, H., Kamal, F.M., 2012.
Feline infectious peritonitis: role of the feline coronavirus 3c gene in intestinal tropism and
pathogenicity based upon isolates from resident and adopted shelter cats. Virus Research, 165(1):
17-28.
Pedersen, N.C., 2014a. An update on feline infectious peritonitis: Virology and
immunopathogenesis. The Veterinary Journal, 201(2): 123-132.
Pedersen, N.C., 2014b. An update on feline infectious peritonitis: Diagnostics and therapeutics.
The Veterinary Journal, 201(2):133-141.
Perlman, S., Netland, J., 2009. Coronaviruses post-SARS: update on replication and pathogenesis.
Nature Reviews Microbiology, 7(6): 439-450.
Pesteanu-Somogyi, L.D., Radzai, C., Pressler, B.M., 2006. Prevalence of feline infectious peritonitis
in specific cat breeds. Journal of Feline Medicine and Surgery, 8: 1-5.

References
95
Pinto da Cunha, N., Giordano, A., Caniatti, M., Paltrinieri, S., 2009. Analytical validation of the
Sysmex XT-2000iV for cell counts in canine and feline effusions and concordance with cytologic
diagnosis. Veterinary Clinical Pathology, 38(2): 230-241.
Porter, E., Tasker, S., Day, M.J., Harley, R., Kipar, A., Siddell, S.G., Helps, C.R., 2014. Amino acid
changes in the spike protein of feline coronavirus correlate with systemic spread of virus from the
intestine and not with feline infectious peritonitis. Veterinary Research, 45:1-11.
Prentice, E., Jerome, W.G., Yoshimori, T., Mizushima, N., Denison, M.R., 2004. Coronavirus
replication complex formation utilizes components of cellular autophagy. The Journal of Biological
Chemistry, 279(11): 10136-10141.
Regan, A.D., Ousterout D.G., Whittaker, G., 2010. Feline lectin activity is critical for the cellular
entry of feline infectious peritonitis virus. Journal of Virology, 84(5): 7917-7921.
Riemer, F., Kuehner, K.A., Ritz, S., Sauter-Louis, C., Hartmann, K., 2016. Clinical and laboratory
features of cats with feline infectious peritonitis – a retrospective study of 231 confirmed cases
(2000-2010). Journal of Feline Medicine and Surgery, 18(4): 348-356.
Ritz, S., Egberink, H., Hartmann, K., 2007. Effect of Feline Interferon-Omega on the Survival Time
and Quality of Life of Cats with Feline Infectious Peritonitis. Journal of Veterinary Internal
Medicine, 21(6): 1193-1197.
Rohrbach, B.W., Legendre, A.M., Baldwin, C.A., Lein, D.H., Reed, W.M., Wilson, R.B., 2001.
Epidemiology of feline infectious peritonitis among cats examined at veterinary medical teaching
hospitals. Journal of the American Veterinary Medical Association, 218: 1111-1115.
Rossi, G., Cornaro, C., Battilani, M., Pocacqua, V., Paltrinieri, S., 2011. Production of IFN-γ in feline
whole blood after incubation with potential T-cell epitopes of the nucleocapsid protein of feline
coronavirus. Veterinary Microbiology, 150(3): 248-256.
Rossi, G., Capitani, L., Ceciliani, F., Restelli, L., Paltrinieri, S., 2013. Hyposialylated α1-acid
glycoprotein inhibits phagocytosis of feline neutrophils. Research in veterinary science, 95(2): 465-
471.
Rota, A., Paltrinieri, S., Jussich, S., Ubertalli, G., Appino, S., 2008. Priapism in a castrated cat
associated with feline infectious peritonitis. Journal of feline medicine and surgery, 10(2): 181-184.
Rottier, P.J.M., 1999. The molecular dynamics of feline coronaviruses. Veterinary Microbiology, 69:
117-125.
Sakai, N., Iijima, S., Shiba, K., 2004. Reinvestigation of clinical value of Rivalta reaction of puncture
fluid. Rinsho Byori. The Japanese Journal of Clinical Pathology, 52(11): 877-882.
Sawicki, S.G., Sawicki, D.L., Siddell, S.G., 2007. A contemporary view of coronavirus transcription.
Journal of Virology, 81(1): 20-29.

References
96
Sharif, S., Arshad, S.S., Hair-Bejo, M., Omar, A.R., Zeenathul, N.A., Fong, L.S., Rahman, N.A.,
Arshad, H., Shamsudin, S., Isa, M.K., 2010. Descriptive distribution and phylogenetic analysis of
feline infectious peritonitis virus isolates of Malaysia. Acta Veterinaria Scandinavica 52, 1.
Sigurðardóttir, Ó.G., Kolbjørnsen, Ø., Lutz, H., 2001. Orchitis in a cat associated with coronavirus
infection. Journal of Comparative Pathology, 124(2-3): 219-222.
Simons, F.A., Vennema, M., Rofina, J.E., Pol, J.M., Horzinek, M.C., Rottier, P.J., Egberink, H.F. 2005.
A mRNA PCR for the diagnosis of feline infectious peritonitis. Journal of Virological Methods,
124(1-2): 111-116.
Soma, T., Wada, M., Taharaguchi, S., Tajima, T., 2013. Detection of ascitic feline coronavirus RNA
from cats with clinically suspected feline infectious peritonitis. Journal of Veterinary Medical
Science, 75(10): 1389-1392.
Sparkes, A.H., Gruffydd-Jones, T.J., Harbour, D.A., 1991. Feline infectious peritonitis: a review of
clinicopathological changes in 65 cases, and a critical assessment of their diagnostic value. The
Veterinary Record, 129(10): 209-212.
Stiles, J., 2014. Ocular manifestations of feline viral diseases. The Veterinary Journal, 201(2): 166-
173.
Stertz, S., Reichelt, M., Spiegel, M., Kuri, T., Martínez-Sobrido, L., García-Sastre, A., Weber, F.,
Kochs, G., 2007. The intracellular sites of early replication and budding of SARS-coronavirus.
Virology, 361: 304-315.
Stockham, S.L., Scott, M.A. 2008 Proteins. In: Stockham, S.L. and Scott, M.A. (eds). Fundamental of
Veterinary Clinical Pathology, 2nd ed. Blackwell Publishing, Ammes, IA pp:369-414.
Stoddart, M.E., Whicher, J.T., Harbour, D.A., 1988. Cats inoculated with feline infectious peritonitis
virus exhibit a biphasic acute phase plasma protein response. Veterinary Record, 123(24): 621-
624.
Takano, T., Hohdatsu, T., Hashida, Y., Kaneko, Y., Tanabe, M., Koyama, H., 2007a. A “possible”
involvement of TNF-alpha in apoptosis induction in peripheral blood lymphocytes of cats with
feline infectious peritonitis. Veterinary microbiology, 119(2): 121-131.
Takano, T., Hohdatsu, T., Toda, A., Tanabe, M., Koyama, H., 2007b. TNF-alpha, produced by feline
infectious peritonitis virus (FIPV)-infected macrophages, upregulates expression of type II FIPV
receptor feline aminopeptidase N in feline macrophages. Virology, 364(1): 64-72.
Takano, T., Ohyama, T., Kokumoto, A., Satoh, R., Hohdatsu, T., 2011. Vascular endothelial growth
factor (VEGF), produced by feline infectious peritonitis (FIP) virus-infected monocytes and
macrophages, induces vascular permeability and effusion in cats with FIP. Virus Research,
158(1):161-168.

References
97
Takano, T., Katoh, Y., Doki, T., Hohdatsu, T., 2013. Effect of chloroquine on feline infectious
peritonitis virus infection in vitro and in vivo. Antiviral research, 99(2): 100-107.
Tammer, R., Evensen, O., Lutz, H., Reinacher, M., 1995. Immunohistological demonstration of
feline infectious peritonitis virus antigen in paraffin-embedded tissues using feline ascites or
murine monoclonal antibodies. Veterinary immunology and immunopathology, 49(1): 177-182.
Taylor, S.S., Tappin, S.W., Dodkin, S.J., Papasouliotis, K., Casamian-Sorrosal, D., Tasker, S., 2010.
Serum protein electrophoresis in 155 cats. Journal of Feline Medicine and Surgery, 12(8): 643-653.
Trotman, T.K., Mauldin, E., Hoffmann, V., Del Piero, F., Hess, R., 2007. Skin fragility syndrome in a
cat with feline infectious peritonitis and hepatic lipidosis. Veterinary Dermatology, 18(5): 365-369.
Tsai, H.Y., Chueh, L.L., Lin, C.N., Su, B.L.,2011. Clinicopathological findings and disease staging of
feline infectious peritonitis: 51 cases from 2003 to 2009 in Taiwan. Journal of Feline Medicine and
Surgery,13(2): 74-80.
Ujike, M., Taguchi, F., 2015. Incorporation of Spike and Membrane glycoproteins into coronavirus
virions. Viruses, 7: 1700-1725.
Van Hamme, E., Desmarets, L., Dewerchin, H.L, Nauwynck, H.J., 2011. Intriguing interplay between
feline infectious peritonitis virus and its receptors during entry in primary feline monocytes. Virus
Research, 160: 32-39.
van Hemert, M.J., van den Worm S.H.E., Knoops K., Mommaas, A.M., Gorbalenya, A.E., Eric J.
Snijder, E.J., 2008. SARS-Coronavirus replication/transcription complexes are membrane-protected
and need a host factor for activity in vitro. PLOS pathogens, 4(5): e1000054
Venkatagopalan, P., Daskalova, S.M., Lopez, L.A., Dolezal, K.A., Hogue, B.G., 2015. Coronavirus
envelope (E) protein remains at the site of assembly. Virology, 478: 75-85.
Vennema, H., Poland, A., Foley, J., Pedersen, N.C., 1998. Feline infectious peritonitis viruses arise
by mutation from endemic feline enteric coronaviruses. Virology, 243: 150-157.
Verheije, M.H., Hagemeijer, M.C., Ulasli, M., Reggiori, F., Rottier, P.J.M., Masters, P.S., de Haan,
C.A.M., 2010. The coronavirus nucleocapsid protein is dynamically associated with the replication-
transcription complexes. Journal of Virology, 84(21): 11575-11579.
Vermeulen, B.L., Devriendt, B., Olyslaegers, D.A., Dedeurwaerder, A., Desmarets, L.M., Favoreel,
H.W., Dewerchin, H.L., Nauwynck, H.J., 2013. Suppression of NK cells and regulatory T
lymphocytes in cats naturally infected with feline infectious peritonitis virus. Veterinary
Microbiology, 164(1-2):46-59.
Vigani, A., Travetti, O., Giordano A., 2009. Uncommon mediastinal cyst-like manifestation of feline
infectious peritonitis. Veterinary Record, 165(8): 239-241.

References
98
Vogel, L., Van der Lubben, M., Lintelo, E.G.T., Bekker, C.P.J., Geerts, T., Schuijff, L.S., Grinwis,
G.C.M., Egberink, H.F., Rottier, P.J.M., 2010. Pathogenic characteristics of persistent feline enteric
coronavirus infection in cats. Veterinary Research, 41(5): 71
Ward, J., 1970. Morphogenesis of a virus in cats with experimental feline infectious peritonitis.
Virology, 41:191-194.
Weiss, R.C., Scott, F.W., 1981. Pathogenesis of feline infetious peritonitis: pathologic changes and
immunofluorescence. American journal of veterinary research, 42(12): 2036-2048.
Weiss, W.R., Navas-Martin, S. 2005. Coronavirus Pathogenesis and the Emerging Pathogen Severe
Acute Respiratory Syndrome. Microbiology and Molecular Biology Reviews 69(4):635-664.
Wolfe, L.G., Griesemer, R.A., 1966. Feline Infectious Peritonitis. Pathologia Veterinaria Online,
3(3): 255-270.
Zook, B.C., King, N.W., Robison, R.L., McCombs, H.L., 1968. Ultrastructural Evidence for the Viral
Etiology of Feline Infectious Peritonitis. Pathologia Veterinaria Online, 5(1): 91-95.