innovations in reducing cost and improving quality of health care tom williams, executive director...
Post on 20-Dec-2015
216 views
TRANSCRIPT

Innovations in Reducing Cost and Improving Quality of
Health Care
Tom Williams, Executive Director Integrated Healthcare Association (IHA)
2010 Health Care Forecast ConferenceIrvine, CA
February 26, 2010
2
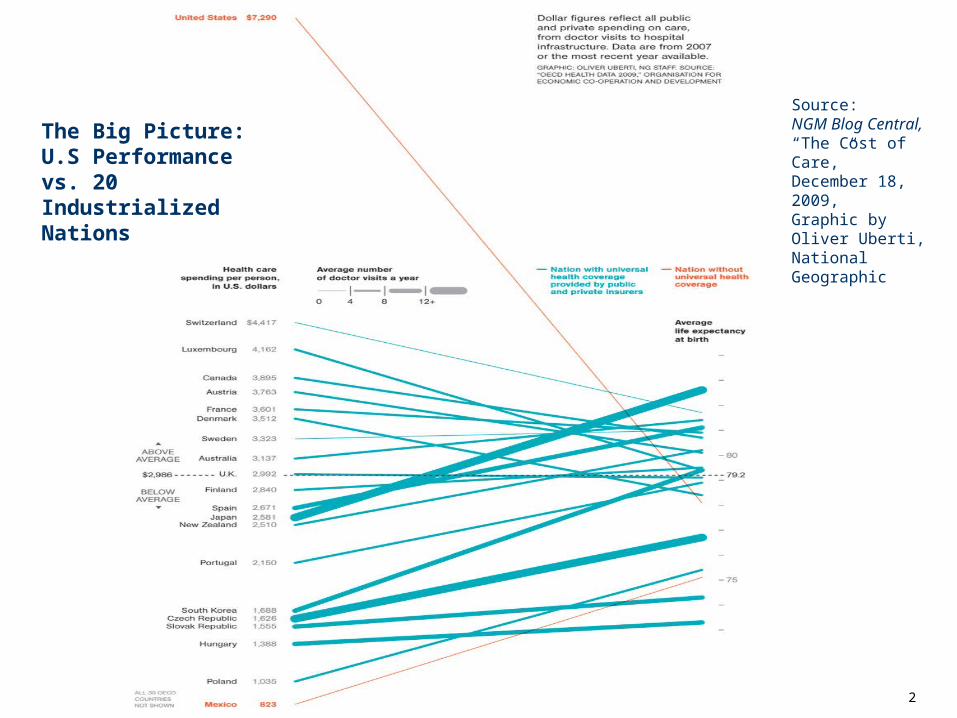
The Big Picture: U.S Performance vs. 20 Industrialized Nations
Source:NGM Blog Central,“The Cost of Care,”December 18, 2009,Graphic by Oliver Uberti, National Geographic

Topics
• An Overview and Framework
• IHA Initiatives/Innovations
• Forecasts
3

A Framework for Health Improvement
Goal Strategy Tactics
Performance Measurement
Measure and report quality, safety, and cost efficiency
Continuous quality improvement (CQI)
Internal reporting for CQI
Public reporting
Harmonize measures across payers
Performance Payment
Incent/reward performance and value instead of volume
Reform payment to incent value (quality, safety and cost efficiency)
Pay for performance
Medical home
Episode payment
Partial and global capitation
Performance based contracts
High- Performance Organization
Coordinate & integrate better care delivery
Integrate physicians and hospitals
Widespread EMR adoption
Health information exchange (HIE)
Accountable care organizations (ACO’s)
HIT stimulus
State, regional HIE
4

Value Based Payment Hierarchy
Value
Global Capitation
Full Episode Payment
Partial Episode Payment
Partial Capitation:
Full Professional
Primary Care
FFS & Medical Home Fees
Pay for Performance
Case Rates (e.g. DRGs)
FFS
Volume
5

A Framework for Health Improvement
6
Small MDPractice &UnlimitedHospital
Primary MD Group Practice
Multi-Specialty MD Group Practice
Hospital System
Integrated Delivery System
Global Capitation
Full Episode Payment
Partial Episode Payment
Full Professional Capitation
Primary Care Capitation
FFS & Medical Home Fees
Pay for Performance
Case Rates (e.g. DRGs)
FFS
Integration
Value
Health Im
prove
ment
Source: A. Shih, K. Davis, S. Schoenbaum, A. Gauthier, R. Nuzum, and D. McCarthy, Organizing the U.S. Health Care Delivery System for High Performance, The Commonwealth Fund, August 2008
MarketLeverage

7
Health Care Spending: Massachusetts
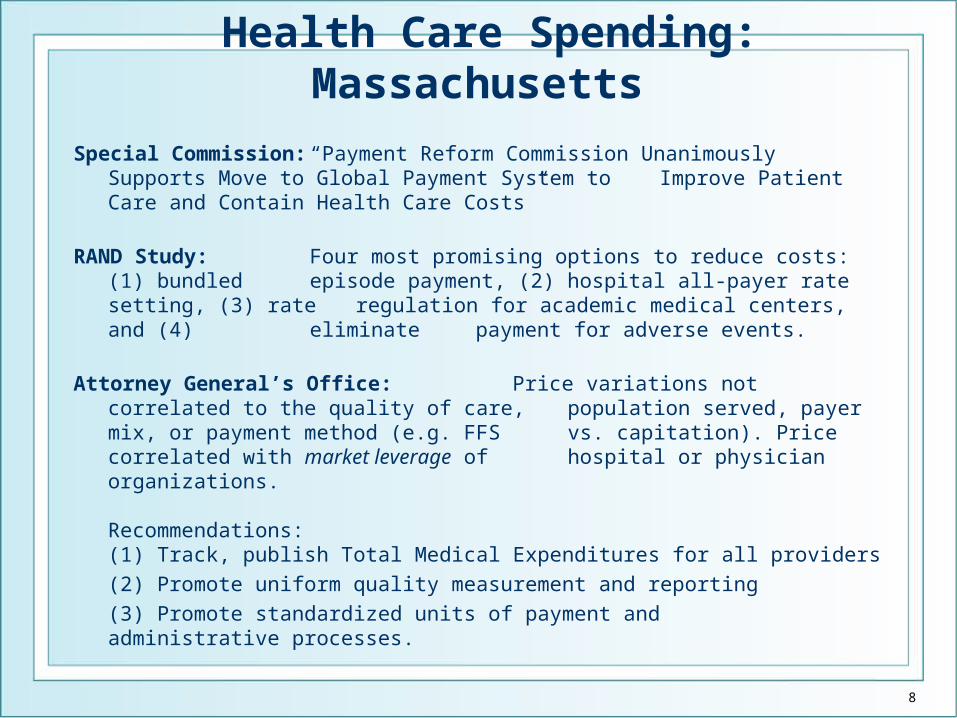
Health Care Spending: Massachusetts
Special Commission: “Payment Reform Commission Unanimously Supports Move to Global Payment System to Improve Patient Care and Contain Health Care Costs”
RAND Study: Four most promising options to reduce costs: (1) bundled episode payment, (2) hospital all-payer rate setting, (3) rate regulation for academic medical centers, and (4) eliminate payment for adverse events.
Attorney General’s Office: Price variations not correlated to the quality of care, population served, payer mix, or payment method (e.g. FFS vs. capitation). Price correlated with market leverage of
hospital or physician organizations.
Recommendations:(1) Track, publish Total Medical Expenditures for all
providers(2) Promote uniform quality measurement and reporting(3) Promote standardized units of payment and administrative processes.
8

Healthcare Spending: California
9
February 25, 2010, Health Affairs
“Unchecked Provider Clout in California Foreshadows Challenges to Health Reform”
“Health Affairs Article Cites Provider Market Power to Negotiate higher private insurer payment rates as, the Elephant in the Room of the National Health Reform debate. “
Robert A. Berenson, Paul B. Ginsberg, and Nicole Kemper, “Unchecked Provider Clout In California Foreshadows Challenges To Health Reform,” Health Affairs 29, No 4 (2010)
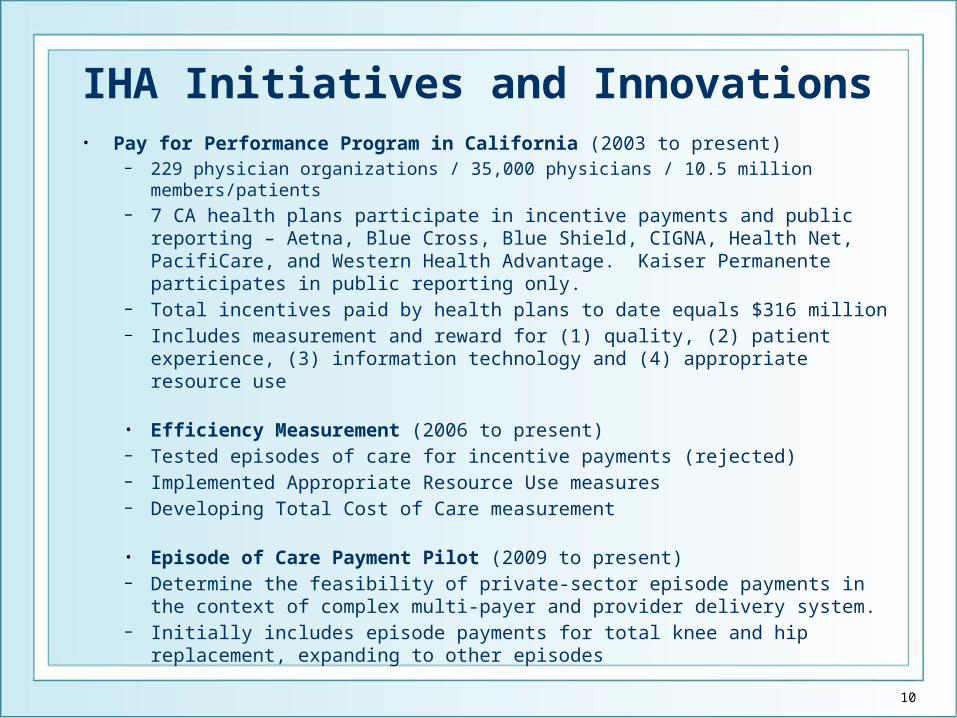
IHA Initiatives and Innovations• Pay for Performance Program in California (2003 to present)
− 229 physician organizations / 35,000 physicians / 10.5 million members/patients
− 7 CA health plans participate in incentive payments and public reporting – Aetna, Blue Cross, Blue Shield, CIGNA, Health Net, PacifiCare, and Western Health Advantage. Kaiser Permanente participates in public reporting only.
− Total incentives paid by health plans to date equals $316 million− Includes measurement and reward for (1) quality, (2) patient
experience, (3) information technology and (4) appropriate resource use
• Efficiency Measurement (2006 to present)− Tested episodes of care for incentive payments (rejected)− Implemented Appropriate Resource Use measures− Developing Total Cost of Care measurement
• Episode of Care Payment Pilot (2009 to present)− Determine the feasibility of private-sector episode payments in the
context of complex multi-payer and provider delivery system. − Initially includes episode payments for total knee and hip replacement,
expanding to other episodes
10
111111
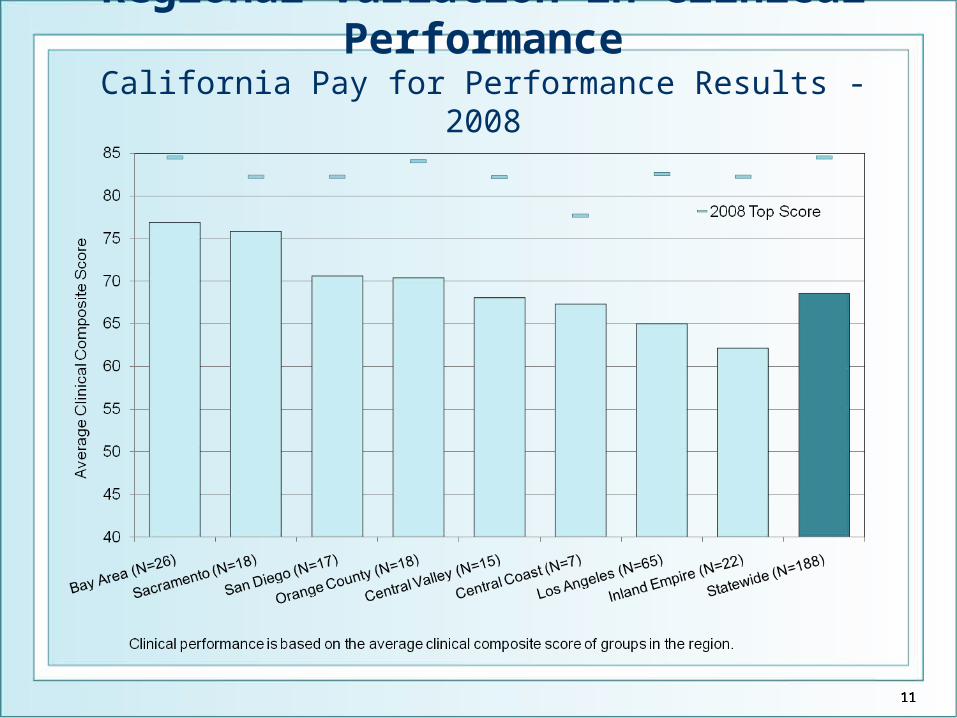
Regional Variation in Clinical Performance
California Pay for Performance Results - 2008
11

California Pay for Performance: A Tale of Two Regions (2008)
Bay Area Inland Empire
Clinical Composite 63% 77%Score
PCPs/100K Pop. 79 40
% Pop. Medi-Cal 13% 19%
Per Capita Income $ 46,015 $ 23,540
12

Knee Replacement Procedure Episode GroupAverage Commercial Population Costs, by Type of Service1
ALOS=3.9 Days
Knee Replacement Surgery
Pre-Window Post-Window
90 Days 14 Days 42 Days 90 Days 180 Days
Pre-Surgery$1790.7% of Total
Pre-Surgery I$2731,0% of Total
Inpatient Stay
$21,855
82.3% Tot
Recovery
$2,720
10.2% of Tot
Follow Up I
$1,019
3.8% of Tot
Follow Up II
$519
2.0% of Tot
Total Cost $26,565
$10
$20
$30
Tota
l A
llow
ed
Cost
s (0
00)
{
1) Source: Ingenix Claims Data- 602 complete episodes

Forecast 1: Pay for Performance Will Evolve into Performance
Based Contracting
Pay for Performance
• Emphasis on quality
• Smaller incentives (2 - 5%)
• On “top” of base payments
• “Have’s” advantaged
• Applicable to any method of payment (e.g. FFS, episode, capitation)
14
Performance Based Contracting
• Emphasis on value
• More substantial bonuses (10%)
• Integral to base payments
• Helps level playing field
• Applicable to any method of payment (e.g. FFS, episode, capitation)

BCBS Massachusetts – Alternative Quality Contract (AQC)
15Presentation by Christopher Collins, Blue Cross Blue Shield of Mass., Hospital Payment Reform Summit, 9/17/09, Washington, DC

California - Performance Based Contract Framework
Basecapitation
Quality Adjusted Efficiency IncentiveInflation
UM Bonus
P4P Bonus
Basecapitation
1% quality P4P bonus plus 2% utilization gain sharing bonus
10% Quality Adjusted Efficiency gain sharing potential
Year 1 Year 2 Year 3 Year 4 Year 5
Efficiency
Quality

Forecast 2: Health Cost Curve Will Bend Under Its Own Weight
17
• U.S. health costs as a percent of GDP is growing steadily
• Federal health costs as a percentage of total public expenditures is growing exponentially

Federal Outlays for Health Programs (Billions)
Fiscal Year
Total Health Outlays
Employer Tax Credit for
Health Benefits
Total Health Outlays &
Employer Tax Credit Combined
Total Federal Outlays
Health Outlays as %
of Total Outlays
1970 13.9 Data Not Available 13.9 195.6 7.1%
1980 65.5 9.6 75.1 590.9 12.7%
1990 180.3 51.0 231.3 1253.1 18.5%
2000 389.0 76.5 465.5 1789.2 26.0%
2005 614.2 118.4 732.6 2472.2 29.6%
2010 estimate
940.1 185.3 1125.4 3591.1 31.3%
18
1970
2010
31.3%
7.1%Health Outlays as % of Total Federal Outlays
Sources: http://www.usgovernmentspending.com; http://www.gpoaccess.com; and http://fraser.stlouisfed.org

Federal Expenditures for Health Programs
19
U.S. Health Expenditures
(Billions)
U.S. Health Expenditures
% of Total
U.S. Health Expenditures
% of GDP
Sources: http://www.usgovernmentspending.com; http://www.gpoaccess.com; and http://fraser.stlouisfed.org
Integrated Healthcare Association
For more information: www.iha.org (510) 208-1740
2020
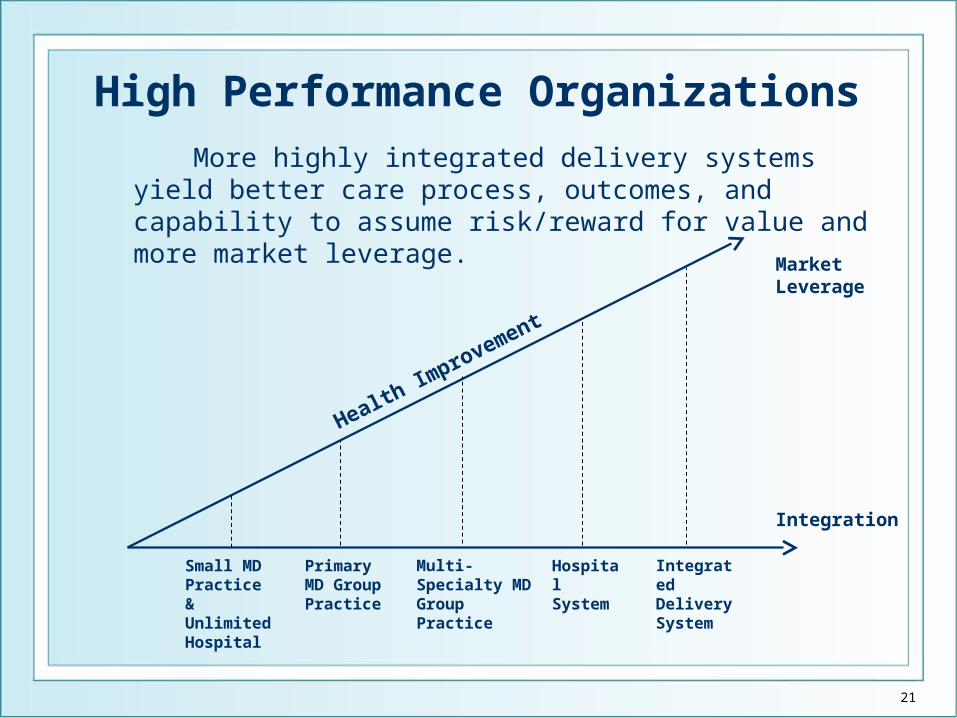
High Performance Organizations More highly integrated delivery systems yield better
care process, outcomes, and capability to assume risk/reward for value and more market leverage.
21
Small MDPractice &UnlimitedHospital
Primary MD Group Practice
Multi-Specialty MD Group Practice
Hospital System
Integrated Delivery System
Health Im
provement
Integration
MarketLeverage

BCBS Massachusetts – Alternative Quality Contract (AQC)
22Presentation by Christopher Collins, Blue Cross Blue Shield of Mass., Hospital Payment Reform Summit, 9/17/09, Washington, DC
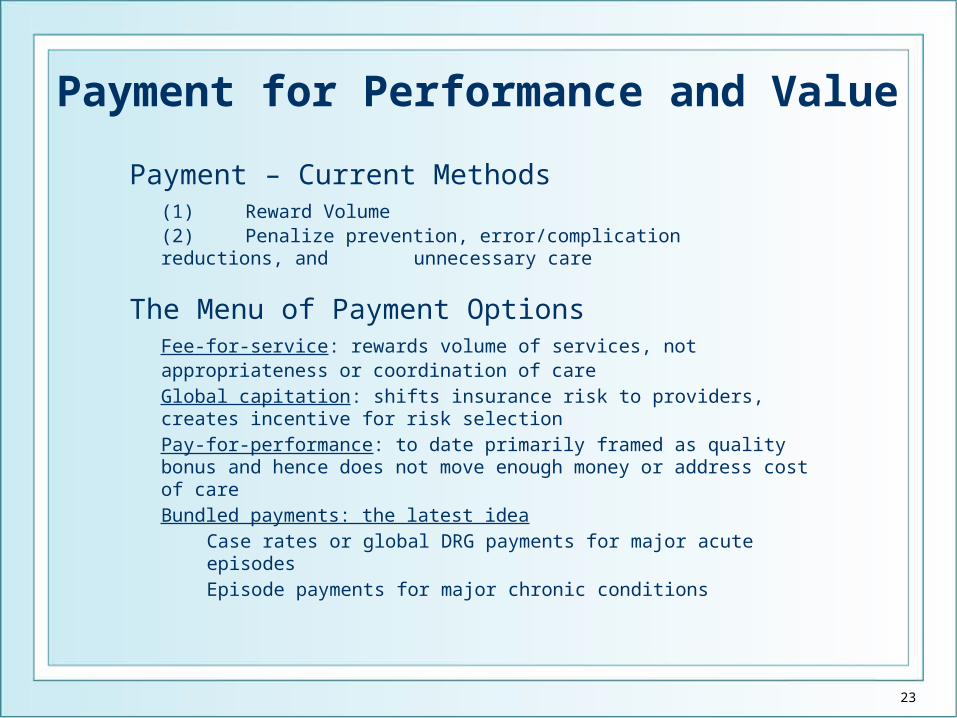
Payment for Performance and Value
Payment – Current Methods(1) Reward Volume(2) Penalize prevention, error/complication reductions, and unnecessary care
The Menu of Payment OptionsFee-for-service: rewards volume of services, not appropriateness or coordination of careGlobal capitation: shifts insurance risk to providers, creates incentive for risk selectionPay-for-performance: to date primarily framed as quality bonus and hence does not move enough money or address cost of careBundled payments: the latest idea
Case rates or global DRG payments for major acute episodesEpisode payments for major chronic conditions
23

Performance Measurement“You cannot improve what you cannot measure”
24
QualityEfficiency (Cost)
Clinical Patient Experiences Utilizatio
nCosts
Process Outcomes
Measures + - + + + -
Data Availability + - + + + +
Summary
Good Measure
sAnd
Data
Poor Measuresand Data
Good Measuresand Data
Good Measure
s and Data
Poor Measures/ Good Data

25
“And that’s why bridges are falling...”
Source: Flickr: Dani Bora, Photographer