innovations in beef production systems that enhance the nutritional and health value of beef lipids...
TRANSCRIPT

Innovations in beef production systems that enhance the nutritional and health
value of beef lipids and their relationship with meat quality
N.D. Scollan1, J-F Hocquette2, K. Nuernberg3, D. Dannenberger3, I Richardson4 and A. Moloney5
1IGER, Wales, UK ,2INRA-Theix, France,3FBN-Dummerstorf, Germany4University of Bristol, UK,5Teagasc, Grange Research Centre, Ireland

Drivers for enhanced food quality and differentiation
consumers safe healthier consistent convenient
globalisation commodity prices world trade negotiations animal welfare environmental traceability commodity production

Drivers for enhanced beef quality and differentiation
Increased demand for quality Differentiation (product brandings, geographical
origin, sensory or processing characteristics
Quality becoming more complex
Physical intrinisic qualities – colour, shape, appearance, tenderness, juiciness, flavour
Extrinsic qualities – brand, quality mark, origin, healthiness, production

Nutritional aspects of health
consumers – diet, health and well-being
food components
High biological value protein
Micronutrients
– vitamins A1, B6, B12, D, E, iron, zinc, selenium

Fat componentFat component GuidelineGuideline
Total fatTotal fat < 15-30< 15-30**
Saturated fatty acids (SFA)Saturated fatty acids (SFA) < 10< 10**
nn-6 PUFA-6 PUFA < 5-8< 5-8**
nn-3 PUFA-3 PUFA < 1-2< 1-2**
TransTrans fatty acids fatty acids < 1< 1**
P:SP:S 4-54-5
nn-6 : -6 : nn-3-3 < 3< 3
(World Health Organisation, 2003)
Nutritional aspects of health
* * % of dietary intake% of dietary intake

Fatty acids in beef
Polyunsaturated fatty acids (PUFA)
linoleic acid (18:2n-6) -linolenic acid (18:3n-3) eicosapentaenoic acid (20:5n-3; EPA) docosapentaenoic (22:5n-3 DPA) docosahexaenoic acid (22:6n-3; DHA) conjugated linoleic acid (CLA)
Monounsaturated18:1 n-9
Saturated14:0; 16:0 and 18:0

Sources of omega-3 PUFA
meatmeat fishfish fish oilsfish oils eggseggs

Key targets
omega-3 (n-3) polyunsaturated fatty acids-linolenic acid (18:3n-3) long chain C20 PUFA (EPA, DPA and DHA)
increase P:S (0.1 to 0.4) and decrease n-6:n-3 (<3)
CLAs – cis-9, trans-11 CLA - increase
trans-fatty acids
impact of colour shelf life and sensory attributes

Fat in muscle
2-5% “low-in-fat”2-5% “low-in-fat”
Triacylglycerols (75% total Triacylglycerols (75% total lipid– 16:0, 18:0 and 18:1 lipid– 16:0, 18:0 and 18:1 nn-9-9
Phospholipid (25% total lipid; – Phospholipid (25% total lipid; – 16:0, 18:0, 18:1 16:0, 18:0, 18:1 nn-9, -9, but also but also long chain PUFAlong chain PUFA
Fat in muscle - membrane fat (phospholipid), intermuscular fat and as intramuscular (marbling fat)
Influenced by age, genotype and nutrition

Age in relation to total lipid, neutral lipid and phospholipid
0
1000
2000
3000
4000
5000
6000
7000
Total Lipid Neutral lipid Phospholipid
14 months
19 months
24 months
(Warren et al., 2004)
mg/
100g
mus
cle

Age in relation to saturated (SFA, monounsaturated (MUFA) and phospholipid (PL)
0
0.1
0.2
0.3
0.4
0.5
SFA MUFA PUFA
14 months 19 months 24 months
(Warren et al., 2004)
prop
ortio
n

Effect of age on P:S and n-6:n-3 ratios in beef muscle
0
0.05
0.1
0.15
0.2
0.25
P:S
14 months 19 months 24 months
0
2
4
6
8
10
n-6:n-3
(Warren et al., 2004)

Breeds and intramuscular fat
0
1000
2000
3000
4000
5000
Total fatty acids
Holstein-Friesian
W elsh Black
Belgium Blue (DM)
mg/
100g
mus
cle
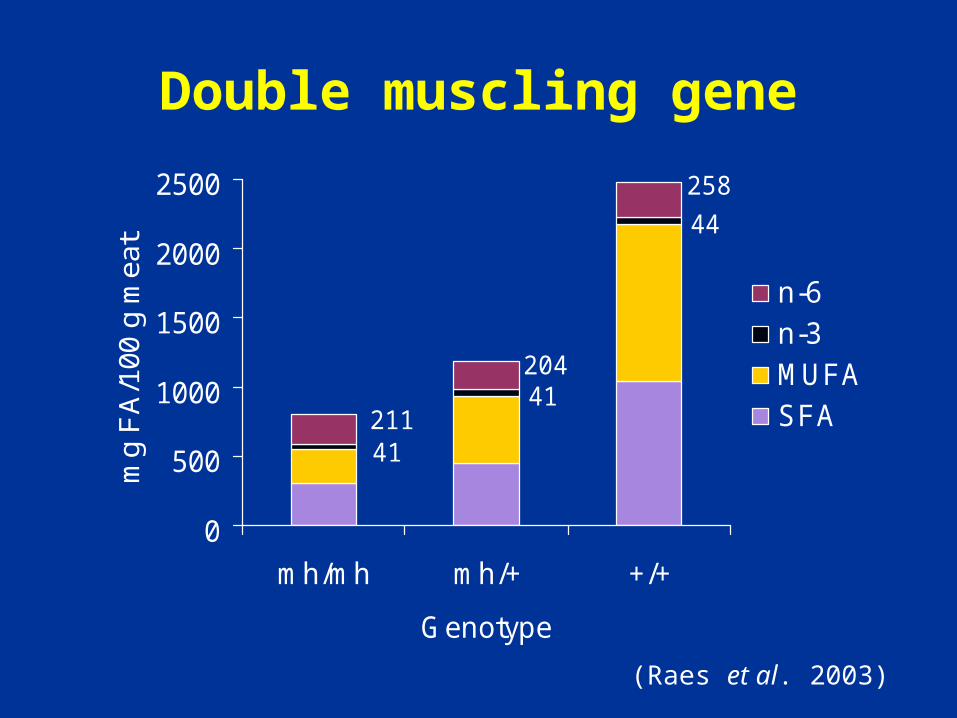
Double muscling gene
44
41
41
258
204
211
0
500
1000
1500
2000
2500
mh/mh mh/+ +/+
Genotype
mg
FA
/100
g m
eat
n-6n-3MUFASFA
(Raes et al. 2003)
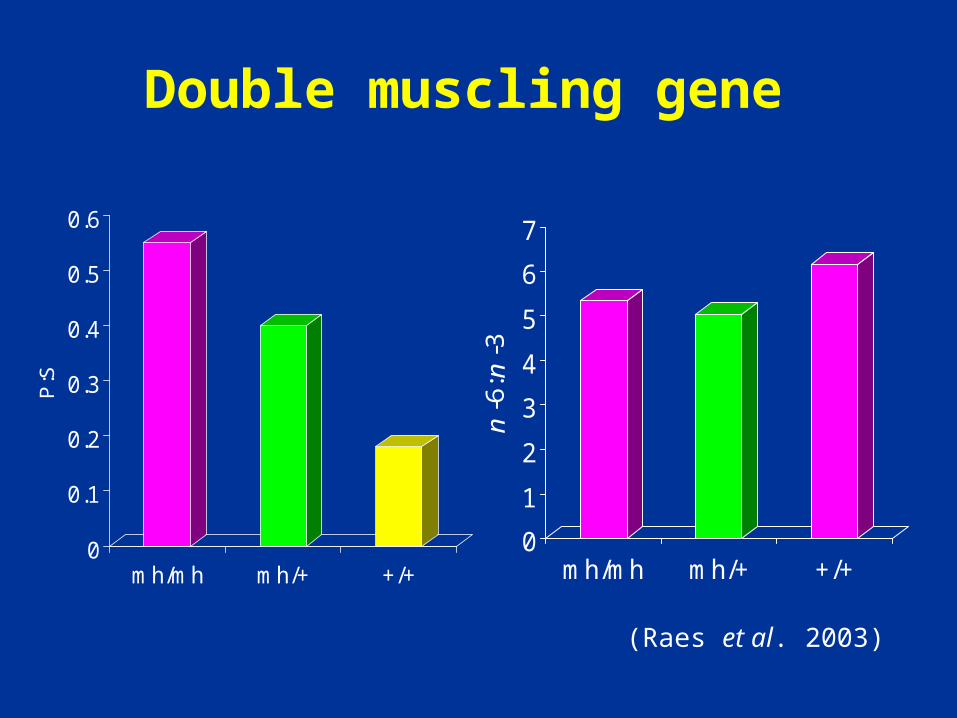
0
0.1
0.2
0.3
0.4
0.5
0.6
P:S
mh/mh mh/+ +/+
0
1
2
3
4
5
6
7
n-6
: n-3
mh/mh mh/+ +/+
Double muscling gene
(Raes et al. 2003)
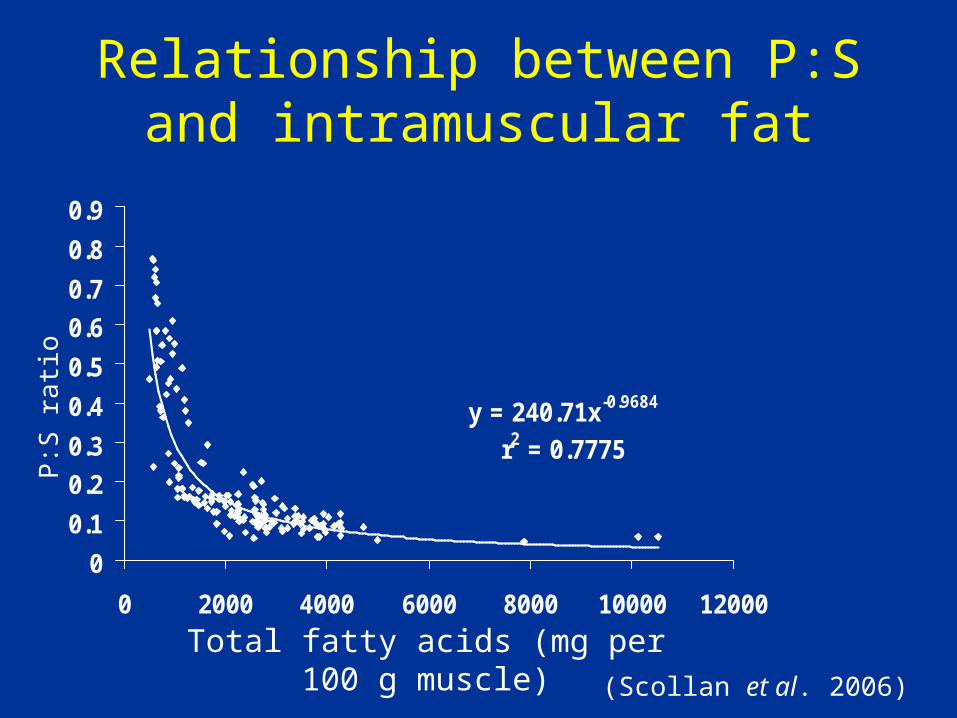
Relationship between P:S and intramuscular fat
y = 240.71x-0.9684
r2 = 0.7775
0
0.1
0.2
0.3
0.4
0.5
0.6
0.7
0.8
0.9
0 2000 4000 6000 8000 10000 12000
Total fatty acids (mg per 100 g muscle)
P:S
ra
tio
(Scollan et al. 2006)

Nutritional strategies
Nutrition – high PUFA rations
forages
concentrate containing linseed / fish oil
rumen protected lipids

Families of polyunsaturated fatty acids n-3 Series
18:3Alpha-linolenic acid
18:4
20:4
20:5Eicosapentaenoic acid (EPA)
22:5
22:6Docosahexaenoic acid (DHA)
n-6 Series18:2
Linoleic acid
18:3
20:3
20:4Arachidonic acid
22:4
22:5Docosapentaenoic acid (DPA)

Forage v. concentrate feeding
(mg/100 g tissue) (Warren et al. 2003)
***0.0100.240.09P:S
***0.248.91.2n-6:n-3
***0.301.35.022:6n-3
***1.2810.824.522:5n-3
***1.054.517.720:5n-3
***1.607.232.018:3n-3
***6.68146.962.018:2n-6
***139.317242581Total
Sig.s.e.d.ConcentrateGrassFatty acids

Influence of length of grass feeding
Days
***0.0090.150.120.140.12P:S
***0.1081.461.631.992.21n-6:n-3
NS0.6062.722.782.863.2222:6n-3
***0.507.76.45.55.620:5n-3
***1.8634.430.925.419.618:3n-3
NS3.3259.059.463.762.118:2n-6
NS177.52515275423292461Total
Sig.s.e.d.15899400Fatty acids
(mg/100 g tissue) (Noci et al. 2005)

Forage type: grass v. red clover
(mg/100 g tissue) (Scollan et al. 2006)
3074
Red clover + vitamin E
3081
Grass silage
0.12
2.66
0.07
3.28
**0.010.100.09P:S
***0.152.302.73n-6:n-3
2.65
24.2
14.5
2.51
21.6
12.9
NS0.2752.782.3422:6n-3
NS2.9325.123.922:5n-3
NS1.3314.913.420:5n-3
37.5
99.3
22.5
73.2
***3.8350.734.118:3n-3
***6.68113.292.818:2n-6
NS604.740013639Total
Sig.s.e.d.Red clover
50:50 mix grass/red
clover
Fatty acids

Polyphenol oxidase (PPO) in red clover
• Oxidises phenols to quinones in the presence of oxygen• Quinones are very reactive• Quinones bind to proteins to give protein, quinone complexes• Complexes are more resistant to lipolysis (and proteolysis)

Effect of different sources of oil
NS0.0080.050.050.070.07P:S
**0.1061.110.911.192.00n-6:n-3
***0.524.94.62.42.222:6n-3
NS0.71616151522:5n-3
***1.91523161120:5n-3
**5.63026432218:3n-3
NS9.26466788118:2n-6
NS741.03973429242223529Total
Sig.s.e.d.Linseed/fish oil
Fish oilLinseedControlFatty acids
(mg/100 g tissue)(Scollan et al. 2001)

Mouth AbomasumDietary Lipid
FFA C18 PUFA
Conjugated dienes and trienes
Trans 18:1
18:0
Lipolysis
Biohydrogenation
18:3 n-3 92%
18:2 n-6 86%
Lipolysis and biohydrogenation
Rumen

Influence of ruminally protected plant oils (PLS)
PLS (g/d)
***0.0180.220.200.180.07P:S
***0.0551.882.002.022.27n-6:n-3
NS0.2721.61.51.81.922:6n-3
*1.72020242322:5n-3
*1.11614151320:5n-3
***13.11391181022918:3n-3
***23.430527925512018:2n-6
NS737.04895488049764685Total
Sig.s.e.d.1000800400ControlFatty acids
(mg/100 g tissue) (Scollan et al. 2004)
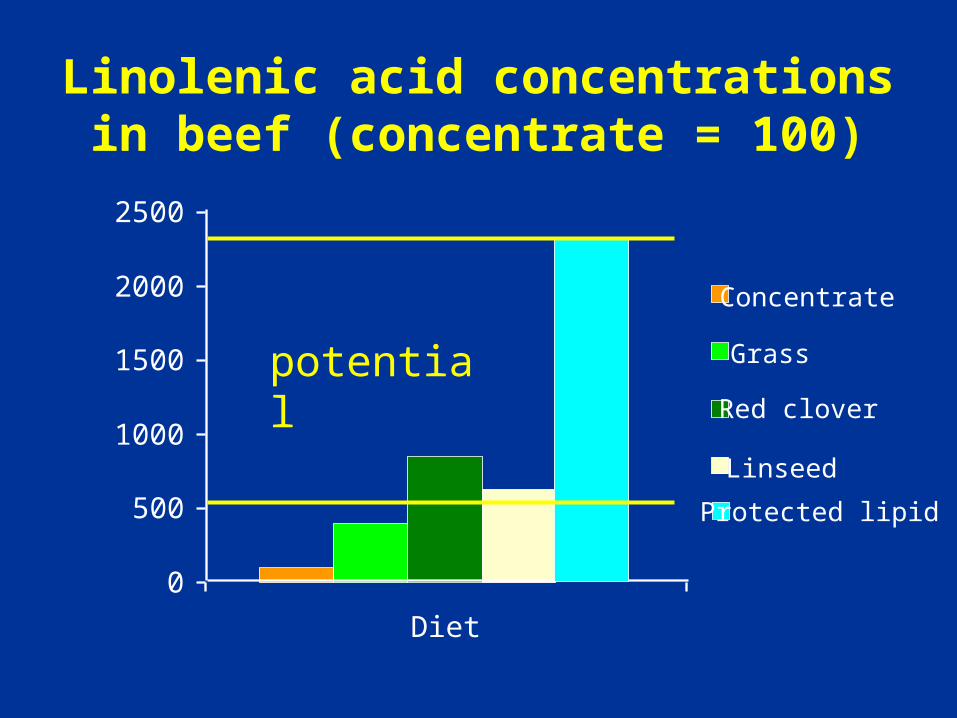
Linolenic acid concentrations in beef (concentrate = 100)
Red clover
0
500
1000
1500
2000
2500
Diet
Concentrate
Grass
Linseed
Protected lipid
potential

Conjugated linoleic acid
cis-9, trans 11 CLA

Relationships between CLA and total lipid and 18:1trans
0
10
20
30
40
50
0 100 200 300
Trans 18:1 (mg/100 g muscle)
CLA
(m
g/10
0 g
mus
cle)
0
10
20
30
40
50
0 5000 10000
Total lipid (mg/100 g muscle)
CLA
(m
g/10
0 g
mus
cle)

linoleic acidcis-9 cis-12 C18:2
CLAcis-9 trans-11 C18:2
Vaccenic acidtrans-11 C18:1
Stearic acid
C18:0
linoleic acidcis-9 cis-12 C18:2
CLAcis-9 trans-11 C18:2
Vaccenic acidtrans-11 C18:1
Stearic acid
C18:0
Oleic acidcis-9 C18:1
RUMEN TISSUES
Ruminal versus tissue synthesis of CLA

CLA isomers in longissimus muscle (mg/100 g fresh muscle)
1.6 1.4CLA trans-7, cis-9
0.4 0.4CLA trans-8, cis-14
14.411.7CLA cis-9, trans-11
0.4 0.2CLA trans-10, cis-12
2.9 0.2CLA trans-11, cis-13
0.3 0.1CLA cis-12, trans-14
0.2 0.06CLA trans-7, trans-9
0.1 0.07CLA trans-8, trans-10
0.4 0.2CLA trans-9, trans-11
0.2 0.1CLA trans-10, trans-12
0.8 0.1CLA trans-11, trans-13
0.5 0.07CLA trans-12, trans-14
PastureConcentrate
14.411.7CLA cis-9, trans-11

CLA concentrations in beef (grass silage = 100)
50
100
150
200
250
300
350
Grasssilage
Grass GS +SO
GS +SO +FO
Grass +SO
Grass +SO +FO
GS= Grass SilageSO = Sunflower OilFO = Fish Oil

CLA cis-9, trans-11 (mg/100 g fresh muscle) in longissimus muscle
Breed Diet CLA ReferencesWagyu, steers Sunflower oil 134 Mir et al. (2002)
Wagyu x Limousin, steers Sunflower oil 76 Mir et al. (2004)
Limousin, steers Sunflower oil 59 Mir et al. (2004)
Charolais, steers Grass silage whole linseed
36 Enser et al. (1999)
Crossbred steers Grass silage 35 Steen and Porter (2003)
German Holstein, bulls Pasture 17 Dannenberger et al. (2005)
German Simmental, bulls Pasture 12 Dannenberger et al. (2005)
Double-muscled Belgian Blue, bulls
Crushed linseed 4.3 Raes et al. (2004)
Trans fatty acids

Distribution of trans 18:1 isomers in ruminant fat and industrially hydrogenated
vegetable oil
0.2 0.2
14.717.3
21.7 20.3
14 13.6
3 2.3
0
5
10
15
20
25
4 5 6-8 9 10 11 12 13/14 15 16
(%)
0.28 0.24 1.03 3.02 3.8
49.4
10.217.6
6.9 7.5
0102030405060
4 5 6-8 9 10 11 12 13/14 15 16
(%)
Double bond position (18:1 trans)
Pasture (Beef muscle)
Hydrogenated oil
Stender and Dyerberg (2003)
Dannenberger et al. (2004)

Effects on colour shelf life, physical and sensory attributes
Red clover
PUFA
Lipid stability
Colour shelf life, physical and
sensory
Antioxidants
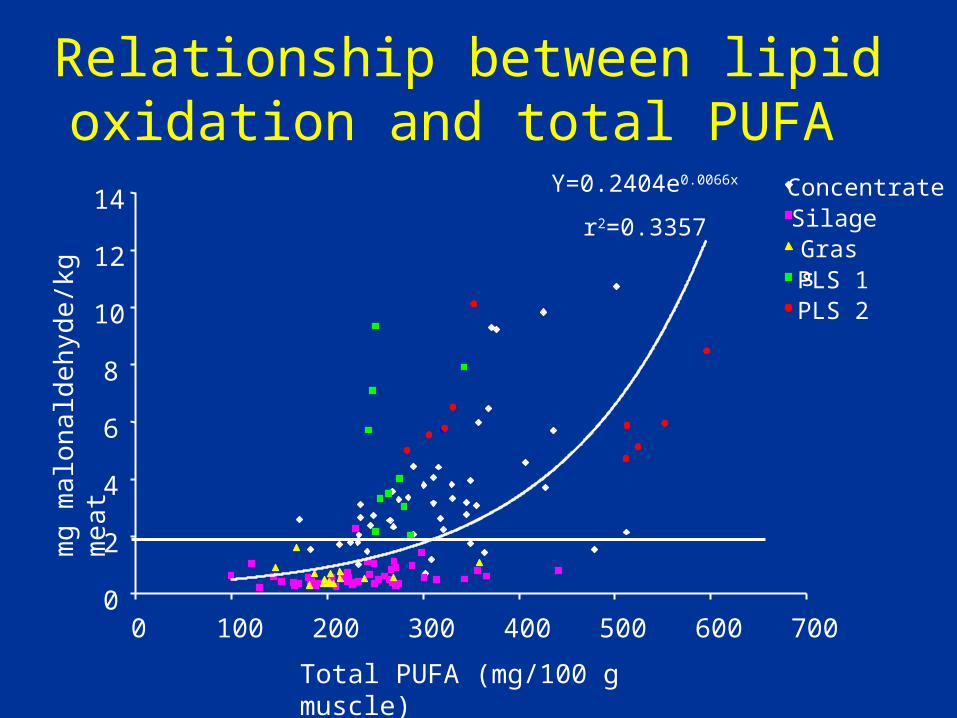
Relationship between lipid oxidation and total PUFA
0
2
4
6
8
10
12
14
0 100 200 300 400 500 600 700
ConcentrateSilageGrassPLS 1PLS 2
Total PUFA (mg/100 g muscle)
mg
ma
lon
ald
ehy
de/
kg m
eat
Y=0.2404e0.0066x
r2=0.3357

Forage v. concentrate on vitamin E and TBARS
0.0
1.5
3.0
4.5
Vitamin E TBARS
GrassSilageConcentrates
Vita
min
E a
nd T
BA
RS
(mg
/Kg
mea
t)
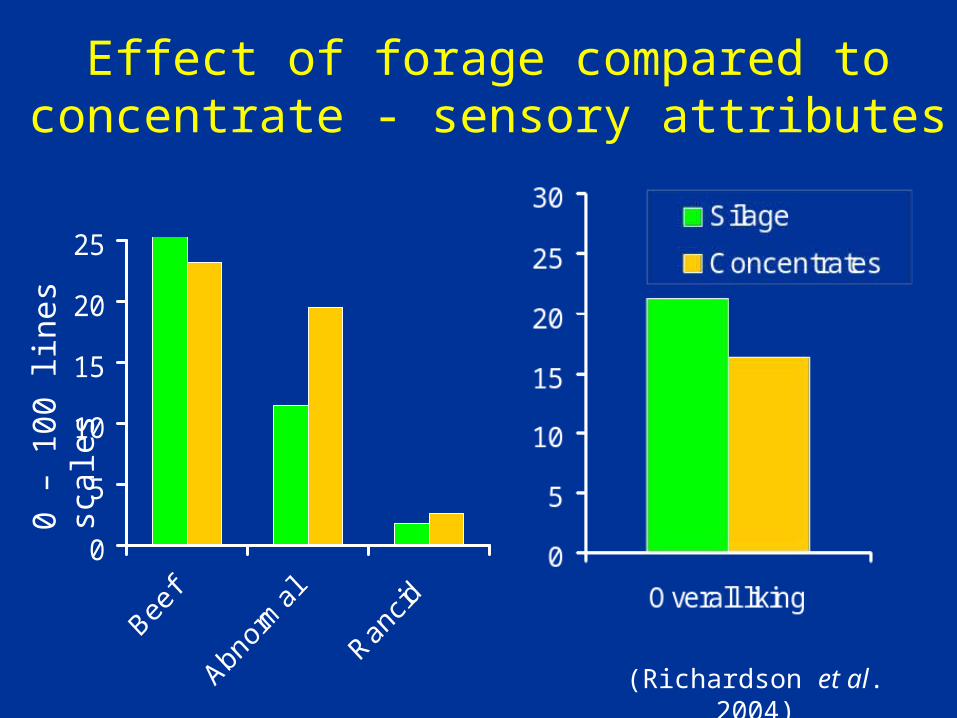
Effect of forage compared to concentrate - sensory attributes
0
5
10
15
20
25
0 –
100
lines
sca
les
(Richardson et al. 2004)
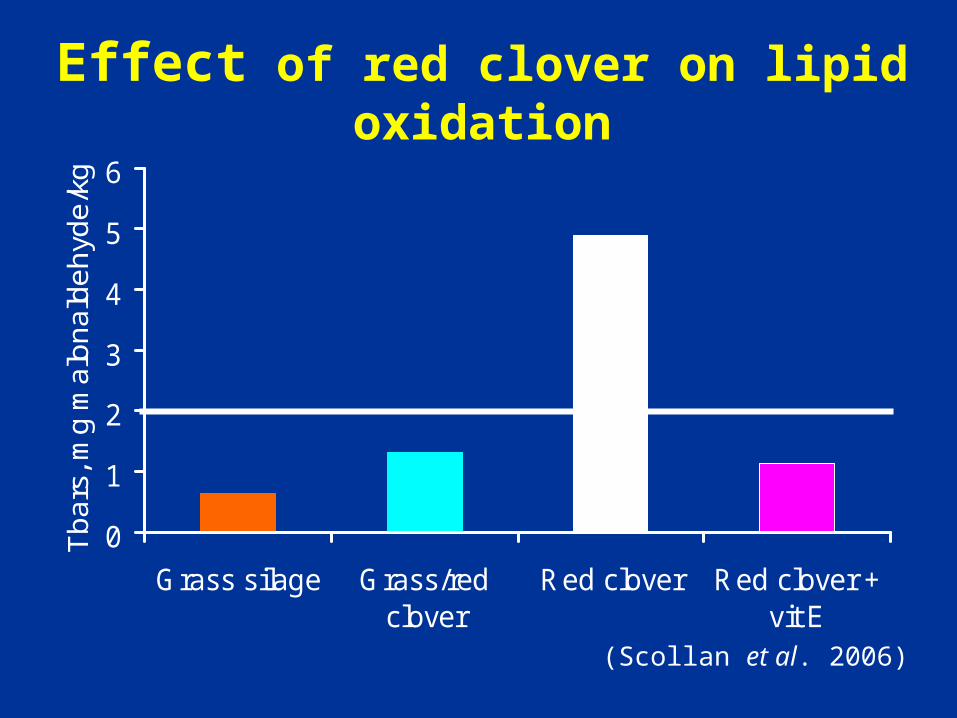
Effect of red clover on lipid oxidation
0
1
2
3
4
5
6
Grass silage Grass/redclover
Red clover Red clover +vit E
Tb
ars
, mg
ma
lon
ald
eh
yde
/kg
(Scollan et al. 2006)

Colour saturation
10
15
20
25
30
1 2 3 4 5 6 7 8 9 10 11
days displayed
colo
ur s
atur
atio
ngrass grass/red red clover red clover/vit. E
(Scollan et al. 2006)

Vitamin E
0
1
2
3
4
Vitamin E
mg
/kg
me
at
P = 0.001
grass grass/red red clover red clover/vit. E
(Scollan et al. 2006)
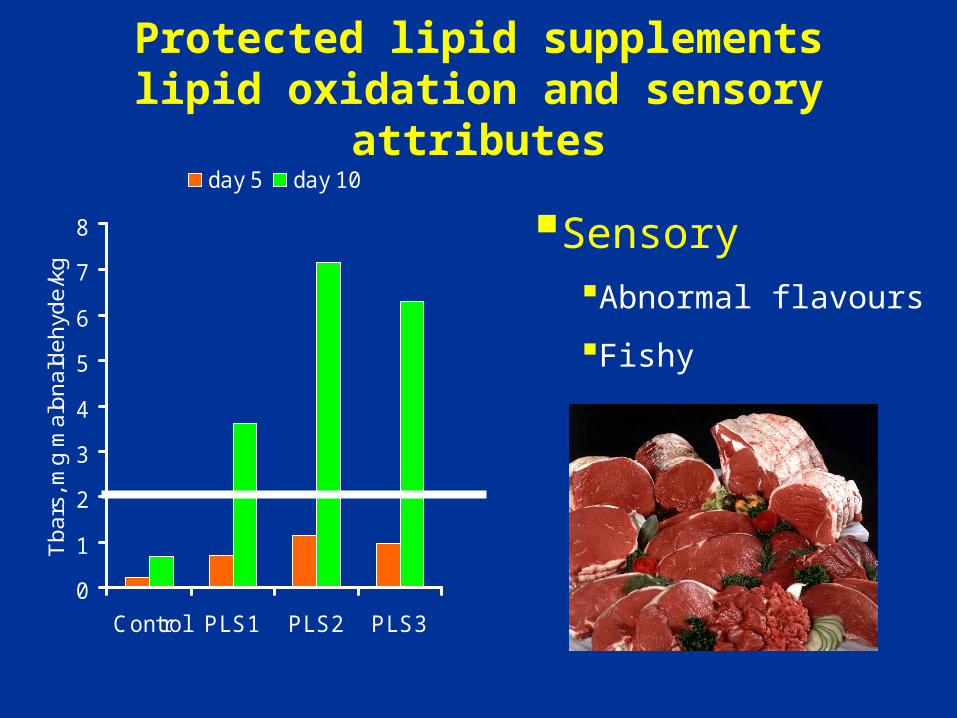
Protected lipid supplementslipid oxidation and sensory attributes
0
1
2
3
4
5
6
7
8
Control PLS1 PLS2 PLS3
Tb
ars
, mg
ma
lon
ald
eh
yde
/kg
day 5 day 10
SensoryAbnormal flavours
Fishy

Conclusions
Consumers – nutritional quality and product quality
Beef is an important source of n-3 PUFA and CLA
Green plants are primary source of n-3 PUFA in food chain (and antioxidants)
Delivering health with neutral or positive impact on taste