innovation, technology and criteria for green shipping - … · innovation, technology and criteria...
TRANSCRIPT
Innovation, Technology and Criteria for Green Shipping
Bo Cerup-Simonsen
Vice President, Ph.D.
Maersk Maritime Technology

2
A.P. Moller Maersk A/S
The A.P. Moller - Maersk Group is a diversified conglomerate, founded in 1904 by Mr A.P. Møller
116,000 employees and operations in more than 130 countries
Business segments:
Container shipping, LogisticsTankers, supply, standby RoRo, tugs etc.Shipyards TerminalsOil and gas activitiesRetail activitiesOther companies
The total CO2 emissions of the A.P. Moller – Maersk Group in 2008 were around 48 million tonnes CO2 equivalent, a decrease of over 5 million tonnes CO2 equivalent compared to 2007.
Commercial Operations
Ship owner
Technical management
3
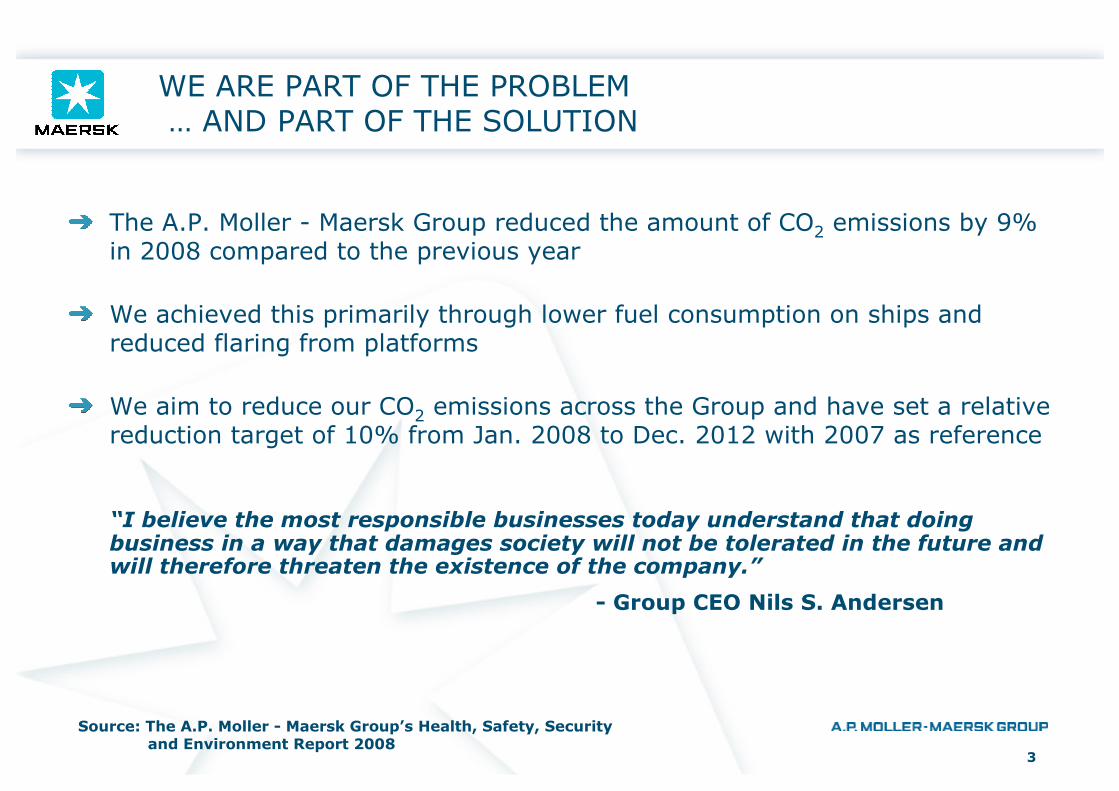
WE ARE PART OF THE PROBLEM … AND PART OF THE SOLUTION
The A.P. Moller - Maersk Group reduced the amount of CO2 emissions by 9% in 2008 compared to the previous year
We achieved this primarily through lower fuel consumption on ships and reduced flaring from platforms
We aim to reduce our CO2 emissions across the Group and have set a relative reduction target of 10% from Jan. 2008 to Dec. 2012 with 2007 as reference
“I believe the most responsible businesses today understand that doing business in a way that damages society will not be tolerated in the future and will therefore threaten the existence of the company.”
- Group CEO Nils S. Andersen
Source: The A.P. Moller - Maersk Group’s Health, Safety, Security and Environment Report 2008

4
Sustainable environmental solutions – sustainable business -sustainable competitiveness
Green Ship Competitiveness
Standard Ship
2010 2030
New design, Delivered in 10yrs
Increase competitive edge in a decade where:
Customer demands to environmental friendliness will increase
Environmental regulations will tighten (scope, limits, ’Grandfathering’)
Energy cost will increase (?)
New technologies will come into play
Employees will expect environmental behaviour
Etc.
Decade of change

5
Environmental Management on Group Level and Business Unit level.
Monitor, document, set targets, improve

6
Public AP Moller Maersk HSSE report

7
Eco-ComplianceEcoEco--ComplianceCompliance
� The Group strives to
comply with all evolvingregulatory and key
customers' requirements -these are very likely to be more stringent by 2020
than today (e.g. IMO requiring to switch to lower
sulfur fuel standard)
� BUs strive to monitor
peers' best practices and implement select proven
initiatives relevant to their operations
Eco-EfficiencyEcoEco--EfficiencyEfficiency
� The Group aspires to go
beyond compliance in order to get competitive advantage
through
– a systematic approach to identify potentials for more
efficient use of resources, lower emissions and
optimize cost
– proactive mitigation of environmental risk
� BUs anticipate regulatory changes as well as customers' and competitors' moves
Strategic Level of Environmental Performance for theA.P. Moller Maersk Group
Eco-ResistantEcoEco--ResistantResistant
� Focus on business
strategy only
� Actively seeking arbitrage opportunities
within regulations (e.g. flag registration in
countries with less stringent regulations)
� Significant investment in
lobbying activities to slow or tone down
regulatory changes
Eco-AdvantageEcoEco--AdvantageAdvantage
� The Group aspires to go
beyond Eco-Efficiency in order to create value through cutting-
edge environmental initiatives and leadership
– Build value proposition,
customer loyalty and APMM
corporate brand based on green
attributes
– Actively looking for new eco-
business opportunities
– Fostering the business culture to
grow these opportunities
� The Group aspires to be recognized as a leader in the
green space and to shaperegulatory standards
� BUs strive to reduce the
environmental footprint along their value chain downstream and upstream, helping
customers and suppliers to meet environmental goals
Higher / ProactiveLevel of 'Environmental Leadership'Lower / Reactive
3 41 2
8
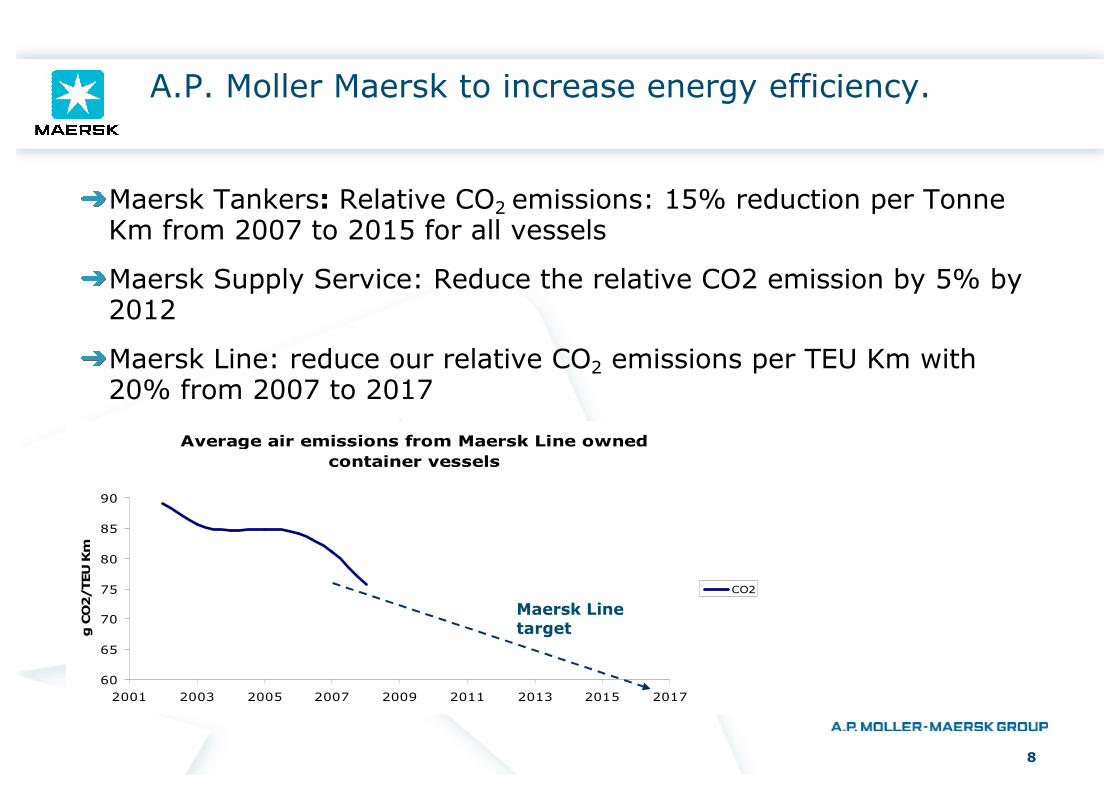
A.P. Moller Maersk to increase energy efficiency.
Maersk Tankers: Relative CO2 emissions: 15% reduction per TonneKm from 2007 to 2015 for all vessels
Maersk Supply Service: Reduce the relative CO2 emission by 5% by 2012
Maersk Line: reduce our relative CO2 emissions per TEU Km with 20% from 2007 to 2017
Average air emissions from Maersk Line owned
container vessels
60
65
70
75
80
85
90
2001 2003 2005 2007 2009 2011 2013 2015 2017
g CO2/TEU Km
CO2
Maersk Line target

9
1
Damco aims to be eco-efficient
Eco-ambition
Strategic pillars
Reduction targets
Green Logistics
� Damco’s ambition is to achieve ECO-EFFICIENCY
� Environmental performance (carbon footprint)� Responsible procurement� Sustainable products and collaboration� Green Logistics
� 30% reduction on a tonne CO2e/TEU basis by 2014*
� Mapping customer’s supply chain carbon footprint� SupplyChainCarbonCheckTM, SupplyChainCarbonDashboard� Since 2007, 50+ projects including Wal-mart and Nike� Methodology validated by MIT
Damco’s main environmental impact is related to our customers’supply chain emissions, thus the main focus is in Green Logistics
* Baseline 2008

10
How to Reduce Energy Consumption and CO2 Footprint
Wide and Deep Developments:
Effectiveness: Logistics and networks; optimize networks, capacity and speed.
Efficiency: Optimized operation of vessels (e.g. performance monitoring, economical speed, etc)
Competence and awareness
Technologies: Components and systems
Contracts and collaboration: Newbuilding contracts, charter parties, innovation with suppliers etc

11
Who takes care of the TOTALITY, Greening of Supply Chains? Structural Changes for Overall Optimum.
Can consumer drive major changes?
Structural changes: For instance Carbon War Room
Benchmarking: For instance BSR: Clean Cargo Working Group
CCWG average: 90
75.6

12
DAMCO Service: Supply Chain Carbon CheckOptimize logistics for carbon (and cost)
Scope of our CO2 calculations
Factory Truck/Rail/ Barge
CFS Facilities
Load Port
Truck Ocean/Air/ Truck
Load Port
Truck DECON/DC
Truck Point of sale
Scope of our CO2 calculations
The project scope can cover the supply chain from factory gate to store door

13
5
Case studies: Greener is Cheaper
Greener is usually cheaperSC Efficiency = Lower CO2 = Lower Costs
Good for the environment means good for business!

14
Efficiency: Fleet monitoring for continuous improvements of design and operations.
• Performance Monitoring of 300+ vessels
• System based on 40 years of experience
• A decision support service:― Paint type evaluation― Dry-docking intervals― Hull cleaning intervals, hull efficiency
― Propeller polishing intervals ― Evaluation of treatment from dry-dockings, hull cleanings, propeller polishing
― Main & Aux Engine efficiency― Power and fuel consumption as function of speed, draught AND time
― And more…
MonitoringA
naly
sis
Decision
SupportDecision
Action

1513 November 2009PAGE 15
Slow Steaming: Extensive in-house investigations have opened for new industry standard on super slow steaming. BIG savings.
Container vessels have the most economical speed at ~50% speed, which is at ~10% engine load.
To obtain full flexibility of such vessels on any schedule, the vessels must be able to operate from 10% engine load to full load without any restrictions.
Extensive analysis and documentation by APMM has now widened the operational window, resulting in major savings.

16
Slow steaming for tankers: Virtual Arrival – The Reality
BP employing Bro Elizabeth from Maersk Tankers
Vessel sailed on 2nd September 2009. WNI to do the virtual arrival analysis .
Bunker Savings
58.83 mts of HFO Saved 24,800 USD split 50/50 between owner and charterer so 12,400 each
Virtual arrival demurrage 18,000 USD

17
E-class ship EEOI
0,0
5,0
10,0
15,0
20,0
25,0
30,0
35,0
40,0
45,0
1 6 11 16 21 26 31 36 41 46 51
Voyage #
g/t
on
*mil
eIMO Operational Index; Who is measured on theEEOI – who can influence?

18
Index ~ Installed power / (speed * load carrying capacity) [g CO2/ton km]Indices calculated for APMM own fleet
Energy Efficiency Design Index - Container vessels
0
5
10
15
20
25
30
0 20000 40000 60000 80000 100000 120000 140000 160000
DWT (tonnes)
Eff. index (g CO2/ton*nm)
CO2 index= 3.16*((190*,75*MCR)+(210*(,025*MCR+250)+((PTI-WHR)*210))/(DWT*speed)
IMO Energy Efficiency Design IndexPotential to become an industry standard for benchmarking
C
B
A
19
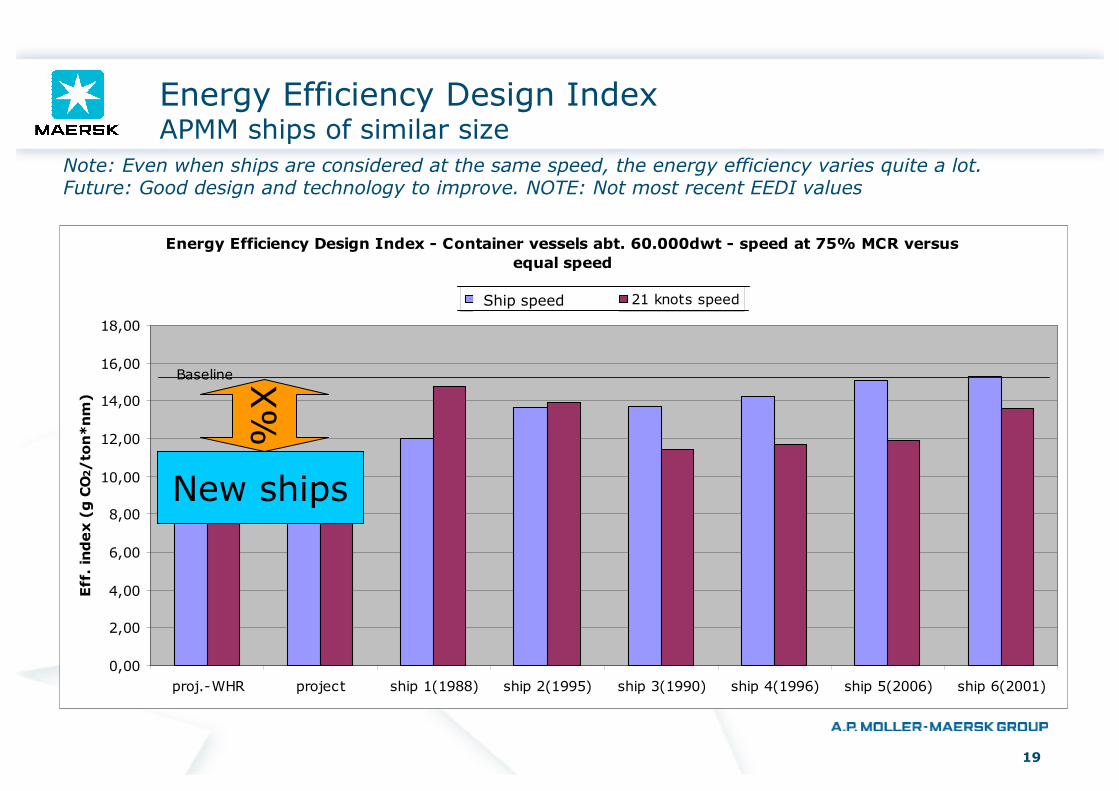
Energy Efficiency Design Index APMM ships of similar size
Energy Efficiency Design Index - Container vessels abt. 60.000dwt - speed at 75% MCR versus
equal speed
0,00
2,00
4,00
6,00
8,00
10,00
12,00
14,00
16,00
18,00
proj.-WHR project ship 1(1988) ship 2(1995) ship 3(1990) ship 4(1996) ship 5(2006) ship 6(2001)
Eff. index (g CO2/ton*nm)
Speed at 75% MCR 21 knots speed
Baseline
Ship speed
X%
New ships
Note: Even when ships are considered at the same speed, the energy efficiency varies quite a lot. Future: Good design and technology to improve. NOTE: Not most recent EEDI values

20
Innovation and Technology Application Ship as a system for environmental performance
Propulsionaux machinery
Aft hull, rudder, propeller
Bow, Bulb
Antifouling, Drag reduction
Emission cleaning
Container cooling
Cargo/portOperations
Operations decisionsupport

21
Example: CLT Propeller Project
CLT propulsion principle
– Endplates fitted with minimum resistance
– Modified pressure distribution on suction & downstream sides
– Radial load distribution moved closer to propeller tips
Advantages (expected):
– Higher efficiency (5-8% fuel savings expected)
– Lower vibration & noise levels
– Improved maneuverability
Main objective:
– To confirm performance in full scale on Roy Maersk
– To fit CLT propeller on VLCC newbuilding if performance on Roy is satisfactory
Status:
– Propeller fitted to Roy Maersk late Oct 09.
– First results are promising: lower vibrations and low pressure pulses detected. Efficiency looks promising but more time is needed to conclude.

22
Eco-efficient Ship Design: Consider ’all’ available technologies.Max benefit for business and environment
Extra ship cost of extra fuelefficiency
Notional example
0
5
10
15
20
25
30
0 2 4 6 8 10 12 14 16 18 20
% Reduction in fuel consumption and CO2 emissions
Cost/Benefit (PBP, years)
Ex: Hull shape
Ex: Derated ME
Ex: Waste heat r.
A ’standard’ ship A ’green’ ship
Ex: ContrarotatingPropeller

23
Eco-efficient ship design: Choose level of fuel efficiency with max Business Value within limits of investment, IRR, ROI.
-60
-40
-20
0
20
40
60
80
0 2 4 6 8 10 12 14 16 18 20
% Reduction in fuel consumption and CO2 emissions
Net Present Value
Eco-efficientShip Design
Notional example
Net Present Value(M$)
’Standard’ ship ’Green’ ship

24
From standard ’off-the-shelf’ product to environmental excellence.Optimize fuel efficiency for actual operation.
Typicaldesign point
Design for operation:8% saving
25
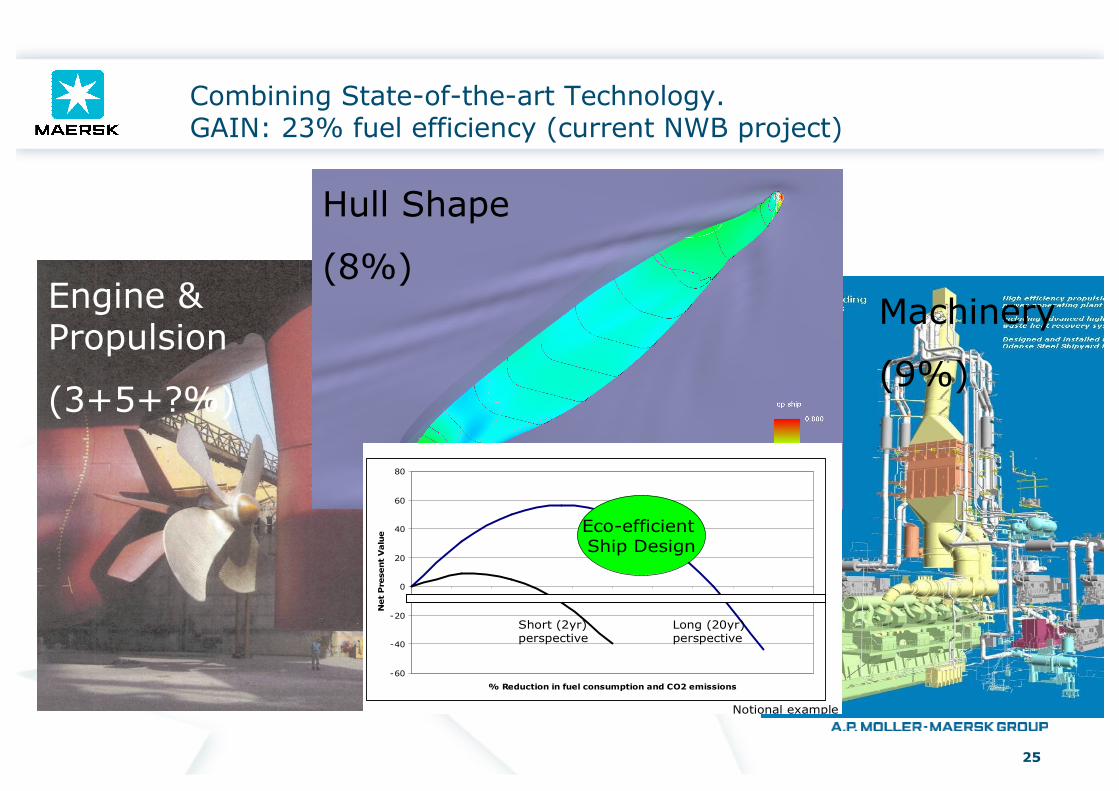
Combining State-of-the-art Technology. GAIN: 23% fuel efficiency (current NWB project)
Engine & Propulsion
(3+5+?%)
Machinery
(9%)
Hull Shape
(8%)
Extra ship costof extra fuelefficiency
Notional example
0
5
10
15
20
25
30
0 2 4 6 8 10 12 14 16 18 20
% Reduction in fuel consumption and CO2 emissions
Cost/Benefit (PBP, years)
Ex: Antifouling paint
Ex: Cooling pumps
Ex: Waste heat r.
-60
-40
-20
0
20
40
60
80
0 2 4 6 8 10 12 14 16 18 20
% Reduction in fuel consumption and CO2 emissions
Net Present Value
Short (2yr) perspective
Long (20yr) perspective
Eco-efficientShip Design
Notional example

26
Energy Efficiency Design Index - Container vessels
0
5
10
15
20
25
30
0 20000 40000 60000 80000 100000 120000 140000 160000
DWT (tonnes)
Eff. index (g CO2/ton*nm)
CO2 index= 3.16*((190*,75*MCR)+(210*(,025*MCR+250)+((PTI-WHR)*210))/(DWT*speed)
… to get environmental performance and an energy-efficient ship prepared for the future
Business and Enviroment Hand-in-Hand. Improvements of 16 ships at DSME:
•Save 180,000 tons of fuel per year
•Save 550,000 tons of CO2 per year
•Save 50.000.000 USD per year

27
Copenhagen
Cairo
Rio
Singapore
STX 1407 Series VLCC Project
kW x 76 rpm29,340MCR (De-rated)
STX MAN 6S90ME-C8
mt320,000Deadweight
m22.60Draft
m30.50Depth
m60.00Breadth
m332.00Length

28
VLCC: CO2 Reductions of 10+%: Waste Heat Recovery, Propulsion Train, Aux Systems.
0,00%
2,00%
4,00%
6,00%
8,00%
10,00%
12,00%
14,00%
16,00%
18,00%
20,00%
10% 15% 20% 25% 30% 35% 40% 45% 50% 55% 60% 65% 70% 75% 80% 85% 90% 95% 100%
Engine power [% MCR]
Operation time [%]
0
20
40
60
80
100
120
140
160
Operating profile
FOC per day
standard vessel
FOC with WHR +Electronic engine

29
CO2 Regulation for Shipping
If it is assumed that shipping will be required to reduce the total CO2 emissions to a Target CO2emission by Rtarget% over a certain time, then how to regulate?
We know that shipping can reduce CO2 emissions cost-effectively by improvement of hardware and operations (better technology, slow steaming etc)
At some level of reduction - varying from ship to ship - it will be more cost-effective to reduce CO2 in other industries, and so a mechanism should allow for that.
Global Shipping:

30
Goal Based Regulation for CO2
-40000000
-20000000
0
20000000
40000000
60000000
80000000
-20 0 20 40 60 80 100
Percentage CO2 reduction
Cost for owner
Onlycon
tribution(”tax”)
Only technical
Technical & contribution
Notional Example.
20% 40%
AnnualCostfor Owner
Saving by own
reduction
of
CO2
Let owner choose combination of technical means and contribution fund to reach CO2 reduction target.

31
Summary and Conclusions
A.P. Moller - Maersk has environmental strategy of eco-efficiency/advantage and the ambition to be environmental leaders in shipping, with a number of ongoing activities to reduce environmental impact.
Competitive business is (still) key for sustainable environmental impact.
Environment affects costs side:
Cost-effective compliance
Risk of non-compliance (varying local regulations etc)
Energy efficiency (ref 23% saving example)
Environment should affect income side: Benchmarking, differentiation, market preference, green supply chains
Innovation of technology and business models is key to meet ambition level.
Tighter regulations are OK if: International (equal for all), Performance based, Practical, Achievable.
CO2 Regulation: Goal based with strong incentive for innovation in shipping.