innovation: something more than r&d latin american
TRANSCRIPT

1
INNOVATION: SOMETHING MORE THAN R&D Latin American evidence from
innovation surveys: building competitive business strategies
Guillermo Anlló (CEPAL) Diana Suárez (Centro Redes)
Introduction With the displacement of the hegemony of the fordist production
model1 , and the appearance of successful development cases based on more flexible and profitable production schemes in the decade of the eighties (basically those modifications within the framework of “toyotism”), some of the theoretical developments that were unfolding on the edges of the economy gained space in order to explain the complexity implied by the generation and use of knowledge as a support for competitiveness, giving way to the emergence of innovation as an analytical category.
While there was progress in this sense, even today it is not very clear how to empirically establish a pro-innovative environment or system through public policies –generally confusing the scientific policies, from the side of supply, or the industrial policies from the side of demand, as similes of innovation policies-. In this sense, the indicators play a crucial role, for which not only their periodic estimate and recollection becomes important
* CEPAL ** Centro REDES 1 The term fordism refers to the mass production method that Henry Ford, automobile manufacturer from the United States, put into practice. This system which was created between the decade of the 1930s and the beginning of the 1970s, assumes a combination of assembly chains, specialized machinery, high wages and an elevated number of workers in teams. This mode of production is profitable as long as the product can be sold at a low price in a developed economy. Fordism promotes specialization, the transformation of the industrial scheme and the reduction of costs through a market expansion strategy, because if there is a greater volume of units (due to the assembly technology) at a reduced cost (due to time/execution) there will be a surplus that will numerically exceed the elite, traditional and exclusive consumer of modern technologies. The idea to add mass production to the production of merchandise not only signified the cultural social transformations that we can summarize in the idea of popular culture. Mass production and, inter-class expansion in consumption which results in new stimuli and cultural codes mediated by capital. The model matures under the economic scheme of Keynesianism (which leads to the Welfare State) which promotes a historic leading role of the subordinate classes and the binding of capital to social and class considerations. The fordist combination of mass production and mass consumption allowed the western economies to reach very high growth rates during the great expansion period that begins with the end of World War ll. However, the modifications made in production systems since the end of the seventies deeply altered the production standard, and also affected the consumption and distribution standards. Throughout the crisis resulting from these modifications –along with other factors- the western economies have generated various responses, both in the orbit of the administration of production, as well as in that of the consumption and distribution models. The responses, which have been as different as they have been varied, have been the sequels of the crisis in different sectors, the institutional framework or, even, the idiosyncrasy of each country. One of these responses in the administration of production is known as “toyotism”, due to its origin in the well-known Japanese company, or also as flexible or adjusted production, which thanks to its effectiveness, versatility, empowerment and flexibility supposes a radical modification with regard to the productive standards (seriated, rigid and centralized) which had been typical of fordism. In comparison to the fordist type in mass production systems, the production system of Toyota is an extraction method the fundamental objective of which is to technically increase productive efficiency radically eliminating both losses as well as excess. In order to achieve these objectives, the system is supported by two basic pillars: the “Just-in-time” system and empowerment, or “automation with a human touch” in the words of OHMO, mentor of the main productive measures which ended up shaping toyotism. The purpose that is followed with the implementation of this system is the approximation to zero stock, considering this from the point of view of industrial administration as an ideal situation, which permits the elimination of the costs derived from the storage and conservation of stock. For additional information see The Productive Models by Robert Boyer y Michel Freyssenet (2001).

2
but also the interpretation that is made of them, with awareness of their limitations.
The simplest analysis of the data confirms the obvious: the existence of a developed world and another one of lower relative development. At different levels of analysis, the longings for international comparability have been detrimental to the need to establish frameworks of analysis adequate for national and regional needs. Although comparability is a necessary condition for establishing relative positions and to learn from similar experiences, the tendency to try to reproduce “good practices” observed in other countries can sidestep the importance of the identification of virtuous behaviors on a local level.
It is in this context in which the present document is framed. The consensus regarding the importance of science, technology and innovation has led to the dissemination of innovation surveys and, with them, to the emergence of new questions regarding how to advance towards a path of sustainable development. The capacity of the indicators to shed light on the possible answers will depend on the joint capacity of academics, generators of statistics and policy makers. It is stated here that the correct creation and interpretation of the indicators depends on the differentiation between causes and consequences and that every policy that is intended to operate on the agents to improve the results will depend on the ability to put them into context and combine them with other sources of information.
For that reason, the present document is structured in three parts. After this brief introduction, the first section reviews the literature of technological change in order to establish the theoretical bases that should guide the construction of innovation indicators. It also analyzes the literature associated with the theory of the firm to the extent to which it is the central agent in the search for technological and organizational improvements. The second section presents an analysis of the science, technology and innovation (STI) indicators and the results of the innovation surveys, with the double objective of attracting generalities and specificities and of discussing the possibility of using the innovation surveys as an instrument for the identification of local “good practices”. Finally, the third section presents the conclusions.
I – Innovation: history of a concept In order to have a better understanding of the innovation
phenomenon, it is necessary to go back to its evolution over time, and review the transition that took place from the notion of the isolated innovative entrepreneur to the global network model in the knowledge society, passing through the linear model and the national innovation system.
I-I- Innovation: How knowledge became the strategic productive factor
From a theoretical perspective, the fact of conceiving knowledge as an essential element in the development process entailed a question regarding the institutional space and the form in which this factor of

3
production is generated. The initial progress made by Schumpeter (1978) linked, from a dynamic vision, the phenomenon of economic cycles with the appearance of a group of radical innovations, at the same time associated with the conduct of the innovative businessman (entrepreneur). In this manner, in a Schumpeterian vision, the notion of innovation was strongly linked to the idea of the entrepreneur, the one who transforms ideas into inventions and inventions into profitable and sellable products, establishing boundaries between inventions (a mere new idea) and innovations (the successful commercial introduction of this idea). At that time, the notion of innovation revolved around the brilliant innovators who made production and technology into a single concept, understanding that the key to success went through the differentiation of product and/or process (which would guarantee them extraordinary profits of technological variety), for which they had to innovate.2 Schumpeter, for his part, accurately established that the economic impact is only verified when innovations become massive.
Later, the consolidation of major companies (mainly industrial) resulted, in some cases, in the establishment of formalized activities within the organizational structure, specifically dedicated to R&D, on the understanding that this is the basis of innovation.3 There were various reasons that forced this behavior: the complexity of the developments with the consequent increase in the minimum economic scale to undertake R&D projects of a certain importance, the perception that innovation was an activity that could, within certain limits, be standardized and organized –like the production of goods and services-, the economic return originating from the results of the investigation, the inherent risk of these activities and its reduction to the extent to which they are carried out in the framework of a minimal organization and stability, etc. In this way, the firm4 was located as an important space in which this production factor is generated, without this supposing complete hegemony with regard to individual innovators. In that direction forms of organization were established, to try to increase the efficiency of these activities (R&D departments, specific routines and functioning, etc.).
For its part, the theoretical formalization of the appearance of the R&D units/departments was carried out through linear models (currently under review), in which the management of R&D or a public/university laboratory developed the new product and/or process and then “transferred it” to production (Rossegger, 1987). In this way, the subsequent adoption of the technology would be carried out with a high degree of automatism. In the case of the company, it was presumed that the product generated by the R&D department would be adopted, without significant problems, by
2 With Thomas A. Edison as probably the best exponent of the “innovator”, who had multiple lawsuits for the patents of his inventions, which puts in doubt the originality and transparency of his investigations, but his commercial success elevates him to the position of the greatest innovator in living memory; he rapidly understood that a company produces goods and knowledge (which has pre-competitive value), which led him to install one of the first commercial R&D laboratories (where the incandescent lamp; telephone transmission; electricity distribution; the X ray machine; etc., were developed). 3 In this line, Schumpeter (1983) observed that with the emergence of the major companies, it was the institutionalization of R&D which assumed a leading role within the innovative dynamic, even obscuring the figure of the entrepreneur. This theoretical difference led to the distinction among the two Schumpeters: the Mark I and the Mark II (Freeman, 1982) (although, in both cases, innovation continues to be the center of the dynamic of capitalist competition). 4 For the purposes of this text, firm and company will be used as synonyms.

4
production (in the framework of a certain verticality of the organization), while in the case of public institutions, it was assumed that the results of the investigations could later be transferred to the users through the same institution or other specialized ones (technological institutes). In the meantime, under this conception, the company, faced with the innovative phenomenon, functioned as a mere recipient/applier of knowledge generated in other spheres.
This focus required a particular conception of knowledge in which it is liable to being transformed into technology (of process and product) without major difficulties, and that this, at the same time, is susceptible to being treated as a defined good and liable to be fully transferred at certain stages. Under this vision, little or no emphasis was given to the commercialization, the organization and/or full management of the company in the matter of innovation. Furthermore, the generated knowledge that did not adopt a transferable format (for example, problem-solving capabilities) was not considered to be a result of the activity nor valued and/or encouraged. This was the basis of the denominated “linear innovation model”, a sort of fordist replica applied to the production of technology (specialization and watertight compartments subject to certain operational routines). If we add to this an understanding of technology such as the systemization of knowledge incorporated in procedures and/or routines applied by companies to obtain productivity earnings, the increase of their capital stock, the expansion of the production mix, or to reduce risk, the origin of the policy recommendations that emerged (and continue to emerge) from the linear model can be understood. It is in that vision –where technology is seen as the instrumentation of knowledge-, that the understanding of the phenomenon and recommendation of policies circumscribes the generation of a sufficiently broad store of knowledge, at one of the extremes of the line, in order to be able to provide the formation and development of technologies which will lead to earnings in productivity and, therefore, of competitiveness, at the other extreme. If everything is associated, additionally, with the “fordist” type productive model, based on productivity earnings due to the exploitation of economies of scale, it can be understood that the model was consistent at a certain moment of recent history.
These problems were addressed in the statistics from two perspectives (precisely that of the extremes of the linear model): the effort carried out and/or the results obtained.5 However, this highly mechanistic scheme was not always validated by the final users.
The world economic crises, 6 plus the appearance of evidence of successful alternative production modes (those that did not incorporate knowledge in a linear manner) and the loss of competitiveness of the European countries, began to signal the limits of the fordist production model and that innovation –intrinsically difficult to quantify, since it is difficult to separate the activity from production and/or of the capacity of the individual or group- is not restricted to the creation of knowledge through R&D activities, but that it also includes the activities related to
5
This logic rapidly impregnated the public organizations, the greater part of which was dedicated –in an imprecise manner- to the activities of R&D, in one or various institutions, according to each specific experience. As well as in the previous cases, the indicators tended to attract more efforts (inputs) and results (outputs) than the processes. 6
Mainly the oil crisis of the beginning and end of the decade of the 70s, and the subsequent debt crisis.

5
implementation and commercialization, with a clear economic/commercial sense. Therefore, what acquire relevance are the mechanisms of adoption, absorption and adaptation of innovations, as fundamental processes at the time of designing policies, which at the same time provide feedback for the innovative conduct of the agent. These are the effects that will be generated by the adoption and dissemination of the innovations which will impact the growth and development of countries.
In an attempt to expand the conceptual framework to provide space for a larger number of concerns with few, nil or unsatisfactory answers, when the phenomenon was approached from the economic perspective systems theory began to be applied to the analysis of the technological phenomenon.7 Proof of this is the profuse literature that has emerged over the last few decades regarding systems theory for analysis of the innovation process (Freeman C., 1987; Nelson R., 1996; Lundvall, 1992; OECD, 1994). In this way the analytical framework that encompasses the problem changes and some questions are reformulated as an object of analysis. This is a concept that is closer to the groups of activities of companies –transcending to the activities of R&D (adding, for example, those of adaptation in the productive, organizational and commercial areas)-,8 and the surroundings in which the company develops –with the importance of how this conditions its decisions and strategies-. A central subject in this aspect refers to the forms of relationship, the incentives and the operational dynamics established between the different categories (research and development, science, basic and/or applied, technology, dissemination and absorption) which contribute to the innovation process. From this systemic vision it can be established that the innovation system is comprised of – as well as being provided feedback by-: i) the scientific subsystem; ii) the subsystem of education and formation; iii) the financial subsystem; and iv) the different phases of state intervention that impact the formation of innovative behavior (infrastructure; legislation – e.g.: patents -; education; intervention in market failures – economies of scale, asymmetric information, etc.-; and external markets -subsidies, taxes, barriers, exchange rate-) (Amable, Barre y Boyer; 1997).
The application of the system concept to innovation activities reformulates, in this manner, the object of analysis, expanding it with regard to the conventional views limited, generally, to organizations –public or private- of an individual nature.9 From this perspective, the analysis of a concrete national case can be carried out with greater amplitude incorporating the behavior and motivations of the agents, their relationships (formal and informal), current incentives and the relationship between the innovation system and the surroundings. 10 Since innovation is a
7 The application of this focus does not imply ignoring that the phenomenon may be individual (entrepreneur or company) but rather it proposes an analytical framework of greater amplitude in which additionally other aspects (including those of an extra-economic nature) can be inserted. Simply in this focus it is maintained that the technological phenomenon has a highly systemic connotation in its generation and dissemination. 8
In this sense, the object of analysis is broader than those carried out previously, which were for the purpose of studying the activities of R&D and were mainly centered in the complex of SandT. 9
Additionally, it is important to mention the qualification of “national” that normally accompanies these efforts, a fact which, in the framework of the configuration of economic blocks, reformulates the content of the concept. 10 In particular, with reference to Latin American countries, it is of interest to know a) what is, in the case of a society on the road to development, the system compatible with the start up of an economic model the center of which is the

6
phenomenon that is systemically conceived, in which many factors and subsystems intervene, it presents multifaceted complexity at the time of designing policies.
Passing from the conception of R&D to innovation implies passing from measuring results to observing processes; from analyzing the individual to studying the systems; from concentrating on the idea of science to thinking of innovation as an expanded phenomenon; from thinking of it as a linear process to having to understand it as a complex and systemic phenomenon; from the scientific policies –from the side of supply- (eventually) articulated with industrial policies –from the demand-, to innovation policies. This step makes necessary a complete rethink of the way of designing policies,11 from areas more related to the productive than the scientific, which, at the same time, establishes a demand for agile and dynamic public organisms and institutions.
However, it is important to clarify that while in the generic focus (visualized from the academic) of the innovation system there is a scheme of hierarchies, with a clear identification of agents and rules of behavior to achieve a predetermined objective, its real operation seems to indicate another perspective. Generally, the entrepreneur “develops” his own subsystem based on specific innovative problems and challenges, with less consideration of the hierarchies and more of the concrete relationships that it has access to (based on partial, segmented and not always technically objective information), with changing objectives validated by the market itself. All within a framework of asymmetries of information, limited rationality and, eventually, behaviors of a moral hazard type, guided by the logic that innovations are only a tool for the achievement of economic objectives. It is in this sense that the measurement of innovation and the construction of useful indicators must be forcefully directed towards questioning the firm, seeking to decipher what strategy they are deploying. For this purpose it is convenient to rapidly review the theory of the firm in relation to innovation.
I-II – The Company and innovative strategies
The OSLO Manual, obligatory reference at the time of agreeing on a definition of innovation on an international level, in its most recent revision establishes that it is “(...) the implementation of a new or significantly improved product (good or service), or process, or a new marketing method, or a new organizational method in business practice, the organization inside the workplace or the external relationships” (OECD, 2005), all of them phenomena that are present inside a firm –analysis unit in the innovation surveys.
The literature regarding the firm, within economic theory, is extensive and varied. The most simple and extended vision within the main current of economic thinking sees the firm as an actor within the market, which is in charge of applying the production factors to inputs with the objective of private sector, also regulated by international commerce; b) the process of institutional re-adaptation to society’s new functioning and accumulation model. 11
Coordinated and joint measures, rather than isolated and static ones which address specific problems.

7
producing goods and services. Other visions in the current of transaction costs, which render the analysis a little more complex, observe that the firm emerges as an alternative coordination mechanism to the market, in which the established relationships are of a more hierarchical nature. Finally, the evolutionist type focuses liken it to a kind of biological entity – metaphorically- where the “fauna” is characterized as being heterogeneous and possessing various competencies, beliefs and expectations, as well as different degrees of access and capacity of processing of the flows of information (López, 2006). In any case, the firm is born as an alternative mode to the market to carry out productive activities in a differentiated and more efficient manner.
It is in this sense that, except for the cases in which reassurance is sought by means of spurious relationships (for example: capture of the State, commercial preferences, lobbying power), all non routine business activity in pursuit of differentiating itself from its competitors and winning in efficiency is an innovative activity,12 and since this is what makes the essence of the beginning of a firm’s operations, in theory and by definition, every firm –or company- is an innovative initiative from its origin.
Simultaneously, the firm, in particular, centers its technological concerns on a limited number of questions: solution of specific problems, development of new products, cost reduction, development of new processes, etc., which has led, correctly, to assimilating the concept of technological change to that of innovation –although this does not stop there. However, its concern does not exclusively involve technological productive matters, but also covers logistics, organization, distribution and commercialization, among other matters. Therefore, not only are the defined and limited technologies which are liable to be fully understood of interest, but also the incremental changes generated, with a highly idiosyncratic level, in the internal area, surpassing in this way the presumptions and assumptions that exist regarding the technological question of the product and process, and focusing its competitive action over a wider spectrum, in short, focusing on the ample vision of innovation (OCDE, 1994). It is in this way that the linear diffusion models are abandoned to be replaced by others of an interactive nature among the various stages that intervene in the process (Kline and Rosenberg, 1986).
The firm, at the moment of defining its competitive strategy, is determining what “its” own innovation system is. And in this decision making neither the specificities of the profile of the company itself,13 nor the particular characteristics of the area in which it develops its activities are neutral -which, most of the times, is modified by the government by measures that do not specifically aim at obtaining a more innovative strategy-.14 12
The companies that carry out innovation activities -IA-, are denominated innovative; independently of the results that they achieve (RICyT, 2000) 13
Centering the analysis on the private users, there are different entrepreneurial classifications (SMEs or large companies; firms with national capital and/or multinationals; mono-companies or business conglomerates, etc.) according to the different criteria chosen (size, origin of capital, form of organization, etc.), which at the same time are crossed by the economic sector that they belong to (primary, metal working, etc.), as well as by the value chain that they form part of (lactose chain, energy chain, etc.). 14
The “clipping” of the system made by the entrepreneur may not coincide either with the perspective which (also externally) is applied by government agencies of SandT or with that of the academics. Generally, academics are investigators, giving a specific bias to their interpretation of the limits and the forms of functioning of the system.
8
In short, the articulation of the user with the innovation system –when it exists and is explicit to a product- is strongly asymmetrical with regard to information, language, temporality, and subjects. On the basis of this type of perception, each one of the users builds its own subsystem of innovation, but articulated from demand. It is highly likely that this vision of the system will be a clipping from the global system and, as such, has differential distinctive features.15 16
Following the steps that the company develops at the time of designing the strategy to follow, the behavior can be outlined in terms of its innovative decision. In this sense, every firm has a series of goals (generally pecuniary, but that can be marked by different temporary horizons and various risk aversions) for which a group of objectives to be reached is proposed, which at the same time will be determined by the access to financing (this access will condition the type of objectives that can be proposed), as well as different sources of information (according to the type of information –and the cost implied by access to it - will also condition the type of objective that the firm proposes).
Having designed a strategy, it can face a series of obstacles, which may prevent it from even being able to aspire to some type of activity (innovative or not). If these obstacles are overcome –or do not exist-, the company will address the performance of activities aimed at seeking greater competitiveness, which will allow it either to increase its earnings –or its participation in the market-, or just, outlive the competitors (potential and/or real). At the same time, the development of these activities will also face a series of obstacles, which if overcome, will finally permit certain achievements (innovations) to be attained.17
Figure 1. Basic scheme of innovative behavior of firms
15
What is expressed refers to a group of productive schemes specially analyzed in some regional spaces. It does not imply that for other individual agents the innovation system –seen from supply- is a valid interlocutor in its technological relationships. 16
This specific clipping will be conditioned by the previous trajectories –in other words, the preceding adoption of other groups of technologies- since they condition the possibility of access to the new opportunities that appear, pre-conditioning the future paths that can be examined. These changes occur in certain surroundings that determine the paths and possibilities of future progress (not every change can be absorbed by everyone). 17
However, it is worth clarifying here that the obtaining of innovations in no way guarantees the success of the proposed strategy, or the survival of the company.

9
Source: Anlló and Raffo (1999).
Now then, what are these activities? Initially it is worth stating that they exceed by far the traditional concepts of S&T. In principle, they can be divided into those that the company carries out internally, with its own developments based on the human resources that it possesses (that range from R&D activities -formal or sporadic- to the development of a specific machinery, passing through the engineering design or the development of a new distribution chain), and those that it acquires externally (from a patent to capital goods, passing through software packages, or contracts for the development of specific solutions). Box 1: Definitions of Innovation activities * Innovation Activities: 1) Research and Development (R&D) is the creative work carried out in a systematic manner, in other words, not occasional, with the objective of generating a new knowledge (scientific or technical) or applying or exploiting an existing knowledge or one developed by another. Within R&D, three main categories can be distinguished: basic investigation (generate new, rather abstract or theoretical knowledge within a scientific or technical area, in a broad sense, without a previously established objective or purpose), applied investigation (generate new knowledge having previously identified the purpose or destination which it is intended to reach) or experimental development (manufacturing and testing of a prototype, in other words, an original model or situation of testing which includes all of the characteristics and performances of the new product, organizational or commercialization process or technique). The creation of software is considered R&D as long as it implies making scientific or technological progress. It is important to clarify that the activities of R&D are not always carried out in the area of an R&D laboratory or of an R&D department. Moreover, many companies, specially medium and small companies, do not possess formal R&D structures and this does not imply that they do not carry out this type of activities. Although it is not a simple task, it is necessary to identify the R&D activities that are carried out without a formal structure. For example, if a group of engineers of the company, who work in the same or different areas, meets every Friday afternoon to think, consult bibliography, experiment and/or try different forms of increasing the yield of or precision with which chemical substances are mixed, this activity must be considered as an informal R&D process. The only restriction for an activity that has the purpose of generating new knowledge to be considered R&D is that it be carried out in a non-occasional manner, in other words, systematically. 2) External R&D is creative work that is not carried out within the company or with company personnel but is entrusted to a third party whether through contracting or financing of a group of investors, institution or company with the agreement that the results of the work will be the total or partial property of the company.
Financing and Information
Purposes
Objectives
NON Innovaive Potentially
Innovators
AbandonmentLatent
Innovators
Results
Effects
O B S T Á C LE S
O B S TÁ C LE S
Innovation
Activities
10
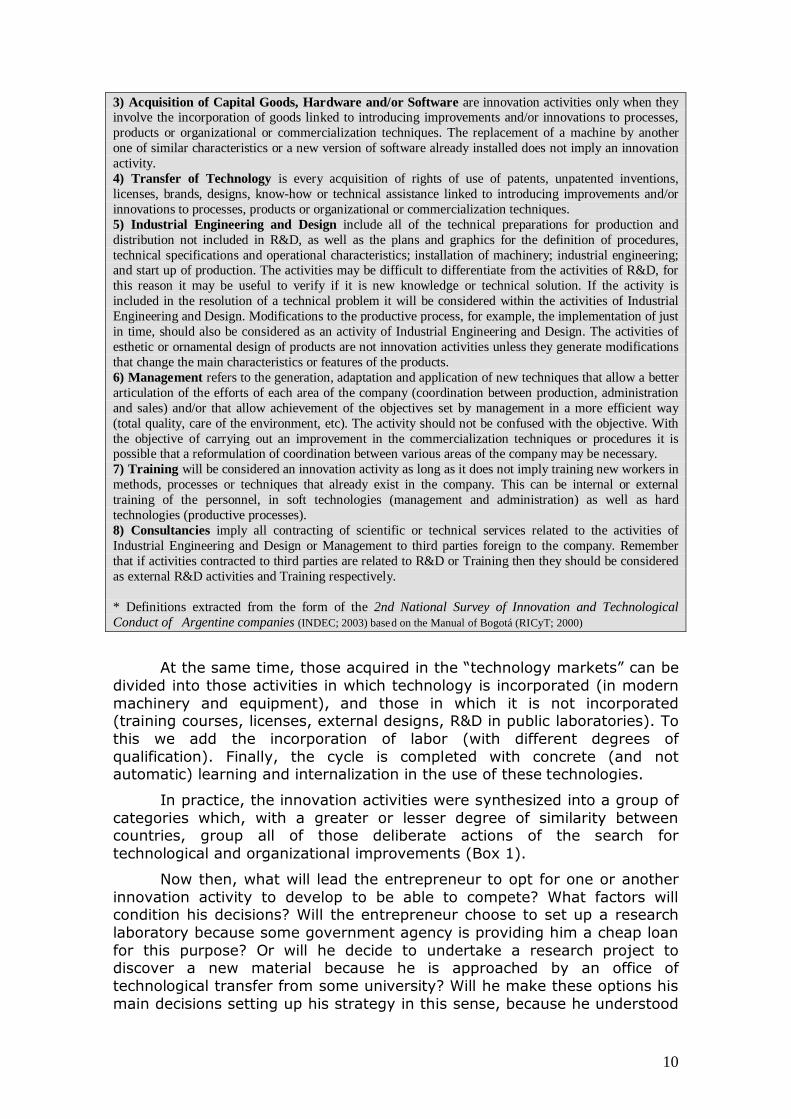
3) Acquisition of Capital Goods, Hardware and/or Software are innovation activities only when they involve the incorporation of goods linked to introducing improvements and/or innovations to processes, products or organizational or commercialization techniques. The replacement of a machine by another one of similar characteristics or a new version of software already installed does not imply an innovation activity. 4) Transfer of Technology is every acquisition of rights of use of patents, unpatented inventions, licenses, brands, designs, know-how or technical assistance linked to introducing improvements and/or innovations to processes, products or organizational or commercialization techniques. 5) Industrial Engineering and Design include all of the technical preparations for production and distribution not included in R&D, as well as the plans and graphics for the definition of procedures, technical specifications and operational characteristics; installation of machinery; industrial engineering; and start up of production. The activities may be difficult to differentiate from the activities of R&D, for this reason it may be useful to verify if it is new knowledge or technical solution. If the activity is included in the resolution of a technical problem it will be considered within the activities of Industrial Engineering and Design. Modifications to the productive process, for example, the implementation of just in time, should also be considered as an activity of Industrial Engineering and Design. The activities of esthetic or ornamental design of products are not innovation activities unless they generate modifications that change the main characteristics or features of the products. 6) Management refers to the generation, adaptation and application of new techniques that allow a better articulation of the efforts of each area of the company (coordination between production, administration and sales) and/or that allow achievement of the objectives set by management in a more efficient way (total quality, care of the environment, etc). The activity should not be confused with the objective. With the objective of carrying out an improvement in the commercialization techniques or procedures it is possible that a reformulation of coordination between various areas of the company may be necessary. 7) Training will be considered an innovation activity as long as it does not imply training new workers in methods, processes or techniques that already exist in the company. This can be internal or external training of the personnel, in soft technologies (management and administration) as well as hard technologies (productive processes). 8) Consultancies imply all contracting of scientific or technical services related to the activities of Industrial Engineering and Design or Management to third parties foreign to the company. Remember that if activities contracted to third parties are related to R&D or Training then they should be considered as external R&D activities and Training respectively. * Definitions extracted from the form of the 2nd National Survey of Innovation and Technological Conduct of Argentine companies (INDEC; 2003) based on the Manual of Bogotá (RICyT; 2000)
At the same time, those acquired in the “technology markets” can be divided into those activities in which technology is incorporated (in modern machinery and equipment), and those in which it is not incorporated (training courses, licenses, external designs, R&D in public laboratories). To this we add the incorporation of labor (with different degrees of qualification). Finally, the cycle is completed with concrete (and not automatic) learning and internalization in the use of these technologies.
In practice, the innovation activities were synthesized into a group of categories which, with a greater or lesser degree of similarity between countries, group all of those deliberate actions of the search for technological and organizational improvements (Box 1).
Now then, what will lead the entrepreneur to opt for one or another innovation activity to develop to be able to compete? What factors will condition his decisions? Will the entrepreneur choose to set up a research laboratory because some government agency is providing him a cheap loan for this purpose? Or will he decide to undertake a research project to discover a new material because he is approached by an office of technological transfer from some university? Will he make these options his main decisions setting up his strategy in this sense, because he understood

11
the social importance of the “knowledge economy”, at the risk of seeing his immediate earnings decrease and the future uncertainty of achieving success? Or, rather, will his decisions be much more influenced by the interest rate that he obtains in the capital market, the prevailing customs duty in foreign trade for the import of goods and equipment, the tax burden that it faces, and the industrial promotion regimes that emerge? (Anlló, Bisang et al; 2008) Evidently the results that emerge from the innovation surveys may not be able to provide an answer to all of these questions, but they should serve to outline the main predominant strategies within the productive sector, in such a manner to be able to arrive at answers that contribute to the design of adequate policies. The innovation surveys have been –and are intended to be instruments from which information can be gathered regarding the innovative dynamic inside the firm. The analysis of this information, together with the aggregated measurements regarding the state of science and technology (public and private sectors, businessmen and investigators) is intended to explain the dynamic of technical change and from this basis to generate policy instruments that orient private decisions. It is important to highlight that the combined analysis of what emerges from the surveys with the major aggregates is necessary to the extent to which innovation constitutes a systemic phenomenon that surpasses the frontiers of the firm. After more than a decade of more or less continued measurements, there are still many questions to be answered. However, others seem to find answers. The evidence would seem to indicate two differentiated paths in the area of technical change. These paths show that the technological trajectory is, like many other aspects of the evolution of economic variables, correlated with the relative country development level. In this line, the following sections intend to describe and analyze the innovative dynamic in the Latin American region. If innovation is located at the center of the capitalist dynamic, the place that innovation occupies within the regional productive dynamic will condition the type of capitalist dynamic that takes place in it, as well as the form in which the countries that comprise it insert themselves into the global capitalist dynamic. II – evidence that emerges from the analysis of the innovation surveys
In a similar manner to the evolution of the theory, the measurement of the innovative phenomenon began with the estimate of the major aggregates. In this sense, starting more than a decade ago, the most relevant aspects –or those easiest to quantify- associated with the technological change process began to be measured and disseminated.
The systematic dissemination of the science, technology and innovation (STI) indicators allowed the identification of a group of common characteristics of the region that summarize its profile in terms of technological development. These features are at the same time cause and effect of those characteristics which contribute to defining the region as “of
12
lower relative development”. In this way, the evolution in terms of STI is combined with a volatile gross domestic product –or one that has presented strong fluctuations throughout recent decades-, a productive structure biased towards products with low and medium-low technology and a low external insertion. II–I – An initial global approximation based on the aggregated indicators of science and technology
The first feature that is observed is the low expenditure on S&T
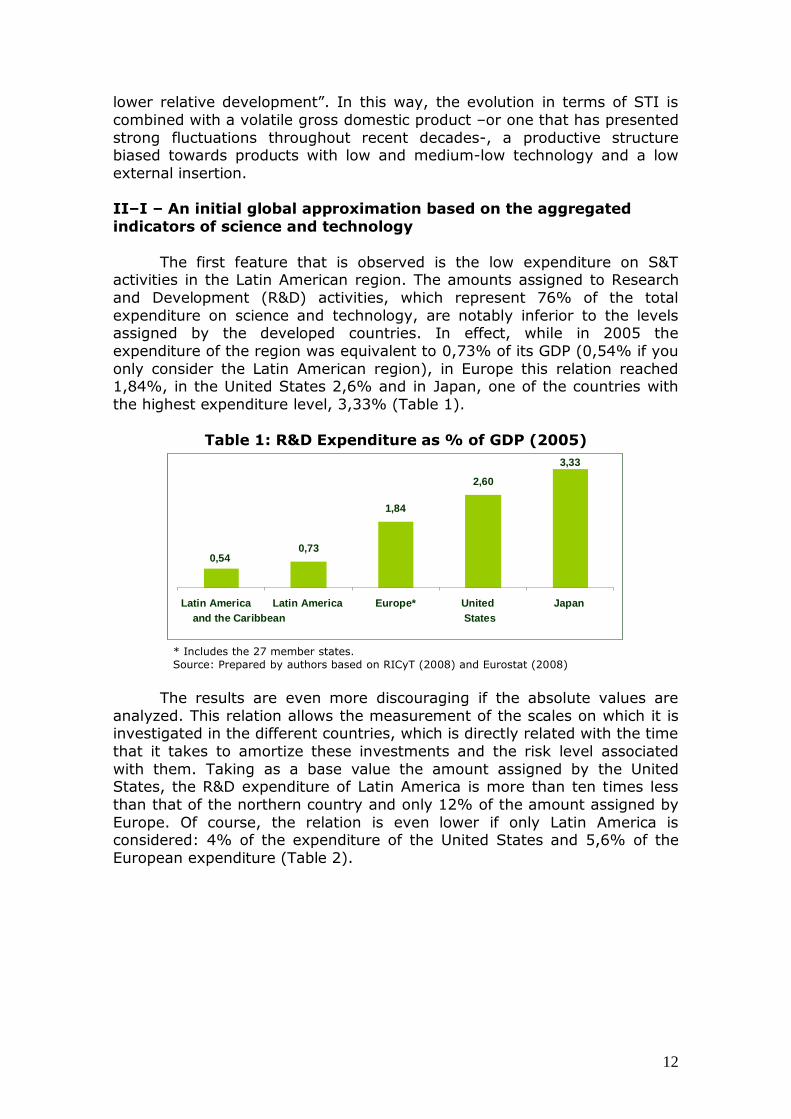
activities in the Latin American region. The amounts assigned to Research and Development (R&D) activities, which represent 76% of the total expenditure on science and technology, are notably inferior to the levels assigned by the developed countries. In effect, while in 2005 the expenditure of the region was equivalent to 0,73% of its GDP (0,54% if you only consider the Latin American region), in Europe this relation reached 1,84%, in the United States 2,6% and in Japan, one of the countries with the highest expenditure level, 3,33% (Table 1).
Table 1: R&D Expenditure as % of GDP (2005)
* Includes the 27 member states. Source: Prepared by authors based on RICyT (2008) and Eurostat (2008)
The results are even more discouraging if the absolute values are
analyzed. This relation allows the measurement of the scales on which it is investigated in the different countries, which is directly related with the time that it takes to amortize these investments and the risk level associated with them. Taking as a base value the amount assigned by the United States, the R&D expenditure of Latin America is more than ten times less than that of the northern country and only 12% of the amount assigned by Europe. Of course, the relation is even lower if only Latin America is considered: 4% of the expenditure of the United States and 5,6% of the European expenditure (Table 2).
0,73
1,84
2,60 3,33
0,54
Latin America and the Caribbean
Latin America Europe* United States
Japan

13
Table 2: R&D Expenditure (United States = 100) Year 2005
* Includes the 27 member states. Source: Prepared by authors based on RICyT (2008) and Eurostat (2008)
The effort made by the region is also low if it is analyzed on the basis
of the human resources dedicated to science and technology activities (second feature). Indeed, it is observed that while in Europe it is estimated that there are 13,2 investigators for every thousand members of the economically active population, in Latin America this relation declines to 2,1, that is, more than 6 times less (Table 3).
Returning to the above mentioned limitation of scale stated in feature 1, it is observed that in Latin America there is not only a smaller proportion of investigators, but that the people dedicated to these activities also have a significantly lower amount of resources. Table 3 also shows the average amount of dollars which investigators have for carrying out R&D activities: in the region the people dedicated to research and development have little more than 4.000 dollars per month (3.200 in the Latin American region), which is 40% less than what is observed in the case of Europe and 60% less than the resources to which Japanese investigators have access.
Table 3: HR in R&D and Expenditure per Researcher – Year 2005
HR in R&D a Expenditure per
Researcher b Latin America and the
Caribbean 1,42 38.561 Latin America 2,10 48.771
Europec 13,2 79.146 Japan 16,9 127.995
(a) Researchers (physical persons) per/1000 of the EAP. (b) Current dollars. (c) Includes the 27 member states. Source: Prepared by authors based on RICyT (2008) and Eurostat (2008)
This relationship between human and financial resources could be revealing various questions. In the first place the degree of novelty of the research and development that is carried out in the region. In the second place the position of investigators in the salary ranking. And third, the level of additional efforts that will be required to reach international
4% 9%
44%
75% 100%
Latin America and the Caribbean
Latin America Japan Europe* United States

14
expenditure standards (and the consequent expectations of the possibility of equaling results). At the same time, if new investigators are trained but the expenditure level per investigator is not increased, the brain drain will continue -possibly increasing- seriously threatening the evolution of the science and technology system.
The third characteristic feature of the region, which is directly associated with the two previous ones, is that the major part of this expense originates from public funds. As can be observed in Table 4, while in the developed countries the private sector accounts for the major part of R&D expenditure, in the developing countries the opposite relation is presented: in Latin America, public funds are equivalent to 58% of the expenditure -62% in LA-; in Europe 55%, in the United States 36% and in Japan 24%.
Table 4: Distribution of R&D Expenditure - Year 2005
* Includes the 27 member states. Source: Prepared by authors based on RICyT (2008) and Eurostat (2008)
These results present various implications in terms of the purpose of
the expenditure, its impact in terms of development of innovations and its possibilities of encouraging long term research and development. At the same time, given the instability that characterizes these countries, those activities of S&T that require a greater planning (and financing) horizon, are either prevented from beginning, or the fall in resources in the face of a crisis/recession forces their sudden interruption.
In a context where government expenditure cannot act as a counter-cyclical agent18, in periods of recession expenditure on S&T not only falls but also loses priority with regard to other more urgent public expenditure. At the same time, the lack of finance works against the acquired capacities (obsolescence of equipment, brain drain, closing of public institutions of S&T, among others) and technological setbacks are produced that will not necessarily be compensated for by the progress that could be produced during the following growth period.19
18
Since the crises in the region are mainly characterized as impacting the accounts of the public sector. 19
In this case, the instability of the region also has severe consequences for private initiative.
62% 58% 45%
36% 24%
38% 42% 55% 64%
76%
0%
20%
40%
60%
80%
100%
Latin America and the Caribbean
Latin America Europe* Unites States Japan Public Sector Companies

15
Another one of the readings that should be made regarding the
distribution of expenditure between public and private sources is the one that sustains that it is not a question of an elevated participation of public expenditure, but rather a major part of the problem resides in the low degree of commitment of the business sector to innovation. Table 5 presents the relation between expenditure and GDP distinguishing between both sectors of the economy. While the governments of the region spend 0,33% of GDP on R&D, in the United States this relation rises to 0,99% and in the case of Europe 0,83%. This implies that public expenditure in Latin America should be multiplied by 2,5 to equal Europe and by 2,7 to equal the level of the United States. Among the companies of the region (which manage the equivalent of 0,31% of the GDP), for this to happen, relative expenditure should be multiplied by 3,5 in order to reach the level of European companies (1% of the GDP) and by 8,5 to reach the level of the North Americans (2,53%), which reinforces the perception regarding the absence of private investment in R&D.
Table 5: Distribution of R&D expenditure as % of GDP (Year 2005)
* Includes the 27 member states.
Source: Prepared by authors based on RICyT (2008) and Eurostat (2008)
Finally, the fourth feature is the low patenting rate. In a context of
low level of efforts, concentration of expenditure on public funds, lack of human resources which at the same time have scarce availability of resources and a private sector with a reduced commitment to R&D (or at least with a low investment level in these activities), it is to be expected that the quantity of patents will be small. As can be observed in table 6, while the inhabitants of the Latin American region applied for a total of 16.609 patents in their country, those of the United States applied for 12,5 times more in their country (207.867 patents). Of course, the patenting rate is not necessarily equivalent to the quantity of innovations (in other words, the new or improved products and processes that have been successfully introduced to the market) but it does allow an approximation to the degree of novelty that results from the activities of science, technology and innovation.
0,00 0,50 1,00 1,50 2,00 2,50 3,00 3,50
Latin America and the Caribbean
Latin America Europe* Japan United States Public sector Private sector Total

16
Table 6: Patents applied for by residents Year 2005
Latin America and the Caribbean
12.790
Latin America 16.609 United States 207.867
Source: Prepared by authors based on RICyT (2008) and Eurostat (2008)
Now then, if we abandon the international comparison and the
analysis is concentrated on the path of the efforts of the region, some tendencies are observed that could be qualitative and quantitative signs in terms of STI. Despite the low levels of effort, the recent evolution of the main macroeconomic indicators leads to questions regarding the possibility of facing a completely different scenario than the one that was faced a few years ago. The increase in commodity prices, the macro stability that followed the overcoming of the imbalances of the last decade and the increase in the growth rate of the region constitute an unprecedented scenario that should be exploited to reduce the gap with the developed countries.
There are some signs that point in this direction. Between 2000 and 2005 the expenditure on R&D in relation to GDP increased by 14%, the staff numbers of investigators for every 1000 members of the EAP increased by 26%, the participation of the private sector in total expenditure went from 39% to 42% and the number of patents applied for by residents increased by 10% (Table 7).
Given this favorable situation, and in view of what has been described in the previous paragraphs regarding firms, it is valid to ask, what is the situation of the productive framework of the region? That is, what are the characteristics of this increase in the participation of private expenditure? Thus its analysis is a decisive factor for trying to identify the type of growth which the region is generating. If the improvement in income levels depends on the creation of value, and if the creation of value depends on the systematic increase in the knowledge content of goods and services, then the commitment level of the productive sector to innovation is a key determinant of the path of development.
Table 7: Main Indicators of S&T – Latin American Region
2000 2005 Var. %
2000-2005 R&D Expenditurea 0,64% 0,73% 14% HR in R&Db 1,66 2,10 26% Private R&D Expenditurec
38,90% 41,73% 7%
Patentsd 15.119 16.609 10% (a) R&D Expenditure as % of GDP. (b) Investigators (Physical persons) per/1000 members of the EAP. (c) % of total R&D expenditure. (d) Patents applied for by residents. Source: Prepared by authors based on RICyT (2008).

17
As was proposed at the beginning, innovation is not reduced to R&D, and companies are forced to carry out innovations systematically to survive in a market that is constantly more competitive and global. The question is to know what type of innovative strategy the regional private sector is implementing. For that, the innovation surveys, although they are not the only element for the analysis, are a necessary one in the search to understand the structuring of private strategies and the design of public policy. II–II – Exploring what occurs inside the firm The possibilities of comparison
The need to understand the microeconomic dimension of innovation stimulated, during the decade of the 90s, the carrying out of business innovation surveys. These surveys have allowed the in-depth study of the analysis of the innovative process on the level of the firm as well as contrasting the theory of technological change with the real behavior of economic agents.
In terms of international comparability, in this case, it is not possible to refer to the region as a whole due to the lack of a common form that unifies both criteria as well as indicators. However, to the extent to which the forms used have been based on the Manuals of Oslo (OECD; 2005) and Bogotá (RICyT; 2000), it is possible to find common variables capable of representing the relative situation of some countries of the region. In this respect, the present section will analyze innovation on the level of the firm for a selected group of countries. This selection responds to two basic criteria: the availability of the results of the surveys and the possibility of comparing them.20 The countries of which the innovative process between firms will be studied are: Argentina, Brazil, Chile, Colombia, Spain, Mexico and Uruguay; in all cases, using the latest available data.21 At the same time, the values for Germany and France are also included –which, in turn, are the ones which present the highest levels (EC; 2008)-, in order to have a relative vision of the current situation.
It is necessary to bear in mind that, given the methodological and conceptual differences, it is not possible to compare the results for all of the selected countries in every case. Likewise, indicators that will be compared emerge from surveys with different samples –in composition and quantity- and from different years, for which reason it will be necessary to analyze the results considering the deviations caused by the sample differences. Annex 1 presents a synthesis of these differences. In this respect, there
20
For a greater development of the comparability of innovation surveys in the countries of the region see Lugones et.al. (2006). 21
It is worth clarifying here that other countries have also carried out innovation surveys, however, the dissemination of the information, the type of indicators presented and the representative quality of the sample implies significantly reducing the dimensions of the analysis that is intended to be carried out. It is hoped that in the coming years, the progress in terms of regional consensus and the greater dissemination of the innovation surveys will allow an expansion of the present study.

18
should be an additional clarification regarding the case of the Colombian survey. Unlike the surveys of the other countries, the latest available data for Colombian companies corresponds to a pilot survey of a little more than a hundred establishments and not to a representative sample. As a result, the indicators that emerge should be carefully analyzed.
Similarly to the analysis structure presented in the previous paragraph, the present section intends to synthesize the main features observed for the analyzed countries in the area of innovation. Anticipating the conclusions of the analysis, it can be stated that the region is characterized by low expenditure on innovation - concentrated on the acquisition of embodied technology-; process innovations over those of products; scarce links of the companies with their surroundings, and a strong impact of macroeconomic obstacles on the design of strategies. Scarce efforts in innovation activities
As described in the previous paragraph for R&D, the level of expenditure on innovation activities, now in general, is relatively low –although some countries significantly deviate from the averages of the region. The low level of efforts is generally associated with the lack of commitment of firms to innovation as a competitiveness strategy. In other words, if it is accepted that innovation leads to important earnings in terms of productivity and profitability, but that innovation is not the only form of achieving them (although it is the only genuine form of doing so), then the fact of not carrying out significant efforts in these activities would account for the existence of other mechanisms for the search for competitiveness.
This is what is observed, for example, if the total expenditure on capital goods and R&D is analyzed, in relation to sales. The innovation surveys ask about a group of activities that tend towards the search for technological and organizational improvements (innovation activities -IA)22 and these two areas are the two main activities in terms of the assigned amounts. 23 As can be observed in table 8, the amount assigned by Argentine companies –which are at the same time those which dedicate least monetary efforts- to R&D activities and for the acquisition of capital goods, is a little more than a fifth of the relative amount assigned by German companies (0,84% vs. 3,7%); even in the case of Brazilian companies –which are the ones with the highest levels of the region- expenditure on capital goods and research and development activities is half of the percentage of the expenditure of their German peers.
22
See Box 1. 23
For the analysis of this indicator it was not possible to include the results of the surveys of Chile, Colombia, Uruguay and Mexico due, either to the lack of information regarding sales, or to the fact of presenting the results in an incompatible manner (for example, with regard to gross added value and not to total sales).

19
Table 8: Expenditure on Capital Goods and R&D (% of sales)
0,841,08
1,92
2,81
3,68
Argentina Spain Brazil France Germany
Argentina: accumulated values 2002-2004; % of total sales. (INDEC; 2006) Brazil: year 2005; % of total sales. (IBGE; 2007) Germany, Spain and France: year 2004; % of total sales. Without data (wd) of expenditure on training activities. (Eurostat 2008) R&D: expenditure on research and development carried out within the company. Capital goods: expenditure on machinery and equipment in all of the cases except Germany, Spain and France which include software.
The analysis per country also shows that the low level of efforts is
also observed in relation to the staff of human resources dedicated to these activities, which, once again, is a sign of the small proportion of companies that invest in the internal generation of knowledge. While Colombian companies –which are the ones with the highest values in the region- have less than two employees dedicated to R&D for every 100 employed, among French companies this relation is of 5,3 for every 100 and of 4,3 for German companies (Table 9).
The part time personnel (or those who carry out R&D activities without the company having a formal department for these activities) are also relatively lower among the companies of the region.

20
Table 9: Human Resources in R&D
% / total employment
/Formal Dept./ECWD) a
% / total employment (Non- formal Dept./part
time) b
Total HR R&D/ total
employmentc
Argentina 1,0 0,9 1,9 Brazil 0,7 0,3 1,0
Colombia 1,9 Wd Wd Spain* 1,7 Wd 2,3
Uruguay 0,4 1,5 1,9 Germany* 4,3 Wd 4,8 France* 5,1 Wd 5,3
* Germany, Spain and France: year 2004. (a) HR dedicated to activities of R&D in equivalent complete working days. (c) Physical persons dedicated to activities of R&D. (Eurostat 2008) Due to the form in which the results are presented (ECWD instead of part time and full time), it is not possible to establish the relative number of persons dedicated to these activities. Argentina: year 2004, % of total employment. (a) HR dedicated to activities of R&D in formal departments. (b) HR dedicated to activities of R&D without belonging to an R&D department. (c) a+b physical persons. (INDEC; 2006) Brazil: year 2005, % of total panel. (a) HR dedicated to R&D activities full time (b) HR dedicated to R&D activities part time. (c) a+b physical persons. (IBGE; 2007) Colombia: year 2002, the data corresponds to the results of the pilot sample of the Survey of Technological Development 2 (EDT2) for the year 2001. % of innovations. (OCyT; 2004) Uruguay: Uruguay: year 2003, % of total panel. (a) HR dedicated to R&D activities in formal departments. (b) HR dedicated to R&D activities without belonging to an R&D department. (c) a+b physical persons. (DICyT; 2006)
These results coincide with those that emerge from the analysis of
the structure of innovation expenditure. The low level of expenditure presents, additionally, a strong bias towards the acquisition of machinery and equipment. In table 10 the relation between expenditure on capital goods and R&D expenditure can be observed, a structure which permits the inclusion in the analysis of all the selected countries. While in the developing countries research activities account for the major proportion of the analyzed expenditure, in the countries of lesser relative development this relation is the inverse, and the difference between the amounts assigned to the acquisition of embodied technology vs. the activities of internal generation of knowledge would seem to tend to accentuate as the relative development level of the industrial framework descends. In fact, while in the case of Colombia, companies assign to the acquisition of capital goods 40 times more than they assign to R&D (for each dollar invested in R&D 40 dollars are assigned to the acquisition of machinery and equipment), among Brazilian firms this relation falls to 2,3 and among Spanish firms to 0,7. At the opposite extreme are the French companies with a relation of 1 to 0.14 (for each dollar invested in R&D 0,14 dollars are assigned to the acquisition of machinery and equipment).

21
Table 10: Relation between expenditure on R&D and on Capital Goods (%)
Argentina: accumulated values 2002-2004. (INDEC; 2006) Brazil: year 2005. (IBGE; 2007) Chile: year 2004. (INE; 2008) Colombia: the data corresponds to the results of the pilot sample of the Survey of Technological Development 2 (EDT2) for the year 2001. (OCyT; 2004) México: year 2005. (INEGI; 2007) Uruguay: year 2003. (DICyT; 2006) Germany, Spain and France: year 2004. (Eurostat 2008) R&D: expenditure on research and development activities carried out within the company. KGs: expenditure on machinery and equipment in all of the cases except for Germany, Spain and France which includes software.
Although the low level of relative efforts in R&D shows the low level of commitment to this type of activities, the fact that expenditure is carried out for the acquisition of machinery and equipment is logical in a context of productive processes of greater technological backwardness. An important part of the technology incorporated by the companies comes in an incorporated manner, by means of the acquisition of equipment. Nearly 60% of the firms in the developing countries define this path as one of the three main sources of technological innovation (Knell, 2006; cited by UNCTAD, 2007). 24 By definition, the developing countries assume this condition due to the type of productive process that they develop (Edquist; 2001). In other words, to the extent to which the productive structure of these countries is below the international technological frontier, any short term improvement should be based on an improvement in the productive process. Although, this bias in expenditure can be understood as a characteristic feature of the economies of lesser relative development, at the same time it would be stating a preference for the adoption of strategies of the “modernizing” type (technological jumps to the frontier by means of acquisition of embodied technology) instead of more balanced “autonomous” strategies (by means of the search for the generation of own
24This marked bias leads to the question of the efficiency of this expenditure, since if the acquisition of embodied technology is not accompanied by efforts for the generation of internal capacities (R&D activities, training, etc.), the innovative potential of the new capital good will be under-utilized with the risk of not generating the expected productivity earnings (e.g.: If the administrative personnel of the company have their typewriters replaced by modern computers, simply to use them as text processors).
0% 10% 20% 30% 40% 50% 60% 70% 80% 90%
100%
Colombia Uruguay Chile Argentina Brazil Mexico Spain Germany France R&D KGs

22
in-house knowledge together with the external acquisition of technology). This preference is in no way independent of the conditions of the surroundings. Macroeconomic instability forces the adoption of strategies that reduce risk and uncertainty, allowing at the same time, to be competitive as quickly as possible. Unfortunately, this results in the adoption of strategies that establish dependent evolutionary paths (of the central countries, of the dynamic companies, of the developers of knowledge) and do not guarantee, on their own, the possibility of a temporarily sustainable development (local, regional or national). This is precisely what the indicators of the results could be capturing. The results of the innovative process
It is evident that any improvement in the productive process will demand expenditure on capital goods, the incorporation of which, at the same time, translates into a greater rate of process innovative companies (innovative firms that achieved results). If to this we add that every change in the form of production impacts on the characteristics of the product, then it is to be expected to find high rates of technologically innovative companies 25 (firms that achieved product or process innovations) although these do not indicate anything about the extent of the novelty. In this manner, as can be observed in table 11, even in countries with lower relative expenditure a high rate of innovating firms is observed. However, when the results are analyzed in the light of the applications for patents the values descend drastically and the ranking is once again correlated to the expenditure level in relation to sales.
While the rate of process innovators among Brazilian firms is higher than that of German firms (27% vs. 19%), among the first group only 6,2% of the innovating firms have applied for a patent while in the second group this percentage reaches 27,7%. Even more so, given that the percentages for Brazil are calculated based on the total of innovators (firms that achieved innovations) and for the Germans based on the innovations (firms that made efforts in AI independently of the results), for the case of Brazil the patenting rate would be overestimated with regard to the German rate.
The percentage of process innovating firms is also notable among the Latin American companies with the exception of Spain. There have been various attempts to explain these differences (Lugones et.al., 2005; Suárez; 2006) although in the light of the distance between the percentages of the companies of the Latin American countries and their Spanish equivalents it is possible that the distance with regard to the international technological frontier (greater among the first group) leads the margin for improvement of the productive process to be greater and therefore any incorporation of new machinery implies an innovation in the productive process.
Finally, in relation to the surprising process and product innovation rates among Colombian firms, the distance with regard to the rest of the
25
May be assimilated to the international comparison criteria established by the Manual of Oslo.

23
countries probably responds to the fact that these are the results of a pilot sample with a reduced group of firms, to which is added the overestimation that emerges from the analysis unit used: the establishment.
Table 11: Results of innovation activities
Argentina: period 2002-2004, % of total panel. No patent data. (INDEC; 2006) Brazil: period 2003-2005, % innovators of total panel. % of companies that applied for patents of total innovators. (IBGE; 2007) Chile: year 2004, % of total panel. (INE; 2008) Colombia: period 1999-2002. The data corresponds to the results of the pilot sample of the Survey of Technological Development 2 (EDT2) for the year 2001. % of innovators. (OCyT; 2004) Mexico: the presentation of the data is not comparable. Uruguay: period 2001-2003, % of total panel. (DICyT; 2006) Germany, Spain and France: year 2004, product or process innovations mainly developed by the company or the business group, % of total panel. % of companies that applied for patents compared to innovatives. (Eurostat 2008)
The hypotheses regarding the structure, intensity and results of the efforts in IA
Now then, the conclusions that emerge from the analysis of the innovative processes (efforts and results) permit the proposal of two hypotheses. The first one is that investment in capital goods could be a sign of technological upgrading and scaling up of the productive structure. In other words: Latin American firms are seeking to catch up with their peers from the developed countries in terms of productive scale and technological complexity. The second hypothesis refers to the firms that are carrying out R&D: it is possible that although in the aggregate expenditure on R&D is low, among the firms that effectively carry out this activity the gap with regard to the developed countries is reducing. H1: technological upgrading
If the first hypothesis were true – technological upgrading- then it could be expected that the firms might make complementary efforts in this line, specially in activities of industrial engineering and design (IED) and in training activities. The first one because it is determinant of the way in
0
15
30
45
60
75
Germany Argentina Brazil Chile Colombia Spain France Patent applications Product innovators Process innovators
24
which machinery is selected, implemented and improved; the second one because it recognizes the search for creation and improvement of the competencies of personnel. In this sense, the collected results would seem to indicate that this is not necessarily what is happening. Unfortunately there is no information in the case of the European companies but the comparison regarding total expenditure on innovation activities –which in the majority of the surveys adhere to the recommendations of the Manual of Oslo - is illustrative.26
With regard to training activities, Uruguayan companies are the ones
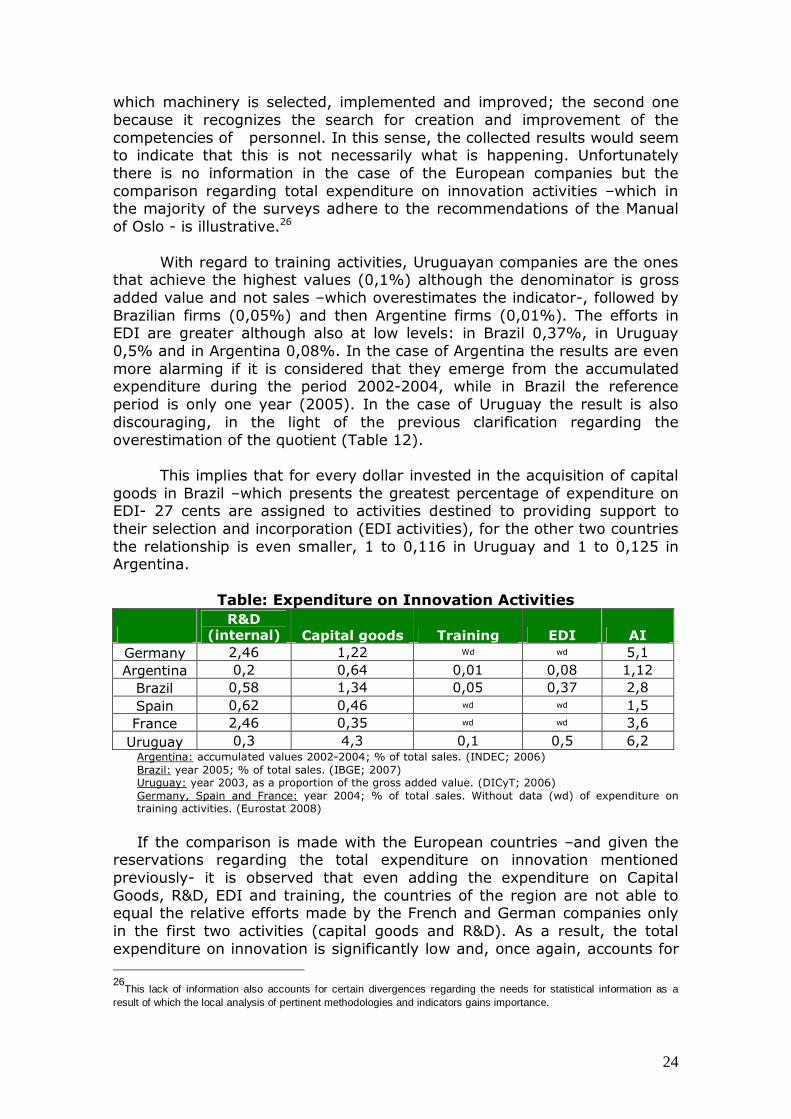
that achieve the highest values (0,1%) although the denominator is gross added value and not sales –which overestimates the indicator-, followed by Brazilian firms (0,05%) and then Argentine firms (0,01%). The efforts in EDI are greater although also at low levels: in Brazil 0,37%, in Uruguay 0,5% and in Argentina 0,08%. In the case of Argentina the results are even more alarming if it is considered that they emerge from the accumulated expenditure during the period 2002-2004, while in Brazil the reference period is only one year (2005). In the case of Uruguay the result is also discouraging, in the light of the previous clarification regarding the overestimation of the quotient (Table 12).
This implies that for every dollar invested in the acquisition of capital goods in Brazil –which presents the greatest percentage of expenditure on EDI- 27 cents are assigned to activities destined to providing support to their selection and incorporation (EDI activities), for the other two countries the relationship is even smaller, 1 to 0,116 in Uruguay and 1 to 0,125 in Argentina.
Table: Expenditure on Innovation Activities
R&D
(internal) Capital goods Training EDI AI Germany 2,46 1,22 Wd wd 5,1 Argentina 0,2 0,64 0,01 0,08 1,12
Brazil 0,58 1,34 0,05 0,37 2,8 Spain 0,62 0,46 wd wd 1,5 France 2,46 0,35 wd wd 3,6
Uruguay 0,3 4,3 0,1 0,5 6,2 Argentina: accumulated values 2002-2004; % of total sales. (INDEC; 2006) Brazil: year 2005; % of total sales. (IBGE; 2007) Uruguay: year 2003, as a proportion of the gross added value. (DICyT; 2006) Germany, Spain and France: year 2004; % of total sales. Without data (wd) of expenditure on training activities. (Eurostat 2008)
If the comparison is made with the European countries –and given the
reservations regarding the total expenditure on innovation mentioned previously- it is observed that even adding the expenditure on Capital Goods, R&D, EDI and training, the countries of the region are not able to equal the relative efforts made by the French and German companies only in the first two activities (capital goods and R&D). As a result, the total expenditure on innovation is significantly low and, once again, accounts for 26
This lack of information also accounts for certain divergences regarding the needs for statistical information as a result of which the local analysis of pertinent methodologies and indicators gains importance.

25
the low commitment of firms to the search for what Fajnzylver (1989) calls sustainable and accumulative advantages. In other words, given the differences in terms of efforts between the companies of the selected Latin American countries and the companies of the selected European countries, it would seem rather implausible that the first should be progressing in a systematic manner towards the international technological frontier.27
Another way of approaching this conclusion is through the type of international insertion. If firms are progressing towards the frontier in the more dynamic sectors, then this should have some form of impact on the participation of these goods in total exports. Once again, the available data would seem to indicate the contrary. Both the magnitude of the high and medium technology exports (with the care that this type of classification requires),28 as well as the evolution of these goods in the exported total, account for the insertion characteristics of the countries of the region in international trade flows. As can be observed in table 13, between 1990 and 2006 the structure of exports has remained constant –except for Mexico-, concentrated in the exports of primary and manufactured products based on natural resources. Although in Brazil the manufactures of high and medium technological intensity account for almost one third of total exports in 2006 and in Mexico high technology exports went from 4% in 1990 to 24.7% in 2006, both cases deserve separate clarification. Almost all of the Mexican exports of high and medium technological intensity have their origin in export assembly plants, and given that the production stage carried out in Mexico corresponds mainly to assembly activities, it is a productive process that strongly demands less skilled labor and scarce generation of knowledge. (Lugones and Suárez; 2006)
With regard to Brazil, although the numbers seem to indicate an intensification of technological content, in an investigation carried out by De Negri et.al. (2005) it is concluded that the Brazilian firms that have achieved an international insertion based on product differentiation and technological intensification represent only 1.7% of the total industrial structure of this country.
27
In the best of cases of the countries analyzed here only Brazil would seem to be making efforts to converge. 28
For a greater development see Suárez (2006).

26
Table 13: Structure of exports (%)
Primary products
Based on Natural
resources
Low technological
intensity
Medium technological
intensity
High technological
intensity Total Exports
1990 2006 1990 2006 1990 2006 1990 2006 1995 2006 1990 2006 Germany* 3,4 3,0 15,1 15,0 14,9 13,1 50,0 48,8 16,6 20,1 100 100 Argentina 44,1 45,5 31,2 25,9 11,8 6,0 10,8 20,1 2,2 2,5 100 100 Brazil 28,3 31,5 26,3 24,2 15,2 9,4 26,3 27,0 4,0 7,9 100 100 Chile 33,3 39,0 60,4 54,2 2,1 1,4 3,1 4,9 1,0 0,4 100 100 Colombia 67,0 48,4 13,4 19,3 13,4 11,9 6,2 17,9 0,0 2,5 100 100 Spain 10,6 9,5 22,5 21,7 18,2 15,1 40,0 42,7 8,7 11,0 100 100 France 9,8 6,0 21,2 18,8 15,8 13,7 37,6 38,8 15,6 22,7 100 100 Mexico 47,5 18,7 13,1 8,6 7,1 10,8 28,3 37,2 4,0 24,7 100 100
* The values correspond to the years 1995 and 2006 Source: CEPAL (2008)
The question that emerges then is: what is the causal relationship?
On the one hand, given the productive structure, it would not seem logical to expect elevated expenditure on innovation activities in general and on research and development in particular. In other words, given the composition of the goods emerging from the productive framework (traditional sectors, standard goods, primary commodities, etc.), expenditure on innovation is a determinant of low importance in the survival of the firm.
On the other hand, unless there is investment in innovation, it does not seem logical to expect a change in the productive structure. Only to the extent to which firms choose a competitiveness strategy based on the search for technological and organizational improvements, will they be in conditions to compete in markets for goods of greater added value. Of course, it is not the objective of the present document to start analyzing the determinants, nor the possible answers to the proposed question, however, this type of analysis is what is required to rethink the growth and development scheme of the region, which at the same time recognizes the importance of having innovation and statistical indicators that complement its analysis. H2: similar efforts in similar sectors
In relation to the second hypothesis, which states that the firms that do carry out research and development do it with a similar intensity to the companies of the developed countries, the results would also seem to refute it. Graph 1 presents in a related form expenditure on R&D with regard to sales, personnel in these activities with regard to total employment and expenditure on R&D for each employee in R&D. As can be observed, the low level of efforts (in monetary and human resources) is also combined with a low level of resources that researchers and technical personnel have available for the development of these activities. In Brazil the annual amount for each employee is 50 thousand dollars, in Uruguay 17 thousand and in Argentina a little less than 12 thousand; only Spain stands out (70 thousand) with levels relatively closer to those of the firms of the developed countries. The comparison with the relative efforts in Germany and France

27
clearly shows the differences of scale to the extent that the effort of the firms of these countries is close to 150 thousand dollars per year.
Graph 1: R&D expenditure and personnel*
* Expenditure on internal R&D as % of the total sales / HR in R&D as % of the total employment, physical persons / Expenditure on R&D / employment R&D, in thousands of current dollars. Argentina: year 2004. (INDEC; 2006) Brazil: year 2005. (IBGE; 2007) Uruguay: year 2003. (DICyT; 2006) Germany, Spain and France: year 2004. (Eurostat 2008)
One of the limitations of this type of analysis is related to the fact that there is no distinction between productive sectors, which gives equal characterization to firms of different technological intensity. For the purpose of improving the comparison, table 14 presents the same relationship of variables (expense per employee) but now distinguishing between four productive sectors: food and beverages, textiles, chemicals and metalworking, according to the classification CIIU Rev.3. As can be observed, even compared to the same sectors of activity, the difference in relative expenditure is significant. The expected positive relationship between expenditure and technological intensity is also observed: among the chemical firms expenditure is greater than among the food companies, but even so, among the companies of the region the expenditure continues to be low: Spanish firms spend on R&D per employee half of what their German equivalents spend, the Brazilians one quarter and the Argentines one fifth. It is important to highlight that the difference between the level of efforts of the Brazilian and Argentine firms has been the object of numerous studies to the extent to which they are two of the largest countries of the region, with similar productive structures but which during recent years have grown apart in terms of technological efforts, highlighting the positive evolution of Brazilian industry and negative evolution of Argentine industry. In fact, similar conclusions to those observed here are also reached by Peirano (2006) in an analysis regarding the sector innovative intensity for the case of the companies of both countries.
$69
$150
$12$50
$148
$17
0
1
2
3
4
5
6
7
0 0,5 1 1,5 2 2,5 3 R&D / Sales (%)
Germany Argentina Brazil Spain France Uruguay
HR
R&
D /
Tota
l Em
ploy
men
t (%
)

28
Table 14: R&D expenditure and employment – Selected sectors
Food and beverages
Textiles Chemicals Metalworking
Germany 117.746 87.689 187.465 113.560 Argentina 7.913 6.096 38.651 18.845
Brazil 30.889 23.028 47.435 22.218 Spain 52.308 48.222 98.931 50.655 France wd wd 103.144 105.514
Expenditure on internal R&D in current dollars / employment in R&D physical persons / Classification CIIU Rev. 3: Food and beverages, 15; Textile, 17; Chemistry, 24; Metalworking, 27, 28 and 29. Argentina: year 2004. (INDEC; 2006) Brazil: year 2005. (IBGE; 2007) Uruguay: year 2003. (DICyT; 2006) Germany: year 2005; Spain and France: year 2004. (Eurostat 2008)
Given the differences in the average amounts that R&D personnel have
available, it does not seem that the firms of the different regions are developing activities of similar intensity or technological complexity, on the contrary, the differences in scales either account for the different technological complexity of the activities faced, or for the scarce attention paid by the firms of the selected Latin American countries regarding the performance of R&D activities. The case of Spanish firms deserves separate clarification.
In the different indicators reviewed, the firms from Spain are located in an intermediate position between the levels of the Latin American firms and the rest of the European firms. This could be indicating the impact of finding themselves in more sophisticated markets and the drive that they apply in terms of technological development. If this is so, then access to these markets could prove to be a decisive factor as an incentive mechanism for the development of these activities. As a result, the innovation policy in the manufacturing plan should go hand in hand with an international trade policy tending towards insertion in markets of greater dynamism and more sophisticated demand. Toward the formation of a national innovation system: links, objectives, sources of information and obstacles
So far the efforts in innovation have been analyzed and, within these, particularly the efforts in research and development carried out inside the firms. These indicators show a low commitment of the manufacturing sector to the search for technological and organizational improvements. The results coincide with the low level of effort observed in the aggregated indicators in the first paragraph: low participation of private expenditure on R&D. Now then, the theory of the national innovation system sustains that a form of capitalizing efforts in innovation developed in the public sector is that which occurs on the basis of the links and the flow of knowledge from the public S&T institutions towards the companies. Links
The measurement of this phenomenon is what motivates the incorporation of questions regarding cooperation and sources of information into the innovation surveys in the region. The international comparison shows significant differences between countries although, in general terms,

29
an elevated cooperation rate is observed for innovation between the Latin American firms of the selected countries –a rate even superior to the one observed between the German and French firms-.
As can be observed in table 15 the Argentine and Uruguayan companies achieve the highest values although in part explained by the fact that the question in the surveys refers to the existence of links (with or without formal cooperation agreements). In the case of Colombia it is a reduced sample, as a result of which it is also probable that the bias is overestimating the results. The cases of Brazil, Chile and Mexico –and of course Spain-, on the one hand, are the ones which permit greater comparability in relation to the developed countries although, on the other hand, they provide scarce information regarding the existence of interactions within the national innovation system.
Table 15: Cooperation activities with the NIS (% of companies) Agents Arg Uru Bra Chi Mex Col Spa Ger Fra
Universities 27 15 2 a 3 5 a 5 11 11 Institutes of technological
formation 14 14 2 b Wd 2 26 Wd Wd Wd
Technological centers
26 18 Wd a 12 Wd Wd Wd
S&T Institutions
Consultants 34 31 2 3 Wd 12 5 4 14 Related
companies 22 15 1 5 Wd 4 4 6 16
Head office 15 4 Wd 3 Wd Wd Wd Clients 39 34 4 4 Wd 5 9 21
Suppliers 54 50 4 6 Wd 24 9 9 25
Commercial links
Competitors 20 c 12 c 1 3 9 2 3 4 14 Argentina: companies were asked about the existence of relations in the framework of innovation activities, with or without a formal cooperation agreement. Period 1998-2001. (c) The reply option was: other non related companies. % / total panel. (INDEC; 2003) Brazil: Companies that assigned high and medium importance to cooperation agreements. (a) Universities include research institutes. (b) The reply option was: professional training and technical assistance centers. Period 2003-2005, % / innovators. (IBGE; 2007) Chile: cooperation for innovation activities. Year 2004. % / innovators. (INE; 2008) Colombia: companies were asked about the existence of relations with agents who provide technological services. Period 1999-2002. % / total of establishments. Pilot sample of the Survey of Technological Development 2 (EDT2). (OCyT; 2004) México: companies were asked about the institutions with which they developed innovation projects. (a) Universities include technological centers. % / innovations, year 2005. (INEGI; 2007) Uruguay: companies were asked about the existence of relations in the framework of innovation activities, with or without a formal cooperation agreement. (c) The reply option was: other companies. Period 2001-2003, % / innovations. (DICyT; 2006) Germany, Spain and France: % / innovations. (Eurostat 2008)
Having stated these reservations, it is observed that only a small
proportion of the firms of the countries of the region have developed cooperation agreements with S&T institutions and, although the percentages increase with regard to the links with the business chain, these continue to be low. In particular, it is important to highlight the links with clients and suppliers: only 4% of the Brazilian innovating firms and the same proportion of Chilean innovators declared having had cooperation agreements with clients and 4% and 6%, respectively, with suppliers. Between German and French firms these percentages reach 9% and 25% respectively.

30
These results draw attention to the extent to which, when a company
intends to innovate in process –which is what the expenditure structure would seem to indicate-, it seems coherent to expect it to link up with suppliers of equipment and machinery, with engineering training and research centers and even with competing companies. Once again, the results of the links for innovation show the contrary. Objectives
The surveys also ask about the objectives of cooperation, which could lead to improved understanding of these interactions and in this manner encourage greater links. For the countries for which comparable information is available (table 16) it is observed that the majority of links have the objective of obtaining information and the carrying out of training activities. The relevance stated for this last activity (training) seems to be contradicted by the low amount assigned to it within the innovation activities. The explanation could be found either in the low technological complexity or duration of the training, or in the exploitation of public incentives (free training), which leads to the establishment of links without monetary compensation by companies. Whatever the answer, it would seem convenient to proceed with the analysis of this phenomenon.
With regard to R&D activities, the percentages are notably low and except for the case of Brazil, these values are also low even if only the links with universities are considered (which are the institutions through which a large part of public expenditure on R&D is channeled). In fact, among Argentine firms only 2 out of every 10 firms that declared links have done so to carry out R&D activities and among the Uruguayans the relationship is of 1 to 10. The exception is provided by Brazilian companies although this category also includes rehearsals and tests.
Table 16: Objectives of cooperation (% of companies) With the NIS
Information Training R&D Argentina 84 58 21 Colombia 31 50 15 Uruguay 63 37 10
With Universities Brazil Wd Wd 38,0 Chile Wd Wd 5,1
Argentina: Period 1998-2001. % / linked companies. (INDEC; 2003) Colombia: companies were asked about the existence of relations with agents that provide technological services. Period 1999-2002. % / total of linked establishments. Pilot Test of the Survey of Technological Development 2 (EDT2). (OCyT; 2004) Uruguay: Period 2001-2003, % / companies that were linked. (DICyT; 2006) Brazil: Period 2003-2005, % /of companies that were linked with universities and research institutes. (IBGE; 2007) Chile: cooperation for innovation activities. Year 2004. % / innovators. (INE; 2008)
Sources of information
Taking up again the focus of Argentine and Uruguayan surveys, and if it is accepted that the link in an ample sense (with or without formal cooperation agreements) is an important aspects of the innovative dynamic,
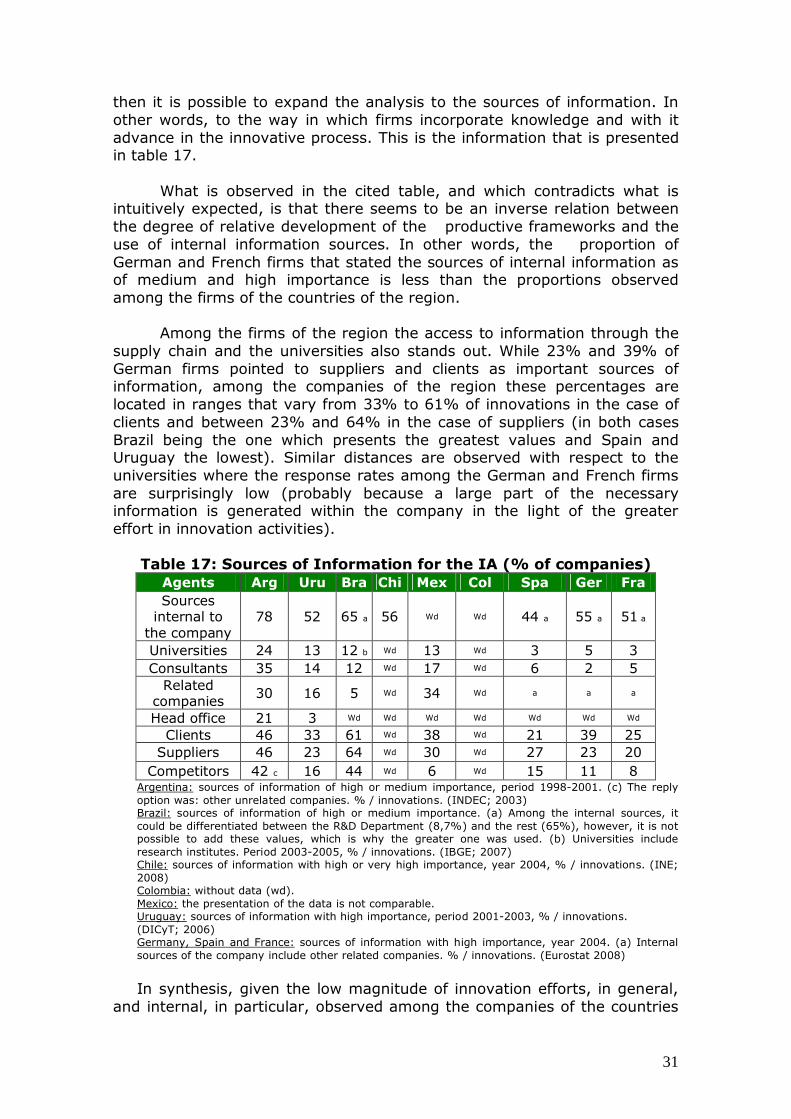
31
then it is possible to expand the analysis to the sources of information. In other words, to the way in which firms incorporate knowledge and with it advance in the innovative process. This is the information that is presented in table 17.
What is observed in the cited table, and which contradicts what is intuitively expected, is that there seems to be an inverse relation between the degree of relative development of the productive frameworks and the use of internal information sources. In other words, the proportion of German and French firms that stated the sources of internal information as of medium and high importance is less than the proportions observed among the firms of the countries of the region.
Among the firms of the region the access to information through the supply chain and the universities also stands out. While 23% and 39% of German firms pointed to suppliers and clients as important sources of information, among the companies of the region these percentages are located in ranges that vary from 33% to 61% of innovations in the case of clients and between 23% and 64% in the case of suppliers (in both cases Brazil being the one which presents the greatest values and Spain and Uruguay the lowest). Similar distances are observed with respect to the universities where the response rates among the German and French firms are surprisingly low (probably because a large part of the necessary information is generated within the company in the light of the greater effort in innovation activities).
Table 17: Sources of Information for the IA (% of companies) Agents Arg Uru Bra Chi Mex Col Spa Ger Fra Sources
internal to the company
78 52 65 a 56 Wd Wd 44 a 55 a 51 a
Universities 24 13 12 b Wd 13 Wd 3 5 3 Consultants 35 14 12 Wd 17 Wd 6 2 5
Related companies 30 16 5 Wd 34 Wd a a a
Head office 21 3 Wd Wd Wd Wd Wd Wd Wd Clients 46 33 61 Wd 38 Wd 21 39 25
Suppliers 46 23 64 Wd 30 Wd 27 23 20 Competitors 42 c 16 44 Wd 6 Wd 15 11 8
Argentina: sources of information of high or medium importance, period 1998-2001. (c) The reply option was: other unrelated companies. % / innovations. (INDEC; 2003) Brazil: sources of information of high or medium importance. (a) Among the internal sources, it could be differentiated between the R&D Department (8,7%) and the rest (65%), however, it is not possible to add these values, which is why the greater one was used. (b) Universities include research institutes. Period 2003-2005, % / innovations. (IBGE; 2007) Chile: sources of information with high or very high importance, year 2004, % / innovations. (INE; 2008) Colombia: without data (wd). Mexico: the presentation of the data is not comparable. Uruguay: sources of information with high importance, period 2001-2003, % / innovations. (DICyT; 2006) Germany, Spain and France: sources of information with high importance, year 2004. (a) Internal sources of the company include other related companies. % / innovations. (Eurostat 2008)
In synthesis, given the low magnitude of innovation efforts, in general,
and internal, in particular, observed among the companies of the countries

32
of the region, the access to external sources of information becomes a key input in the search for technological and organizational improvements. In this sense, in-depth analysis of the characteristics of the interactions of the national innovation system (including the regional innovation system) becomes a key input for the design of public policies.
A question that it would be worth trying to answer has to do with the motives that obstruct a greater –and better- interaction between the supply of and demand for knowledge. The scarce links between firms and universities and S&T centers in general could be due to the characteristics of knowledge generated in the second group vs. that which is demanded by the first group. However, it could also be the result of the particular shape of the institutional framework which generates asynchronies between suppliers and demanders (incentives of the investigators vs. times of the companies). Again, answering these questions is beyond the objectives of this document, nor will they be resolved only with surveys, however, it shows once again the importance of innovation indicators and the collection of this information in particular, to the extent that it is a key input for the design and implementation of innovation and cooperation policies. Obstacles to innovation
Based on what was observed with regard to the innovative process it could be stated that the analyzed Latin American firms show a low commitment to R&D and, what is even more serious, they carry out external modernizing innovative strategies (external acquisition of solutions with almost no endogenous effort), which is not compensated for with links with the rest of the national innovation system and that results in a reduced scope of the new products and processes developed. In this context, it is worth asking about the obstacles that they face, which would allow an understanding of where public policy should aim in order to contribute to the technological improvement of the productive framework.
In this respect, the questions of obstacles to innovation allow first the confirmation of the obvious: that the macroeconomic determinants have a significant weight in the direction of the efforts of the firms. The size of the market, the access to financing and, consequently, the cost of innovating are three of the motives most cited by the companies. To this is added, surprisingly, the difficulty of cooperating with other institutions (Table 18).
Public policy is also stated by an equal number of firms as a problem in the search for technological and organizational improvements: 42% of the Argentine firms, 24% of the Uruguayan, 45% of the Chilean and 61% of the Mexican firms. This data is not smaller in the light of the number of policies that have implemented in the last few years. This type of information could be accounting for flaws, either in the mechanisms of implementation, or in dissemination, or in the very design of public policies. The answer can only emerge from specific analyses, and in this sense information that is beyond the objectives of an innovation survey will be required. Nevertheless, this type of result should, necessarily, be incorporated into the evaluation of public actions.

33
Table18: Meso and macroeconomic obstacles (% of companies)
Arg Uru Bra Chi Mex Col Spa Ger Fra
Reduced size of the market
58 52 Wd Wd Wd Wd Wd Wd Wd
Structure of the market 55 Wd 24 a Wd 59 a Wd 22 a 5 a 18 a
Scarce dynamism of the technological
change of the sector 40 Wd Wd Wd Wd Wd Wd Wd Wd
Difficulties of access to financing
68 33 57 35 68 Wd 30 12 10
Scarce possibilities of cooperation with other companies/institutions
40 15 30 39 Wd Wd 13 3 11
Mesoeconomic or of the market
Facility of imitation by third parties 32 19 Wd 27 Wd Wd Wd Wd Wd
Insufficient information about
markets 27 Wd 31 60 Wd 10 3 7
Insufficient information about
technologies 22 Wd 36
23
59 Wd 1 11 5
Failings in the public policies of S&T
42 24 Wd 45 d 61 Wd Wd Wd Wd
Scarce development of the institutions related
with S&T 38 16 Wd Wd Wd Wd Wd Wd Wd
Physical infrastructure 29 Wd Wd Wd Wd Wd Wd Wd Wd System of intellectual
property 14 Wd Wd Wd 62 Wd Wd Wd Wd
Macro and metaeconomics
Innovating cost Wd Wd 80 54 Wd Wd 44 19 30 Argentina: Period 1998-2001. % of companies that assigned medium and high importance / total panel. (INDEC; 2003) Brazil: Period 2003-2005. % / innovators. (a) Lack of response of the consumers. (IBGE; 2007) Chile: year 2004. (d) Lack of government incentives. % / innovators. (INE; 2008) Colombia: without data (wd). Mexico: (a) Lack of receptivity of customers. % / total panel, year 2005. (INEGI; 2007) Uruguay: Period 2001-2003, % / innovatives. (DICyT; 2006) Germany, Spain and France: year 2004. (a) Uncertainty regarding the demand of innovative goods. % / innovatives. (Eurostat 2008)
At the microeconomic level, the obstacles that stand out are related
to the lack of trained personnel and the aspects associated with the amortization of investments. These last ones are strongly determined by a macro scope, which leads to a reduction of the planning horizon of firms. Various authors have shown the impact of macroeconomic instability on innovation processes (Ocampo, 2005; Porta and Bonvecchi, 2003; Dosi, 1988, Kosacoff and Ramos, 2006). The contexts of uncertainty and high vulnerability have a direct impact on the investment decision making processes (Kosacoff and Ramos; 2006). Thus, for example, the macroeconomic contexts of high uncertainty reduce the cost of delaying investment versus the expected benefits. In this way, strategic decisions or more long term technological development projects are postponed. If to this we add the uncertainty of the innovation processes themselves, the risk perceived by the economic agents can widely exceed the expected benefits.

34
With regard to the lack of qualified personnel, the high percentage of firms that assigned importance to this obstacle is surprising: among the firms of the Latin American countries the values vary between 18% and 61% while among the European countries the percentages are in the range between 5 and 17% (the response of Spain, in this case, conforms more closely to the European pattern) (Table 19).
Table 19: Microeconomic obstacles (% of companies)
Argentina: Period 1998-2001. % of companies that assigned medium and high importance / total panel. (INDEC; 2003) Brazil: Period 2003-2005. % innovators (IBGE; 2007) Chile: year 2004. (a) Technical risk. % / innovators. (INE; 2008) Mexico: % / total panel. (INEGI; 2007) Uruguay: Period 2001-2003, % / innovatives. (DICyT; 2006) Germany, Spain and France: year 2004. % / innovatives. (Eurostat 2008)
Given the low effort in training and the high percentages of firms that
were linked for these activities, what these indicators could be reflecting is a demand for public policies oriented towards the training of human resources or the need to improve the knowledge which is being provided by the mid-level and graduate training institutions. At the same time, it is also possible that the high percentage of answers in this indicator is the logical consequence of the crises which affected the Latin American countries during the last decade. With a greater or lesser degree of severity, the macroeconomic crises that took place in the region led to the fall of industrial activity and with it to the fall in the rate of enrolment in related careers (Lugones et.al.; 2005). This is a fact that is not reverted in the short term and, thus, should be carefully monitored to avoid the bottlenecks that could emerge from the gap between industrial growth and the growth of the professionals in careers associated with these activities. The micro-macro relationship
While the macroeconomic policies of recent years have contributed to the objective of achieving stability, and the current international context is favorable for the development of the Latin American countries, 29 it is 29
During recent years, the terms of exchange have been favorable for the countries of the southern region of Latin America resulting in the possibility of generating an accumulation of unforeseen extraordinary income (the balance of the change in the terms of exchange for the rest of the region is not so clear). In principle, although the region as a
0 10 20 30 40 50 60 70 80
Arg Uru Chi Bra Mex Spa Ger Fra Lack of trained personnel Risk of innovating (a) Return period

35
essential to pay attention to the obstacles identified by firms –even the fact that the reply options remain the same as 10 years ago (when the context was completely different)-. Thus, the business obstacles and those associated with the sector’s development are showing the need for horizontal as well as vertical policies that specifically tend to improve the competencies and encourage innovation in the firms. Nevertheless, the perception of businessmen regarding these policies reflects the importance of the evaluation and impact measurement mechanisms of the implemented actions.
Another matter that emerges is that, beyond the macro-economic impact, there is a margin for advancing on a path of sustained development. It is evident that the rational response of the businessman who operates in a context of macroeconomic uncertainty and volatility will seek to minimize the risk, even eliminate every “expendable” risk such as that associated with technological innovation, which also requires minimum thresholds of competencies (to develop it) and of scale (to amortize it). This also, of course, in a context of restricted access to credit such as the one that characterizes the region.
However, when, beyond the conclusions that emerge from the major aggregates set out here, the analysis of business conduct is studied in depth, different innovative business paths are observed even within the same productive sector. In fact, there are companies which, even in the previously described context, would seem to be gambling on innovation as a means to compete and expand. For some reason, in this group of firms there are incentives that weigh more than the traditional macro determinants. Their existence, once again, takes into account the heterogeneity that is present in the local productive framework and of the possibility of choosing genuine and sustainable competitive strategies, beyond the macroeconomic volatilities. II-III - Heterogeneous innovative paths
As was mentioned in previous sections, the technological paths imply lock-in and path dependence processes, which imply that the past innovation decisions impact the range of possibilities of current decisions. (López; 1996) At the same time, the fact of finding within the region companies with different levels of technological complexity and scale recognizes the historic heterogeneity present in the Spanish American countries, even among the Latin Americans (Katz, 2000).
The carrying out of business innovation surveys has also permitted progress in the understanding of this heterogeneity, giving rise to the importance of the carrying out of complementary microeconomic analyses and the need to establish company categories that go beyond the traditional
whole will not be remote from the consequences of the economic crisis unleashed during 2008, there are probabilities that this can be strengthened in the reordering that will occur afterwards. Evidently, this possibility will not occur automatically, nor will it be the same for all of the countries.

36
taxonomies. Here we will present only a synthesis for two countries of the potential of this line of analysis, on the basis of which it will be seen that the classification by technological intensity hides high intensity activities in sectors of low intensity and vice versa. It will also be seen that, even within innovative firms, there are different behaviors that lead to differential results and impacts. Finally, it is intended to show the importance of the analysis of innovation linked to the search for competitiveness.
BOX 2
The relevance of innovation surveys to understanding competitive business strategies
Gustavo Lugones (Centro Redes – UNQ) The evidence obtained from the innovation surveys as well as from the competitiveness studies carried out in the region, allows some basic conclusions to be drawn:
1. not all of the competitive business strategies grant a central space to innovative efforts, despite which, the market does not always condemn these firms to a rapid disappearance from the scene; what is more, there are more than a few companies that are able to stay in competition for several years without introducing innovations; this appears as one of the most important differences between the reality of our region in relation to what is observed in the first world;
2. in contrast, innovative firms, even in our region, are the ones which achieve better results in the medium and long term;
3. innovative firms are also the ones that show the best “backbone” to face unfavorable circumstances;
4. there are palpable differences, as is clearly shown in the present work, in competitiveness as well as in the quality of employment and salary level, according to the specific strategy adopted by the innovative firms, with clear advantages for at least, three cases: a) those that present a greater intensity in expenditure on innovation; b) for those who combine balance with continuity in their efforts and c) for those that aim at product differentiation.
These observations have certain implications in relation to the methods and the procedures for the measurement of innovative processes. If the type of innovative strategy that prevails between the companies of one country can make significant contributions in the search for greater solidity of its external sector and of a real and sustainable improvement in the average income of the population, concepts already emphasized in the Manual of Oslo and Manual of Bogotá are reinforced even more with regard to the advantages of adopting the focus of subject over object in innovation surveys. As we know, the first focus does not evade the measurement of results (focal point of the object of focus) but it pays special attention and aims to obtain the greatest degree of detail possible with regard to the efforts and the relationship building faced by innovative companies, which not only allow the strategies of the firms to be distinguished (like the ones already mentioned or other possible ones) but also contrast the result indicators with those of effort in order to enrich the analytical possibilities offered by the surveys.

37
In fact, the interpretation of the meaning of the rate of innovators over the total (and of the type of prevailing innovation) or of the achievements in terms of patents or other results of the efforts carried out, is benefited and strengthened by contrasting these with the actions (and the expenses) carried out by the companies with regard to the activities of R&D, management of human resources, acquisition of embodied and disembodied technology, links with other agents of the system, etc. From the point of view developed here and in relation to a certain controversy between the specialists in the construction and/or use of innovation indicators regarding these matters, much better than continuing to cast doubt on the usefulness of the result indicators that our surveys allow us to build and more useful than debating how to achieve a better definition of the innovation concept (which should necessarily be accepted on a global scale) is to recognize the weaknesses of the definition in use and, therefore, the need to strengthen the collection of data relative to the innovative links and activities carried out by companies, as well as the determinants thereof and the obstacles that they must face in this sense, to achieve a better use of the elements of judgment provided by the innovation surveys.
In the case of Argentina, and using in a combined manner the second and third innovation surveys (INDEC, 2003 and 2006), Lugones et.al. (2008) analyze the evolution of innovative firms between 1998 and 2004 based on three classification criteria: intensity (measured as the expenditure per employee), the balance of this expenditure (the structure) and the systematic nature (the continuity) of the IA efforts. The authors observe that where intensity is greater the positive impact of innovation is greater in terms of sales and productivity of employment, but also in terms of salaries paid to workers.
A synthesis of the results is presented in tables 20 and 21. In the first place it is observed that a positive relationship exists between intensity and the growth rate of sales and average salary, which recognizes the need to increase the efforts in these activities. In the second place, although every increase in intensity generates positive impacts in the firm (increase in productivity), not every increase is equally positive in terms of salaries. While among the non-continuous biased firms (those that do not carry out a balanced investment between the different innovation activities) of medium and high intensity the average salary is U$S621, among the continuous balanced companies of similar intensity this value is 40% more (U$S 870). Similar conclusions emerge from combining the three criteria: among the continuous balanced companies the indicators present greater values than among the continuous biased companies.
Table 20: Productivity, Salaries and Innovative Intensity of
Argentine industry
Null Intensity
Low Intensity
Medium Intensity
High Intensity
Annual productivity growth rate (%) -0,67 0,02 2,01 4,01
Average salary (U$S) 451,4 517,7 588,1 807,62 Expense in IA / Sales
(%) 0,0 0,3 1,4 3,9
Null Intensity: firms without expenditure on innovation (non innovative). Low Intensity: firms that have assigned between $300 and $700 of IA expenditure employee per year.

38
Medium Intensity: firms that have assigned between $700 and $1400 of IA expenditure per employee per year. High Intensity: firms that have assigned more than $1400 of IA expenditure per employee per year. Annual Productivity growth rate: quotient between sales and employment, average annual growth rate period 1998-2004, constant values 1998. IA Expenditure / Sales: quotient between IA expenditure and sales, accumulated 1998-2004. Average salary: year 2004 in U$S per month. Source: Lugones, Suárez, Moldován (2008)
Table 21: Growth of productivity and average salaries according to the innovative behavior of Argentine firms
Annual growth rate of productivity (%) Continuous Non continuous
Balanced 4,3 1,9 Biased 3,1 3,0 Average salary (U$S)
Continuous Non continuous Balanced 870 704
Biased 745 621 Companies of medium and high intensity. Balanced: companies with balanced expenditure between the different areas, which combine the acquisition of embodied technology with internal knowledge development. Biased: companies with expenditure concentrated on the acquisition of capital goods, or with low level of efforts in the acquisition of external technology. Continuous: companies that made efforts in IA during the 7 years of the analyzed period. Non continuous: companies that made efforts in IA but not during every year of the analyzed period. Annual growth rate of Productivity: quotient between sales and employment, average annual growth rate period 1998-2004, constant values 1998. IA Expense / Sales: quotient between IA expenditure and sales, accumulated 1998-2004. Average salary: year 2004 in U$S per month. Source: Lugones, Suárez, Moldován (2008)
The authors also analyze the sectorial importance regarding the impacts of innovation based on the intensity criteria. Table 22 presents the distribution of the firms by innovative intensity but distinguishing between six productive sectors: Food, Textile and clothing, ICTs, Petrochemicals, Metalworking and Automotive. It is observed that there are firms from every productive sector in each one of the categories of intensity, which implies that in every productive sector it is possible to find firms of high and medium technological intensity, firms that pay higher salaries and that achieve greater levels of productivity. This leads to two questions which cast doubt on the pertinence of the classification based on technological intensity: first that there are firms, within the sectors catalogued as being of high technological intensity (ICTs), with low innovative intensity –in other words, firms in which innovation does not seem to be the main competitiveness strategy-; second, that even in the traditional sectors it is possible to find firms that bet on innovation. The latter is of great importance for the countries of the region to the extent to which a large part of its productive structure corresponds to the denominated sectors of low and medium-low technological intensity.
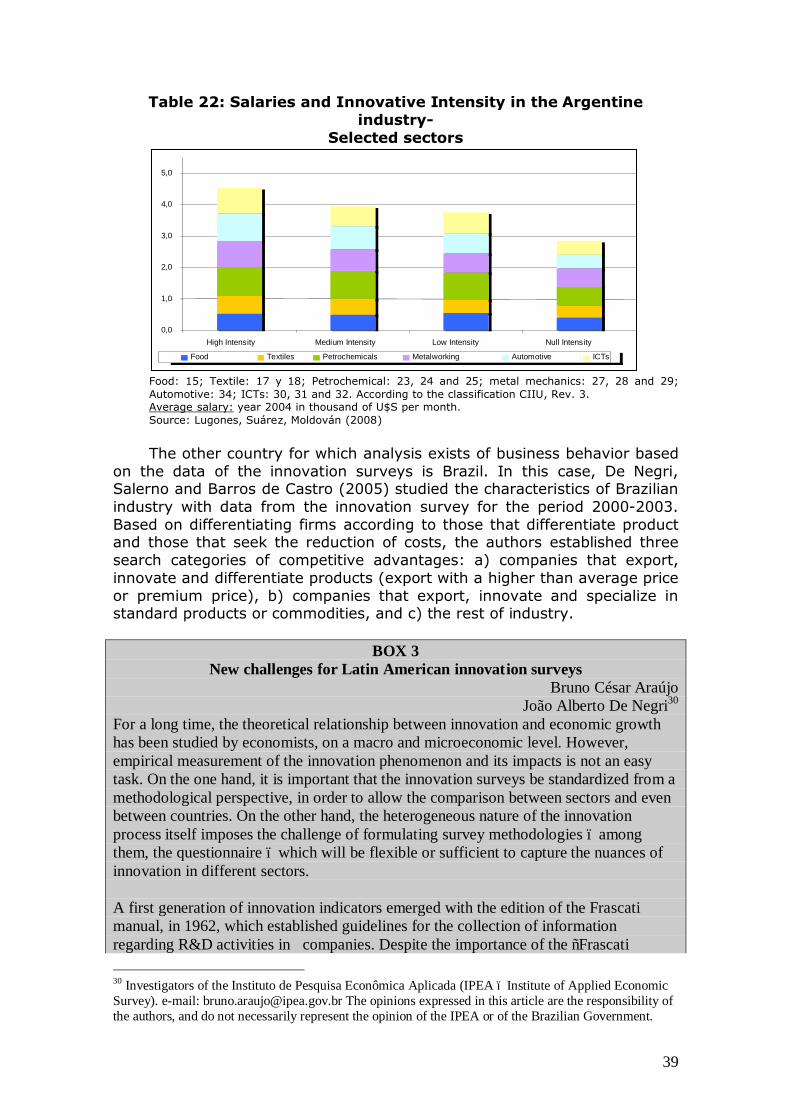
39
Table 22: Salaries and Innovative Intensity in the Argentine industry-
Selected sectors
Food: 15; Textile: 17 y 18; Petrochemical: 23, 24 and 25; metal mechanics: 27, 28 and 29; Automotive: 34; ICTs: 30, 31 and 32. According to the classification CIIU, Rev. 3. Average salary: year 2004 in thousand of U$S per month. Source: Lugones, Suárez, Moldován (2008)
The other country for which analysis exists of business behavior based
on the data of the innovation surveys is Brazil. In this case, De Negri, Salerno and Barros de Castro (2005) studied the characteristics of Brazilian industry with data from the innovation survey for the period 2000-2003. Based on differentiating firms according to those that differentiate product and those that seek the reduction of costs, the authors established three search categories of competitive advantages: a) companies that export, innovate and differentiate products (export with a higher than average price or premium price), b) companies that export, innovate and specialize in standard products or commodities, and c) the rest of industry.
BOX 3 New challenges for Latin American innovation surveys
Bruno César Araújo João Alberto De Negri30
For a long time, the theoretical relationship between innovation and economic growth has been studied by economists, on a macro and microeconomic level. However, empirical measurement of the innovation phenomenon and its impacts is not an easy task. On the one hand, it is important that the innovation surveys be standardized from a methodological perspective, in order to allow the comparison between sectors and even between countries. On the other hand, the heterogeneous nature of the innovation process itself imposes the challenge of formulating survey methodologies – among them, the questionnaire – which will be flexible or sufficient to capture the nuances of innovation in different sectors. A first generation of innovation indicators emerged with the edition of the Frascati manual, in 1962, which established guidelines for the collection of information regarding R&D activities in companies. Despite the importance of the “Frascati 30 Investigators of the Instituto de Pesquisa Econômica Aplicada (IPEA – Institute of Applied Economic Survey). e-mail: [email protected] The opinions expressed in this article are the responsibility of the authors, and do not necessarily represent the opinion of the IPEA or of the Brazilian Government.
0,0
1,0
2,0
3,0
4,0
5,0
High Intensity Medium Intensity Low Intensity Null Intensity Food Textiles Petrochemicals Metalworking Automotive ICTs

40
family” (as the OECD surveys of indicators based on this manual became known), to approach the innovative process on the basis of inputs - notably R&D – was shown to be inadequate to capture the innovation process in some sectors, which use other business and knowledge management processes to innovate. However, until now many countries, especially those of the OECD, continue to carry out investigations based on the Frascati manual. In 1990 the Oslo manual was also edited by the OECD, which represented a great methodological evolution with regard to the Frascati manual. The approach proposed by the Oslo manual allowed the collection of not only a variety of inputs and innovative activities, but also their impacts on the performance of the company in terms of generation of knowledge. The Oslo manual is revised regularly, the last edition being that of 2005. In Latin America, the Oslo manual forms the basis of the Brazilian Technological Innovation Survey and the Mexican National Innovation Survey, for example. Since the mid 90s, the Red Iberoamericana de Indicadores de Ciencia y Tecnologia (RICYT – Latin American Network of Science and Technology Indicators) organized a series of conferences seeking the adaptation of the Oslo manual to the realities of Latin American companies. According to the RICYT, the decade of the 90s produced important changes in the productive structure of Latin American countries, which had a perceptible impact on the technological behavior strategies of the companies in the region. The innovation surveys carried out in Latin America catalogued some common patterns, which are: (i) the preference for the formation of informal networks of knowledge for innovation; (ii) the preference for external sources of knowledge for innovation, whether by means of technological services (most common strategy among large and transnational companies), or by the acquisition of technology incorporated in capital goods (common strategy in all types of companies); (iii) low degree of consolidation and integration between the firms and their surroundings from a technological perspective, as well as relatively weak National Innovation Systems.** In this sense, the RICYT consolidated the guidelines for the collection and interpretation of innovation in Latin America in the so called Bogotá Manual, in 2001. However, it is important to note that the Bogotá Manual is compatible with the Oslo Manual, which allows international comparisons. This manual inspires, for example, surveys such as the National Survey of Technological Innovation and Behavior of Argentine Companies. However, the work of the different investigators of the region with innovation surveys has revealed different challenges, related to the collection of information and the interpretation of the indicators. With regard to the collection of information, we propose three challenges: - the collection of information related to the innovation phenomenon in the service sector, in spite of the fact that the economic theory is not as established in this respect as in the case of innovation in manufacturing. In the meantime, it must be remembered that the service sector is gaining a growing importance in the region and in many countries of Latin America (among them, Brazil) national surveys of innovation in services are not yet being conducted; - consider non-technological innovation, of fundamental importance for the service sector as well as for some industrial sectors, especially in Latin America;

41
- collect information related to the complete questionnaire also for the companies that did not innovate and did not attempt to innovate, especially those related to the perceived obstacles to innovation. On the side of the outputs of innovation, in which the low innovation rates in Latin American countries are a burden in comparison with European countries, this difference is probably greater considering the degree of innovativeness of the innovations reported in the surveys. It is sufficient to think that, hypothetically, if a Latin American company spends ten years with the same productive process and acquires a new machine, there is a great chance that this company will be a process innovator. If this machine allows a modification of the product, this company will also be a product innovator. According to the criteria of the Oslo manual, this company will be as innovative as a company that develops new products based on R&D. This example serves to illustrate that blind and out of context reading of the binary innovation outputs can lead to errors of analysis. In this sense, if the challenge of considering innovativeness involves matters related to the collection of information, it involves even greater interpretation of indicators. A way to escape from this trap is the combination of innovation indicators between themselves and of these indicators with others related to the performance of companies. Naturally, the use of more than one indicator reduces the chances of an error of characterization of innovative performance of a firm. Nevertheless, more importantly, this combination not only provides a way of capturing a degree of innovation but also competitive strategies and knowledge accumulation patterns. The combination of the indicators can be statistical, product of multiple techniques such as the analysis of main components or factor analysis, or it can be determinant, based on well defined theoretical criteria. By way of example, the second line of combination of indicators is a line adopted in the investigation projects of IPEA in the area of international comparisons, corroborated until now in the books Technological Innovation in Brazilian and Argentine Firms*** and Technological Innovation in Brazilian and Mexican Firms.**** Both books employed a classification of companies according to their competitive strategies with regard to technological innovation. The classification created enabled us to distinguish and analyze thee basic competitive strategies of Latin American companies as a reaction to the economic opening in the 90s, based on key indicators: (i) Firms that react proactively, investing in technological innovation and differentiation of products as a competitive strategy; (ii) firms that only carry out partial adjustments in the productive processes in order to compete with imported products, mainly through the acquisition of machinery and process innovations; (iii) firms that are less innovative and less productive, that survive operating on a generally inefficient scale and exploring local markets, usually exploiting low cost labor advantages. In a certain sense, this classification is related to the classification of Katz between defensive or offensive business attitudes to increase competitiveness.***** In summary, the comparison carried out by the IPEA revealed substantial differences between Brazil, Argentina and Mexico with regard to industrial structure, going far beyond traditional comparisons based on innovation rates or the relation of R&D/Sales. These are only some of the challenges and alternatives for innovation surveys in Latin America. Certainly, many others will emerge to the extent to which the use of these surveys is disseminated among specialists. In conclusion, guaranteeing that these

42
changes, when they are carried out, do not compromise the comparability between countries and between versions of the same survey, is as important as the development of innovation surveys from a methodological perspective.
From the analysis of these three groups, the authors concluded that the firms that differentiate product (group a) are the ones that simultaneously achieve better performance indicators (production, productivity, exports) combined at the same time with a better quality of employment (stability and remunerations). As can be observed in table 23, the differentiating firms present work productivity levels 1,67 times higher than the firms specialized in commodities and 4,43 times higher than the rest. This differentiation is also observed with regard to the salaries paid and the stability in the workplace. Among the differentiators, the monthly salary is U$S 519,6 and the average time employed is 54 months vs. U$S 310,2 and U$S 178,6 and 44 and 35 months for the salary and time employed among the companies specialized in commodities and the rest, respectively.
Table 23: Competitive strategies of Brazilian industry
Productivity Salary Time employed
Innovate and differentiate products 30.690 519,6 54,09
Specialized in commodities 18.347 310,2 43,9 Others 4.142 178,6 35,41
Productivity: year 2000, quotient between sales and employment, in current U$S. Average salary: year 2000 in U$S per month. Time employed: year 2000, months of permanence in the firm. Source: De Negri et al. (2005).
As in the Argentine case, the authors also find three types of
strategies in the different productive sectors. This recognizes, once again the possibility of a company differentiating itself from the competition even in those sectors that are defined by the production of standardized goods. As can be observed in table 24, in all of the areas there are firms that differentiate, as well as, in the most dynamic sectors there are firms which export non-differentiated goods. This shows that, at least in the case of the countries of the region, the firms of high technological intensity are not necessarily capable of pushing an increase in the added value of the goods.

43
Table 24: Competitive strategies of Brazilian industry – Selected sectors
Companies with more than 30 occupied persons, year 2000. Source: De Negri et al. (2005).
Now then, despite these favorable results, in both works it is
observed that the “virtuous” groups are formed by only a reduced number of firms within the industrial framework. In the case of Argentina, even dealing with a sample biased towards the firms with better performance (since they emerge from the connection of two innovation surveys, the first one of which covers one of the country’s worst recessions), the firms of medium and high intensity, with balanced and continuous expenditure represent 8% of the sample, but they account for 17% of the total sales and 12% of the employment in 2004. In the Brazilian case, the authors maintain that the group of virtuous firms is equivalent to only 1.7% of the total of the Brazilian industrial fabric, but which concentrate 26% of total industrial production and 13.2% of industrial employment.
These reduced groups of firms show on the one hand, the need to study in greater detail the innovative behavior of the firms, to the extent to which not every innovative firm generates equally virtuous outpourings, individually and collectively. In other words, it is necessary to know the characteristics of the efforts and the evolution in terms of performance and evolution of employment.
On the other hand, it implies that there are cases that elude the aggregated results that emerge from the traditional innovation indicators. In other words, these companies operate in the countries of the region, in the same surroundings that lead to expect lower indicators than for developed countries. The different behavior of these firms also responds to the maximizing logic of the representative businessman, but in this case what seems to be of great importance is the Schumpeterian enterprising spirit. As was mentioned, this different behavior implies that, for some reason, in this group of firms incentives exist that weigh more than the traditional macro determinants. As a result, the analysis of the behaviors will allow progress in understanding the “good national practices” so as to expand the group of virtuous firms.
0%
20%
40%
60%
80%
100%
Innovate and differentiate products
Specialized in commodities
Others
Agro-industry Textiles and Footwear Chemicals Metalworking Electronics Others

44
III – Summary and Conclusions
Although the linear model has long been criticized, and has even been superseded within the academy, even today an indicator originated under its logic as the best proxy of innovation is still used: that of intensity in research and development expenditure (R&D/GDP).
In general terms, this is comprehensible since in a first approximation to the innovation system (in the case of this text of the Latin American countries) the idea that can be obtained on the basis of this analysis is reasonably accurate. Countries with low levels of expenditure on science and technology tend to possess weak and scarcely articulated national innovation systems.
By the way, as was observed, the R&D indicators for the region show a low expenditure on R&D, far from the values that the developed countries invest (in relative as well as absolute values), scarce human resources (badly remunerated) and a greater effort by the public sector (in other words, a weak investment in the area by the private sector).
When attention is focused on innovation activities, it can be confirmed that this approximation is very accurate, since the surveys indicate that expenditure on innovation activities is low, strongly biased towards the acquisition of embodied technology (in other words, a low realization of R&D), with a predominance of process over product innovations. All of this in a framework of few links with the surroundings, indicating the weakness of the framework of the system.
However, this simplification of the analysis (the roots of which originate from the linear model) does not contribute to understanding the complexity of the innovation processes, and loses nuances, degrees of comprehension and margins for maneuver for the design of policies (finally, the last objective that motivates the systematic collection of information and statistics).
The innovation surveys seek not only a more in-depth comprehension of the phenomenon, but also to contribute to establishing what type of competitive strategy exists in the productive complex, pointing out the most virtuous ones, and attempting to contribute elements for their dissemination to the environment.
In this sense, although the theory of the innovation system tends to use the national level as a unit of analysis, with certain debates regarding the need to focus its location on a more local level at the time of defining innovation policies –with some variants that highlight the fact that certain dynamics do not necessarily respect national frontiers-, it is important to understand that, from the perspective of the user, each company/economic organization “builds” its own system, which is a specific cutting of what has been defined legally/institutionally as “the national or local”31, thus building
31
When the businessman defines, as a user of the system, his own strategy, he does not possess a vision of the total group of options (for example, he is unaware of the existence of certain public aid instruments), nor can he access all of the opportunities that the system offers (for example, the need for a certain scale to make use of certain opportunities), for which reason the design of his possible strategy is limited and is not necessarily adjusted to the reality that is generally described from the theory when the national/local innovation systems are defined.
45
a particular strategy that goes beyond what is observed in the system as a whole.
Soon after analyzing the group of activities that “contribute” to innovations and their specific fields of application, one realizes that they do not correspond exclusively to the traditional areas of science and technology; incidentally, the incorporation of capital goods (generally related to imports, tariffs and exchange rates) responds to the incentives that are generated from the specific and/or general macroeconomic measures that depend on the areas of economy; the training of labor (initial and subsequent) responds to the areas of education and work. When you pass from the concept of science and technology to that of innovation (and the impact is evaluated more than the effort), the implementer of public policy moves from the areas of science and technique to that of economy.
Faced with this type of effort and focus, it is important to ask how the users perceive this vision of the national innovation system (NIS). In the first place, it is difficult for all of the users to be fully aware of what occurs in the NIS. The identification of the actors of the system, the supply of technologies available (in their various forms), the availability of technical capabilities to resolve specific problems, the catalogue of investigation projects that each one of the agents is developing (with an approximation to the expected results) and the existence of other economic agents with similar, equal or concurrent concerns, are the limits that each one of the users has at the moment that it participates in and is related to an NIS.
In the framework of this scheme, the businessman develops a behavior in which innovation is a tool to achieve his economic objectives. Given the nature of the agents, in the analyzed cases it is a mechanism with an almost exclusively private bias; the innovative efforts are developed, adapted and disseminated based on private concrete and specific needs, determining particular and individual strategies, which have no need to coincide with those of the surroundings or, what is worse, with what is “sociably desirable”. Often, these are conditioned by the search for greater competitiveness, it being, finally, the market which evaluates the behaviors and performances. It is a systematic perspective of the processes of generation and dissemination of technologies that uses a notion of system based less on hierarchies and formalities and more on functional relations, pre-established routines and the diffuse hierarchies: evaluation is translated into the performance of the group in the market.
Companies, it is clear, do not form a unique integrated system on a national level, but a multiplicity of systems, with another multiplicity of strategies, that can cross and interact -or not-, leading to the study of other dynamics, but the reality that affects a company, in the innovative sense, is strongly determined by the system that it forms part of –which should not be exclusively understood as the national-,32 which will work in favor both of the design as well as the success of the strategy that is formulated. All of this heterogeneous whole should be considered at the time of designing
32
In some cases, it is even foreseeable to observe that the system that has the greatest influence over the conduct of the company is determined by the global chain that it forms part of rather than the conditions of the surroundings on a local level, transcending, in this case, the national frontier.

46
policies and searching for solutions in the need to define in advance the objective of the policy (who it is intended to benefit).
In second place, in very few cases are the requirements of the users explicit, (they generally refer to symptoms of problems more than to concrete matters); and they are often formulated using a different language and methodology than those employed by the suppliers of the system (whether it is those who formulate the policies or those who generate the offer of knowledge), especially with regard to public institutions. It is important to add to all of this the usual asynchronies in the time between the generation of technology –or the achievement of innovations- and its concrete use -the time of generation of knowledge is not generally congruent with the urgencies faced by the companies, which is why the decisions, at the time of choosing different innovations, are strongly conditioned by the time factor (Anlló, Bisang, et al, 2008).
Evidently, all of these complexities cannot be addressed –or be expected to be solved- based only on the innovation surveys, but the surveys are a necessary condition to be able to advance in the right direction.
As can be deduced from this document, based on the information gathered by the surveys different groups of companies were identified –which underlines the existing heterogeneity in the manufacturing sector in the region-. Among them, the identification of some companies that meet characteristics of virtuous and balanced strategies are highlighted, those that do not respect geographical parameters nor sectorial belongings, thus showing that, despite the unfavorable conditions of the surroundings, and the conditionality that high macroeconomic volatility imposes on the formulation of strategies, characteristic of this country, it is possible to face up to successful dynamic competitive strategies that go beyond mere modernization. Of course, this, in turn, raises two matters: it is not possible to establish how many companies failed following strategies similar to these (only those who survived can be studied, since the others are no longer here to tell their story), which leads to the second, it is not known how transferable and expandable to the group the identified virtuous strategies are.
On the other hand, unless there is investment in innovation, it does not seem logical to expect a change in the productive structure. Only to the extent to which firms choose a competitive strategy based on the search for technological and organizational improvements, will they be in conditions to compete in markets for goods of greater added value. Of course, it is not the objective of this document to proceed with the analysis of the determinants, or even of the possible answers to the proposed questions, however, this type of analysis is what is required to rethink the growth and development scheme of the region, which at the same time recognizes the importance of having indicators of innovation and statistics that complement its analysis. It is also evident that a minimum group of comparable indicators capable of establishing relative positions and identifying similar situations will be required. Having comparable information, international and intertemporally, is what permitted the preparation of the analysis presented here and, despite

47
the limitations observed throughout its comparison, this was only possible because a minimum level of consensus exists. In this sense, the path traveled is not to be sneered at. The way ahead would seem to lie in the search for greater similarities in terms of indicators but also in the search for new and better forms of quantifying reality. The danger that should be avoided is that of converting the construction of indicators into an end in itself and the design of policies into an automatic mechanism in search of the leveling of those same indicators which gave rise to it. The theoretical approach presented here recognizes the importance of heterogeneity and the impossibility of repeating experiences. On the contrary, only to the extent to which it is learned to differentiate specifics from generalities, and results from processes, will it be possible to advance in the development of a statistical system capable of providing answers to public and private demands. The policy, on its part, should advance towards the identification and exploitation of those cases in which innovation not only constitutes a competitive strategy but, also, a way of achieving more equitable and sustainable development.

48
Annex 1
General characteristics of the surveys
Reference period
Institution responsible
Sample Unit of analysis
Argentina 2002-2004 INDEC 1.688 Manufacturing company
Brazil 2003-2005 IBGE 12.000
(extractive and manufacturing)
Company with more than 10
occupied persons*
Chile 2003-2004 INE 2.877 (includes activities CIIU
rev.3 A-O)
Establishment with more than
10 occupied persons*
Colombia 1999-2002 OCyT/DNP 101 Manufacturing establishment
Spain 2002-2004 INE/EUROSTAT 80.957*** Companies with more than 10 employees*
Mexico 2004-2005 INEGI 328.718**
Establishments with more than 50 employees
Uruguay 2001-2003 INE 814
Manufacturing companies with 5
or more employees
Germany 2002-2004 INE/EUROSTAT 101.199***
Companies with more than 10 employees*
France 2002-2004 INE/EUROSTAT 86.547***
Companies with more than 10 employees*
*For this study, the values for the manufacturing companies will be analyzed. **Economic Census 2004, where an innovation module was included. ***Expanded values.
49
References
Amable, B., Barré, R. y Boyer, R. (1997), Les sytèmes d'innovation à l'ère de la globalisation, Paris, Economica.
Anlló, G. y Raffo, J. (1999); “La necesidad de normalizar los indicadores de innovación en América Latina”; Indicios Nº 10/11, Diciembre, RICYT, Buenos Aires.
Anlló, G.; Bisang, R.; Albornoz, I y Campi, M. (2008) Innovación y Competitividad en Tramas Globales, Documento para la Secretaría Ejecutiva de la CEPAL, Santiago de Chile, (en prensa)
Boyer, R. y Freyssenet, M. (2001). Los Modelos Productivos, CEIL-PIETTE/CONICET; Lumen Humanitas, Buenos Aires.
De Negri, J. A., Saleno, M.S. y Barros de Castro, A. (2005). Innovações, padrões tecnológicos e desempenho das firmas industriais brasileiras. Innovações, padrões tecnológicos e desempenho das firmas industriais brasileiras. D. N. y. S. (eds). Brazil, IPEA.
DICyT (2006). La innovación en la Industria Uruguaya 2001-2003. II Encuesta de Actividades de Innovación en la Industria, Dirección de Innovación, Ciencia y Tecnología para el Desarrollo, Ministerio de Educación y Cultura. DICyT-INE-PDT. Uruguay, 2006.
Dosi, G. (1988). "Sources, Procedures and Microeconomic Effects of Innovation." Journal of Economic Literature, núm. 26.
EC (2008). Science, technology and innovation in Europe. Eurostat Statistical books, European Commission, ISBN 978-92-79-07801-9. Luxemburgo.
Edquist, C. (2001). "Systems of Innovation for Development (SID)." Background Paper for Chapter I: "Competitiveness, Innovation and Learning: Analytical Framework" for the UNIDO World Industrial Development Report (WIDR).
Eurostat (2008). Community Innovation Survey -CIS4, Eurostat, New Cronos; 2008. www.epp.eurostat.ec.europa.eu.
Fajnzylber, F. (1989). ""Industrialización de América Latina: de la 'caja negra' al 'casillero vacío"." Cuadernos de la CEPAL Nº 60.
Freeman, C. (1982). "Schumpeter or Schmookler?" "Unemployment and Technical Innovation. A study of Long Waves and Economic Development". C. Freeman, J. Clark and L. Soete. Londres, Pinter.
Freeman, C. (1987), Technology Policy and Economic Performance: Lessons from Japan. Pinter, London.
IBGE (2007). Pesquisa de Innovaçao Tecnológica 2005, Instituto Brasileiro de Geografia e Estadística - IBGE - Financiadora de Estudos e Projetos - FINEP - Ministerio da Ciência e Tecnología. Brasil, 2007.
INDEC, (2003): "Segunda Encuesta Nacional de Innovación y Conducta Tecnológica de las Empresas (1998-2001)", INDEC - SECyT - CEPAL.
INDEC (2006). Encuesta Nacional a Empresas sobre Innovación, I+D y TICs. 2002-2004. Buenos Aires, Argentina, SECYT-INDEC. Argentina, 2006.
INE (2008). Resultados de la Cuarta Encuesta de Innovación Tecnológica 2005, Consejo de Innovación de Chile / Instituto Nacional de Estadísticas -INE. Chile, 2008.
INEGI (2007). Informe General del Estado de la Ciencia y la Tecnología 2007, Consejo Nacional de Ciencia y Tecnología - Instituto Nacional de Estadística y Geografía -INEGI. México, 2007.

50
Katz, J. (2000). ""Pasado y presente del comportamiento tecnológico de América Latina"." Serie Desarrollo Económico Nº75. CEPAL, Santiago de Chile, marzo de 2000.
Kline, S. and N. Rosenberg (1986). "An Overview of Innovation". "The Positive Sum Strategy: Harnessing Technology for Economic Growth". R. Landau and N. e. Rosenberg, National Academies Press, Washington D.C.
Knell, (2006), Uneven Technological Accumulation and Growth in the Least Developed Countries, Norwegian Institute for Studies in Research and Education -Centre for Innovation Research, UNCTAD, “The Least Developed Countries Report 2007”, Background Paper.
Kosacoff, B. and D. Ramos (2006). "Comportamientos microeconómicos en entornos de alta incertidumbre: la industria argentina." Documento de Proyecto, Comisión Económica para América Latina y el Caribe.
López, A. (2006). Empresarios, Instituciones y Desarrollo Económico: El caso argentino; Oficina de CEPAL en Buenos Aires.
López, A. (1996). "Las ideas evolucionistas en economía: una visión en conjunto." Revista Buenos Aires Pensamiento Económico Nº 1(Otoño de 1996).
Lugones, G., Peirano, F., Gutti, P. (2005). "Potencialidades y limitaciones de los procesos de innovación en argentina." Documento de trabajo Nº 26.
Lugones, G., Peirano, F., Suárez, D. y Gutti, P. (2006). Documento Base para la Construcción de un Set de Indicadores de Innovación Homogéneos y Comparables para América Latina, En G. Lugones y F.Porta (Comp), Enfoques y Metodologías Alternativas para la Medición de las Capacidades Innovativas, cap. 3. Proyecto PICT 02-09536 (FONCYT-ANPCYT). Centro Redes, ISBN 987-22998-0-3. Buenos Aires, Argentina.
Lugones, G. y Suárez, D. (2006). "Los magros resultados de las políticas para el cambio estructural en america latina: problema instrumental o confusión de objetivos?" Documento de Trabajo Nº: 27.
Lugones, G., Suarez, D., Moldolván, P. (2008). Innovation, competitiveness and salaries: a model of combined growth at the firm level. Globelics 2008. Ciudad de México, Setiembre.
Lundvall, B. Å. e. (1992). "National System of Innovation: Towards a Theory of Innovation and Interactive Learning", Londres, Pinter.
Nelson, R. (1996), The Sources of Economic Growth, Harvard University Press, Cambridge, Massachusetts.
Ocampo, J. A. e. (2005). Beyond Reforms. Structural Dynamics and Macroeconomic Theory., Stanford University Press.
OCyT (2004). Indicadores de Ciencia y Tecnología 2004. Observatorio Colombiano de Ciencia y Tecnología –OCyT. Colombia.
OECD (2005). Oslo Manual - The Measurement of Scientific and Technological Activities. 3rd edition. Guidelines for collecting and interpreting innovation data, Oerganization for Economic Co-operation and Development -OECD.
OECD (1994), National Systems of Innovation. General Conceptual Framework, OECD, Paris.
Peirano, F. (2006). "La contribución del sector industrial al cambio tecnológico. Un análisis comparado de los casos de Argentina y de Brasil." Documento de trabajo Nº 27(Centro Redes. Disponible en www.centroredes.org.ar.). Porta, F. and C. Bonvecchi (2003). Las condiciones de consistencia micro/macroeconómica. (REDES-CECE). Préstamo BID 925/OC-AR. Pre II.

51
Coordinación del Estudio: Oficina de la CEPAL-ONU en Bs. As., a solicitud de la Secretaría de Política Económica, Ministerio de Economía de la Nación.
RICYT (2000). Manual de Bogotá: Normalización de Indicadores de Innovación Tecnológica en América Latina y el Caribe. Bogotá, Colombia., OEA/ RICYT/COLCIENCIAS/OCT.
RICyT (2008). Indicadores Iberoamericanos de Ciencia y Tecnología, Red de Indicadores de Ciencia y Tecnología -RICyT. Disponible en www.ricyt.org.
Rossegger, G. (1987). "The economics of production and innovation. An Industrial Perspective", Pergamon Press.
Schumpeter, J. (1978). "Teoría del desenvolvimiento económico", Fondo Cultura, Mexico.
Schumpeter, J. (1983). "Capitalismo, socialismo y democracia". Buenos Aires, Orbis.
Suárez, D. (2006). National Specificities and Innovation Indicators. Globelics India 2006, Trivandrum, Kerala, India, Octubre 4-7.