innovation is the best medicine - annualreports.com
TRANSCRIPT
Innovation is the best medicineAnnual Report and Audited Financial Statements 2020

Strategic report1 Who we are2 Our strategy 4 Our strategy in action 20 Our business model22 Our Key Performance Indicators24 Porfolio Review26 Risk Management and Viability26 Investment Manager’s Report41 Principal Risks and Uncertainties42 Longer Term Viability Statement
Governance44 Chairman’s Statement46 Board of directors48 Report of the Audit Committee51 Report of the Directors59 Statement of Directors’ responsibilities
Financial statements 58 Independent Auditor’s Report to
the members of RTW Venture Fund Limited 62 Statement of Assets and Liabilities68 Statement of Operations69 Statement of Changes in Net Assets71 Statement of Cash Flows72 Notestothefinancialstatements88 Glossary91 Alternative Performance Measures unaudited92 AIFMD Disclosures unaudited
Ourpriorityistounlockvaluebyadvancingearly-stagescientificdevelopment and delivering innovative therapies to patients in need.
The US Market:RTW has a core focus on the US, with deep coverage of opportunities from academia to mid-size public companies. The US Portfolio Companiesreflectalargerpoolofopportunitiescreatedbythemostrobust venture and capital markets ecosystem.
The UK & European Market:RTWhasidentifiedandinvestedinexceptionalBritishandEuropeanscientificassets.Itwishestocontributetothesebiotechecosystemsby injecting capital where needed and community building. It intends to engage in NewCo creation around promising early-stage assets by partnering with universities and in-licensing academic programs as wellasthroughitsproprietaryin-houseefforts;andprovidingfinancialandhumancapitaltoentrepreneurstoadvancescientificprogramsindevelopment.
What this means for investors: – access to cutting edge research labs and academic knowledge – access to much greater breadth of science and opportunity – participation in value creation in local biotech ecosystem
The China Market:ItisearlydaysintheEast.RTWplanstocapturecommercializationopportunities in China by investing across the venture capital lifecycle from new company formation to IPO to bring successful innovative Western drugs to Chinese patients.
What this means for investors: – accesstoChinesebuddingbiotechmarket,innovationandexpertise – an opportunity to establish themselves in a new market with the scope forsignificantgrowth
Our global reach to support local biotech ecosystemsGreat science takes places everywhere in the world Identifying and
developing next-generation therapies to significantly improve patients’ lives
Financial highlights
Portfolio highlights
88.5% Ordinary NAV growth since inception
US$375.3MOrdinary NAV 2019: US$205.7 million
US$1.88 Price per Ordinary Share1 2019: US$1.37
53.9% Ordinary NAV growth in the period 2019: 22%
68.7% of NAV invested in portfolio companies 2019: 49%
22 Portfolio Company Investments: 9 publicly-listed and 13 privately-held 2019: 7 portfolio companies, 2 publicly-listed and 5 privately-held
80.8% Total shareholder return2 since inception
US$1.96NAV per Ordinary Share1 2019: US$1.27
US$24MIn cash/cash equivalents 2019: US$ 44 million
37.2%share price growth2 in the period1 2019: 32%
15New core portfolio companies added in the period 2019: Launched with 6 and added 1
25/33of portfolio companies’ pipeline products are in clinical stage programs 2019: 14/18
1 As the Company’s December NAV was not published until mid-January and the portfolio enjoyed an exceptionallystrongmonthofperformanceinDecembertheCompany’ssharepriceisshownasbeing at a discount to the December 31 NAV even though its shares traded at a premium to the published November NAV during December.
2 Total shareholder return is an alternative performance measure (APM). For more information please refertoAPMdefinitionstableonpage91.
DefinedtermsusedintheAnnualReportaredefinedintheGlossary.
RTWglobalinvestments
1RTW Venture Fund Limited Annual Report and accounts 2020
Governance
Strategic reportFinancial statem
ents
Investing with purpose
Identify
Engage
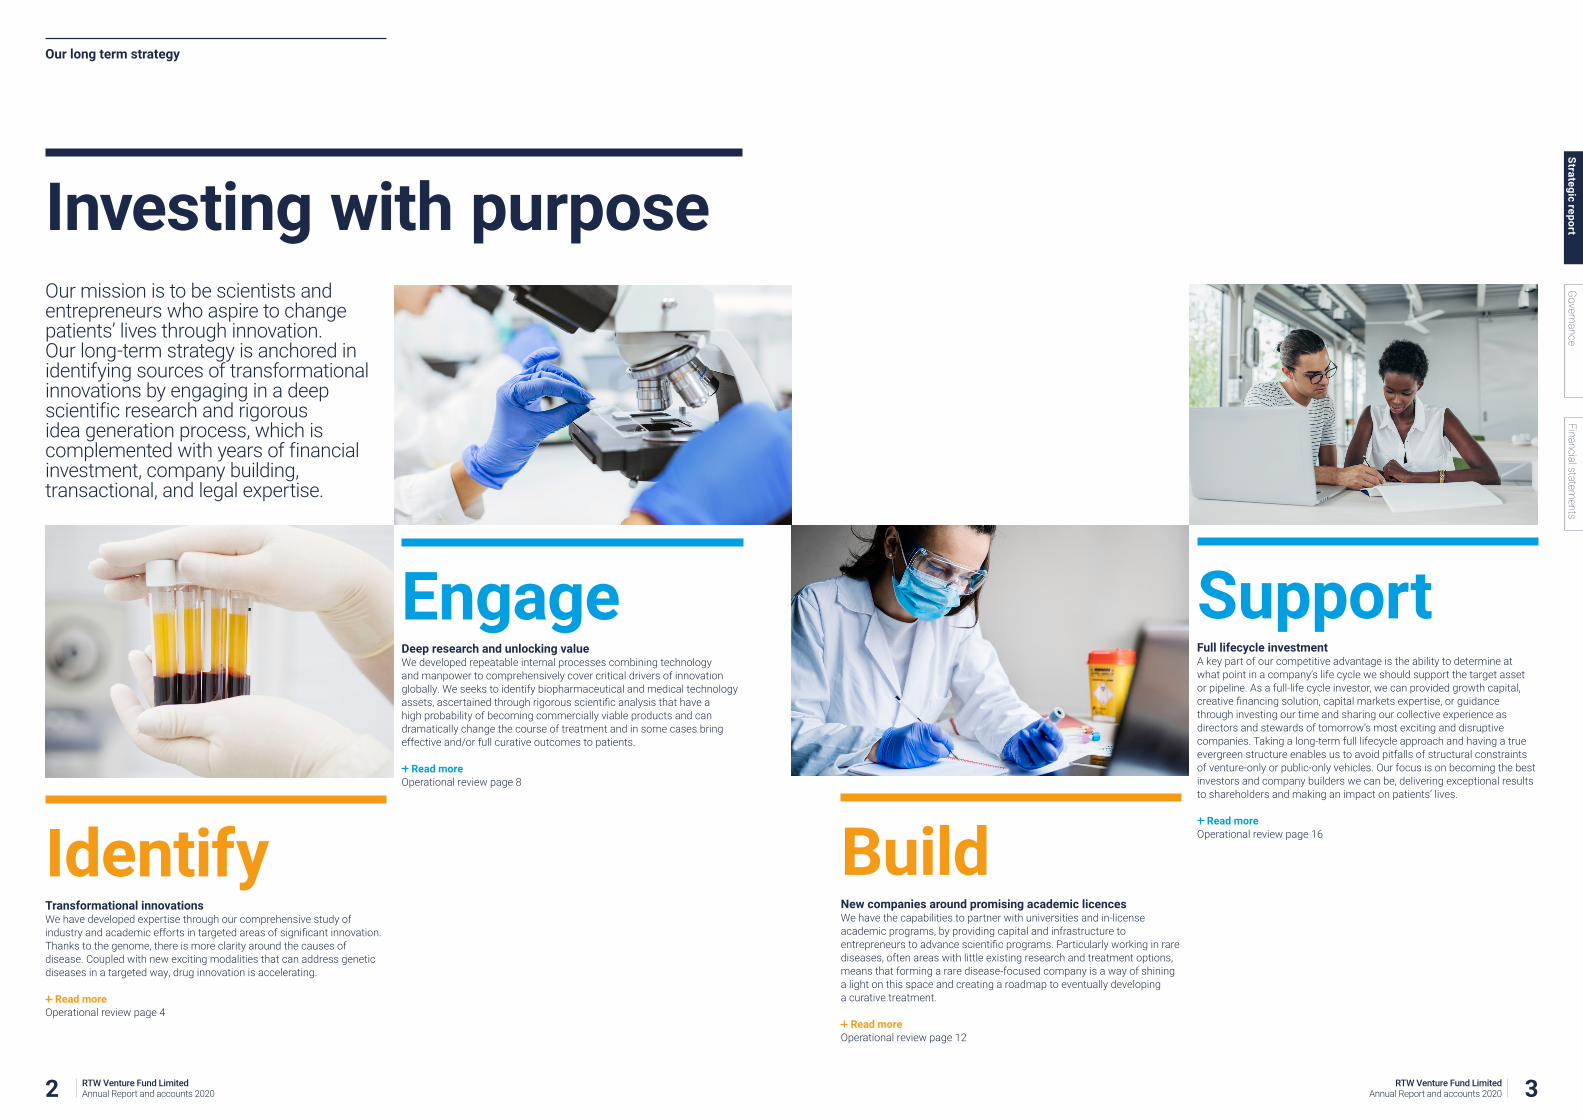
Transformational innovationsWehavedevelopedexpertisethroughourcomprehensivestudyofindustryandacademiceffortsintargetedareasofsignificantinnovation.Thanks to the genome, there is more clarity around the causes of disease.Coupledwithnewexcitingmodalitiesthatcanaddressgeneticdiseases in a targeted way, drug innovation is accelerating.
Read more Operational review page 4
Deep research and unlocking value We developed repeatable internal processes combining technology and manpower to comprehensively cover critical drivers of innovation globally. We seeks to identify biopharmaceutical and medical technology assets,ascertainedthroughrigorousscientificanalysisthathaveahigh probability of becoming commercially viable products and can dramatically change the course of treatment and in some cases bring effective and/or full curative outcomes to patients.
Read more Operational review page 8
Our long term strategy
Our mission is to be scientists and entrepreneurs who aspire to change patients’ lives through innovation. Our long-term strategy is anchored in identifying sources of transformational innovations by engaging in a deep scientific research and rigorous idea generation process, which is complemented with years of financial investment, company building, transactional,andlegalexpertise.
Support
Build
Full lifecycle investmentA key part of our competitive advantage is the ability to determine at what point in a company’s life cycle we should support the target asset or pipeline. As a full-life cycle investor, we can provided growth capital, creativefinancingsolution,capitalmarketsexpertise,orguidancethroughinvestingourtimeandsharingourcollectiveexperienceasdirectorsandstewardsoftomorrow’smostexcitinganddisruptivecompanies. Taking a long-term full lifecycle approach and having a true evergreen structure enables us to avoid pitfalls of structural constraints of venture-only or public-only vehicles. Our focus is on becoming the best investorsandcompanybuilderswecanbe,deliveringexceptionalresultsto shareholders and making an impact on patients’ lives.
Read more Operational review page 16
New companies around promising academic licencesWe have the capabilities to partner with universities and in-license academic programs, by providing capital and infrastructure to entrepreneurstoadvancescientificprograms.Particularlyworkinginrarediseases,oftenareaswithlittleexistingresearchandtreatmentoptions,means that forming a rare disease-focused company is a way of shining a light on this space and creating a roadmap to eventually developing a curative treatment.
Read more Operational review page 12
2 RTW Venture Fund Limited Annual Report and accounts 2020 3RTW Venture Fund Limited
Annual Report and accounts 2020
Governance
Strategic reportFinancial statem
ents

Our strategy in action: Identify transformational innovations
Identify transformational innovationsRTW focuses on identifying transformational innovations across the life sciences space, specifically backing scientific programs that have the potential to disrupt the prevailing standard of care in their respective disease areas.
The needIt is estimated that about 40,000 Americans suffer from myotonic dystrophy, a rare genetic muscular dystrophy with no approved treatments.
MissionAvidity is developing antibody oligonucleotide conjugate (AOC™) therapeutics, which combines the tissue selectivity of monoclonal antibodies and the precision of oligonucleotide-based therapeutics to overcome barriers to the delivery of oligonucleotides and target genetic drivers of disease.
StatusAvidity’s lead program is for myotonic dystrophy (MD) and has discovery efforts underway to address additional diseases of the muscle.
Next milestoneAvidityisexpectedtoinitiateitsfirstclinicaltrialsforitsleadprogram in myotonic dystrophy in 2021.
3.9% of NAV
<5% Portfolio company ownership
4 RTW Venture Fund Limited Annual Report and accounts 2020 5
Governance
Strategic reportFinancial statem
ents
RTW Venture Fund Limited Annual Report and accounts 2020
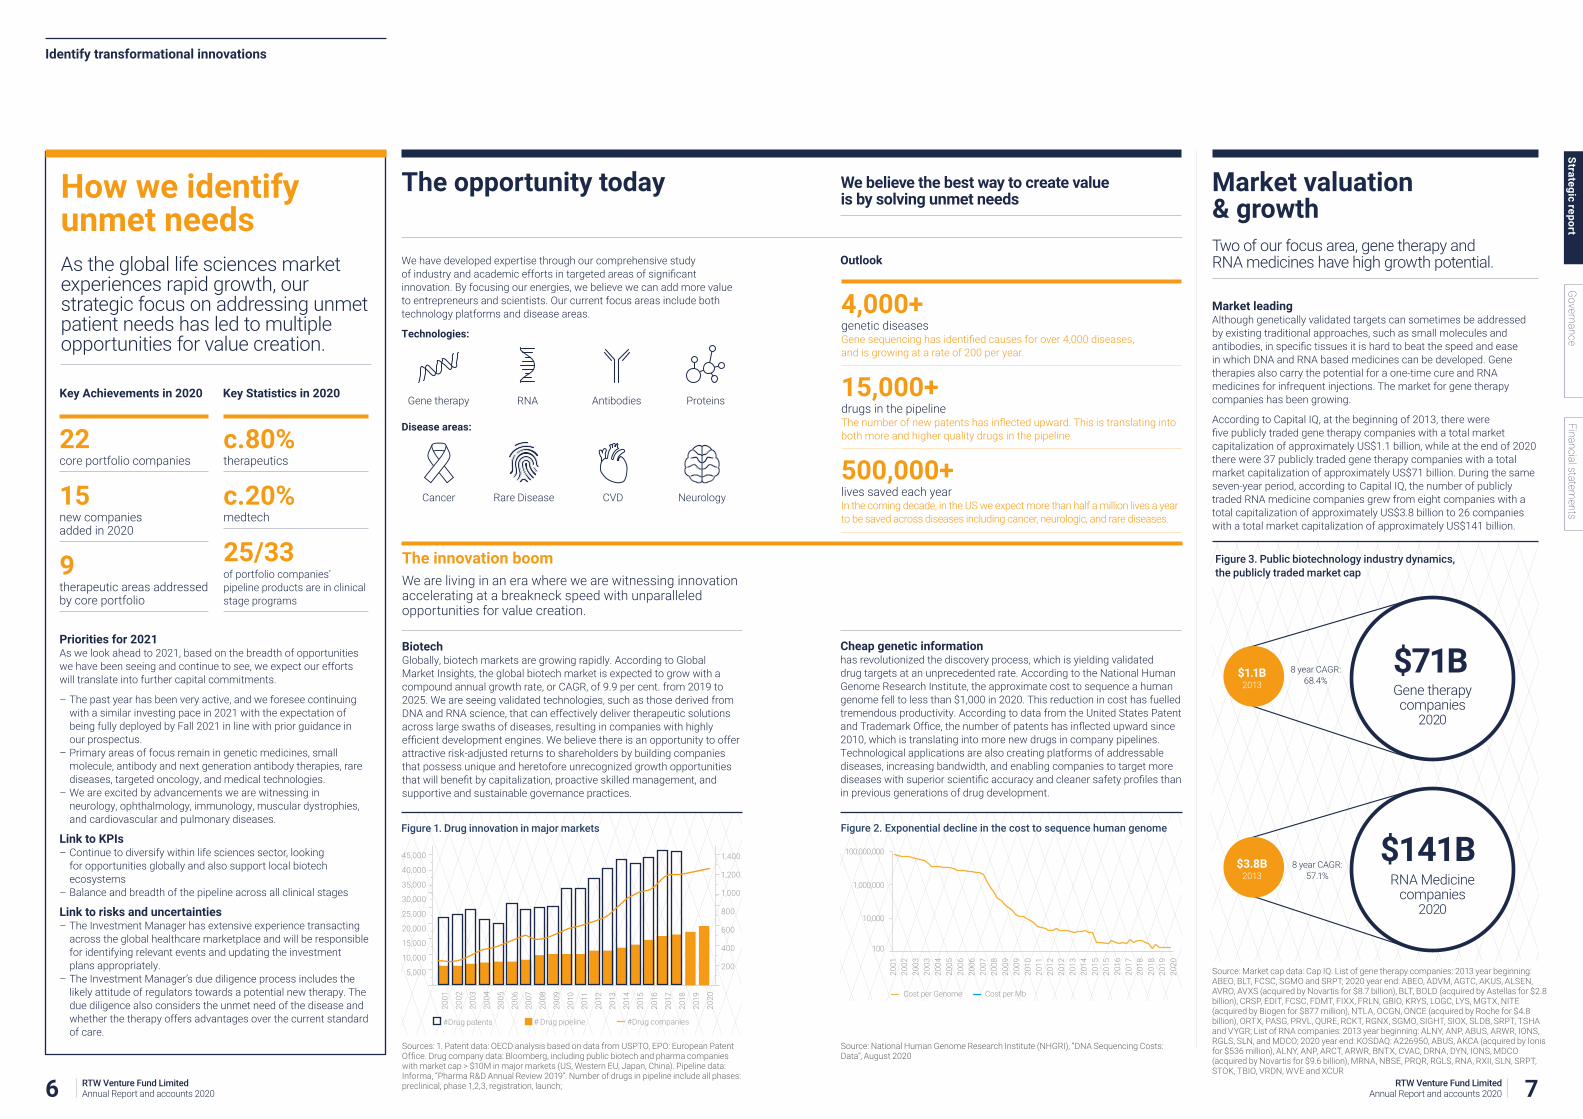
Figure 2. Exponential decline in the cost to sequence human genome
2001
2003
2002
2003
2004
2005
2006
2006
2007
2008
2009
2009
2010
2011
2012
2012
2013
2014
2015
2015
2016
2017
2018
2018
2019
2020
100,000,000
100
10,000
1,000,000
Cost per Genome Cost per Mb
Identify transformational innovations
The opportunity today
Wehavedevelopedexpertisethroughourcomprehensivestudyofindustryandacademiceffortsintargetedareasofsignificantinnovation. By focusing our energies, we believe we can add more value to entrepreneurs and scientists. Our current focus areas include both technology platforms and disease areas.
Technologies:
Antibodies ProteinsRNAGene therapy
Disease areas:
CVD NeurologyRare DiseaseCancer
How we identify unmet needs As the global life sciences market experiencesrapidgrowth,ourstrategic focus on addressing unmet patient needs has led to multiple opportunities for value creation.
Market valuation & growth Two of our focus area, gene therapy and RNA medicines have high growth potential.
The innovation boomWe are living in an era where we are witnessing innovation accelerating at a breakneck speed with unparalleled opportunities for value creation.
BiotechGlobally, biotech markets are growing rapidly. According to Global MarketInsights,theglobalbiotechmarketisexpectedtogrowwithacompound annual growth rate, or CAGR, of 9.9 per cent. from 2019 to 2025. We are seeing validated technologies, such as those derived from DNA and RNA science, that can effectively deliver therapeutic solutions across large swaths of diseases, resulting in companies with highly efficientdevelopmentengines.Webelievethereisanopportunitytoofferattractive risk-adjusted returns to shareholders by building companies that possess unique and heretofore unrecognized growth opportunities thatwillbenefitbycapitalization,proactiveskilledmanagement,andsupportive and sustainable governance practices.
Market leadingAlthough genetically validated targets can sometimes be addressed byexistingtraditionalapproaches,suchassmallmoleculesandantibodies,inspecifictissuesitishardtobeatthespeedandeasein which DNA and RNA based medicines can be developed. Gene therapies also carry the potential for a one-time cure and RNA medicines for infrequent injections. The market for gene therapy companies has been growing.
According to Capital IQ, at the beginning of 2013, there were fivepubliclytradedgenetherapycompanieswithatotalmarketcapitalizationofapproximatelyUS$1.1billion,whileattheendof2020there were 37 publicly traded gene therapy companies with a total marketcapitalizationofapproximatelyUS$71billion.Duringthesameseven-year period, according to Capital IQ, the number of publicly traded RNA medicine companies grew from eight companies with a totalcapitalizationofapproximatelyUS$3.8billionto26companieswithatotalmarketcapitalizationofapproximatelyUS$141billion.
Figure 1. Drug innovation in major markets
2001
2002
2003
2004
2005
2006
2007
2008
2009
2010
2011
2012
2013
2014
2015
2016
2017
2018
2019
2020
45,000
40,000
35,000
30,000
25,000
20,000
15,000
10,000
5,000
#Drug patents # Drug pipeline #Drug companies
1,400
1,200
1,000
800
600
400
200
$71B Gene therapy companies
2020
$141B RNA Medicine
companies 2020
Figure 3. Public biotechnology industry dynamics, the publicly traded market cap
8 year CAGR: 68.4%
8 year CAGR: 57.1%
$1.1B 2013
$3.8B 2013
Cheap genetic informationhas revolutionized the discovery process, which is yielding validated drug targets at an unprecedented rate. According to the National Human GenomeResearchInstitute,theapproximatecosttosequenceahumangenome fell to less than $1,000 in 2020. This reduction in cost has fuelled tremendous productivity. According to data from the United States Patent andTrademarkOffice,thenumberofpatentshasinflectedupwardsince2010, which is translating into more new drugs in company pipelines. Technological applications are also creating platforms of addressable diseases, increasing bandwidth, and enabling companies to target more diseaseswithsuperiorscientificaccuracyandcleanersafetyprofilesthanin previous generations of drug development.
22 core portfolio companies
15 new companies added in 2020
9therapeutic areas addressed by core portfolio
c.80%therapeutics
c.20%medtech
25/33 of portfolio companies’ pipeline products are in clinical stage programs
Priorities for 2021As we look ahead to 2021, based on the breadth of opportunities wehavebeenseeingandcontinuetosee,weexpectoureffortswill translate into further capital commitments.
– The past year has been very active, and we foresee continuing withasimilarinvestingpacein2021withtheexpectationofbeing fully deployed by Fall 2021 in line with prior guidance in our prospectus.
– Primary areas of focus remain in genetic medicines, small molecule,antibodyandnextgenerationantibodytherapies,rarediseases, targeted oncology, and medical technologies.
– Weareexcitedbyadvancementswearewitnessinginneurology, ophthalmology, immunology, muscular dystrophies, and cardiovascular and pulmonary diseases.
Link to KPIs – Continue to diversify within life sciences sector, looking for opportunities globally and also support local biotech ecosystems
– Balance and breadth of the pipeline across all clinical stages
Link to risks and uncertainties – TheInvestmentManagerhasextensiveexperiencetransactingacross the global healthcare marketplace and will be responsible for identifying relevant events and updating the investment plans appropriately.
– The Investment Manager’s due diligence process includes the likely attitude of regulators towards a potential new therapy. The due diligence also considers the unmet need of the disease and whether the therapy offers advantages over the current standard of care.
Key Achievements in 2020 Key Statistics in 2020
Outlook
4,000+genetic diseases Genesequencinghasidentifiedcausesforover4,000diseases, and is growing at a rate of 200 per year.
15,000+drugs in the pipeline Thenumberofnewpatentshasinflectedupward.Thisistranslatingintoboth more and higher quality drugs in the pipeline.
500,000+lives saved each year Inthecomingdecade,intheUSweexpectmorethanhalfamillionlivesayearto be saved across diseases including cancer, neurologic, and rare diseases.
We believe the best way to create value is by solving unmet needs
Sources:1.Patentdata:OECDanalysisbasedondatafromUSPTO,EPO:EuropeanPatentOffice.Drugcompanydata:Bloomberg,includingpublicbiotechandpharmacompanieswithmarketcap>$10Minmajormarkets(US,WesternEU,Japan,China).Pipelinedata:Informa, “Pharma R&D Annual Review 2019”. Number of drugs in pipeline include all phases: preclinical, phase 1,2,3, registration, launch;
Source: National Human Genome Research Institute (NHGRI), “DNA Sequencing Costs: Data”, August 2020
Source: Market cap data: Cap IQ. List of gene therapy companies: 2013 year beginning: ABEO,BLT,FCSC,SGMOandSRPT;2020yearend:ABEO,ADVM,AGTC,AKUS,ALSEN,AVRO, AVXS (acquired by Novartis for $8.7 billion), BLT, BOLD (acquired by Astellas for $2.8 billion),CRSP,EDIT,FCSC,FDMT,FIXX,FRLN,GBIO,KRYS,LOGC,LYS,MGTX,NITE(acquiredbyBiogenfor$877million),NTLA,OCGN,ONCE(acquiredbyRochefor$4.8billion),ORTX,PASG,PRVL,QURE,RCKT,RGNX,SGMO,SIGHT,SIOX,SLDB,SRPT,TSHAandVYGR;ListofRNAcompanies:2013yearbeginning:ALNY,ANP,ABUS,ARWR,IONS,RGLS, SLN, and MDCO; 2020 year end: KOSDAQ: A226950, ABUS, AKCA (acquired by Ionis for$536million),ALNY,ANP,ARCT,ARWR,BNTX,CVAC,DRNA,DYN,IONS,MDCO(acquiredbyNovartisfor$9.6billion),MRNA,NBSE,PRQR,RGLS,RNA,RXII,SLN,SRPT,STOK,TBIO,VRDN,WVEandXCUR
6 RTW Venture Fund Limited Annual Report and accounts 2020 7RTW Venture Fund Limited
Annual Report and accounts 2020
Governance
Strategic reportFinancial statem
ents

Engage in deep research and unlocking valueRTW’s team is comprised of individuals with medical and advanced scientific training and legalandbankingexperience,enablingadeeplydifferentiated approach to research, idea generation and strategic investment.
The needWe formed Ji Xing in early 2020, borne out of a two-year study of innovation, biotechnology, and access to healthcare in China. Ji Xing is a Shanghai-based biotechnology company focused on thedevelopmentanddistributionofinnovativeUSandEuropeandrugs in the Chinese market.
MissionJiXingwillleverageclinicaldevelopmentandcommercialexpertiseintheUnitedStatesandEuropetobringglobalinnovativemedicinesto Chinese patients.
StatusJiXingannouncedanexclusivelicensingagreementwithCytokinetics to develop and commercialize CK-274, a novel cardiac myosin inhibitor, in China. RTW further capitalized JI Xing by providing a Series A funding.
Next catalystBy working closely with Ji Xing team we look to in-license additional late-clinical stage or commercial stage assets into its growing pipeline and provide further capital for business operation expansion.
1.3% of NAV
<20% Portfolio company ownership
Our strategy in action: Engage in deep research and unlocking value
9RTW Venture Fund Limited Annual Report and accounts 2020
Governance
Strategic reportFinancial statem
ents
8 RTW Venture Fund Limited Annual Report and accounts 2020

Engage in deep research and unlocking value
Our research process Collaboration.Excellence.Consensus.
We like to use the analogy that we are organized much like a business development team at a large biotech company. Across our team we havedoctors,scientists,drugdevelopmentexpertise,alongwithbankers,lawyersandoperatorswhocanexecute.
Our rigorous approach to deal sourcing involves deep research in areas of expertise:The research coverage is structured based on a modality (i.e. gene therapy, RNA medicine, small and large molecules, medtech) or a therapeutic area (i.e. rare disease, cancer, immunology, neurology) leading to a collaborative approach of gaining the most comprehensive knowledge and consensus building on conviction of a probability of an set to become a transformational therapy.
Leverage our proprietary in-house research developed over fifteen years of operating in the life sciences sectorRTW has developed repeatable internal processes combining institutional data library, technology, and manpower to comprehensively cover critical drivers of innovation.
Actively engaging our wide network of doctors, academics and universities for promising new academic workWe have and continue to cultivate relationships with entrepreneurs, principal investigators, and academic institutions to allow for a wide range of intelligence gathering of investment opportunities.
Work with management teams and syndicate partnersWe believe in developing long-term relationships with great entrepreneurs and scientists who are as passionate about medicine as we are, and working closely with our peers to support companies at any stage of their lifecycle.
Our investment strategy The well-roundedness of the RTW team, strengthened by strong ties across industry, academia and banking platforms, gives it the ability to source viable prospective target businesses, capitalise them, and ensure public-market readiness.
Idea generation Leveraging RTW’s research process for differentiated idea generation.
Our competitive advantage is anchored in our internal idea generation process,whichwehaverefinedovertheyears.Inourfocusareasweaspire to achieve a level of research depth consistent with those making permanent capital decisions, which means we are generally comparing ourselves to the work done within large biotech and pharma companies.
The process begins with attending c. 100 medical meetings worldwide. Medicalconferencesarewhereallmeaningfulscientificdataarefirstsharedwiththescientificcommunity.Overtheyearswehavebuiltourinstitutional level database library, enhanced by technology and data science. This effort leads us to some of the most promising assets, where we then seek out the companies or academics behind the projects.
Externally,wealsogenerateideasintraditionalways,too.Weplacehighvalue on building long-term relationships with management teams and scientists,andenjoyworkingwithourinvestmentfirmpeersandotherplayers in our community.
For every investment we make, we take into consideration the following:
Identify an area of transformational innovation
Wehavedevelopedexpertisethroughourcomprehensivestudyofindustryandacademiceffortsintargetedareasofsignificantinnovation.We distill opportunities across healthcare through three distinct lenses: diseaseareas,scientifictechnologies,andgeneticanalysis.
Identify value and assets that answer the unmet need
We apply a rigorous approach to idea screening, analysis, and capital commitment. The process starts with the careful tracking of transformationalevents.Examplesofsucheventsincludeclinicaldata,regulatory decisions, product launches, competitive entrants, intellectual property disputes, industry transformations, distressed situations, and corporate change. Our analytical approach incorporates the study of historicaldatagatheredfromscientificliterature,regulatoryagencies,medicalmeetings,managementteams,andinternalexpertise.
Select assets with high odds of becoming approved therapies
We assign probabilities to various outcomes and use conservative valuation techniques to assign valuations to the various scenarios.
Identify how RTW can maximize value
Opportunitiesforfinancialengineeringoractiveinvolvementarealsoconsidered,suchasroyalties,SPACs,structureddeals,distressfinancing,and company formation.
Figure 1. Leveraging RTW’s research process for differentiated idea generation
Worldwide medical meetings100+ per year
Proprietary data science & genetics research effortsBioinformatics
Collaborative & iterative in-house research15 year old library
Syndicate partner deal flow50+ per year
Dialogue with entrepreneurs & academics300+ meetings per year
Deal flow from capital markets15 year old library
Deep ongoing due diligence100+ per year
Dialogue with management teams1,000+ per year
Only the best investment ideasPrivate and public
Internal idea generation Externalideageneration Combined idea generation
How we approach research and investment We seek to identify biopharmaceutical and medical technology assets, ascertained through rigorous scientific analysis, that have a high probability of becoming commercially viable products and can significantly improve patients’ lives.
115 medical meetings attended
2000+ talks attended
3400+posters captured
16 private investments
50% deal leadership
Priorities for 2021Continueexpandinginstitutionaldatalibraryandresearchcoverage to track and source the most promising assets globally.
– Private investments deal pace in line with 2020 to be fully deployed by Fall 2021 per prior prospectus guidance
– 2/3 of the deals to be in mid-late stage venture and 1/3 in new company creation and early stage venture
Link to KPIs – Active and robust pipeline
– Level of capital deployment and investment pace, as well as funds availability to be deployed into new portfolio companies or for follow-oninvestmentsintoexistingportfoliocompanies.
Link to risks and uncertainties – The Board will monitor and supervise the Company’s performance, compared to the target return, similar investment funds and broader market conditions.
– The Investment Manager’s due diligence process includes considering the risk that innovative therapies may have unforeseen side effects, based on the Investment Manager’s extensivesectorknowledgeandexperience,andbasedonresearch all published and publicly available information based on safety concerns.
Key Achievements in 2020 Key Statistics in 2020
10 RTW Venture Fund Limited Annual Report and accounts 2020 11RTW Venture Fund Limited
Annual Report and accounts 2020
Governance
Strategic reportFinancial statem
ents

Build new companies around promising academic licenses
The needRocket is a clinical-stage company advancing an integrated and sustainable pipeline of genetic therapies for rare childhood disorders.
MissionRocket’smissionistodevelopfirst-in-classandbest-in-class,curative gene therapies for patients with devastating diseases. Rocket was born out of a year-long study in gene therapy. In late 2015, Rocket was formed around a single academic license fromaEuropeanacademicinstitution.RTWhiredaworld-classmanagementteam,includingCEODr.GauravShahandCOOKinnariPatel, and continued to identify additional targets and licensed four more academic programs.
Status – Allfiveprogramsareintheclinic – One program in registration- enabling Phase 2
Medium-term milestones – First global submission – Platformandpipelineexpansion
41.1% of NAV
<5% Portfolio company ownership
Our strategy in action: Build new companies around promising academic licenses
RTW engages in new company formation around promising academic licenses.We are well-placed to offer support to early-stage LifeSci companies and NewCos. RTW’s business and operations teams consist of members with financial, capital markets, legal,regulatory,tax,andaccountingexpertiseand enforces a strong compliance culture.
12 RTW Venture Fund Limited Annual Report and accounts 2020 13RTW Venture Fund Limited
Annual Report and accounts 2020
Governance
Strategic reportFinancial statem
ents
Build new companies around promising academic licenses
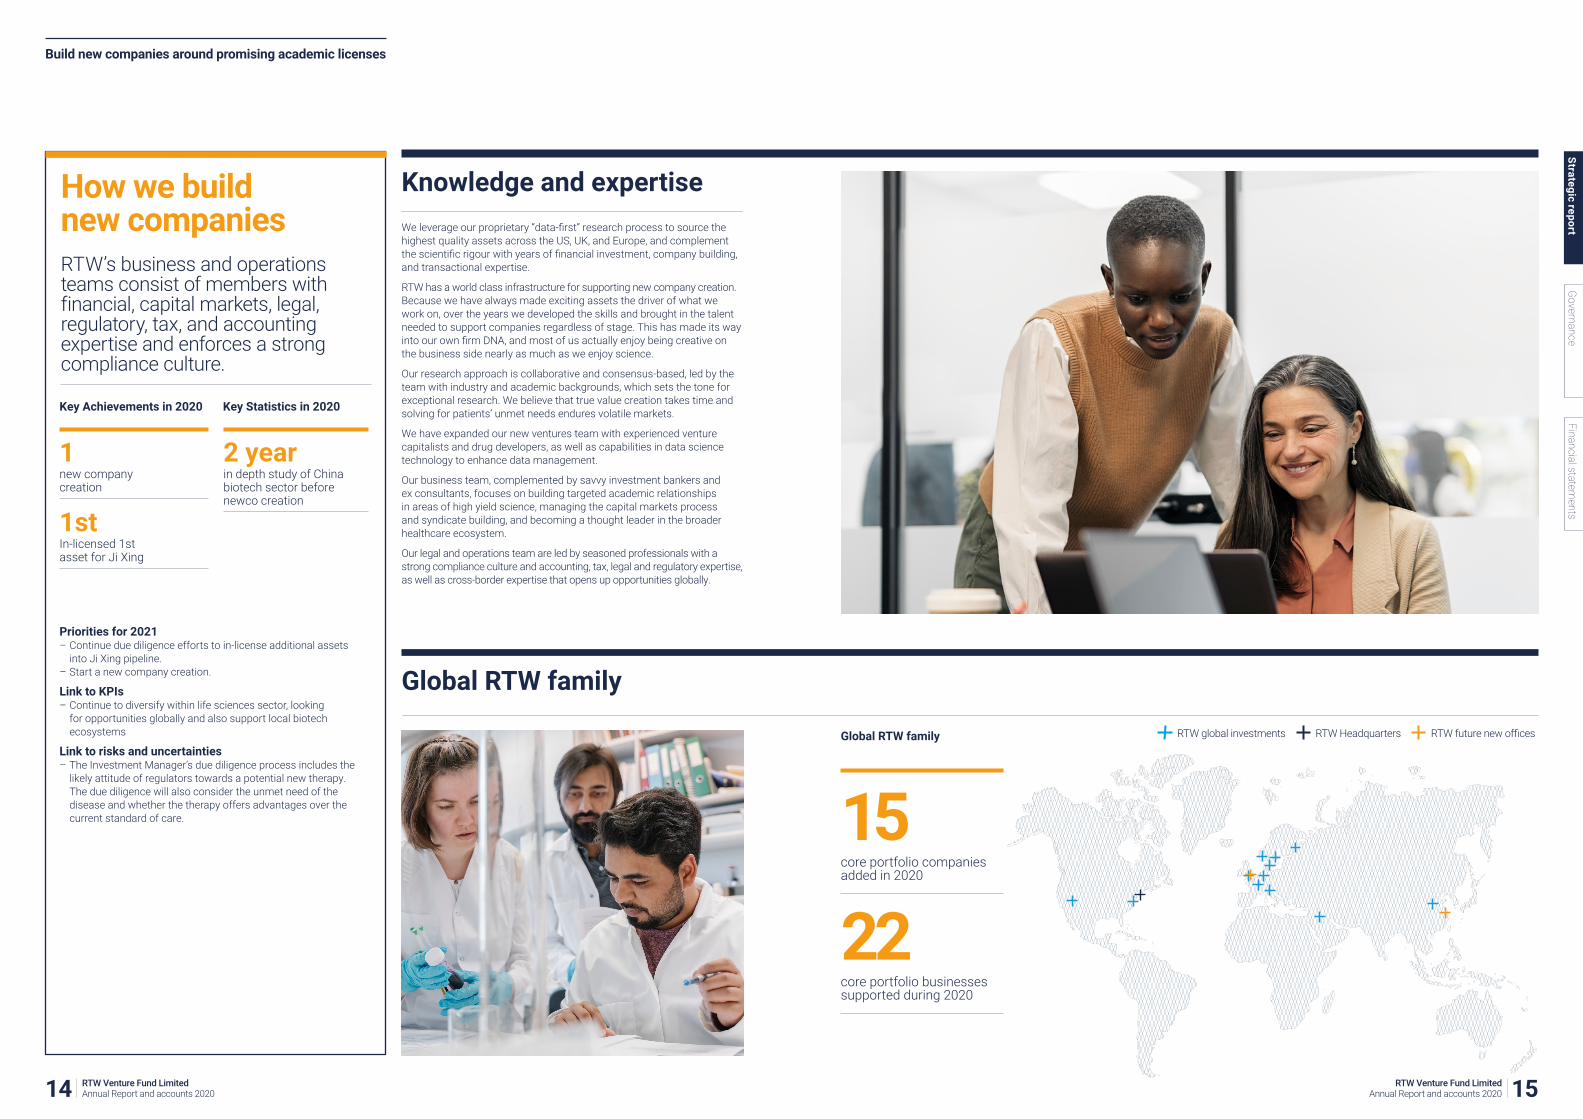
Weleverageourproprietary“data-first”researchprocesstosourcethehighestqualityassetsacrosstheUS,UK,andEurope,andcomplementthescientificrigourwithyearsoffinancialinvestment,companybuilding,andtransactionalexpertise.
RTW has a world class infrastructure for supporting new company creation. Becausewehavealwaysmadeexcitingassetsthedriverofwhatwework on, over the years we developed the skills and brought in the talent needed to support companies regardless of stage. This has made its way intoourownfirmDNA,andmostofusactuallyenjoybeingcreativeonthe business side nearly as much as we enjoy science.
Our research approach is collaborative and consensus-based, led by the team with industry and academic backgrounds, which sets the tone for exceptionalresearch.Webelievethattruevaluecreationtakestimeandsolving for patients’ unmet needs endures volatile markets.
Wehaveexpandedournewventuresteamwithexperiencedventurecapitalists and drug developers, as well as capabilities in data science technology to enhance data management.
Our business team, complemented by savvy investment bankers and exconsultants,focusesonbuildingtargetedacademicrelationshipsin areas of high yield science, managing the capital markets process and syndicate building, and becoming a thought leader in the broader healthcare ecosystem.
Our legal and operations team are led by seasoned professionals with a strongcompliancecultureandaccounting,tax,legalandregulatoryexpertise,aswellascross-borderexpertisethatopensupopportunitiesglobally.
Knowledge and expertise
Global RTW family
15core portfolio companies added in 2020
22 core portfolio businesses supported during 2020
Global RTW family
How we build new companies RTW’s business and operations teams consist of members with financial, capital markets, legal, regulatory,tax,andaccountingexpertiseandenforcesastrongcompliance culture.
1 new company creation
1st In-licensed 1st asset for Ji Xing
2 yearin depth study of China biotech sector before newco creation
Priorities for 2021 – Continue due diligence efforts to in-license additional assets into Ji Xing pipeline.
– Start a new company creation.
Link to KPIs – Continue to diversify within life sciences sector, looking for opportunities globally and also support local biotech ecosystems
Link to risks and uncertainties – The Investment Manager’s due diligence process includes the likely attitude of regulators towards a potential new therapy. The due diligence will also consider the unmet need of the disease and whether the therapy offers advantages over the current standard of care.
Key Achievements in 2020 Key Statistics in 2020
RTWglobalinvestments RTWHeadquarters RTWfuturenewoffices
14 RTW Venture Fund Limited Annual Report and accounts 2020 15RTW Venture Fund Limited
Annual Report and accounts 2020
Governance
Strategic reportFinancial statem
ents

Our strategy in action: Support investments throughout the lifecycle
Support investments throughout the lifecycleDrug development is not a linear process. There are advancement and setbacks and we arestructuredtomaximizevaluecreationatany point beginning with company creation to late stage venture and into publicly traded markets. We let the fundamentals and not market movements dictate our investment.
The needMilestone is a publicly traded clinical stage biopharmaceutical company focused on the development and commercialization of innovative cardiovascular medicines. Milestone originated with the Investment Manager as a private company when RTW led an $80M cross-over round in October 2018, subsequently Milestone IPOed in May 2019 and RTW remained invested. In July 2020, RTW and Milestone announced a $25M private placement to support further development of Milestone’s lead late-stage program.
MissionMilestoneisdevelopingEtripamil,anovelcalciumchannelblockerdesigned as a self-administered nasal spray for a rapid response therapy in episodic cardiovascular conditions, which may shift the current treatment paradigm for many patients with PSVT from the emergency department to the at-home setting.
StatusEtripamilisinpivotalPhase3trials.
Next catalystDatareadoutfromthepivotaltrialisexpectedinearly2022.
0.9% of NAV
<5% Portfolio company ownership
16 RTW Venture Fund Limited Annual Report and accounts 2020 17RTW Venture Fund Limited
Annual Report and accounts 2020
Governance
Strategic reportFinancial statem
ents

See the bigger picture We support companies through the ups and downs of the often challenging journey to bring therapies to patients.
Trusted partner We support teams trying to solve the inevitable setbacks that occur when introducing a first in class or disruptive therapy.
True value realization from transformative products takes time, and in order to capture that value, it is critical to be involved and invested in such companies throughout the various stages of their development and ultimatelydistributiontopatients.Scientificdevelopmentrarelyfollowsalinear path and nor do we, which is why we are always thinking about the optimal way to support a company.
As a full-life cycle investor, RTW has achieved multiple successful transactionmilestonesandprovidedcreativefinancialsolutions,including successfully creating new companies around academic licenses, supporting those companies along the life cycle by taking them public through reverse mergers, recapitalizations, SPACs, and offering royalty- backed funding.
Various members of the RTW’s leadership team have also garnered significantoperationalexperience,servingininterimexecutiverolesat biopharma companies, holding myriad strategic directorships, and influencingcompaniestoprioritizeandadvancetheirassetsthroughdevelopment and commercialization.
RTW has earned a constructive reputation of being deeply knowledgeable in science, supportive to entrepreneurs and aligned with the companies forthelongterm,untilthemaximumvalueofthoseunderlyingassetscanbe achieved. This has become an earned privilege for us.
RTW endeavors to be the “partner of choice” for the life sciences industry, offering tailored capital solutions based on the Company’s capital needs.
We have built our business in public and private equity markets and continued to evolve our multi-security capital solutions.
Inadditiontoourexpertiseintakingcompanies public through reverse mergers, recapitalizations and SPACs, RTW has added new, non-dilutive capabilities to meet these partnering needs, including staring Ji Xing as a conduit for Greater China partnering, as well as offeringroyalty-basedfinancings.
TheCompanybenefitsfrombeinga part of a larger RTW family, where we can creatively design solutions that are aligned with our partners’ needs.
5core portfolio companies were we have at least 1 board seat
9 companies that we continue to support and stay invested post-IPO
As a trusted partner:
Our strategy in action: Support investments throughout the lifecycle
How we support companies through the lifecycle We are full life cycle investors supporting scientists and entrepreneurs at any stage where we identify opportunity, from academic programs in need of industry sponsorship all the way to mature publicly traded companies.
6 portfolio companies IPOs
15% Together 15% to NAV growth contribution
1.8x average step-up from the time of investment to IPO
c.48% of NAV in aggregate of 5 portfolio companies where we have a board seat
Priorities for 2021Continuesupportingexistingportfoliocompaniesbasedontheircapitalneeds,aswellascontinueexpandingourcreativefinancialsolutions tool kit.
Link to KPIs – Capital deployment into core portfolio companies.
Link to risks and uncertainties – Exposuretoglobalpoliticalandeconomicrisks
Key Achievements in 2020 Key Statistics in 2020
RTW’s evolving multi-security capital solutions
TurnaroundSpacNewco creation
Royalty fundingPublic equityPrivate & crossover Investing
18 RTW Venture Fund Limited Annual Report and accounts 2020 19RTW Venture Fund Limited
Annual Report and accounts 2020
Governance
Strategic reportFinancial statem
ents

Our business model
We are scientists and entrepreneurs who aspire to change the lives of patients through innovation.
What we need to create value
How we create value
Experienced teamA collaborative team of doctors, academics, drug developers, coupled with seasoned venture capitalists, investment bankers, lawyers and operators with a strong compliance culture.
Deep scientific expertiseWe developed repeatable internal processes combining technology and manpower to comprehensively cover critical drivers of innovation globally to identify biopharmaceutical and medical technology assets that have a high probability of becoming commercially viable products and can dramatically change the course of treatment outcomes to patients.
Full life cycle investingTaking a long-term full lifecycle approach and having a true evergreen structure enables us to avoid pitfalls of structural constraints of venture-only or public-only vehicles.
Global reachGreat science takes places everywhere in the world. Our priority is to unlock value by advancing early-stagescientificdevelopmentanddeliveringinnovative therapies to patients in need.
Identifying and developing next generation therapies that significantly improve patient’s lives
Creating value for our stakeholders
Patient benefitsInnovation is the best medicine. We believe solving unmet patients’ needs is the best way to create value.
9commercialized drugs developed by top 10 most profitableinvestmentssincetheInvestmentManager’sinception
ShareholderPrivileged access to private markets and bespoke negotiated opportunities.
81%total shareholder return since inception
Portfolio CompaniesWe support teams trying to solve the inevitable setbacks that occurwhenintroducingafirstinclassordisruptivetherapy.
69%of NAV deployed into 22 core portfolio companies
RTW Charitable FoundationFounded as the charitable foundation arm of RTW, RTWCF partners with organizations conducting disease research and championing humanitarian causes.
$1Min funding from RTW Charitable Foundation to assist community- based organizations and research from COVID-19impactinNewYork
Identify unmet needs We focus on identifying transformational innovations and unmet needs across the life sciences space, specificallybackingscientificprogramsthathavethepotential to disrupt the prevailing standard of care in their respective disease areas.
Read more Our strategy in action pages 4-5
Invest in relationships We believe in developing long-term relationships with great entrepreneurs and scientists who are as passionate about medicine as we are, and working closely with our peers to support companies at any stage of their lifecycle.
Read more Our strategy in action pages 12-13
Support through the lifecyleA key part of our competitive advantage is the ability to determine at what point in a company’s life cycle we should support the target asset or pipeline. As a full-life cycle investor, we can provided growth capital,creativefinancingsolution,capitalmarketsexpertise,orguidancethroughinvestingourtimeandsharingourcollectiveexperienceasdirectorsandstewardsoftomorrow’smostexcitinganddisruptive companies.
Read more Operational review pages 16-17
READ MORE Portfolio review pages 24-25
Our purpose drives everything we do:
Identify transformative assets with high growth potential across the biopharmaceutical and medical technology sectors. Driven by our deepscientificunderstandingandalong-termapproachtosupportinginnovativebusinesses,weinvestincompaniesdevelopingnext-generationtherapiesandtechnologiesthatcansignificantlyimprovepatients’ lives.
Our long-term strategy is anchored in identifying sources of transformational innovations by engaging inadeepscientificresearchandrigorousideagenerationprocess,whichiscomplementedwithyears offinancialinvestment,companybuilding,transactional,andlegalexpertise.
20 RTW Venture Fund Limited Annual Report and accounts 2020 21RTW Venture Fund Limited
Annual Report and accounts 2020
Governance
Strategic reportFinancial statem
ents
Key performance indicators
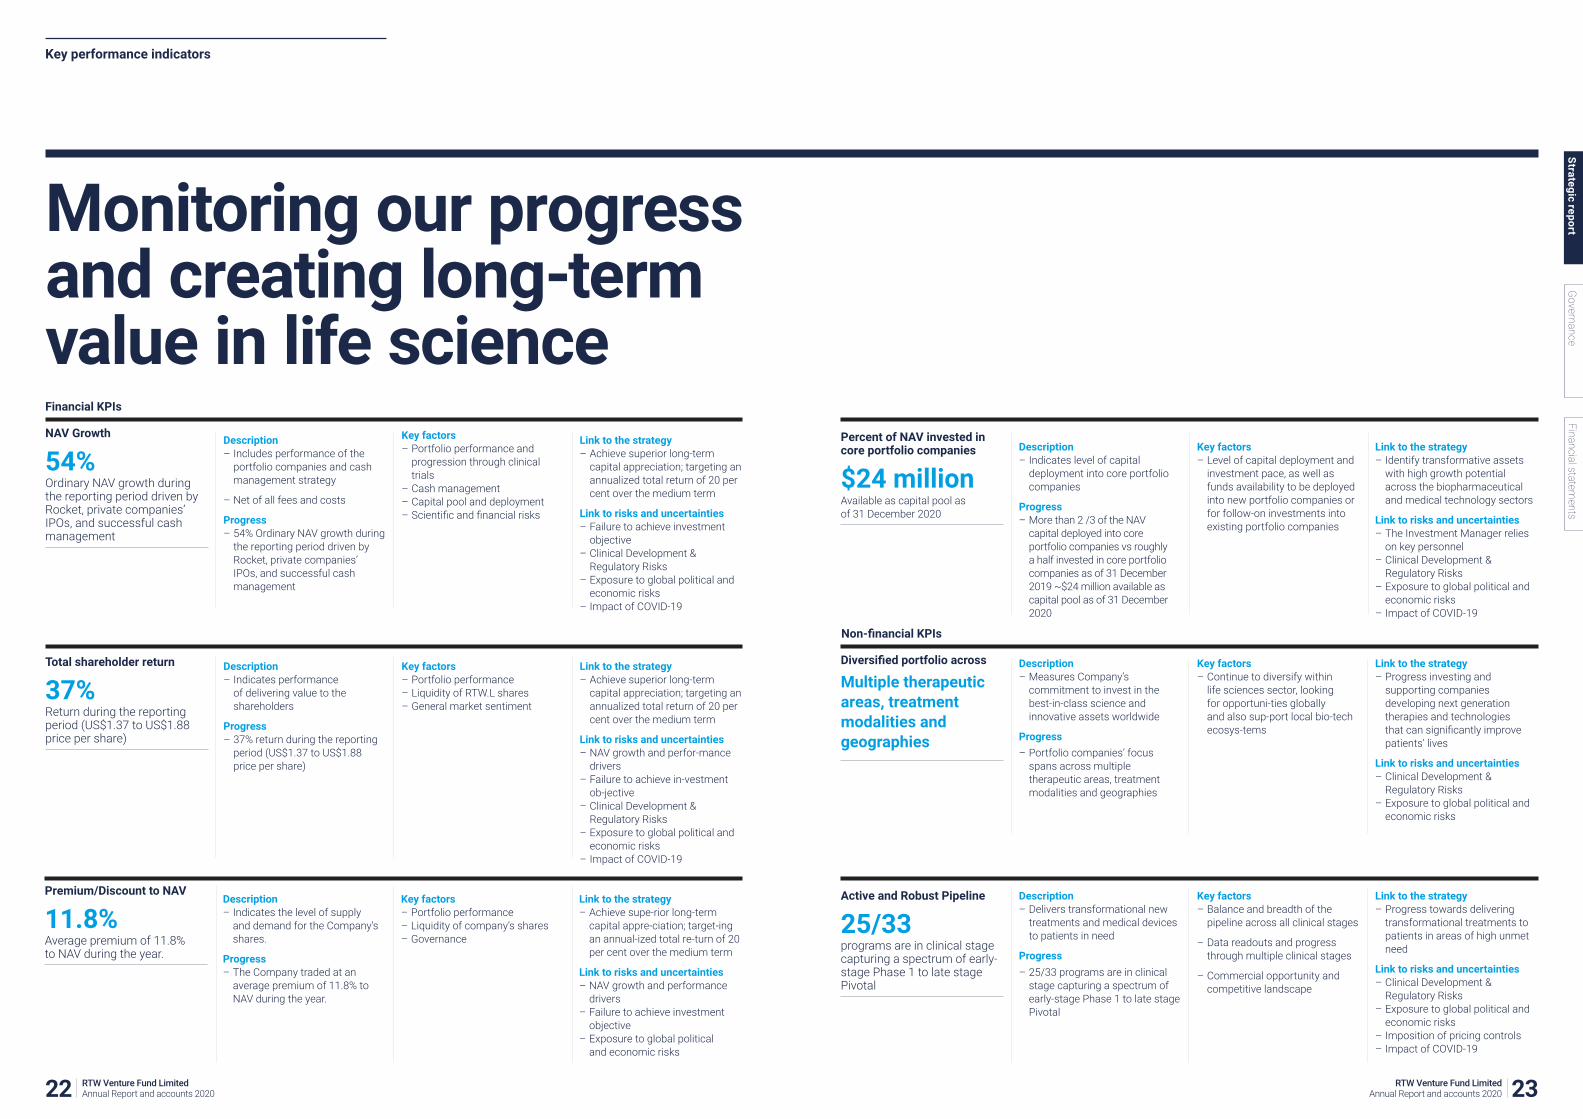
Monitoring our progress and creating long-term value in life scienceFinancial KPIs
Description – Indicates performance of delivering value to the shareholders
Progress – 37% return during the reporting period (US$1.37 to US$1.88 price per share)
Key factors – Portfolio performance – Liquidity of RTW.L shares – General market sentiment
Link to the strategy – Achieve superior long-term capital appreciation; targeting an annualized total return of 20 per cent over the medium term
Link to risks and uncertainties – NAV growth and perfor-mance drivers
– Failure to achieve in-vestment ob-jective
– Clinical Development & Regulatory Risks
– Exposuretoglobalpoliticalandeconomic risks
– Impact of COVID-19
Description – Includes performance of the portfolio companies and cash management strategy
– Net of all fees and costs
Progress – 54% Ordinary NAV growth during the reporting period driven by Rocket, private companies’ IPOs, and successful cash management
Key factors – Portfolio performance and progression through clinical trials
– Cash management – Capital pool and deployment – Scientificandfinancialrisks
Link to the strategy – Achieve superior long-term capital appreciation; targeting an annualized total return of 20 per cent over the medium term
Link to risks and uncertainties – Failure to achieve investment objective
– Clinical Development & Regulatory Risks
– Exposuretoglobalpoliticalandeconomic risks
– Impact of COVID-19
Non-financial KPIs
Description – Delivers transformational new treatments and medical devices to patients in need
Progress – 25/33 programs are in clinical stage capturing a spectrum of early-stage Phase 1 to late stage Pivotal
Key factors – Balance and breadth of the pipeline across all clinical stages
– Data readouts and progress through multiple clinical stages
– Commercial opportunity and competitive landscape
Link to the strategy – Progress towards delivering transformational treatments to patients in areas of high unmet need
Link to risks and uncertainties – Clinical Development & Regulatory Risks
– Exposuretoglobalpoliticalandeconomic risks
– Imposition of pricing controls – Impact of COVID-19
Active and Robust Pipeline
25/33programs are in clinical stage capturing a spectrum of early-stage Phase 1 to late stage Pivotal
Description – Measures Company’s commitment to invest in the best-in-class science and innovative assets worldwide
Progress – Portfolio companies’ focus spans across multiple therapeutic areas, treatment modalities and geographies
Key factors – Continue to diversify within life sciences sector, looking for opportuni-ties globally and also sup-port local bio-tech ecosys-tems
Link to the strategy – Progress investing and supporting companies developingnextgenerationtherapies and technologies thatcansignificantlyimprovepatients’ lives
Link to risks and uncertainties – Clinical Development & Regulatory Risks
– Exposuretoglobalpoliticalandeconomic risks
Diversified portfolio across
Multiple therapeutic areas, treatment modalities and geographies
Description – Indicates the level of supply and demand for the Company’s shares.
Progress – The Company traded at an average premium of 11.8% to NAV during the year.
Key factors – Portfolio performance – Liquidity of company’s shares – Governance
Link to the strategy – Achieve supe-rior long-term capital appre-ciation; target-ing an annual-ized total re-turn of 20 per cent over the medium term
Link to risks and uncertainties – NAV growth and performance drivers
– Failure to achieve investment objective
– Exposuretoglobalpolitical and economic risks
Total shareholder return
37%Return during the reporting period (US$1.37 to US$1.88 price per share)
NAV Growth
54%Ordinary NAV growth during the reporting period driven by Rocket, private companies’ IPOs, and successful cash management
Premium/Discount to NAV
11.8%Average premium of 11.8% to NAV during the year.
Description – Indicates level of capital deployment into core portfolio companies
Progress – More than 2 /3 of the NAV capital deployed into core portfolio companies vs roughly a half invested in core portfolio companies as of 31 December 2019 ~$24 million available as capital pool as of 31 December 2020
Key factors – Level of capital deployment and investment pace, as well as funds availability to be deployed into new portfolio companies or for follow-on investments into existingportfoliocompanies
Link to the strategy – Identify transformative assets with high growth potential across the biopharmaceutical and medical technology sectors
Link to risks and uncertainties – The Investment Manager relies on key personnel
– Clinical Development & Regulatory Risks
– Exposuretoglobalpoliticalandeconomic risks
– Impact of COVID-19
Percent of NAV invested in core portfolio companies
$24 millionAvailable as capital pool as of 31 December 2020
22 RTW Venture Fund Limited Annual Report and accounts 2020 23RTW Venture Fund Limited
Annual Report and accounts 2020
Governance
Strategic reportFinancial statem
ents

Aug-
15
Oct
-15
Dec-
15
Feb-
16
Apr-1
6
Apr-1
7
Jun-
16
Jun-
17
Aug-
16
Aug-
17
Oct
-16
Dec-
16
Feb-
17
Oct
-17
Dec-
17
$4,000
$3,500
$3,000
$2,500
$2,000
$1,500
$1,000
$500
0
Feb-
18
Apr-1
8
Jun-
18
Aug-
18
Oct
-18
Dec
-18
Feb-
19
Apr-1
9
Jun-
19
Aug-
19
Oct
-19
Dec
-19
Feb-
20
Apr-2
0
Jun-
20
Aug-
20
Oct
-20
Dec
-20
Feb-
21
Figure 1. RTW is a proven company builder
Market cap (US$M)
Source: RTW proprietary data, press releases, Bloomberg, CapitalIQ as of 2/26/2021. Past Performance is not a reliableindicatorandcannotberelieduponasaguidetofutureperformance.Investmentscanfluctuateinvalueandtherecanbenoassuranceoffuturereturns.
Portfolio review
Build new companies around promising academic licensesWe have the capabilities to partner with universities and in-license academic programs, by providing financial and human capital and infrastructure to entrepreneurs to advance scientific programs.
Meeting unmet needs
Identifying unmet patient needWe seek to invest and build companies developing transformative therapies. Thanks to genome, disruptive innovation of new modular technologies such as RNA medicine and gene therapy can addressed undruggable before targets by older modalities like small molecules and antibodies.
Forming and building RocketRocket was born out of a year-long study in gene therapy. In late 2015, RocketwasformedaroundasingleacademiclicensefromaEuropeanacademic institution. RTW hired a world-class management team, includingCEODr.GauravShah,COOKinnariPatel,andCMODr.JonathanSchwartz, and continued to identify additional targets and licensed four more academic programs.
Supporting Rocket through the lifecycle to IPORTWcompletedtwoprivatefinancings,syndicatingboththeSeriesA and Series B rounds, and took Rocket public through a reverse merger inJanuary2018.Webelieveopportunitiesexisttolicenseadditionalgenetherapy academic assets into the Rocket pipeline in the future. In addition to our board representation in the company, Rocket’s generous pipeline diversificationofnowfiveclinicalprogramscreatesanattractiveriskreward opportunity, giving us comfort in owning an outsized position in the company.
41.1%of NAV
<5%Portfolio company ownership
Developing first-in-class gene therapiesFive of Rocket’s clinical programs include four lentiviral vector-based gene therapies for the treatment of:
Fanconi Anemia,adifficulttotreatgeneticdiseasethatleadstobonemarrowfailureandpotentiallycancer;
Leukocyte Adhesion Deficiency-I,araregeneticdisorderofimmunodeficiencyinyoungchildren;
Pyruvate Kinase Deficiency, a rare genetic disorder affecting red blood cells;
Infantile Malignant Osteopetrosis, a rare, severe monogenic bone resorption disorder characterized by skeletal deformities, neurologic abnormalities and bone marrow failure; and an adeno-associated virus-based gene therapy for Danon disease, a devastating, paediatric heart failure condition.
Rocket’sgoalistohaveallfiveclinicalprogrambecomeapprovedfirst-in-classgenetherapies.Thecompanyisaspiringtobecomethenext “Genentech of gene therapy” and we are looking forward to supporting them on this journey.
Figure 2. Rocket’s pipeline is comprised of first-in-class gene therapies for rare and devastating, inherited genetic diseases
Preclinical Phase 1 Phase 2/Pivotal CatalystDisease area
Fanconi Anemia (LVV) Q2 2021RP-L102
Leukocyte Adhesion Deficiency-I (LVV) Q2 2021RP-A201
August 2015 Hired Gaurav Shah asCEO
August 2016 Collaboration with Lund University for IMO program
March 2016 Collaboration with CIEMATforLAD-IandPKD lenti programs
December 2015 $15M Series A financing,post-moneyvaluation $35M
November 2015 Collaboration with Fred Hutch for Fanconi Anemia lentiviral program
Feburary 2017 $25M Series B financing,postmoney valuation $85M
Collaboration with UCSD for Danon AAV program
September 2017 Inotek – Rocket reverse merger announcement
June 2019 1st patient dosed in clinical trial of Danon Disease
January 2018 Inotek – Rocket reverse merger completed
$73M public financinground
November 2018 FDA clearance of IND for LAD-1
FDA clearance of IND for FA
January 2021Rocket announces buildout of State-of-the-Art R&D and Manufacturing Facility
October 2019RTW Venture Fund IPO
December 2019EarlyfindingsforFA presented at American Society for Hematology
Rocket announces preliminary data from 1/2 in LAD-I
December 2020Rocket announces positive data updates from four programs:Danon, FA, LAD-I and PKD from 1/2 in LAD-I
October 2020Rocket announces data update from 1/2 in LAD-I
Danon Disease (AAV) H2 2021RP-A501
Pyruvate Kinase Deficiency (LVV) H2 2021RP-L301
Infantile Malignant Osteopetrosis (LVV) H2 2021RP-L401
24 RTW Venture Fund Limited Annual Report and accounts 2020 25RTW Venture Fund Limited
Annual Report and accounts 2020
Governance
Strategic reportFinancial statem
ents

Innovation is the best medicineBuilt on a foundation of deep research, RTW invests with innovative companies looking to bring important new products to patients. We believe solving unmet needs is the best way to create value. We support companies through the ups and downs of the often challenging journey to bring therapies to patients.
Executive summaryDuring 2020, the pandemic due to COVID-19 spread around the globe, affecting millions of people, and challenging the way we function as a societyandourdefinitionof“normal”.Wewouldliketotakealookback at this testing year and review the performance of the Company.
It is with pleasure that we share the strong annual results of the Company as of 31 December 2020. The Company has been publicly listedontheSpecialistFundSegmentoftheLondonStockExchangesince 30 October 2019, during which period the Company has witnessed NAV growth of 88.5% from US$168.0 million, or US$1.04 per Ordinary Share, to US$375.3 million, or US$1.96 per Ordinary Share as of 31 December 2020. For the reporting period, the NAV attributable to Ordinary Shares has grown by 53.9% from US$205.7 million NAV or US$1.27 per Ordinary Share as of 31 December 2019. Since admission, the share price has been trading at an average premium to NAV of c. 11.8%.
Roderick Wong, MD, Managing Partner
Table 1. Financial Highlights
RTW Venture Fund Limited Admission (30/10/2019)Year-end reporting period (30/10/2019-31/12/2019)
Year-end reporting period (01/01/2020-31/12/2020)
Ordinary NAV US$168.0 million US$205.7 million US$375.3 million
NAV per Ordinary Share US$1.04 US$1.27 US$1.96
NAV Growth per Ordinary Share (%) – 22% 54%
Price per Ordinary Share US$1.04 US$1.37 US$1.88
Share price growth2(%) – 32% 37%1
Benchmark returns3 Benchmark returns (iii)
Nasdaq Biotech – 12% 27%
Russell 2000 Bio-tech – 24% 53%
1 AstheCompany’sDecemberNAVwasnotpublisheduntilmid-JanuaryandtheportfolioenjoyedanexceptionallystrongmonthofperformanceinDecembertheCompany’ssharepriceis shown as being at a discount to the December 31 NAV even though its shares traded at a premium to the published November NAV during December.
2 Totalshareholderreturnisanalternativeperformancemeasure(APM).FormoreinformationpleaserefertoAPMdefinitionstableonpage91.3 Source: Capital IQ
Investment Manager’s Report
RTW Investments, LP (the “Investment Manager”, “us”, “we”), a leading NewYork-headquarteredhealthcare-focusedentrepreneurialinvestmentfirmwithastrongtrackrecordofsupportingcompaniesdevelopinglife-changing therapies, created the Company as an investment fund focused on identifying transformative assets with high growth potential across the biopharmaceutical and medical technology sectors. Driven by our deepscientificunderstandingandalong-termapproachtosupportinginnovative businesses, we invest in companies developing transformative next-generationtherapiesandtechnologiesthatcansignificantlyimprovepatients’ lives.
We are pleased to report that as of 31 December 2020, 68.7% of NAV was invested in core portfolio companies vs 49% as of 31 December 2019. We definecoreportfoliocompaniesascompaniesthatwereinitiallyaddedtoourportfolioasprivateinvestments,reflectingthekeyfocusoftheCompany’sstrategy.Ourinvestmentapproachisdefinedasfulllifecycleand therefore involves retaining our private investments well beyond their IPO, hence our core portfolio consists of both privately-held and publicly-listed companies, which were private at the time of our initial investment.
TheCompanyalsoinvestedapproximately25%ofitsNAVinpubliclylisted, non-core portfolio assets in order to mitigate any ‘cash drag’ effect during the initial investment period anticipated to be 18-24 months from launch until the portfolio is fully deployed in core portfolio companies. The non-core portfolio assets have been selected by us and are also held in our other funds. The investments represented in this portfolio are similarly categorized as innovative biotechnology and medical technology companies developing and commercializing potentially disruptive and transformational products.
SignificantperformancedriversofNAVgrowthforthereportingperiodinclude strong share price returns of Rocket (+135%) contributing c. 41%;theIPOsofsixportfoliocompaniesincludingAvidity,iTeos,Athira,Pulmonx,C4TherapeuticsandTarsus,togethercontributingc.15%;Frequency share price returns (+105%) contributing c. 2%; as well as performance of the non-core portfolio assets, contributing c. 10%. The Company’sperformancefeeallocationandexpensesmakeupthebalance of the NAV movement.
Figure 1. Performance drivers as 31 December 2020
DecreaseIncrease Total
NAV P&L Contributors
41% 2%4% 3% 3%
3%1% 2% 0% 0%
10% 1%
-13% -2%
80%
70%
60%
50%
40%
30%
20%
10%
0%
RCKT
FREQ
RNA
CCCC
ATH
A
ITO
S
LUN
G
MIS
T
TARS
Oth
erCo
re-P
ositi
ons
Non
-Cor
ePo
sitio
ns
Perfo
ranc
eal
loca
tion
Shar
eIs
suan
ces
Ope
ratin
gex
pens
e
Total:+54 NAV
Growth
Onlisting,theCompany’scoreportfolioincludedsixcompanies,fourof which are developing clinical-stage therapeutics and two med tech companies developing transformative devices.
Sincelisting,theCompanyhasaddedsixteencompaniestoitsportfolio,withoneinvestmentinNovember2019andfifteenadditionsinthe2020financialyear.Portfoliocompaniesaddedinthefirsthalfof2020havebeen also included in our half-yearly report and are listed below.
Our 2020 investments include:
Company name Description
H1 2020
Ji Xing A Shanghai-based biotechnology company that was formed bytheInvestmentManager,whichweidentifiedinourprospectus as part of our business plan. The company is focused on the development and distribution of innovative US andEuropeandrugsintheChinesemarket.
iTeos Therapeu-tics
A biotechnology company developing a TIGIT antibody for solid tumours.
Pulmonx A medical technology company commercializing Zephyr Valve for severe emphysema.
C4 Therapeutics A biotechnology company pioneering targeted protein degradation technology for blood cancers.
Athira Pharma A biotechnology company working to restore cognitive function in Alzheimer’s disease.
EncodedTherapeutics
Abiotechnologycompanydevelopingfirst-in-classgenetherapies for rare paediatric CNS disorders.
H2 2020
Milestone A biopharma company developing interventions for tachycardias.
Nikang A biotechnology company using a structure-based design to develop innovative small molecules against promising molecular targets in oncology.
Tarsus A biotechnology company focused on development and commercializationoffirst-in-classtherapeuticsforophthalmic conditions.
Prometheus A precision medicine biotechnology company developing an anti-TL1Aantibodyforinflammatoryboweldisease.
Nuance Pharma A China-based fully integrated specialty pharma focused on irondefi-ciency,painmanagementandrespiratoryconditions.
RTW Royalty Co A royalty holding company formed by the Investment Manager.
Biomea Fusion A biotechnology company developing irreversible menin inhibitor to treat cancer.
Tenaya A biotechnology company developing therapies that can address the underlying cause of heart disease, with a lead gene therapy asset for hypertrophic cardiomyopathy.
Undisclosed* A medical diagnostic company.
* Subjecttoconfidentiality
22 portfolio companies
68.7% NAV was invested in core portfolio companies
16 added since admission
54% NAV growth in 2020
27RTW Venture Fund Limited Annual Report and accounts 2020
Governance
Strategic reportFinancial statem
ents
26 RTW Venture Fund Limited Annual Report and accounts 2020

Key updates for Portfolio Companies during 2020:Clinical
– In March 2020, Beta Bionics began its pivotal trial of the insulin-only configurationoftheiLetBionicPancreas.
– In April 2020, iTeos announced initial data from the dose escalation portion of the Phase 1/2a trial in advanced solid tumours that showed EOS-850waswelltoleratedwithnodose-limitingtoxicitiesobserved.EOS-850showedpreliminarysingle-agentclinicalbenefitinsevenpatients who continued to present with at least stable disease and two partial responses in heavily pre-treated patients.
– InMay2020,Frequencysharedtop-linedatafromanexploratoryclinical study showing drug levels of its lead molecule FX-322 can be directlymeasuredinthecochlea.Inadditiontoconfirmingtheviabilityof the approach, the study results showed measurable concentrations of FX-322 in every patient and that anatomical factors did not prevent the active agents of FX-322 from reaching the cochlea.
– In May 2020, Orchestra BioMed presented results from a double-blind randomized clinical trial of BackBeat™ Cardiac Neuromodulation Therapy in patients with hypertension, which demonstrated a significantreductioninsystolicbloodpressurecomparedtothecontrolgroupaftersixmonthsoftherapy.
– In June 2020, iTeos presented preclinical data for its investigational anti-TIGITantibody,EOS-448thatdemonstratedstrongfunctionalactivityandacleansafetyprofileinitspreclinicalstudies.iTeosenrolledthefirstpatientinthedoseescalationportionofitsPhase1/2astudywithEOS-448inFebruary2020.
– In November 2020, Immunocore announced that tebentafusp, its lead late-stage clinical program, met its primary endpoint of overall survival (OS) in Phase 3 trial for previously untreated metastatic uveal melanoma.Tebentafusphasthepotentialtobethefirstnewtherapytoimprove OS in patients with metastatic uveal melanoma in 40 years.
– In December 2020, Rocket shared positive data readouts on four of its
clinical programs, two of which were updates to previously reported dataandtwoofwhichrepresentedfirst-timePhaseIreadoutsfor:(1)Update to its lentiviral vector (LVV)-based gene therapy programs for the treatment of Fanconi Anaemia (FA) and (2) Leukocyte Adhesion Deficiency-I(LAD-I),(3)first-timereadoutforPyruvateKinaseDeficiency(PKD)and(4)first-timereadoutforanadeno-associatedvirus (AAV)-based gene therapy for Danon disease, a devastating, paediatric heart failure condition.
Financing – InJuly2020,JiXingannouncedanexclusivelicencingagreementwithCytokinetics to develop and commercialize CK-274, a novel cardiac myosin inhibitor, in China. Following this announcement, the Company participated alongside our other investment vehicles in a Series A funding round, investing US$5 million.
– BetweenJuneandOctober2020,sixportfoliocompanies(Avidity,iTeos,Athira,Pulmonx,C4Therapeutics,andTarsus)launchedaninitialpublicoffering(IPO)withanaverage1.8xvaluationstep-upfromthe initial time of investment to IPO, followed by an additional average +38%performanceonthefirstdayoftrading.
– In early 2020, we seeded our latest new company creation Ji Xing, a Shanghai-based biotechnology company focused on the development anddistributionofinnovativeUSandEuropeandrugsintheChinesemarket. Ji Xing will leverage clinical development and commercial expertiseintheUnitedStatesandEuropetobringglobalinnovativemedicines to Chinese patients.
– In December 2020, Immunocore completed a US$75 million Series C financinground.TheannouncementcamefollowingpositivePhase3trial interim analysis data for tebentafusp in patients with metastatic uveal melanoma that Immunocore presented in the same month. The Company alongside other vehicles managed by the Investment Managerparticipatedinthefinancinground.
Figure 2. Portfolio breakdown, by (A) modality, (B) therapeutic focus, (C) clinical stage and (D) geography as of 31 December 2020
Portfolio companies by modality
Antibody Spec pharma
Small molecule
Genetic Medicine*
Medtech
19%
19%
19%
5%
38%
28%
18%
19%
10%
5%
5%
5%5%
5%
Portfolio companies by therapeutic areas
Type 1 Diabetes
Ophthalmology
Hearing loss Pulmonary Neurology
Oncology
Cardiovascluar
Rare disease
Autoimmune & Inflammation
Portfolio programs by clinical stage
Phase 3/Pivotal
9
65
11
Number of programs
Phase 2Preclinical
Phase 1
Portfolio companies by geography
USA
76%
10%
14%
UK
China
* Genetic medicine includes gene therapy and RNA medicines.
Portfolio performance and updatesThe Company’s share price traded at an average premium of c. 11.8% since inception (Figure 3A). The Company’s overall returns since inception are in line with its biotech benchmarks, generating an overall return of c. 81% vs c. 87% by the small and mid-cap heavy Russell 2000 Biotechnology Indexandoutperformingthelarge-capheavyNasdaqBiotechnologyIndex,whichreturnedc.41%(Figure3Bnote:thereportingperiodforthis chart is 30 October 2019 to 31 December 2020). During the twelve-month reporting period, the Company’s share price grew by c. 37%, whilst theNasdaqBiotechnologyIndexreturnedc.27%andtheRussell2000Biotechnologyindexreturnedc.53%forthesameperiod,respectively.
Source Capital IQ.
Figure 3. RTW.L share price performance (A) and returns (B) as of 31 December 2020
Investment Manager’s Report (continued)
Source Capital IQ.
Rocket has continued to progress its strong clinical pipeline despite minor COVID-19-related delays. In December 2020, in line with prior milestone and catalyst guidance, Rocket shared positive data readouts on four of its clinical programs. Given highly anticipated positive news on clinical trials progress Rocket’s share price traded up (+83.4%) on 09 December 2020, translating into a materially accretive NAV performance fortheCompany.Withtheexcitingnewsandsharepriceappreciation,the position size of Rocket grew to c. 41% of NAV as of the end of 2020. Whilst it is indeed the largest position in the portfolio, we view Rocket as adiversifiedgenetherapyholdingcompanyandwewillcontinuetoaddpromising gene therapy assets to its pipeline. The Investment Manager has three board seats with Dr. Roderick Wong serving as a chairman ofRocket’sboardofdirectors.Rocketisaspiringtobecomethenext“Genentech of gene therapy” and we are looking forward to supporting them on this journey.
In2020,sixportfoliocompanies,whichincludedAvidity,iTeos,Athira,Pulmonx,C4TherapeuticsandTarsus,havegonepublicviaanIPOwithanaverage1.8xstep-upfromtheinitialtimeofinvestmenttoIPOandanaverage holding period of 0.4 years, followed by an additional average c. 38%performanceonthefirstdayoftrading.
c.11.8%average premium for share price trade
37% share price growth during the twelve-month reporting period
US$24min cash / cash equivalents
81% total shareholder return since inception
RTW.L
Russell 2000 Biotech
NBI
RTW.L performance vs biotech benchmarks
Capital IQ
-25%
-5%
15%
35%
55%
75%
95%
115%
Oct
19
Nov
19
Dec1
9
Jan
20
Feb
20
Mar
20
Apr 2
0
May
20
Jun
20
Jul 2
0
Aug
20
Sep
20
Oct
20
Nov
20
Dec
20
Jan
21
RTW.L Share Price
NAV per share
RTW.L share price vs nav per ordinary share
Capital IQ
1.00
1.20
1.40
1.60
1.80
2.00
2.20
US$
Oct
19
Nov
19
Dec1
9
Jan
20
Feb
20
Mar
20
Apr 2
0
May
20
Jun
20
Jul 2
0
Aug
20
Sep
20
Oct
20
Nov
20
Dec
20
Jan
21
As of 31 December 2020, the portfolio now includes 22 companies thatarediversifiedacrosstreatmentmodalities,therapeuticfocus,andclinical stage of their programs (Figure 2A-C). While the portfolio remains dominated by US-based companies (Figure 2D), we are committed to addingUKandEU-basedcompaniesinanefforttosupportthebestassets globally and foster local biotech ecosystems.
The current investment pace remains on track and is in accordance with our track record of investing in 10-12 private biotech and medtech companies per annum. We look forward to continue deploying capital in 2021 and updating our shareholders in due course.
28 RTW Venture Fund Limited Annual Report and accounts 2020 29RTW Venture Fund Limited
Annual Report and accounts 2020
Governance
Strategic reportFinancial statem
ents

Table 2. Performance of private and public portfolio investments as of 31 December 2020
Private companyInitial Investment
DateGross MOC
Gross XIRR
Holding Period
(Years)
Beta Bionics 28/6/2019 1.1x 5.0% 1.5 Orchestra BioMed 28/6/2019 1.0x (2.7%) 1.5 Frequency* 17/7/2019 3.3x 128.1% 1.5 Immunocore 13/8/2019 1.0x 4.3% 1.4 Landos 9/8/2019 0.9x (9.6%) 1.4Avidity* 8/11/2019 2.8x 147.2% 1.1 Ji Xing 10/2/2020 1.0x 5.6% 0.9 iTeos* 24/3/2020 3.7x 440.0% 0.8 Pulmonx* 17/4/2020 5.4x 974.6% 0.7 Athira* 29/5/2020 4.7x 1260.9% 0.6 C4 Therapeutics* 2/6/2020 3.7x 869.6% 0.6 Encoded 12/6/2020 1.0x 0.0% 0.6 Milestone^ 23/7/2019 1.7x 273.3% 0.4NiKang 9/9/2020 1.0x 0.0% 0.3Tarsus* 24/9/2020 3.0x 5536.2% 0.3Prometheus 30/10/2020 1.0x 0.0% 0.2RTW Royalty Holdings 13/11/2020 1.0x (0.4%) 0.1Nuance 8/12/2020 1.0x 0.0% 0.1Tenaya 17/12/2020 1.0x 0.0% 0.0Undisclosed 24/12/2020 1.0x 0.0% 0.0Biomea 23/12/2020 1.0x 0.0% 0.0Average 2.0x 459% 0.7
Public companyPrice per share as of 29/10/2019
market close
Price per share at the end
of the period (31/12/2020) % return
Rocket US$14.00 US$54.84 292%
* ThesepositionsoriginatedintheportfolioasprivatecompaniesandsincetheCompany’sIPOhavegonepublic;asof31December2020,iTeos,Athira,Pulmonx,C4TherapeuticsandTarsus were under 180-day lock-up provision. ^Milestone is a public company, the Company holds private warrants.
Table 3. NAV capital breakdown as of 31 December 2020
Type % of NAV
Core portfolio assets (private and public) 68.7%Non-core portfolio assets 25.4%Cash, due to/from brokers, other* 5.9%Total 100%
* Otherincludesliabilitiessuchasotherpayablesandaccruedexpenses.
Asof31December2020,ourtopfiveholdingsofnon-coreportfolioassetsconsistedof:Immunovant(ticker:“IMVT”),abiotechdevelopingtreatmentsfor autoimmune diseases based on FcRn technology, Stoke Therapeutics (ticker: “STOK”), a biotech working to address the underlying cause of severediseasesbyup-regulatingproteinexpressionwithRNA-basedmedicine,PTCTherapeutics(ticker:”PTCT”),ageneticmedicinecompanyworkingonrarediseases,Alnylam(ticker:“ALNY”),aleadingRNAmedicinecompany,andMirati(ticker:“MRTX”),anoncologybiotechdevelopingnoveltherapeuticsbytargetinggeneticandimmunologicdriversofcancer.Weexpecttodeploythecapitalinvestedintonon-coreportfolioassetsintoprivate companies as the new opportunities arise.
Table 4. Overview of portfolio companies’ valuations* as of 31 December 2020
Portfolio Company Public/ Private
Company’s % interest
Portfolio Company’s
capital as of 31 December
2020
Valuation of Company’s
investment as of 31 December
2019
% of Company’s net assets of 31 December
2019
Valuation of Company’s
investment as of31 December
2020
% of Company’s net assets as of
31 December 2020
YTD P&L as of31 December
2020
YTD P&L as a % of Company’s
net assetsValuation hierarchy
Rocket Public <5% US$70.3M 32.8% US$169.4M 41.1% US$99.1M 24.0% Level 1Avidity Public <5% US$5.0M 2.3% US$16.2M 3.9% US$9.7M 2.4% Level 1Tarsus Public** <1% NA NA US$10.2M 2.5% US$6.5M 1.6% Level 2^Athira Public** <1% NA NA US$10.2M 2.5% US$7.6M 1.8% Level 2^C4 Therapeu-tics Public** <1% NA NA US$9.6M 2.3% US$6.7M 1.6% Level 2^
Frequency Public <1% US$3.9M 1.8% US$8.9M 2.2% US$4.7M 1.1% Level 1RTW Royalty Holdings Private <10% NA NA US$8.2M 2.0% US$0.0M 0.0% Level 3
Immunocore Private <1% US$5.4M 2.5% US$6.8M 1.7% -US$0.1M 0.0% Level 3Ji Xing Private <20% NA NA US$5.4M 1.3% US$0.1M 0.0% Level 3Beta Bionics Private <5% US$5.2M 2.4% US$5.4M 1.3% US$0.2M 0.1% Level 3Pulmonx Public** <1% NA NA US$4.4M 1.1% US$3.8M 0.9% Level 2^Tenaya Private <5% NA NA US$4.4M 1.1% US$0.0M 0.0% Level 3Landos Private <5% US$5.1M 2.4% US$4.3M 1.1% -US$0.7M -0.2% Level 3iTeos Public** <1% NA NA US$4.0M 1.0% US$2.8M 0.7% Level 2^Milestone Public <5% US$2.3M 1.1% US$3.7M 0.9% -US$0.2M 0.0% Level 1NiKang Private <5% NA NA US$2.7M 0.6% US$0.0M 0.0% Level 3Orchestra Private <5% US$2.4M 1.1% US$2.4M 0.6% US$0.0M 0.0% Level 3Encoded Private <1% NA NA US$2.0M 0.5% US$0.0M 0.0% Level 3Nuance Private <1% NA NA US$1.8M 0.4% US$0.0M 0.0% Level 3Prometheus Private <1% NA NA US$1.4M 0.4% US$0.0M 0.0% Level 3Biomea Private <1% NA NA US$1.1M 0.3% US$0.0M 0.0% Level 3Undisclosed Private <1% NA NA US$0.9M 0.2% US$0.0M 0.0% Level 3
* Valuations for Private Portfolio Companies on a fair market value basis as of 31 December 2020. The valuations of Rocket, Frequency, Avidity, iTeos, Athira, C4 Therapeutics, Milestone, Pulmonx,andTarsushavebeencalculatedusingtheirmarketcapitalizationasattheLatestPracticableDate.**InaccordancewiththeCompany’svaluationpolicy,theCompanyappliesa discount to its investments in Private Portfolio Companies which become Public Portfolio Companies that are subject to customary post-IPO lock-up provisions. ^Also includes Level 1 securities purchased at or after portfolio company IPO.
During the period ended 31 December 2020, three members of the Investment Manager served on the board of directors of Rocket and one member served on the board of directors of Avidity, Landos, Ji Xing, and NiKang, which in aggregate represented 48%. of NAV of the Company.
Investment Manager’s Report (continued)
30 RTW Venture Fund Limited Annual Report and accounts 2020 31RTW Venture Fund Limited
Annual Report and accounts 2020
Governance
Strategic reportFinancial statem
ents

Summary of portfolio assets:As of 31 December 2020, the Company’s portfolio included 22 companies, ranging from biotechnology companies developing preclinical to clinical-stage therapeutic programs, companies developing traditional small molecule pharmaceuticals, and four med-tech companies developing or commercializingtransformativedevices.WeselectedtheCompany’sportfoliocompaniesbaseduponourrigorousassessmentofscientificandcommercial potential, opportunities to positively impact value, and with regard to the valuation of the assets at the time of investment.
Table 5. Portfolio companies as of 31 December 2020
Modality
Clinical trial stage*
Therapeutic focusPreclinical Phase 1 Phase 2 Phase 3 or Pivotal Commercial
Medtech Pulmonary
Small molecule Spec Pharma
Medtech Oncology
Medtech Type 1 Diabe-tes
Antibody Oncology
Medtech Cardiovascular
Small molecule Cardiovascular
Small molecule Ophthalmolo-gy
Small molecule Cardiovascular
Small molecule Hearing loss
Small molecule Autoimmune disease
Gene therapy Rare disease
Small molecule Neurology
Small molecule Cardiovascular
Antibody Oncology
Antibody Autoimmune disease
Small molecule Oncology
RNA Rare disease
Gene therapy Rare disease
Small molecule Oncology
Small molecule Oncology
Gene therapy Cardiovascular
* Based on clinical stage of the leading program.
Undisclosed
RTW Royalty Co
Table 6. Overview of Portfolio Companies’ assets clinical development status as of 31 December 2020
Company Indication Phase Status
Avidity Myotonic Dystrophy Preclinical Enteringtheclinicin2021Beta Bionics Type 1 diabetes Pivotal OngoingFrequency Sensorineural hearing loss Phase 2 Ongoing, top-line data Q1 2021
Multiple sclerosis Discovery IND submission H2 2021Immunocore
Uveal melanoma Pivotal BLA submission in 2021Solidtumours,expressingMAGE-A4 Phase 1/2 Data in H2 2021, partnership with
GenentechSolidtumours,PRAME Phase 1/2 Data in mid-2022Hepatitis B Virus (HBV) Phase 1 Ongoing
Landos Ulcerative Colitis Phase 3 Planning stageCrohn’s Disease Phase 2 Ongoing
Orchestra In-stent coronary resteno-sis Pivotal OngoingPersistent hypertension Pivotal Ongoing
Rocket Fanconi Anaemia Pivotal Ongoing, data update in H1 2021Danon Disease Phase 1 Ongoing, shared an update in Q4 2020Leukocyteadhesiondefi-ciency(LAD-I) Pivotal Planning stagePyruvateKinaseDeficien-cy(PKU) Phase 1 Ongoing, shared an update in Q4 2020Infantile Malignant Osteo-porosis (IMO) Phase 1 Ongoing
JI Xing Cardiovascular Phase 1 Start in Q1 2021iTeos Oncology, solid tumour a2a antagonist Phase 1/2 Data update in Q1 2021
Oncology, solid tumour TIGIT Phase 1/2 Data update in Q1 2021Pulmonx Pulmonary, Zephyr Valve Commercial OngoingAthira Alzheimer’s Disease Phase 2/3 OngoingC4T Multiple Myeloma & Lym-phoma Phase 1 OngoingEncoded Dravet syndrome Preclinical OngoingMilestone Cardiovascular Phase 3 OngoingNikang Oncology Preclinical OngoingTarsus Blepharitisdemodex Phase 3 Data read out in H1 2021Prometheus IBD Phase 1 Data update in H1 2021RTW Royalty Co HCM Pivotal OngoingNuance Irondeficiency Commercial Ongoing
Pain management Phase 3 Planning stageBiomea Oncology Preclinical OngoingTenaya HCM Preclinical OngoingUndisclosed Cancer diagnostic Pivotal Ongoing
Investment Manager’s Report (continued)
Key Portfolio Company Events Post Period EndOn 3 February 2021, Landos announced pricing of its US$100 million IPO, by offering 6,250,000 shares at US$16.00 per share. The shares began trading on Nasdaq Global Market on 4 February 2021 under ticker “LABP”. Since IPO Landos shares have traded down 9.58 per cent. as of 19 April 2021.
On 5 February 2021, Immunocore announced pricing of its US$258.3 million IPO, by offering 9,935,896 shares at US$26.00 per share. The shares began trading on Nasdaq Global Market on 5 February 2021 under ticker “IMCR”. Since IPO Immunocore shares have traded down 9.28 per cent. as of 19 April 2021.
On 11 March 2021, Prometheus announced pricing of its US$190 million IPO, by offering 10 million shares at US$19.00 per share. The shares began trading on Nasdaq Global Market on 12 March 2021 under ticker “RXDX”. Since IPO Prometheus shares have traded up 9.92 per cent. as of 19 April 2021.
On 23 March 2021, Frequency announced top-line data from its Phase 2a clinical study of FX-322 in sensorineural hearing loss (SNHL), the interim results did not demonstrate improvements in hearing measures versus placebo.
On 14 April 2021, Biomea announced pricing of its US$153 million IPO, by offering 9 million shares at US$17.00 per share. The shares began trading onNasdaqGlobalMarketon16April2021underticker“BMEA”.SinceIPOBiomea share have traded down 8.6 per cent. as of 19 April 2021.
The Company’s investments in Landos, Immunocore, Prometheus, and Biomea remain under 180-day lock-up provision.
Between January and April 2021, the Company has added seven portfolio companies: Ancora Heart, Visus Therapeutics, Artiva Biotherapeutics, VentyxBiosciences,MonteRosaTherapeutics,PyxisOncologyandGHResearch.
Sector review and 2021 outlook The innovation boom. We are living in an era where innovation is accelerating at breakneck speed with unparalleled opportunities for value creation. Globally, biotech markets are growing rapidly. According toGlobalMarketInsights,theglobalbiotechmarketisexpectedtogrowwith a compound annual growth rate, or CAGR, of 9.9% from 2019 to 2025. We are seeing validated technologies, such as those derived from DNA and RNA science, that can effectively deliver therapeutic solutions across large swaths of diseases, resulting in companies with highly efficientdevelopmentengines.Webelievethereisanopportunitytoofferattractive risk-adjusted returns to shareholders by building companies that possess unique and heretofore unrecognized growth opportunities thatwillbenefitbycapitalization,proactiveskilledmanagement,andsupportive and sustainable governance practices.
Genetic therapies are on the rise. Cheap genetic information has revolutionized the discovery process, which is yielding validated drug targets at an unprecedented rate. According to the National Human GenomeResearchInstitute,theapproximatecosttosequenceahumangenome fell to less than $1,000 in 2020. This reduction in cost has fuelled tremendous productivity. According to data from the United States Patent andTrademarkOffice,thenumberofpatentshasinflectedupwardsince2010, which is translating into more new drugs in company pipelines.
32 RTW Venture Fund Limited Annual Report and accounts 2020 33RTW Venture Fund Limited
Annual Report and accounts 2020
Governance
Strategic reportFinancial statem
ents
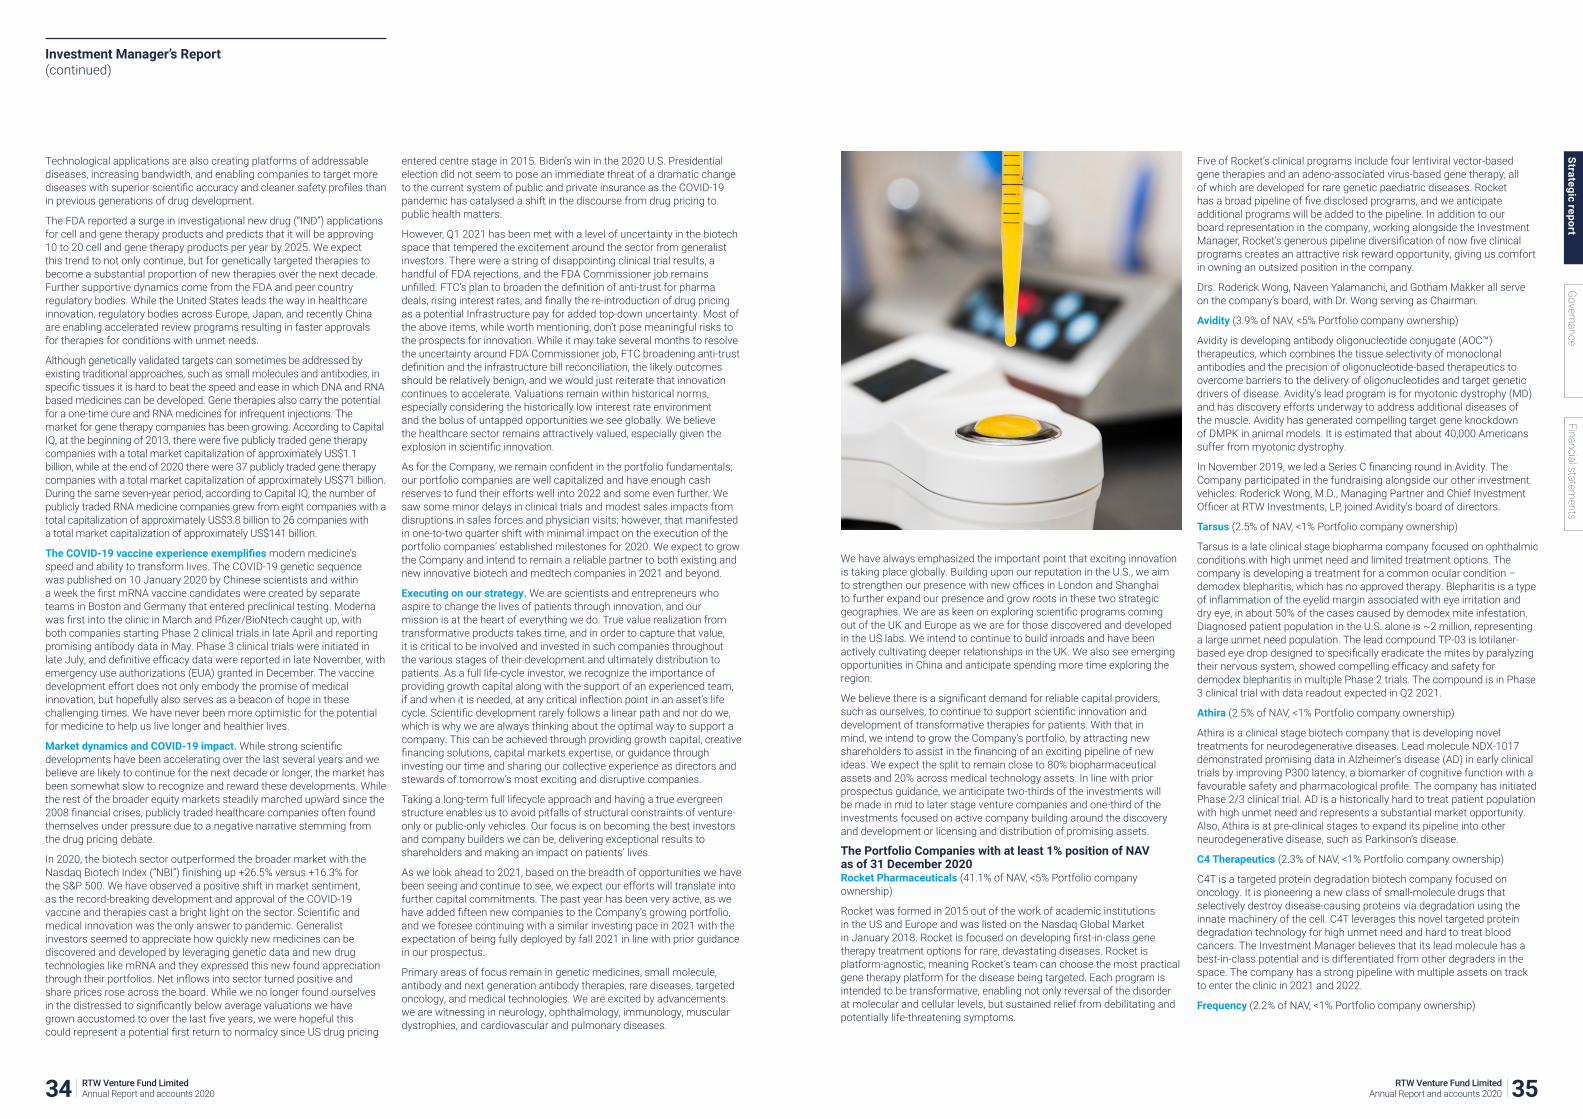
Technological applications are also creating platforms of addressable diseases, increasing bandwidth, and enabling companies to target more diseaseswithsuperiorscientificaccuracyandcleanersafetyprofilesthanin previous generations of drug development.
The FDA reported a surge in investigational new drug (“IND”) applications for cell and gene therapy products and predicts that it will be approving 10to20cellandgenetherapyproductsperyearby2025.Weexpectthis trend to not only continue, but for genetically targeted therapies to becomeasubstantialproportionofnewtherapiesoverthenextdecade.Further supportive dynamics come from the FDA and peer country regulatory bodies. While the United States leads the way in healthcare innovation,regulatorybodiesacrossEurope,Japan,andrecentlyChinaare enabling accelerated review programs resulting in faster approvals for therapies for conditions with unmet needs.
Although genetically validated targets can sometimes be addressed by existingtraditionalapproaches,suchassmallmoleculesandantibodies,inspecifictissuesitishardtobeatthespeedandeaseinwhichDNAandRNAbased medicines can be developed. Gene therapies also carry the potential for a one-time cure and RNA medicines for infrequent injections. The market for gene therapy companies has been growing. According to Capital IQ,atthebeginningof2013,therewerefivepubliclytradedgenetherapycompanieswithatotalmarketcapitalizationofapproximatelyUS$1.1billion, while at the end of 2020 there were 37 publicly traded gene therapy companieswithatotalmarketcapitalizationofapproximatelyUS$71billion.During the same seven-year period, according to Capital IQ, the number of publicly traded RNA medicine companies grew from eight companies with a totalcapitalizationofapproximatelyUS$3.8billionto26companieswith atotalmarketcapitalizationofapproximatelyUS$141billion.
The COVID-19 vaccine experience exemplifies modern medicine’s speed and ability to transform lives. The COVID-19 genetic sequence was published on 10 January 2020 by Chinese scientists and within aweekthefirstmRNAvaccinecandidateswerecreatedbyseparateteams in Boston and Germany that entered preclinical testing. Moderna wasfirstintotheclinicinMarchandPfizer/BioNtechcaughtup,withboth companies starting Phase 2 clinical trials in late April and reporting promising antibody data in May. Phase 3 clinical trials were initiated in lateJuly,anddefinitiveefficacydatawerereportedinlateNovember,withemergencyuseauthorizations(EUA)grantedinDecember.Thevaccinedevelopment effort does not only embody the promise of medical innovation, but hopefully also serves as a beacon of hope in these challenging times. We have never been more optimistic for the potential for medicine to help us live longer and healthier lives.
Market dynamics and COVID-19 impact.Whilestrongscientificdevelopments have been accelerating over the last several years and we believearelikelytocontinueforthenextdecadeorlonger,themarkethasbeen somewhat slow to recognize and reward these developments. While the rest of the broader equity markets steadily marched upward since the 2008financialcrises,publiclytradedhealthcarecompaniesoftenfoundthemselves under pressure due to a negative narrative stemming from the drug pricing debate.
In 2020, the biotech sector outperformed the broader market with the NasdaqBiotechIndex(“NBI”)finishingup+26.5%versus+16.3%for the S&P 500. We have observed a positive shift in market sentiment, as the record-breaking development and approval of the COVID-19 vaccineandtherapiescastabrightlightonthesector.Scientificandmedical innovation was the only answer to pandemic. Generalist investors seemed to appreciate how quickly new medicines can be discovered and developed by leveraging genetic data and new drug technologieslikemRNAandtheyexpressedthisnewfoundappreciationthroughtheirportfolios.Netinflowsintosectorturnedpositiveandshare prices rose across the board. While we no longer found ourselves inthedistressedtosignificantlybelowaveragevaluationswehavegrownaccustomedtooverthelastfiveyears,wewerehopefulthiscouldrepresentapotentialfirstreturntonormalcysinceUSdrugpricing
entered centre stage in 2015. Biden’s win in the 2020 U.S. Presidential election did not seem to pose an immediate threat of a dramatic change to the current system of public and private insurance as the COVID-19 pandemic has catalysed a shift in the discourse from drug pricing to public health matters.
However, Q1 2021 has been met with a level of uncertainty in the biotech spacethattemperedtheexcitementaroundthesectorfromgeneralistinvestors. There were a string of disappointing clinical trial results, a handful of FDA rejections, and the FDA Commissioner job remains unfilled.FTC’splantobroadenthedefinitionofanti-trustforpharmadeals,risinginterestrates,andfinallythere-introductionofdrugpricingas a potential Infrastructure pay for added top-down uncertainty. Most of the above items, while worth mentioning, don’t pose meaningful risks to the prospects for innovation. While it may take several months to resolve the uncertainty around FDA Commissioner job, FTC broadening anti-trust definitionandtheinfrastructurebillreconciliation,thelikelyoutcomesshould be relatively benign, and we would just reiterate that innovation continues to accelerate. Valuations remain within historical norms, especially considering the historically low interest rate environment and the bolus of untapped opportunities we see globally. We believe the healthcare sector remains attractively valued, especially given the explosioninscientificinnovation.
AsfortheCompany,weremainconfidentintheportfoliofundamentals;our portfolio companies are well capitalized and have enough cash reserves to fund their efforts well into 2022 and some even further. We saw some minor delays in clinical trials and modest sales impacts from disruptions in sales forces and physician visits; however, that manifested inone-to-twoquartershiftwithminimalimpactontheexecutionoftheportfoliocompanies’establishedmilestonesfor2020.WeexpecttogrowtheCompanyandintendtoremainareliablepartnertobothexistingandnew innovative biotech and medtech companies in 2021 and beyond.
Executing on our strategy. We are scientists and entrepreneurs who aspire to change the lives of patients through innovation, and our mission is at the heart of everything we do. True value realization from transformative products takes time, and in order to capture that value, it is critical to be involved and invested in such companies throughout the various stages of their development and ultimately distribution to patients. As a full life-cycle investor, we recognize the importance of providinggrowthcapitalalongwiththesupportofanexperiencedteam,ifandwhenitisneeded,atanycriticalinflectionpointinanasset’slifecycle.Scientificdevelopmentrarelyfollowsalinearpathandnordowe,which is why we are always thinking about the optimal way to support a company. This can be achieved through providing growth capital, creative financingsolutions,capitalmarketsexpertise,orguidancethroughinvestingourtimeandsharingourcollectiveexperienceasdirectorsandstewardsoftomorrow’smostexcitinganddisruptivecompanies.
Taking a long-term full lifecycle approach and having a true evergreen structure enables us to avoid pitfalls of structural constraints of venture-only or public-only vehicles. Our focus is on becoming the best investors andcompanybuilderswecanbe,deliveringexceptionalresultstoshareholders and making an impact on patients’ lives.
As we look ahead to 2021, based on the breadth of opportunities we have beenseeingandcontinuetosee,weexpectoureffortswilltranslateintofurther capital commitments. The past year has been very active, as we haveaddedfifteennewcompaniestotheCompany’sgrowingportfolio,and we foresee continuing with a similar investing pace in 2021 with the expectationofbeingfullydeployedbyfall2021inlinewithpriorguidancein our prospectus.
Primary areas of focus remain in genetic medicines, small molecule, antibodyandnextgenerationantibodytherapies,rarediseases,targetedoncology,andmedicaltechnologies.Weareexcitedbyadvancementswe are witnessing in neurology, ophthalmology, immunology, muscular dystrophies, and cardiovascular and pulmonary diseases.
Wehavealwaysemphasizedtheimportantpointthatexcitinginnovationis taking place globally. Building upon our reputation in the U.S., we aim tostrengthenourpresencewithnewofficesinLondonandShanghaitofurtherexpandourpresenceandgrowrootsinthesetwostrategicgeographies.WeareaskeenonexploringscientificprogramscomingoutoftheUKandEuropeasweareforthosediscoveredanddevelopedin the US labs. We intend to continue to build inroads and have been actively cultivating deeper relationships in the UK. We also see emerging opportunitiesinChinaandanticipatespendingmoretimeexploringtheregion.
Webelievethereisasignificantdemandforreliablecapitalproviders,suchasourselves,tocontinuetosupportscientificinnovationanddevelopment of transformative therapies for patients. With that in mind, we intend to grow the Company’s portfolio, by attracting new shareholderstoassistinthefinancingofanexcitingpipelineofnewideas.Weexpectthesplittoremaincloseto80%biopharmaceuticalassets and 20% across medical technology assets. In line with prior prospectus guidance, we anticipate two-thirds of the investments will be made in mid to later stage venture companies and one-third of the investments focused on active company building around the discovery and development or licensing and distribution of promising assets.
The Portfolio Companies with at least 1% position of NAV as of 31 December 2020Rocket Pharmaceuticals (41.1% of NAV, <5% Portfolio company ownership)
Rocket was formed in 2015 out of the work of academic institutions intheUSandEuropeandwaslistedontheNasdaqGlobalMarketinJanuary2018.Rocketisfocusedondevelopingfirst-in-classgenetherapy treatment options for rare, devastating diseases. Rocket is platform-agnostic, meaning Rocket’s team can choose the most practical genetherapyplatformforthediseasebeingtargeted.Eachprogramisintended to be transformative, enabling not only reversal of the disorder at molecular and cellular levels, but sustained relief from debilitating and potentially life-threatening symptoms.
Five of Rocket’s clinical programs include four lentiviral vector-based gene therapies and an adeno-associated virus-based gene therapy, all of which are developed for rare genetic paediatric diseases. Rocket hasabroadpipelineoffivedisclosedprograms,andweanticipateadditional programs will be added to the pipeline. In addition to our board representation in the company, working alongside the Investment Manager,Rocket’sgenerouspipelinediversificationofnowfiveclinicalprograms creates an attractive risk reward opportunity, giving us comfort in owning an outsized position in the company.
Drs.RoderickWong,NaveenYalamanchi,andGothamMakkerallserveon the company’s board, with Dr. Wong serving as Chairman.
Avidity (3.9% of NAV, <5% Portfolio company ownership)
Avidity is developing antibody oligonucleotide conjugate (AOC™) therapeutics, which combines the tissue selectivity of monoclonal antibodies and the precision of oligonucleotide-based therapeutics to overcome barriers to the delivery of oligonucleotides and target genetic drivers of disease. Avidity’s lead program is for myotonic dystrophy (MD) and has discovery efforts underway to address additional diseases of the muscle. Avidity has generated compelling target gene knockdown of DMPK in animal models. It is estimated that about 40,000 Americans suffer from myotonic dystrophy.
InNovember2019,weledaSeriesCfinancingroundinAvidity.TheCompany participated in the fundraising alongside our other investment vehicles. Roderick Wong, M.D., Managing Partner and Chief Investment OfficeratRTWInvestments,LP,joinedAvidity’sboardofdirectors.
Tarsus (2.5% of NAV, <1% Portfolio company ownership)
Tarsus is a late clinical stage biopharma company focused on ophthalmic conditions with high unmet need and limited treatment options. The company is developing a treatment for a common ocular condition – demodexblepharitis,whichhasnoapprovedtherapy.Blepharitisisatypeofinflammationoftheeyelidmarginassociatedwitheyeirritationanddryeye,inabout50%ofthecasescausedbydemodexmiteinfestation.Diagnosed patient population in the U.S. alone is ~2 million, representing a large unmet need population. The lead compound TP-03 is lotilaner-basedeyedropdesignedtospecificallyeradicatethemitesbyparalyzingtheirnervoussystem,showedcompellingefficacyandsafetyfordemodexblepharitisinmultiplePhase2trials.ThecompoundisinPhase3clinicaltrialwithdatareadoutexpectedinQ22021.
Athira (2.5% of NAV, <1% Portfolio company ownership)
Athira is a clinical stage biotech company that is developing novel treatments for neurodegenerative diseases. Lead molecule NDX-1017 demonstrated promising data in Alzheimer’s disease (AD) in early clinical trials by improving P300 latency, a biomarker of cognitive function with a favourablesafetyandpharmacologicalprofile.ThecompanyhasinitiatedPhase 2/3 clinical trial. AD is a historically hard to treat patient population with high unmet need and represents a substantial market opportunity. Also,Athiraisatpre-clinicalstagestoexpanditspipelineintootherneurodegenerative disease, such as Parkinson’s disease.
C4 Therapeutics (2.3% of NAV, <1% Portfolio company ownership)
C4T is a targeted protein degradation biotech company focused on oncology. It is pioneering a new class of small-molecule drugs that selectively destroy disease-causing proteins via degradation using the innate machinery of the cell. C4T leverages this novel targeted protein degradation technology for high unmet need and hard to treat blood cancers. The Investment Manager believes that its lead molecule has a best-in-class potential and is differentiated from other degraders in the space. The company has a strong pipeline with multiple assets on track to enter the clinic in 2021 and 2022.
Frequency (2.2% of NAV, <1% Portfolio company ownership)
Investment Manager’s Report (continued)
34 RTW Venture Fund Limited Annual Report and accounts 2020 35RTW Venture Fund Limited
Annual Report and accounts 2020
Governance
Strategic reportFinancial statem
ents
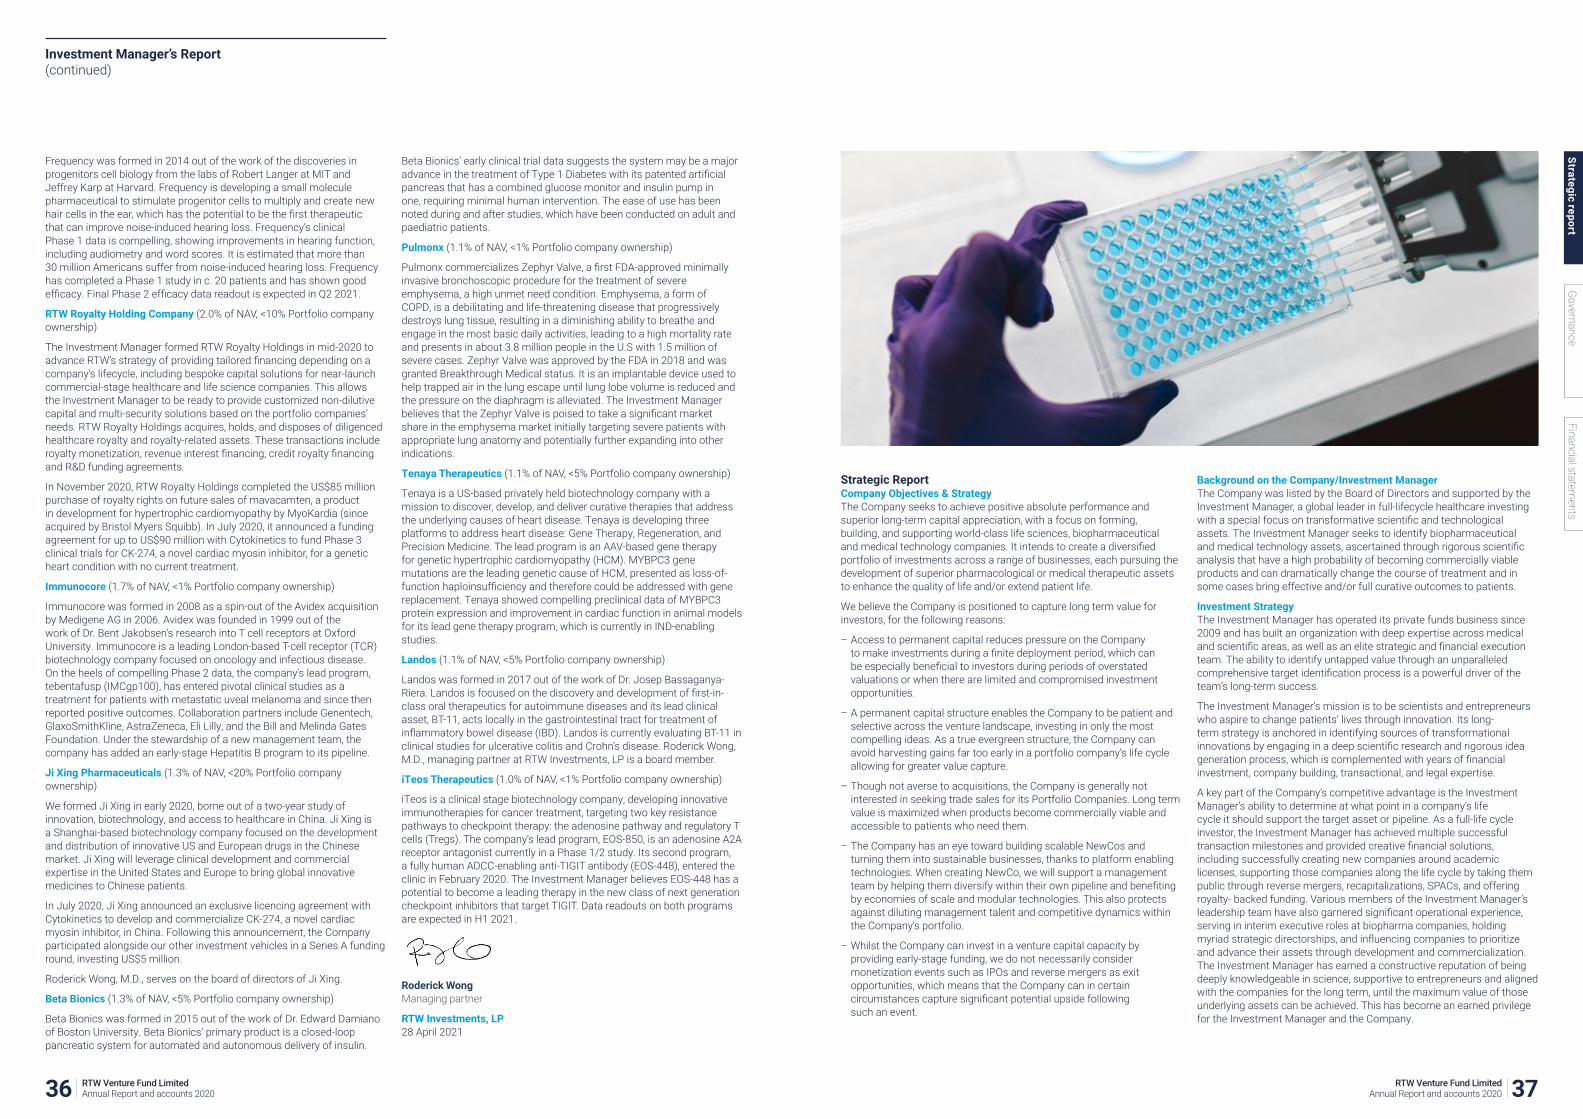
Frequency was formed in 2014 out of the work of the discoveries in progenitors cell biology from the labs of Robert Langer at MIT and Jeffrey Karp at Harvard. Frequency is developing a small molecule pharmaceutical to stimulate progenitor cells to multiply and create new haircellsintheear,whichhasthepotentialtobethefirsttherapeuticthat can improve noise-induced hearing loss. Frequency’s clinical Phase 1 data is compelling, showing improvements in hearing function, including audiometry and word scores. It is estimated that more than 30 million Americans suffer from noise-induced hearing loss. Frequency has completed a Phase 1 study in c. 20 patients and has shown good efficacy.FinalPhase2efficacydatareadoutisexpectedinQ22021.
RTW Royalty Holding Company (2.0% of NAV, <10% Portfolio company ownership)
The Investment Manager formed RTW Royalty Holdings in mid-2020 to advanceRTW’sstrategyofprovidingtailoredfinancingdependingonacompany’s lifecycle, including bespoke capital solutions for near-launch commercial-stage healthcare and life science companies. This allows the Investment Manager to be ready to provide customized non-dilutive capital and multi-security solutions based on the portfolio companies’ needs. RTW Royalty Holdings acquires, holds, and disposes of diligenced healthcare royalty and royalty-related assets. These transactions include royaltymonetization,revenueinterestfinancing,creditroyaltyfinancingand R&D funding agreements.
In November 2020, RTW Royalty Holdings completed the US$85 million purchase of royalty rights on future sales of mavacamten, a product in development for hypertrophic cardiomyopathy by MyoKardia (since acquired by Bristol Myers Squibb). In July 2020, it announced a funding agreement for up to US$90 million with Cytokinetics to fund Phase 3 clinical trials for CK-274, a novel cardiac myosin inhibitor, for a genetic heart condition with no current treatment.
Immunocore (1.7% of NAV, <1% Portfolio company ownership)
Immunocorewasformedin2008asaspin-outoftheAvidexacquisitionbyMedigeneAGin2006.Avidexwasfoundedin1999outoftheworkofDr.BentJakobsen’sresearchintoTcellreceptorsatOxfordUniversity. Immunocore is a leading London-based T-cell receptor (TCR) biotechnology company focused on oncology and infectious disease. On the heels of compelling Phase 2 data, the company’s lead program, tebentafusp (IMCgp100), has entered pivotal clinical studies as a treatment for patients with metastatic uveal melanoma and since then reported positive outcomes. Collaboration partners include Genentech, GlaxoSmithKline,AstraZeneca,EliLilly,andtheBillandMelindaGatesFoundation. Under the stewardship of a new management team, the company has added an early-stage Hepatitis B program to its pipeline.
Ji Xing Pharmaceuticals (1.3% of NAV, <20% Portfolio company ownership)
We formed Ji Xing in early 2020, borne out of a two-year study of innovation, biotechnology, and access to healthcare in China. Ji Xing is a Shanghai-based biotechnology company focused on the development anddistributionofinnovativeUSandEuropeandrugsintheChinesemarket. Ji Xing will leverage clinical development and commercial expertiseintheUnitedStatesandEuropetobringglobalinnovativemedicines to Chinese patients.
InJuly2020,JiXingannouncedanexclusivelicencingagreementwithCytokinetics to develop and commercialize CK-274, a novel cardiac myosin inhibitor, in China. Following this announcement, the Company participated alongside our other investment vehicles in a Series A funding round, investing US$5 million.
Roderick Wong, M.D., serves on the board of directors of Ji Xing.
Beta Bionics (1.3% of NAV, <5% Portfolio company ownership)
BetaBionicswasformedin2015outoftheworkofDr.EdwardDamianoof Boston University. Beta Bionics’ primary product is a closed-loop pancreatic system for automated and autonomous delivery of insulin.
Beta Bionics’ early clinical trial data suggests the system may be a major advanceinthetreatmentofType1Diabeteswithitspatentedartificialpancreas that has a combined glucose monitor and insulin pump in one, requiring minimal human intervention. The ease of use has been noted during and after studies, which have been conducted on adult and paediatric patients.
Pulmonx (1.1% of NAV, <1% Portfolio company ownership)
PulmonxcommercializesZephyrValve,afirstFDA-approvedminimallyinvasive bronchoscopic procedure for the treatment of severe emphysema,ahighunmetneedcondition.Emphysema,aformofCOPD, is a debilitating and life-threatening disease that progressively destroys lung tissue, resulting in a diminishing ability to breathe and engage in the most basic daily activities, leading to a high mortality rate and presents in about 3.8 million people in the U.S with 1.5 million of severe cases. Zephyr Valve was approved by the FDA in 2018 and was granted Breakthrough Medical status. It is an implantable device used to help trapped air in the lung escape until lung lobe volume is reduced and the pressure on the diaphragm is alleviated. The Investment Manager believesthattheZephyrValveispoisedtotakeasignificantmarketshare in the emphysema market initially targeting severe patients with appropriatelunganatomyandpotentiallyfurtherexpandingintootherindications.
Tenaya Therapeutics (1.1% of NAV, <5% Portfolio company ownership)
Tenaya is a US-based privately held biotechnology company with a mission to discover, develop, and deliver curative therapies that address the underlying causes of heart disease. Tenaya is developing three platforms to address heart disease: Gene Therapy, Regeneration, and Precision Medicine. The lead program is an AAV-based gene therapy forgenetichypertrophiccardiomyopathy(HCM).MYBPC3genemutations are the leading genetic cause of HCM, presented as loss-of-functionhaploinsufficiencyandthereforecouldbeaddressedwithgenereplacement.TenayashowedcompellingpreclinicaldataofMYBPC3proteinexpressionandimprovementincardiacfunctioninanimalmodelsfor its lead gene therapy program, which is currently in IND-enabling studies.
Landos (1.1% of NAV, <5% Portfolio company ownership)
Landos was formed in 2017 out of the work of Dr. Josep Bassaganya-Riera.Landosisfocusedonthediscoveryanddevelopmentoffirst-in-class oral therapeutics for autoimmune diseases and its lead clinical asset, BT-11, acts locally in the gastrointestinal tract for treatment of inflammatoryboweldisease(IBD).LandosiscurrentlyevaluatingBT-11inclinical studies for ulcerative colitis and Crohn’s disease. Roderick Wong, M.D., managing partner at RTW Investments, LP is a board member.
iTeos Therapeutics (1.0% of NAV, <1% Portfolio company ownership)
iTeos is a clinical stage biotechnology company, developing innovative immunotherapies for cancer treatment, targeting two key resistance pathways to checkpoint therapy: the adenosine pathway and regulatory T cells(Tregs).Thecompany’sleadprogram,EOS-850,isanadenosineA2Areceptor antagonist currently in a Phase 1/2 study. Its second program, afullyhumanADCC-enablinganti-TIGITantibody(EOS-448),enteredtheclinicinFebruary2020.TheInvestmentManagerbelievesEOS-448hasapotentialtobecomealeadingtherapyinthenewclassofnextgenerationcheckpoint inhibitors that target TIGIT. Data readouts on both programs areexpectedinH12021.
Roderick Wong Managing partner
RTW Investments, LP28April2021
Strategic ReportCompany Objectives & StrategyThe Company seeks to achieve positive absolute performance and superior long-term capital appreciation, with a focus on forming, building, and supporting world-class life sciences, biopharmaceutical andmedicaltechnologycompanies.Itintendstocreateadiversifiedportfolio of investments across a range of businesses, each pursuing the development of superior pharmacological or medical therapeutic assets toenhancethequalityoflifeand/orextendpatientlife.
We believe the Company is positioned to capture long term value for investors, for the following reasons:
– Access to permanent capital reduces pressure on the Company tomakeinvestmentsduringafinitedeploymentperiod,whichcanbeespeciallybeneficialtoinvestorsduringperiodsofoverstatedvaluations or when there are limited and compromised investment opportunities.
– A permanent capital structure enables the Company to be patient and selective across the venture landscape, investing in only the most compelling ideas. As a true evergreen structure, the Company can avoid harvesting gains far too early in a portfolio company’s life cycle allowing for greater value capture.
– Though not averse to acquisitions, the Company is generally not interested in seeking trade sales for its Portfolio Companies. Long term valueismaximizedwhenproductsbecomecommerciallyviableandaccessible to patients who need them.
– The Company has an eye toward building scalable NewCos and turning them into sustainable businesses, thanks to platform enabling technologies. When creating NewCo, we will support a management teambyhelpingthemdiversifywithintheirownpipelineandbenefitingby economies of scale and modular technologies. This also protects against diluting management talent and competitive dynamics within the Company’s portfolio.
– Whilst the Company can invest in a venture capital capacity by providing early-stage funding, we do not necessarily consider monetizationeventssuchasIPOsandreversemergersasexitopportunities, which means that the Company can in certain circumstancescapturesignificantpotentialupsidefollowing such an event.
Background on the Company/Investment ManagerThe Company was listed by the Board of Directors and supported by the Investment Manager, a global leader in full-lifecycle healthcare investing withaspecialfocusontransformativescientificandtechnologicalassets. The Investment Manager seeks to identify biopharmaceutical andmedicaltechnologyassets,ascertainedthroughrigorousscientificanalysis that have a high probability of becoming commercially viable products and can dramatically change the course of treatment and in some cases bring effective and/or full curative outcomes to patients.
Investment Strategy The Investment Manager has operated its private funds business since 2009andhasbuiltanorganizationwithdeepexpertiseacrossmedicalandscientificareas,aswellasanelitestrategicandfinancialexecutionteam. The ability to identify untapped value through an unparalleled comprehensivetargetidentificationprocessisapowerfuldriveroftheteam’s long-term success.
The Investment Manager’s mission is to be scientists and entrepreneurs who aspire to change patients’ lives through innovation. Its long-term strategy is anchored in identifying sources of transformational innovationsbyengaginginadeepscientificresearchandrigorousideagenerationprocess,whichiscomplementedwithyearsoffinancialinvestment,companybuilding,transactional,andlegalexpertise.
A key part of the Company’s competitive advantage is the Investment Manager’s ability to determine at what point in a company’s life cycle it should support the target asset or pipeline. As a full-life cycle investor, the Investment Manager has achieved multiple successful transactionmilestonesandprovidedcreativefinancialsolutions,including successfully creating new companies around academic licenses, supporting those companies along the life cycle by taking them public through reverse mergers, recapitalizations, SPACs, and offering royalty- backed funding. Various members of the Investment Manager’s leadershipteamhavealsogarneredsignificantoperationalexperience,servingininterimexecutiverolesatbiopharmacompanies,holdingmyriadstrategicdirectorships,andinfluencingcompaniestoprioritizeand advance their assets through development and commercialization. The Investment Manager has earned a constructive reputation of being deeply knowledgeable in science, supportive to entrepreneurs and aligned withthecompaniesforthelongterm,untilthemaximumvalueofthoseunderlying assets can be achieved. This has become an earned privilege for the Investment Manager and the Company.
Investment Manager’s Report (continued)
36 RTW Venture Fund Limited Annual Report and accounts 2020 37RTW Venture Fund Limited
Annual Report and accounts 2020
Governance
Strategic reportFinancial statem
ents
Company StructureThe Company was originally a Delaware limited liability corporation, which was funded by US based seed investors and re-domiciled to GuernseypriortolistingontheLondonStockExchange.TheCompanyis managed and controlled from Guernsey by a majority independent board whose details are provided in the Report of the Directors on page 51. The Company is designated as a foreign private issuer under the US SecuritiesandExchangeActandisexemptfromSECregistration.TheCompanyismanagedasanon-residentcompanyforUKtaxpurposesandaforeignlimitedpartnershipforUStaxpurposesandprovidesfulltaxreporting for its US shareholders.
ManagementBoard and CommitteesThe independent Board is responsible to shareholders for the overall management of the Company. The Board has adopted a Schedule of Matters Reserved for the Board, which sets out the particular duties of the Board. Such reserved powers include decisions relating to the determination of investment policy, oversight of the Investment Manager, approval of changes in strategy, risk assessment, Board composition, capitalstructure,statutoryobligationsandpublicdisclosure,financialreporting and entering into any material contracts by the Company.
ThroughtheCommitteesandtheuseofexternalindependentadvisers,the Board manages risk and governance of the Company. The Board consistsoffournon-executiveDirectors,threeofwhomareindependentGuernsey residents and one non-independent, US based director who is a principal of the Investment Manager. Further details of the Board can be found in the Report of the Directors on page 51.
Investment ManagerThe Investment Manager’s key responsibilities include identifying and recommending suitable investments for the Company and negotiating the terms on which such investments will be made.
The Investment Manager focuses on identifying transformational innovationsacrossthelifesciencesspace,specificallybackingscientificprograms that have the potential to disrupt the prevailing standard of care in their respective disease areas. The Investment Manager’s screening process has been honed by Roderick Wong, M.D., throughout his 16-year tenure as an investment management professional. Importantly, the InvestmentManager’sscreeningprocesshasthebenefitofarobustbusiness and the Investment Manager’s 45-person team, including aresearchteamoffifteenindividualswithadvancedscientificandmedical degrees along with academic and industry research and drug developmentexpertise.
The Investment Manager invests across the public/private spectrum, supporting investments through multiple stages of their respective life cycles. To date, the Investment Manager has successfully supported companies through the FDA approval process and the commercialization of the approved drugs. The Investment Manager also engages in new company creation around promising academic licenses.
Following the Company’s IPO, the Investment Manager is paid a monthly management fee, in advance, as of the beginning of each month in an amount equal to 0.104% (1.25% per annum) of NAV. Furthermore, as a member of the Performance Allocation Share Class Fund, the Investment Manager will receive a proportion of a further variable amount equivalent to 20% of the NAV appreciation adjusted for distributions and share issuance for the year to 31 December 2020 triggered by outperformance of the Company’s hurdle rate of 8% per annum. During the year, the Performance Allocation Share Class Fund entered into a letter agreement pursuant to which the Performance Allocation Share Class Fund agreed to defer distributions of the Company’s Ordinary Shares (see Note 10). The agreement effectively gives the performance share class shareholders the same economic outcome that they would have achieved had the shares had been issued.
A summary of the fees paid to the Investment Manager is provided in Note10ofthefinancialstatements.
AdministratorThe Board has delegated administration and company secretarial servicestotheAdministrator.On1February2021,ElysiumFundManagement Limited was appointed as Administrator taking over the administration, corporate secretarial, corporate governance and compliance services from Ocorian Administration (Guernsey) Limited. Further, from 1 February 2021 Morgan Stanley Fund Services USA LLC was appointed to serve as the Company’s Sub-Administrator.
Further details on the responsibilities assigned to the Investment Manager and the Administrator can be found in the Report of the Directors.
Employees and Officers of the CompanyThe Company does not have any employees and therefore policies for employees are not required. The Directors of the Company are detailed in the Report of the Directors.
Investment ProcessThe Company achieves its investment objective by leveraging the Investment Manager’s data-driven proprietary pipeline of innovative assets to invest in life science companies across various geographies (primarilytheUS,Europe,andChina);acrossvarioustherapeuticcategories and product types (including but not limited to genetic medicines, biologics, traditional modalities such as small molecule pharmaceuticals and antibodies, and medical devices); and in both a passive and active capacity and intends, from time to time, to take a controlling or majority position with active involvement in a Portfolio Companytoassistandinfluenceitsmanagement.Inthosesituations, itisexpectedthattheInvestmentManager’sseniorexecutivesmayserveintemporaryexecutivecapacities.
Dealsourcingisbothinternallyandexternallygenerated.TheInvestmentManager has developed repeatable internal processes combining technology and manpower to comprehensively cover critical drivers of innovation. The Investment Manager has and continues to cultivate relationships with entrepreneurs, principal investigators, and other peer investors to allow for a wide range of intelligence gathering of investment opportunities. Their team generates ideas from their wide network of doctors, academics, management teams and syndicate partners throughout the world, and can rely on their proprietary in-house researchdevelopedoversixteenyearsofoperatinginthelifesciencessector. Potential investments are then subject to a diligence process: a new ventures team uses data science technology to enhance data management.. Their research team uses a collaborative team-based approach that leverages the industry and academic backgrounds of its teammembersforexceptionalresearch.
Once invested, the Investment Manager is well-placed to offer support to early-stage LifeSci companies and NewCos. The Investment Manager’s businessandoperationsteamsconsistofmemberswithfinancial,capitalmarkets,legal,regulatory,tax,andaccountingexpertiseandenforces a strong compliance culture. The Investment Manager’s capabilitiesincludeexpertiseinintellectualpropertylicensing,hiringexperiencedmanagement,scientificprogrammanagement,clinicaltrialdesign, commercialization and distribution across geographies, board governance, investor syndicate-building and capital markets.
Forexample,asillustratedbythelargestportfolioholding,Rocket,the Investment Manager was involved in every aspect of forming the company. Rocket was born out of a year-long study in gene therapy. In late 2015, Rocket was formed around a single academic license from a Europeanacademicinstitution.TheInvestmentManagercontinuedtoidentify additional targets and licensed four additional academic programs while hiring a strong management team. The Investment Manager completedtwoprivatefinancings,syndicatingboththeSeriesAandSeries B rounds, and took the company public through a reverse merger in January 2018. While it is publicly listed, Rocket represents a unique value proposition in its scalable platform equipped to advance two types
ofgenereplacementtherapies.TheInvestmentManagerhasasignificantinfluencethroughshareownershipbyfundsmanagedbyitandstrongboard representation and believes it will continue to add value to the companybyaddingnewdevelopmenttargetstoRocket’sexistingpipeline.
While the United States has been the leader in developing and commercializing disruptive innovations, the Investment Manager believes that access to capital plays a large role in establishing leadership. It believesthatimportantscientificdevelopmentsarehappeningworldwideand not only from the most recognized and renowned institutions. The Investment Manager has access to sourcing assets globally and have developed cross-border capabilities. The Investment Manager is committed to building a footprint in the United Kingdom and intends toprioritizeadvancingearly-stagescientificdevelopmentregardlessoforigination.
– USA. The Investment Manager has a core focus on the US, with deep coverage of opportunities from academia to mid-size public companies.TheUSPortfolioCompaniesreflectalargerpoolofopportunities created by the most robust venture and capital markets ecosystem.
– UK&Europe.TheInvestmentManagerhasidentifiedandinvestedinexceptionalBritishandEuropeanscientificassets.Itwishestocontribute to these biotech ecosystems by injecting capital where needed and community building. It intends to engage in NewCo creation around promising early-stage assets by partnering with universities and in-licensing academic programs as well as through its proprietaryin-houseefforts;andprovidingfinancialandhumancapitaltoentrepreneurstoadvancescientificprogramsindevelopment.
– China.ItisearlydaysintheEast.TheInvestmentManagerplanstocapture commercialization opportunities in China through participation in the building of NewCos to bring successful Western drugs to Chinese patients.
The majority of the Investment Manager’s private investments since 2015 havebeenasleadinvestororastrongparticipantinfinancingroundsinvolving other active, highly respected, and well-connected investors in the biopharma and medical technology sectors.
The Investment Manager’s team is comprised of individuals with medical andadvancedscientifictrainingaswellaslegalandbankingexperience,enabling a deeply differentiated approach to research, idea generation, anddealexecution.Complementingitsoutstandingscientificperspicacityand industry relationships is the Investment Manager’s Business and New Venture teams, whose members include a life sciences attorney,formerinvestmentbankers,formercorporateexecutives,and venture capitalists, who together actively engage with banks, academic institutions, and corporate management teams, cultivating strongrelationshipsandexpandingtheirnetworkofkeycontactsand syndicate partners. The Investment Manager believes the well-roundedness of the team, strengthened by strong ties across industry, academia,bankingplatforms,andunaffiliatedinvestorrelationships,will enhance its management team’s ability to source viable prospective target businesses, capitalise them, and ensure public-market readiness. The Company believes that the Investment Manager’s management teamisequippedwiththeknowledge,experience,capitalandhumanresources, strong operations, and forward-thinking sustainable corporate governance practices to pursue unique opportunities that will offer attractive risk-adjusted returns. The Investment Manager’s attractive long-termreturnprofileistheresultofdifferentiateddealsourcingandwhatitreferstoasitsdata-firstprocess,focusingonthecomprehensivecollectionanddiligenceofprimaryscientificdata.
Investment restrictions The Company will be subject to the following restrictions when making investments in accordance with its investment policy:
– the Company may not make an investment or a series of investments in a Portfolio Company that result in the Company’s aggregate investmentinsuchPortfolioCompanyexceeding15%oftheCompany’s gross assets at the time of each such investment, save for Rocket for which the limit will be 30%
– the Company may not make an investment in a Portfolio Company that wouldcausetheCompany’sholdingtoexceed150%ofthetotalissuedshare capital of that Portfolio Company.
– the Company may not make any direct investment in any tobacco company and not knowingly make or continue to hold any Public PortfolioCompanyinvestmentsthatwouldresultinexposuretotobaccocompaniesexceedingonepercent.oftheaggregatevalueofthe Public Portfolio Companies from time to time.
Eachoftheseinvestmentrestrictionswillbecalculatedasatthetimeof investment, other than for the original portfolio assets which were calculated as at the time of the re-domiciliation, as prior stated in the prospectus. In the event that any of the above limits are breached at any point after the relevant investment has been made (for instance, upon successfulrealisationofeconomicand/orscientificmilestonesorasaresult of any movements in the value of the Company’s gross assets), there will be no requirement to sell any investment (in whole or in part).
Listing Rule Investment RestrictionsIn addition to the above restrictions which were set by the Investment Manager, the Company currently complies with the investment restrictions set out below and will continue to do so for so long as they remain requirements of the FCA:
– theCompanywillnotconductanytradingactivitywhichissignificantinthecontextoftheCompanyasawhole;
– the Company must, at all times, invest and manage its assets in a way which is consistent with its objective of spreading investment risk and in accordance with the published investment policy; and
– not more than 10% of the gross asset value at the time of investment is made will be invested in other closed-ended investment funds which arelistedontheOfficialList.
As required by the Listing Rules, any material change to the investment policy of the Company will be made only with the prior approval of the FCA and shareholders.
Investment Manager’s Report (continued)
38 RTW Venture Fund Limited Annual Report and accounts 2020 39RTW Venture Fund Limited
Annual Report and accounts 2020
Governance
Strategic reportFinancial statem
ents

Market CapitalisationThe Company’s market capitalisation grew from US$221 million to US$360 million during year. This was driven by appreciation in the Company’s share price and several equity issuances.
Ordinary NAVThe Ordinary NAV of the Company grew from US$205.7 million to US$375.3 million during the year. The main drivers of the valuation growth were portfolio assets unrealised gains of 66%, public portfolio realised gains of 2% and further issuance of Ordinary Shares, raising US$41.7million(netofexpensesofissuance).
NAV Per Ordinary ShareThe growth in NAV per Ordinary share was driven by the strong performance of the Company’s investment portfolio. There was also amarginalcontributionofapproximately1%fromnon-dilutiveequityissuances during the year.
Premium/discountThe Company’s shares traded on average c. 11.8% premium due to market demand during the reporting period.
Total Return to Shareholders Based on Ordinary NAVThe return of 54% in the year was the result of strong portfolio performanceandexceededtheannualhurdleof8%p.a.fortheportfoliothereby triggering the allocation of a Performance Allocation Amount to the Performance Allocation Share Class Fund.
Total Return to Shareholders Based on Share PriceThe return of 37% in the year was the result of strong portfolio performance coupled with high demand for the Company’s shares which traded at a premium to net asset value throughout the majority of the period. As the Company’s December NAV was not published until mid-Januaryandtheportfolioenjoyedanexceptionallystrongmonthofperformance in December the Company’s shares are shown as being at a discount to the December 31 NAV even though they traded at a premium to the published November NAV during December.
Ongoing ChargesThe Company’s ongoing charges ratio is 2%, calculated in accordance withtheAICrecommendedmethodology,whichexcludesnon-recurringcosts and uses the average NAV in its calculation.
Principal and Emerging Risks and UncertaintiesUndertheFCA’sDisclosureGuidanceandTransparencyRulestheDirectorsarerequiredtoidentifythematerialriskstowhichtheCompanyisexposed,and the steps taken to mitigate those risks.
TheCompanyhasfivecategoriesofrisksinitsriskregisternamely:
– Investment Risks
– Operational Risks
– Governance/Reputational Risks
– ExternalRisks
– EmergingRisks
Risk type Risk description Risk control measure
Investment Failure to achieve investmentobjective
The Company’s target return on net assets is notguaranteed and may not be achieved.
The Board will monitor and supervise the Company’s performance, compared to the target return, similarinvestment funds and broader market conditions. Where performance is unsatisfactory, the Board will discuss the appropriate response with the Investment Manager.
Operational Counterparty Risk TheCompanyhasthepotentialtobeexposedtothe
creditworthiness of trading counterparties in OTC derivatives contracts, its prime broker in the event of re-hypothecation of its investments and any counterparty where collateral or cash margin is provided or where cash is deposited in the normal course of business.
The Company uses Goldman Sachs, Morgan Stanley and Bank of America Merrill Lynch as prime brokers and Cowen, UBS, Bank of America Merrill Lynch, Goldman Sachs, and Morgan Stanley as ISDA counterparties. To monitor counter party risk, theIn-vestmentManagermonitorsfluctua-tionsinshareprices, percentage changes in daily, monthly, and annual 5-year CDS spreads and S&P credit ratings. If a share price moves up ordowninexcessof20%,thetraderattheInvestmentManager is alerted immediately. In case of an alert, the trader notifiestheChiefComplianceOfficer.Therehasbeennodisruption in operations with the Company’s counterparties to date. The Compa-ny’s bankers are an offshore subsidi-arybranch of Barclays Bank PLC and are also included in the Investment Manager’s CDS monitoring program.
Governance/reputational The Investment Manager relies on key personnel
The Investment Manager relies on the founder of RTW, Roderick Wong M.D. and has a small team. Roderick Wong is akeyfigureattheInvestmentManagerandwillbeextensivelyinvolved in investment decisions.
In the event that Roderick Wong was to no longer work for the Investment Manager or is incapacitated, the Board is able to terminate the Investment Management Agreement within 180 days if a suitable replacement has not been found and will consider whether it is appropriate to wind up the Company and return capital to shareholders, or to appoint a new Investment Manager.
Portfolio Companies may be subject to litigation
Portfolio Companies may be subject to product liability claims.Suchliabilityclaimswouldhaveadirectfinancialimpact and may impact market acceptance even if ultimately rebutted.
The Investment Manager’s due dili-gence process includes considering the risk that innovative therapies may have unforeseen side effects, based on the Investment Manager’s exten-sivesectorknowledgeandexperi-ence,andbasedonresearch all published and publicly available in-formation based on safety concerns.
External Exposuretoglobalpoliticalandeconomic risks
Itisanticipatedapproximate-ly75%ofinvestmentswillbeinUS companies or licensing agreement with US institutions and 25% of investments will be made in other geogra-phies. TheCompany’sinvest-mentswillbeexposedtofor-eignexchange,andglobalpolitical,economic,andregulatoryrisks.
TheInvestmentManagerhasextensiveexperiencetransacting across the global healthcare marketplace and will be responsible for identifying relevant events and updating the investment plans appropriately.
Clinical Development & Regulatory Risks
New drugs, medical devices and procedures are subject to extensiveregulatoryscrutinybeforeapproval,andapprovalscan be revoked.
The Investment Manager’s due dili-gence process includes the likely at-titude of regulators towards a poten-tial new therapy. The due diligence will also consider the unmet need of the disease and whether the therapy offers advantages over the current standard of care. In the current COVID-19 pandemic it is possible that the FDA and other clinical regulators globally will prioritise therapies, diag-nostics and devices related to this disease which might slow clinical trials.
Imposition of pricing controls for clinical products and services
Portfolio Company products may be subject to price controls, price gouging claims and other pricing regulation in the US and other major markets; or government healthcare systems may be the major purchasers of the products.
While future political developments cannot be reliably forecast, the Investment Manager’s due diligence process includes an assessment of political risk, and the likely acceptability of the investee’s pricing intentions.
Emerging
COVID-19 The UK government in common with the US and many other countries has implemented unprecedented measures to restrict the possibility of transmission of the COVID-19 virus by limiting personal contact and international travel. Whilst the ultimate scope and duration of these measures is currently unclear, they are likely to have a severe impact on theGlobalEconomy,whichGovernmentsandtheCentralBanks are attempting to offset with both traditional and unconventionalfiscalandmonetarypolicymeasures. The Company’s portfolio will be impacted by any risks emerging from changes in the macroeconomic environment.
TheInvestmentManagerhasextensiveexperiencetransacting across the global healthcare marketplace, and will be responsible for identifying relevant events and updating the investment plans appropriately.
Principal Risks and UncertaintiesInvestment Manager’s Report (continued)
40 RTW Venture Fund Limited Annual Report and accounts 2020 41RTW Venture Fund Limited
Annual Report and accounts 2020
Governance
Strategic reportFinancial statem
ents

Assessing the prospects of the CompanyThe corporate planning process is underpinned by scenarios that encompass a wide spectrum of potential outcomes. These scenarios are designedtoexploretheresilienceoftheCompanytothepotentialimpactofsignificantriskssetoutbelow.
The scenarios are designed to be severe but plausible and take full account of the availability and likely effectiveness of the mitigating actions that could be taken to avoid or reduce the impact or occurrence of the underlying risks and which would realistically be open to management in the circumstances. In considering the likely effectiveness of such actions, the conclusions of the Board’s regular monitoring and review of risk and the Investment Manager’s internal control systems, as discussed on page 41, is taken into account.
TheBoardreviewedtheimpactofstresstestingthequantifiableriskstotheCompany’scashflowsasdetailedinriskfactors1-5inthepreviouspagesandconcludedthattheCompany,wouldhavesufficientworkingcapitaltofunditsoperationsinthefollowingextremescenario:
1. The Company incurred NAV losses of 37% of NAV over a three-year period ending 30 April 2024.
2. No new capital was raised.
3. $132m of private investments were funded from cash and by selling public portfolio investments.
Toprovidesomecontextfortheportfoliolossscenarioof37%,theworst-caseannuallossesfortheNASDAQBiotechIndex(NBI)inthelast10years were 8.9% in 2018 and 21.4% in 2016 respectively. The Company’s three-yearlossscenarioexceedsthecumulativeimpactofbothoftheseworst-case years of 28.3% spread over three years. The annualized volatilityoftheNBIindexforthelast10yearsis25%,soanannuallossof40%ormoreisonlylikelytooccureverytwentyyearsiftheindexreturnsare normally distributed. As there have been no consecutive losing years for the NBI in recent history a cumulative loss of between 28.3% and 40% is therefore assumed to be a reasonable stress test. The Board considers that this stress testing-based assessment of the Company’s prospects is reasonable in the circumstances of the inherent uncertainty involved.
The period over which we confirm longer term viabilityWithinthecontextofthecorporateplanningframeworkdiscussedabove, the Board has assessed the prospects of the Company over a three-year period ending 30 April 2024. Whilst the Board has no reason to believe the Company will not be viable over a longer period, given the inherent uncertainty involved, the period over which the Board considers itpossibletoformareasonableexpectationastotheCompany’slongerterm viability, based on the stress testing scenario planning discussed above, is the three year period to April 2024. This period is used for the Investment Manager’s business plans and has been selected because it presents the Board and therefore readers of the annual report with a reasonabledegreeofconfidencewhilststillprovidinganappropriatelonger term outlook.
Confirmation of longer term viabilityTheBoardconfirmsthatitsassessmentoftheprincipalandemergingrisks facing the Company was robust.
Based upon the robust assessment of the principal and emerging risks facing the Company and its stress testing-based assessment of theCompany’sprospects,theBoardconfirmsthatithasareasonableexpectationthattheCompanywillbeabletocontinueinoperationandmeet its liabilities as they fall due over the period to April 2024.
Directors’ Responsibilities Pursuant to Section 172 of the Companies Act 2006 Section 172 of the Companies Act 2006 applies directly to UK domiciled companies. Nonetheless the AIC Code requires that the matters set out in section 172 are reported on by all companies, irrespective of domicile, providedthisdoesnotconflictwithlocalcompanylaw.
Section 172 recognises that directors are responsible for acting in a way that they consider, in good faith, is the most likely to promote the successoftheCompanyforthebenefitofitsshareholdersasawhole.In doing so, they are also required to consider the broader implications of their decisions and operations on other key stakeholders and their impact on the wider community and the environment. Key decisions are thosethatareeithermaterialtotheCompanyoraresignificanttoanyofthe Company’s key stakeholders. The Company’s engagement with key stakeholders and the key decisions that were made or approved by the Directors during the year are described below.
Stakeholder group Methods of engagement Benefitsofengagements
ShareholdersThe major investors in the Company’s shares are set out on page 55
Continued access to capital is vital to the Company’s longer term growth objectives, and therefore, in line with its objectives, the Company seeks to maintain shareholder satisfaction through:
– Positive risk-adjusted returns
The Company engages with its shareholders through the issue of regular portfolio updates in the form of RNS announcements and quarterly factsheets.
The Company provides in-depth commentary on the investment portfolio, corporate governance and corporate outlook in its semi-annualfinancialstatements.
In addition, the Company, through its brokers and Investment Manager undertake regular roadshowstomeetwithexistingandprospective investors to solicit their feedback, understand any areas of concern, and share forward looking investment commentary.
The Board receives quarterly feedback from its brokers in respect of their investor engagement and investor sentiment.
InthefinancialyeartheCompanyissued:
– 17 portfolio updates by way of RNS
– 12 monthly NAV announcements by way of RNS
– Fact sheets on a quarterly basis
– Annual and half-yearly reports
Through its roadshows and broker outreach, the Company has met with 100+ investors / prospective investors.
Service providersThe Company does not have any direct employees; however, it works closely with a number of service providers (the Investment Manager, Administrators, secretaries, auditor, third party valuation agent, brokers and other professional advisers).
The independence, quality and timeliness of their service provision is critical to the success of the Company.
TheCompanyhasidentifieditskeyserviceproviders and on an annual basis undertakes a review of performance based on a questionnaire through which it also seeks feedback.
Furthermore, the Board and its sub-committees engage regularly with its service providers on a formal and informal basis.
The Company will also regularly review all material contracts for service quality and value.
The feedback given by the service providers is used to review the Company’s policies and procedures to ensure open lines of communication,andoperationalefficiency.
Portfolio CompaniesThe Company has currently invested in 22 PortfolioCompanieswhicharesetout on page 32.
The Investment Manager engages on a regular basis with its portfolio companies in order to conduct regular on-going due diligence and to meet obligations if the Investment Manager holds a board seat.
Honesty, fairness and integrity of the management teams of the portfolio companies are vital to the long-term success of the Company’s investments.
Community & EnvironmentThe Company does not have any direct employees
The Company aims to minimize its environmental footprint.
The Company and the Directors minimise airtravelbymakingmaximumuseofvideoconferencing for Company related matters.
Longer Term Viability Statement
42 RTW Venture Fund Limited Annual Report and accounts 2020 43RTW Venture Fund Limited
Annual Report and accounts 2020
Governance
Strategic reportFinancial statem
ents
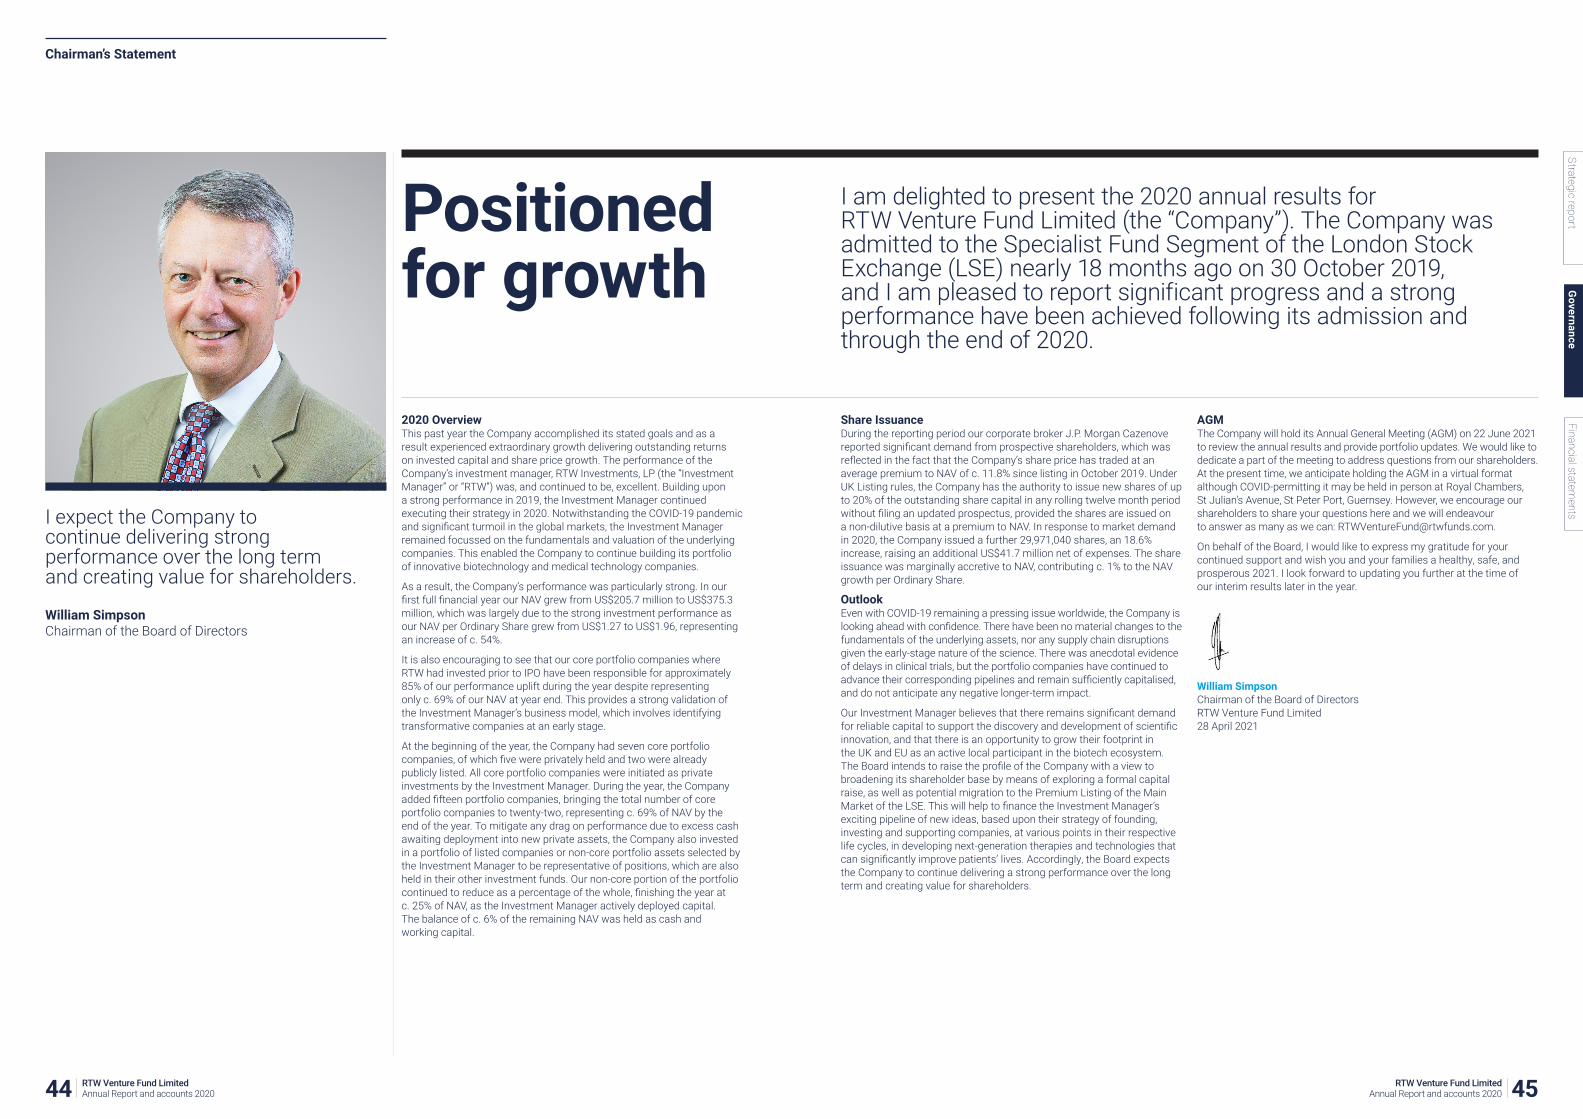
Chairman’s Statement
I expect the Company to continue delivering strong performance over the long term and creating value for shareholders.
2020 Overview This past year the Company accomplished its stated goals and as a result experienced extraordinary growth delivering outstanding returns on invested capital and share price growth. The performance of the Company’s investment manager, RTW Investments, LP (the “Investment Manager” or “RTW”) was, and continued to be, excellent. Building upon a strong performance in 2019, the Investment Manager continued executing their strategy in 2020. Notwithstanding the COVID-19 pandemic and significant turmoil in the global markets, the Investment Manager remained focussed on the fundamentals and valuation of the underlying companies. This enabled the Company to continue building its portfolio of innovative biotechnology and medical technology companies.
As a result, the Company’s performance was particularly strong. In our first full financial year our NAV grew from US$205.7 million to US$375.3 million, which was largely due to the strong investment performance as our NAV per Ordinary Share grew from US$1.27 to US$1.96, representing an increase of c. 54%.
It is also encouraging to see that our core portfolio companies where RTW had invested prior to IPO have been responsible for approximately 85% of our performance uplift during the year despite representing only c. 69% of our NAV at year end. This provides a strong validation of the Investment Manager’s business model, which involves identifying transformative companies at an early stage.
At the beginning of the year, the Company had seven core portfolio companies, of which five were privately held and two were already publicly listed. All core portfolio companies were initiated as private investments by the Investment Manager. During the year, the Company added fifteen portfolio companies, bringing the total number of core portfolio companies to twenty-two, representing c. 69% of NAV by the end of the year. To mitigate any drag on performance due to excess cash awaiting deployment into new private assets, the Company also invested in a portfolio of listed companies or non-core portfolio assets selected by the Investment Manager to be representative of positions, which are also held in their other investment funds. Our non-core portion of the portfolio continued to reduce as a percentage of the whole, finishing the year at c. 25% of NAV, as the Investment Manager actively deployed capital. The balance of c. 6% of the remaining NAV was held as cash and working capital.
Positioned for growth
Share IssuanceDuring the reporting period our corporate broker J.P. Morgan Cazenove reported significant demand from prospective shareholders, which was reflected in the fact that the Company’s share price has traded at an average premium to NAV of c. 11.8% since listing in October 2019. Under UK Listing rules, the Company has the authority to issue new shares of up to 20% of the outstanding share capital in any rolling twelve month period without filing an updated prospectus, provided the shares are issued on a non-dilutive basis at a premium to NAV. In response to market demand in 2020, the Company issued a further 29,971,040 shares, an 18.6% increase, raising an additional US$41.7 million net of expenses. The share issuance was marginally accretive to NAV, contributing c. 1% to the NAV growth per Ordinary Share.
OutlookEven with COVID-19 remaining a pressing issue worldwide, the Company is looking ahead with confidence. There have been no material changes to the fundamentals of the underlying assets, nor any supply chain disruptions given the early-stage nature of the science. There was anecdotal evidence of delays in clinical trials, but the portfolio companies have continued to advance their corresponding pipelines and remain sufficiently capitalised, and do not anticipate any negative longer-term impact.
Our Investment Manager believes that there remains significant demand for reliable capital to support the discovery and development of scientific innovation, and that there is an opportunity to grow their footprint in the UK and EU as an active local participant in the biotech ecosystem. The Board intends to raise the profile of the Company with a view to broadening its shareholder base by means of exploring a formal capital raise, as well as potential migration to the Premium Listing of the Main Market of the LSE. This will help to finance the Investment Manager’s exciting pipeline of new ideas, based upon their strategy of founding, investing and supporting companies, at various points in their respective life cycles, in developing next-generation therapies and technologies that can significantly improve patients’ lives. Accordingly, the Board expects the Company to continue delivering a strong performance over the long term and creating value for shareholders.
AGM The Company will hold its Annual General Meeting (AGM) on 22 June 2021 to review the annual results and provide portfolio updates. We would like to dedicate a part of the meeting to address questions from our shareholders. At the present time, we anticipate holding the AGM in a virtual format although COVID-permitting it may be held in person at Royal Chambers, St Julian’s Avenue, St Peter Port, Guernsey. However, we encourage our shareholders to share your questions here and we will endeavour to answer as many as we can: [email protected].
On behalf of the Board, I would like to express my gratitude for your continued support and wish you and your families a healthy, safe, and prosperous 2021. I look forward to updating you further at the time of our interim results later in the year.
William SimpsonChairman of the Board of Directors RTW Venture Fund Limited 28 April 2021
I am delighted to present the 2020 annual results for RTW Venture Fund Limited (the “Company”). The Company was admitted to the Specialist Fund Segment of the London Stock Exchange (LSE) nearly 18 months ago on 30 October 2019, and I am pleased to report significant progress and a strong performance have been achieved following its admission and through the end of 2020.
William Simpson Chairman of the Board of Directors
44 RTW Venture Fund Limited Annual Report and accounts 2020 45RTW Venture Fund Limited
Annual Report and accounts 2020
Governance
Strategic reportFinancial statem
ents

Experienced and dedicated board guiding our future Our Board of Directors are ensuring the best governance for the Company, striving to make the world a better and healthier place one investment at a time.
Board of directors
Directors’ Committee Membership
A
Appointed2 October 2019
Biography Paul Le Page is a former executive Director and Senior Portfolio Manager of FRM Investment Management Limited, a subsidiary of Man Group, and holds non-executive directorships at a number of London Stock Exchange listed investment funds. Mr. Le Page is Audit Committee Chair of UK Mortgages Limited and Bluefield Solar Income Fund Limited and was previously Audit Committee Chair of Thames River Multi Hedge PCC Limited and Cazenove Absolute Equity Limited. Mr. Le Page has 17 years’ Audit Committee experience within the closed end investment fund sector and has a broad-based knowledge of the global investment industry and product structures. Mr Le Page graduated from University College London and later received an MBA from Heriot Watt University.
Appointed2 October 2019
Biography William Simpson is the Chairman and an independent director based in Guernsey providing services to investment and other financial services companies. William has over 30 years’ experience within the financial services industry. He previously practiced law in the course of which he advised on the establishment of a wide range of investment funds and related matters. William graduated in law from Leeds University and first qualified as an English barrister. William is a member of the Guernsey Bar. William also holds directorships at Ninety One Premier Funds PCC Limited, Handelsbanken Alternatives Fund Limited, AHL Strategies PCC Limited, Man AHL Diversified PCC Limited and Alpha Real Trust Limited.
William Simpson A N R M
Chairman – Guernsey resident
Paul Le Page A N R M
Chairman of the Audit Committee – Guernsey resident
Appointed3 October 2019
Biography William Scott serves as an independent non-executive director of a number of investment companies and funds. From 2003 to 2004, Mr. Scott worked as Senior Vice President with FRM Investment Management Limited, now part of Man Group. Previously (from 1989¬2002), Mr. Scott was a portfolio manager and latterly a director at Rea Brothers (which became part of the Close Brothers group in 1999 and where he was a director of Close Bank Guernsey Limited) and before that Assistant Investment Manager with the London Residuary Body Superannuation Scheme (1987-1989). Mr. Scott graduated from the University of Edinburgh in 1982 and is a Chartered Accountant having qualified with Arthur Young (now EY) in 1987. Mr. Scott also holds the Securities Institute Diploma and is a Chartered Fellow of the Chartered Institute for Securities & Investment. He is also a Chartered Wealth Manager. His other directorships include Axiom European Financial Debt Fund Limited and Worsley Investors Limited, both of which are listed on the Premium Segment of the London Stock Exchange.
Appointed2 October 2019
Biography Stephanie A. Sirota, serves as a Partner and Chief Business Officer at RTW Investments, LP. Ms. Sirota is responsible for strategy and oversight of the firm’s business development and strategic partnerships with counterparties including limited partners, banks and academic institutions. She is also responsible for shaping the firm’s governance policies underscoring impact and sustainability. Ms. Sirota has a decade of deal experience in financial services. Prior to joining the Investment Manager, from 2006 to 2010, she served as a director at Valhalla Capital Advisors, a macro and commodity investment manager. From 2000 to 2003, Ms. Sirota worked in the New York and London offices of Lehman Brothers, where she advised on various mergers & acquisitions, IPOs, and capital market financing transactions with a focus on cross-border transactions for the firm’s global corporate clients. She began her career on the Fixed Income trading desk at Lehman Brothers, structuring derivatives for municipal issuers from 1997 to 1999. Ms. Sirota graduated with honours from Columbia University and also received a Master’s Degree from the Columbia Graduate School of Journalism. She has contributed to Fortune Magazine and ABCNews.com and is a supporter of the arts, science, and children’s initiatives. She serves as Co-Chairman of the Council of the Phil at the New York Philharmonic and as President of RTW Charitable Foundation. Ms. Sirota serves as Vice President of Corporate Strategy and Corporate Communications of Health Sciences Acquisitions Corporation 2 (HSAC2) and served in the same role at Health Sciences Acquisitions Corporation (HSAC) until December 2019.
William Scott A N R M
Chairman of the Nomination and Remuneration Committee – Guernsey resident
Stephanie A. Sirota
Non-executive Director – non-UK resident
The performance and effectiveness of the Directors will be assessed annually having regard to the specific responsibilities of each Director as described in their service agreements.
Member of the Audit Committee
N Member of the Nomination Committee
R Member of the Remuneration Committee
M Member of the Management Engagement Committee
Denotes Committee Chairman
Board diversity
Male (75%) Female (25%)
46 RTW Venture Fund Limited Annual Report and accounts 2020 47RTW Venture Fund Limited
Annual Report and accounts 2020
Governance
Strategic reportFinancial statem
ents

Financial reportingThe primary role of the Audit Committee in relation to the financial reporting is to review with the Administrator, any external consultant as appointed by the Investment Manager and the external auditor the appropriateness of the Interim Reports and Annual Reports, concentrating on, amongst other matters:
– the quality and acceptability of accounting policies and practices;
– the clarity of the disclosures and compliance with financial reporting standards and relevant financial and governance reporting requirements;
– material areas in which significant judgements have been applied or there has been discussion with both any external consultant as appointed by the Investment Manager and the external auditor;
– whether the Annual Report, taken as a whole, is fair, balanced and understandable and provides the information necessary for shareholders to assess the Company’s performance, business model and strategy; and
– any correspondence from regulators in relation to the Company’s financial reporting.
To aid its review, the Audit Committee considers reports from the Investment Manager and any external consultant as appointed by the Investment Manager and also reports from the external auditor on the outcomes of their interim review and annual audit.
The Audit Committee, chaired by Paul Le Page, operates within clearly defined terms of reference which include all matters indicated by DTR 7.1 and the AIC Code. Its other members are William Simpson and William Scott. Only independent directors can serve on the Audit Committee and members of the Audit Committee must have no current links with the Company’s external auditor and must be independent of the Investment Manager. The Audit Committee can request the attendance of the Investment Manager, the auditors or any service provider at its meetings. The performance of the chairman of the Audit Committee is reviewed on an annual basis and the membership of the Audit Committee and its terms of reference are kept under review. The Audit Committee meets no less than twice a year in Guernsey, and meets the external auditor at least once a year in Guernsey. The Audit Committee met four times in the year to 31 December 2020.
The Board has taken note of the requirement that at least one member of the Audit Committee should have recent and relevant financial experience and is satisfied that the Audit Committee is properly constituted in that respect, with all members being highly experienced and, in particular two members having backgrounds as chartered accountants.
The Board has also considered the inclusion of the Chairman within the Audit Committee and having taken into account that the Chairman is independent and non-executive, believes it appropriate for the Chairman to be a member.
The duties of the Audit Committee in discharging its responsibilities include reviewing the Interim Report, Annual Report and Audited Financial Statements, the valuation of the Company’s investment portfolio, the system of internal controls, and the terms of appointment of the external auditor together with their remuneration. It is also the formal forum through which the external auditor reports to the Board of Directors and shall meet not less than twice a year and at such other times as the Audit Committee chairman shall require. The objectivity of the external auditor is reviewed by the Audit Committee, which also reviews the terms under which the external auditor is appointed to perform non-audit services and the fees paid to the external auditor or their affiliated firms overseas.
The Audit Committee also reviews, considers and, if thought appropriate, recommends for the purposes of the Company’s financial statements, valuations prepared by the Investment Manager.
The main duties of the Audit Committee are:
– giving full consideration and recommending to the Board for approval of the contents of the Interim Report and Annual Report and Audited Financial Statements and reviewing the external auditor’s report thereon;
– reviewing the scope, results, cost effectiveness, independence and objectivity of the external auditor;
– reviewing the draft valuation of the Company’s investments prepared by the Investment Manager, and making a recommendation to the Board on the valuation of the Company’s investments;
– reviewing and recommending to the Board for approval of the audit, audit related and non-audit fees payable to the external auditor and the terms of their engagement;
– reviewing and approving the external auditor’s plan for the following financial year;
– reviewing the appropriateness of the Company’s accounting policies;
– ensuring the standards and adequacy of the service provider’s control systems;
– reviewing and considering the UK Code, the AIC Code and the FRC Guidance on Audit Committees; and
– reviewing the risks facing the Company and monitoring the risk matrix.
The Audit Committee is required to report its findings to the Board, identifying any matters on which it considers that action or improvement is needed, and make recommendations on the steps to be taken.
The external auditor is invited to attend the Audit Committee meetings at which the Interim Reports and Annual Reports are considered and at which they have the opportunity to meet with the Audit Committee without representatives of any external consultant as appointed by the Investment Manager being present at least once a year.
Meetings The Audit Committee has met on four occasions during the year. The matters discussed at these meetings were:
– review of the terms of reference of the Audit Committee to confirm that they are appropriate to the business of the Audit Committee and the current regulatory environment in which the Company operates;
– semi-annual reviews of the valuations of the Company’s investments;
– review of the accounting policies and format of the financial statements;
– oversee the relationship with the external auditor;
– discussion and approval of the fee for the external audit;
– consideration of the requirement for an internal audit function;
– consider and make recommendations to the Board regarding the appointment of third party service providers and the adequacy of their arrangements; and
– review of the Company’s key risks and internal controls.
Primary area of judgementThe Audit Committee determined that the key risk of misstatement of the Company’s financial statements related to the valuation of investment in securities, at fair value, in the context of the judgements necessary to evaluate current fair values.
As outlined in Note 2 to the financial statements of the Company, the total carrying value of the Company’s investments in securities at fair value as at 31 December 2020 was US$390.9 million (2019: US$170.7 million), of which US$47.3 million (2019: US$26.1 million) related to private company investments. Market quotations will be available for those financial assets that are listed and traded and have an active market quote.
For private company investments, the value of the Company’s investments is based on the value of the relevant underlying investee companies as determined by the Investment Manager. The valuation of the Company’s private and restricted investments and the methodology used for the year end valuation and constitution of the Investment Manager’s Valuation Committee was discussed with the Investment Manager and with the external auditor at a Board meeting held on 2 February 2021. The Independent Valuer, as appointed by the Investment Manager, carries out a valuation semi-annually on the private company investments.
The Audit Committee has reviewed the work of the Investment Manager. The Investment Manager confirmed to the Audit Committee that the valuation methodology had been applied consistently during the year. After reviewing the scope and results of the work of the external auditor the Audit Committee concluded that they had not identified any material errors or inconsistencies.
The external auditor explained the results of their audit work on the valuations, including their challenge of management’s underlying projections, the economic assumptions, illiquidity discounts and prices used. On the basis of their audit work, there were no material adjustments proposed to those valuations as approved by the Audit Committee.
Report of the audit committee
I am pleased to present Audit Committee’s report for financial year ending 31 December 2020, setting forth the Committee’s structure, duties, and activities during the reporting period.
Paul Le Page Audit Committee Chair
4Audit committee meetings during this year
US$412.6Mtotal net assets of the Company as at 31 December 2020 2019: US$214.4M
48 RTW Venture Fund Limited Annual Report and accounts 2020 49RTW Venture Fund Limited
Annual Report and accounts 2020
Governance
Strategic reportFinancial statem
ents

Internal auditThe Audit Committee shall consider at least once a year whether there is a need for an internal audit function. Currently, the Audit Committee does not consider there to be a need for an internal audit function, given that there are no employees in the Company and all outsourced functions are with parties who have their own internal controls and procedures.
The Audit Committee worked with the Administrator and the Investment Manager to structure a risk matrix for the Company, which considered the controls applied by the Board, the Investment Manager and key service providers. The matrix was reviewed with the Investment Manager in light of the ongoing COVID-19 pandemic and was used to form the basis of the Company’s principal and emerging risk disclosures in the Strategic Report on page 41.
The Audit Committee subsequently reviewed a COVID-19 impact assessment prepared by the Investment Manager as part of the final review process for these financial statements.
Appointment of the external auditorKPMG has been appointed as the statutory external auditor of the Company since the Company re-domiciled to Guernsey on 2 October 2019. The Audit Committee held meetings with KPMG before the start of the audit to discuss formal planning and to discuss any possible issues along with the scope of the audit and appropriate timetable. Informal meetings have also been held with the Chairman of the Audit Committee in order that the Chairman is kept up to date with the progress of the audit and formal reporting requirement by the Audit Committee.
The objectivity of the external auditor is reviewed by the Audit Committee which also reviews the terms under which the external auditor may be appointed to perform non-audit services. The Audit Committee reviews the scope and results of the audit, its cost effectiveness and the independence and objectivity of the external auditor, with particular regard to any non-audit work that the external auditor may undertake and the level of fees associated to this non-audit work. In order to safeguard external auditor independence and objectivity, the Audit Committee ensures that audit related, non-audit, or advisory services provided by the external auditor do not conflict with its statutory audit responsibilities. Audit related services will generally only cover reviews of interim financial statements and capital raising work. Any non-audit services conducted by the external auditor outside of the reviews of interim financial statements requires the consent of the Audit Committee before being initiated.
KPMG’s audit fee for the year ended 31 December 2020 was £127,000 (2019: £117,500). During the prior year, KPMG was paid a reporting accountant fee of £120,000 by the Investment Manager as part of the Company’s listing expenses.
The external auditor may not undertake any work for the Company in respect of the following matters – preparation of the financial statements, preparation of valuations used in financial statements, provision of investment advice, taking management decisions or advocacy work in adversarial situations.
The Audit Committee reviews the scope and results of the audit, its cost effectiveness and the independence and objectivity of the Auditor, with particular regard to the level of non-audit fees. During the prior year, KPMG was also engaged as reporting accountant in connection with the Company’s listing which is a permissible service under the FRC Ethical Standards for a company’s auditor to undertake. The Audit Committee considers KPMG to be independent of the Company and that the provision of such non-audit services is not a threat to the objectivity and independence of the conduct of the audit as appropriate safeguards are in place.
To fulfil its responsibility regarding the independence of the external auditor, the Audit Committee considered:
– audit personnel in the audit plan for the current year;
– a report from the external auditor describing its arrangements to identify, report and manage any conflicts of interest; and
– the extent of non-audit services provided by the external auditor.
To assess the effectiveness of the external auditor, the Audit Committee reviewed:
– the external auditor’s fulfilment of the agreed audit plan and variations from it;
– reports highlighting the findings that arose during the course of the audit; and
– feedback from the Investment Manager and any external consultant as appointed by the Investment Manager in evaluating the performance of the audit team.
The Audit Committee is satisfied with KPMG’s effectiveness and independence as external auditor having considered the degree of diligence and professional scepticism demonstrated by them. Having carried out the review described above and having satisfied itself that the external auditor remains independent and effective, the Audit Committee has recommended to the Board that KPMG be reappointed as external auditor for the year ending 31 December 2021.
Annual reportThe Audit Committee members have each reviewed this annual report and earlier drafts of it in detail, comparing its content with their own knowledge of the Company, reporting requirements and shareholder expectations. Formal meetings of the Audit Committee have also reviewed the report and its content and have received reports and explanations from the Company’s service providers about the content and the financial results. The Audit Committee has concluded that the annual report, taken as a whole, is fair, balanced and understandable, and that the Board can reasonably and with justification make the statement of Directors’ responsibilities on page 57.
Key activities of the Audit CommitteeDuring the course of the year the Audit Committee undertook a number of projects in addition to its regular duties, which included reviewing the terms of the performance fee allocation accrual and payment process and working with RTW to enhance the Company’s viability stress test model. The Audit Committee also reviewed the first NAV produced following the administrator change and the process that was used by the administrator to verify the NAV.
On behalf of the Audit Committee,
Paul Le PageChairman of the Audit Committee 28 April 2021
Report of the Audit Committee (continued)
The Directors hereby submit the annual report and audited financial statements for the Company for the year ended 31 December 2020.
Principal activitiesFurther information on the principal activities of the Company can be found on page 93.
Business reviewA review of the Company’s business and its likely future development is provided in the Chairman’s Statement on pages 44 to 45. The underlying investments of the Company are reviewed in the Investment Manager’s Report on pages 26 to 40.
Results and distributionsThe CompanyThe results of the Company for the year are shown in the audited statement of operations on page 68.
The Net Asset Value of the Company as at 31 December 2020 was US$412.6 million (2019: US$214.4 million).
No dividends or distributions respectively were paid during the years ended 31 December 2020 and 31 December 2019.
Capital StructureThe Company was incorporated as a limited liability corporation in Delaware on 16 February 2017. The Company was subsequently re-domiciled to Guernsey as a non-cellular company limited by shares under the Companies Law on 2 October 2019 with registered number 66847.
On re-domiciliation, the Company’s fully paid issued share capital consisted of 147,144,094 Ordinary Shares, 1 Performance Allocation Share and 1 Management Share.
On 30 October 2019, the Company also issued 14,400,601 Ordinary Shares in connection with the IPO.
On 30 October 2019, all of the issued Ordinary Shares of the Company were listed and admitted to trading on the Specialist Fund Segment of the LSE (“SFS”) under ticker symbol: RTW. The Company’s issued Ordinary Share capital on initial admission to the SFS was 161,544,695 shares. The Management Share was redeemed upon initial admission. Cornerstone shareholders of the Company who held Ordinary Shares prior to initial admission were subject to certain lock-up restrictions for 12 months in respect of all but 22.5% of those Ordinary Shares, which were lifted on 30 October 2020.
As at 31 December 2020, the Company’s issued share capital was 191,515,735 Ordinary Shares and 1 Performance Allocation Share. There are no shares held in treasury. Following year end, there have been further share issuances with the issued share capital as at 17 March 2021 now 204,047,167 Ordinary Shares.
Further issues of shares will only be made if the Directors determine such issues to be in the best interests of shareholders and the Company as a whole. Relevant factors in making such determination include net asset performance, share price rating, perceived investor demand and any regulatory restrictions. In the case of further issues of Ordinary Shares (or sales of Ordinary Shares from treasury), such Ordinary Shares will only be issued at prices which are not less than the NAV per Ordinary Share announced as of the end of the immediately preceding month in which such Ordinary Shares are being issued.
Annual General MeetingsThe Annual General Meeting (“AGM”) of the Company will be held on 22 June 2021 at 1st Floor, Royal Chambers, St Julian’s Avenue, St Peter Port, Guernsey GY1 3JX. Details of the resolutions to be proposed at the AGM, together with explanations, appear in the Notices of Meetings which are being sent to shareholders in due course.
Members of the Board, including the Chairman and the Audit Committee Chairman, will be in attendance at the AGM and will be available to answer shareholder questions.
Listing requirementsThe Company was a private unlisted investment vehicle throughout 2018 and until admission on 30 October 2019 was not subject to compliance with any corporate governance codes, laws, rules or regulations ordinarily applicable to public companies listed on an EU regulated market.
Following Initial admission to the SFS on 30 October 2019, the Company became subject to the Prospectus Rules, the Disclosure Guidance and Transparency Rules (as implemented in the UK through the Financial Services and Markets Act 2000 of the United Kingdom, as amended), the Market Abuse Regulation and the admission and disclosure standards of the London Stock Exchange.
Since admission to the SFS, the Company has complied with the applicable Listing Rules.
Common Reporting Standard and Tax Reporting RequirementsThe Common Reporting Standard (“CRS”), formerly the Standard for Automatic Exchange of Financial Account Information, became effective on 1 January 2016. CRS is an information standard for the automatic exchange of information developed by the Organisation for Economic Co-operation and Development. CRS is a measure to counter tax evasion and it builds upon other information sharing legislation, such as FATCA, the UK-Guernsey Intergovernmental Agreement (“UK-Guernsey IGA”) for the Automatic Exchange of Information, and the European Union Savings Directive. Under the UK-Guernsey IGA, certain disclosure requirements may be imposed in respect of certain shareholders in the Company who are, or are entities that are controlled by one or more, residents of the United Kingdom. In addition, under FATCA, the Company is required to make certain disclosures and reports to further compliance with the legislation’s requirements. It is the Company’s policy to comply with applicable requirements under CRS, the UK-Guernsey IGA and FATCA.
Report of the Directors
50 RTW Venture Fund Limited Annual Report and accounts 2020 51RTW Venture Fund Limited
Annual Report and accounts 2020
Governance
Strategic reportFinancial statem
ents
AIFMDThe Directors have considered the impact of AIFMD on the Company and its operations. The Company is a non-EU domiciled Alternative Investment Fund and the Investment Manager has been appointed as the Company’s non-EU AIFM. As the Company is managed by a non-EU AIFM, only a limited number of provisions of AIFMD apply. The Investment Manager has made the notifications or applications and received, where relevant, approvals for the marketing of the Ordinary Shares to “professional investors” (as defined in AIFMD) in the following EEA States: the United Kingdom and the Netherlands.
Corporate governance statement The Board recognises the value of sound corporate governance and, in particular, has regard to the requirements of the UK Code (available from the FRC’s website, www.frc.org.uk).
The Company is a registered closed-ended investment scheme pursuant to the Protection of Investors (Bailiwick of Guernsey) Law, 1987, as amended, and the Registered Collective Investment Schemes Rules 2015 issued by the GFSC. The GFSC has issued a Finance Sector Code of Corporate Governance (“GFSC Code”) that applies to all companies that hold a licence from the GFSC under the regulatory laws or which are registered or authorised as Collective Investment Schemes, which includes the Company. The GFSC has stated in the GFSC Code that companies which report against the UK Code or the AIC Code are deemed to meet their code, and need take no further action.
The Company’s prospectus dated 14 October 2019 stated that the Company will be in compliance with the UK Code. The Company became a member of the AIC on listing and the Board of the Company has accordingly considered, and resolved to follow, the principles and recommendations of the AIC Code (available from the AIC’s website, www.theaic.co.uk).
The AIC Code addresses all the principles set out in the UK Code, as well as setting out additional principles and recommendations on issues that are of specific relevance to investment companies such as the Company. The Board considers that reporting against the principles and recommendations of the AIC Code (which incorporates the UK Code) provides better information to shareholders whilst meeting the requirements of the GFSC Code.
In respect of the period from re-domiciliation until 30 October 2019, the date of admission to the SFS, the Company substantially complied in all material respects with the relevant provisions of the GFSC Code. As from the date of initial admission, the Company has voluntarily committed to comply with the 2019 AIC Code.
The Company currently complies with the principles and provisions of the UK Code as well as the AIC code.
For the reasons set out in the preamble to the UK Code, the Board considers certain of these provisions are not relevant to the position of the Company as an externally managed investment company. In particular all of the Company’s day-to-day management and administrative functions are outsourced to third parties. As a result, the Company has no chief executive or any executive directors, employees or internal operations and has therefore not reported further in respect of these provisions.
Provision 14 of the AIC Code states a Board should consider appointing one independent non-executive Director to be the Senior Independent Director. The Board, having taken into account its small size and that the Chairman and two of the other three Directors are each similarly independent and non-executive, considers it unnecessary to appoint such a Senior Independent Director. All members of the Board are available to shareholders if they have unresolved concerns.
The need for an internal audit function is discussed in the Report of the Audit Committee.
The BoardThe Board monitors developments in corporate governance to ensure the Board remains aligned with best practices especially with respect to the increased focus on diversity. The Board acknowledges the importance of diversity, including gender, for the effective functioning of the Board and commits to supporting diversity in the boardroom. It is the Board’s ongoing aspiration to have a well-diversified representation. The Board also values diversity of business skills and experience because Directors with diverse skill sets, capabilities and experience gained from different geographical backgrounds enhance the Board by bringing a wide range of perspectives to the Company. No specific diversity parameters have been set as the Board believes that all appointments should be made on merit and taken in the context of skills, knowledge and experience required for an effective Board.
The Board believes the current Board members have the appropriate qualifications, experience and expertise to manage the Company. The Director’s biographies can be found on pages 46 to 47.
The Directors of the Company at the date of this report are William Simpson (Chairman), Paul Le Page (Chair of Audit Committee), William Scott and Stephanie Sirota.
The Board meets on at least a quarterly basis. The dates for each scheduled meeting are planned at the beginning of the year and confirmed in writing in accordance with the Company’s articles of incorporation. Meetings for urgent issues may be and are convened at short notice if all Directors are informed. In addition to formal Board and/or committee meetings and, to the extent practicable and appropriate, the Directors maintain close contact with each other and the Administrator, by email and conference calls, for the purpose of keeping themselves informed about the Company’s activities. The Board requires information to be supplied in a timely manner by the Administrator and other advisors in a form and of a quality appropriate to enable it to discharge its duties.
The Company has adopted a share dealing code for the Board and will seek to ensure compliance by the Board with the terms of the share dealing code. The share dealing code is compliant with the EU Market Abuse Regulation.
Board tenure and re-electionEach Director will retire at each Annual General Meeting subsequent to his or her election and be eligible for re-election by the Company at such Annual General Meeting.
A Director who retires at an Annual General Meeting may, if willing to continue to act, be elected or re-elected at that meeting. If, at a general meeting at which a Director retires, the Company neither re-elects that Director nor appoints another person to the Board in the place of that Director, the retiring Director shall, if willing to act, be deemed to have been re-elected unless at the general meeting it is resolved not to fill the vacancy or unless a resolution for the re-election of the Director is put to the meeting and not passed.
The Chairman, Mr Le Page and Ms Sirota have been members of the Board since their appointment on 2 October 2019. Mr Scott was appointed on 3 October 2019.
Directors do not have service contracts. Directors are appointed under letters of appointment, copies of which are available at the registered office of the Company. The Board considers its composition and succession planning on an on-going basis.
Directors’ remunerationThe Directors shall be remunerated at such a rate as the Directors shall determine provided that the aggregate amount of such fees shall not exceed US$300,000 per annum.
During the year to 31 December 2020 the Directors’ remuneration was paid as follows (of which US$53,136 (2019: US$33,140) was outstanding at the year end):
31 December 2020 (US$)
31 December 2020 (US$)
31 December 2019 (US$)*
William Simpson £50,000 71,600 10,357Paul Le Page £40,000 57,285 8,285William Scott £35,000 49,990 7,249Stephanie Sirota US$42,000 42,000 7,249Total 220,875 33,140
* Directors’ remuneration for 31 December 2019 is for the three month period from each Director’s appointment in October 2019.
Directors’ conflicts of interestAll of the Directors are non-executive. William Simpson and William Scott are directors of a number of funds managed by members of the Man group of companies. Paul Le Page was employed by Man Group until 31 December 2019 and was a director of the investment managers of those funds. None of the Directors were responsible for the appointment of the others, the decision in respect of which was made by an independent party. Having considered the information disclosed above, the Board have concluded that William Simpson, Paul Le Page, and William Scott remain independent under provision 10 of the AIC Code. The Board considers Messrs Simpson, Le Page and Scott as independent of each other and free from any business or other relationship that could materially interfere with the exercise of their independent judgment. The Board when taken as a whole is independent of the Investment Manager. Ms Sirota is a Board representative of the Investment Manager and is therefore not considered independent.
The Chairman of the Board must be independent and is appointed in accordance with the Company’s articles of incorporation. Mr Simpson’s independence is evaluated annually and he is considered to be independent because he:
– has no direct or indirect current or historical employment with the Investment Manager; and
– has no current directorships in any other entities for which the Investment Manager provide services.
Duties and responsibilitiesThe Board has overall responsibility for maximising the Company’s success by directing and supervising the affairs of the business and meeting the appropriate interests of shareholders and relevant stakeholders, while enhancing the value of the Company and also ensuring the protection of investors. A summary of the Board’s responsibilities is as follows:
– statutory obligations and public disclosure;
– strategic matters and financial reporting;
– risk assessment and management including reporting, compliance, governance, monitoring and control; and
– other matters having a material effect on the Company.
The Board is responsible to shareholders for the overall management of the Company. The Board has adopted a Schedule of Matters Reserved for the Board which sets out the particular duties of the Board, which demonstrates the seriousness with which it takes its fiduciary responsibilities. Such reserved powers include decisions relating to the determination of investment policy and approval of changes in strategy, capital structure, statutory obligations and public disclosure, and entering into any material contracts by the Company.
The Directors have access to the advice and services of the Administrator, which is responsible to the Board for ensuring that Board procedures are followed and that it complies with Companies Law and applicable rules and regulations of the GFSC and the LSE. Where necessary, in carrying out their duties, the Directors may seek independent legal or other professional advice and services at the expense of the Company. As a result of the use of professional service providers and the nature of the Company’s operations, the Company does not have any employees.
Report of the Directors (continued)
52 RTW Venture Fund Limited Annual Report and accounts 2020 53RTW Venture Fund Limited
Annual Report and accounts 2020
Governance
Strategic reportFinancial statem
ents
The Company maintains appropriate Directors’ and Officers’ liability insurance in respect of legal action against its Directors.
The Board’s responsibilities for the Annual Report are set out in the Directors’ Responsibilities Statement on page 57. The Board is also responsible for issuing appropriate half-yearly financial reports and other price-sensitive public reports.
The primary focus at Board meetings is to review investment performance and associated matters such as share price discount/premium management, investor relations, peer group information, gearing and industry issues.
The attendance record of the Directors for the year is set out below:
Director
Scheduled Board
Meetings (max 4)
Other Board
Meetings (max 9)
Audit Committee Meet-ings
(max 4)
Management Engagement
Committee Meetings
(max 1)
Nomination and
Remuneration Committee
Meetings(max 1)
William Simpson 4 7 4 1 1
Paul Le Page 4 8 4 1 1William Scott 4 8 4 1 1Stephanie Sirota* 4 7 n/a n/a n/a
The Board will meet at least four times a year with further ad hoc Board and Board Committee meetings as required. Between meetings, there is regular contact with the Secretary and the Company’s Broker, as necessary.
* Ms Sirota is not a member of the Audit Committee, Management Engagement Committee or Nomination and Remuneration Committee, however from time to time she is invited to attend and did so during the year.
The performance and effectiveness of the Directors will be assessed annually having regard to the specific responsibilities of each Director as described in their service agreements.
Shareholdings of the DirectorsDirectors of the Company and their beneficial interests in the Company as at 31 December 2020 are detailed below:
Director
Number of Shares Per cent. Holding
31 December 2020
Per cent. Holding
31 December 2019
31 December 2020
31 December 2019
William Simpson 100,000 - 0.05 -Paul Le Page 103,000 - 0.05 -William Scott 100,000 50,000 0.05 0.03Stephanie Sirota 763,004 494,004 0.40 0.31
William Simpson has acquired an additional 25,000 shares since 31 December 2020.
Committees of the BoardAudit CommitteeThe Company has an Audit Committee with formally delegated duties and responsibilities within written terms of reference. Further information on the Audit Committee is included in the Report of the Audit Committee on pages 48 to 50.
Management Engagement Committee The Management Engagement Committee is chaired by William Simpson. The committee currently consists of William Simpson, William Scott and Paul Le Page. The Management Engagement Committee meets at least once a year pursuant to its terms of reference which are available on the Company’s website www.rtwfunds.com/venture-fund.
The Management Engagement Committee provides a formal mechanism for the review of the performance of the Company’s advisors, including the Investment Manager. It carries out this review through consideration of a number of objective and subjective criteria and through a review of the terms and conditions of the advisors’ appointments with the aim of evaluating performance, identifying any weaknesses and ensuring value for money for the Company’s shareholders.
Nomination and Remuneration CommitteeThe Nomination and Remuneration Committee is chaired by William Scott. The committee currently consists of William Scott, William Simpson and Paul Le Page. The Nomination and Remuneration Committee meets at least once a year pursuant to its terms of reference which are available on the Company’s website www.rtwfunds.com/venture-fund.
Regarding nomination, the Nomination and Remuneration Committee’s remit is to review regularly the structure, size and composition of the Board, to give full consideration to succession planning for Directors, to keep under review the leadership needs of the Company and be responsible for identifying and nominating for the approval of the Board, candidates to fill Board vacancies as and when they arise. The Board believes that, as a whole, it comprises an appropriate balance of skills, experience and knowledge. The Board also believes that diversity of experience and approach, including gender diversity, amongst Board members is of great importance and it is the Company’s policy to give careful consideration to issues of Board balance and diversity when making new appointments.
Regarding remuneration, the Nomination and Remuneration Committee determines and agrees with the Board the remuneration of the Company’s Chairman and non-executive Directors and in determining such remuneration, takes into account all factors which it deems necessary including any relevant legal requirements, the provisions and recommendations in the AIC Code, the Listing Rules and associated guidance.
Board performance and evaluationIn accordance with Provision 26 of the AIC Code, the Board is required to undertake a formal and rigorous evaluation of its performance on an annual basis. Such an evaluation of the performance of the Board as a whole and the Chairman will be carried out under the mandate of the Board in the form of self-appraisal questionnaires and a detailed discussion to determine effectiveness and performance in various areas as well as the Directors’ continued independence. The Directors believe that the current mix of skills, experience, ages and length of service of the Directors is appropriate to the requirements of the Company. With any new director appointment to the Board, induction training will be provided.
Internal control and financial reportingThe Directors acknowledge that they are responsible for establishing and maintaining the Company’s system of internal control and reviewing its effectiveness. Internal control systems are designed to manage rather than eliminate the failure to achieve business objectives and can only provide reasonable but not absolute assurance against material misstatements or loss. The Directors review all controls including operations, compliance and risk management. The key procedures which have been established to provide internal control are:
– The Board monitors the actions of the Company and undertakings of any external consultant as appointed by the Company at regular Board meetings and is given frequent updates on developments arising from the operations and strategic direction of the underlying investee companies. The Board has also delegated administration and company secretarial services to the Administrator; however, it retains accountability for all functions it delegates.
– The Board clearly defines the duties and responsibilities of the Company’s agents and advisors and appointments are made by the Board after due and careful consideration. The Board monitors the ongoing performance of such agents and advisors and will continue to do so.
– The Administrator maintains a system of internal control on which they report to the Board. The Board has reviewed the need for an internal audit function and has decided that the systems and procedures employed by the Administrator provide sufficient assurance that a sound system of risk management and internal control, which safeguards shareholders’ investment and the Company’s assets, is maintained. An internal audit function specific to the Company is therefore considered unnecessary.
The systems of control referred to above are designed to ensure effectiveness and efficient operation, internal control and compliance with laws and regulations. In establishing the systems of internal control, regard is paid to the materiality of relevant risks, the likelihood of costs being incurred and costs of control.
Relations with shareholdersThe Board welcomes shareholders’ views and places great importance on communication with its shareholders. The Company’s Annual General Meeting provides a forum for shareholders to meet and discuss issues with the Directors of the Company. The Chairman and other Directors are also available to meet with shareholders at other times, if required. In addition, the Company maintains a website which contains comprehensive information (www.rtwfunds.com/venture-fund), including company notifications, share information, financial reports, monthly NAVs, investment objectives and policy, investor contacts and information on the Board and corporate governance.
Major ShareholdersAs at 17 March 2021, insofar as is known to the Company, the following persons were interested, directly or indirectly, in 5 per cent. or more of the Ordinary Shares in issue:
ShareholderShareholding
(Ordinary Shares) % HoldingNature
of Holding
Bluestem Partners, LP 34,093,156 16.71 DirectRoderick Wong 27,286,368 13.37 IndirectDucasse Group Limited 18,361,456 9.00 Direct
Details of the voting rights can be found on page 83.
DividendsThe Company does not anticipate paying any dividends on its Ordinary Shares, as it intends to re-invest proceeds received from Portfolio Company sales or distributions. There have been no material changes in the Company’s dividend policy from that disclosed in the prospectus published by the Company on 14 October 2019.
Total Return for the year ended 31 December 2020For the year ended 31 December 2020, the Company recorded a net total return based on NAV per share of 54 per cent.
Directors’ authority to issue sharesSubject to the Company’s Articles of Association the Directors have the power to issue an unlimited number of shares.
Directors’ authority to buy back sharesThe current authority of the Company to make market purchases of up to 50 million Ordinary Shares (or, if lower, a maximum of 14.99 per cent. of the issued Share Capital) as authorised at the AGM of the Company on 25 June 2020. At the AGM scheduled to take place on 22 June 2021 the Board will seek to renew such authority. Any buy back of Ordinary Shares will be made subject to Companies Law and within any guidelines established from time to time by the Board and the making and timing of any buy backs will be at the absolute discretion of the Board and not at the option of the shareholders. Ordinary Shares will only be repurchased at a price which, after repurchase costs, represents a discount to the Net Asset Value per Ordinary Share and where the Directors believe such purchases will enhance shareholder value. Such purchases will also only be made in accordance with the Listing Rules of the UK Listing Authority which provide that the price to be paid must not be more than 5 per cent above the average of the middle market quotations for the Ordinary Shares for the five business days before the shares are purchased unless previously advised to shareholders.
In accordance with the Company’s Articles and Companies Law up to 10 per cent. of the Company’s shares may be held as treasury shares. The Company has not held any shares in treasury at any time.
Articles of IncorporationThe Company’s Articles may only be amended by special resolution of the shareholders and if the amendment affects the rights of the holders of shares, by a separate resolution of such holders only.
Change of controlThere are no agreements that the Company considers significant and to which the Company is party that would take effect, alter or terminate upon change of control of the Company following a takeover bid.
Anti-Bribery and Corruption PolicyThe Board has a zero tolerance approach to instances of bribery and corruption and has reiterated its commitment to carry out business fairly, honestly and openly. Accordingly, it expressly prohibits any Director or associated persons, when acting on behalf of the Company, from accepting, soliciting, paying, offering or promising to pay or authorise any payment, public or private, in the United Kingdom or abroad to secure any improper benefit for themselves or for the Company. The Investment Manager has also adopted a zero tolerance approach to instances of bribery and corruption. The Board insists on strict observance with these same standards by its service providers in their activities for the Company and continues to refine its process in this regard.
Report of the Directors (continued)
54 RTW Venture Fund Limited Annual Report and accounts 2020 55RTW Venture Fund Limited
Annual Report and accounts 2020
Governance
Strategic reportFinancial statem
ents
Criminal Finances ActThe Board has a zero tolerance commitment to preventing persons associated with it from engaging in criminal facilitation of tax evasion. The Board expects the same of its service providers and will not work with service providers that it knows do not demonstrate the same zero tolerance commitment to preventing persons associated with it from engaging in criminal facilitation of tax evasion.
Environment, Employees, Human Rights and Social MattersThe Company has an investment management contract with the Investment Manager. It has no employees and all of its Directors are non-executive, with day-to-day activities being carried out by third party service providers. There are therefore no disclosures to be made in respect of its employees. Further, because the Company is a closed-ended investment company with no employees, its environmental impact is minimal. The Board notes that the companies in which the Company invests directly or indirectly may have an environmental, employee, human rights or social impact of which the Board has no visibility or control.
The UK Modern Slavery ActThe Board conducts the business of the Company ethically and with integrity, and has a zero tolerance policy towards modern slavery in all its forms. As the Company has no employees, all its Directors are non-executive and all its functions are outsourced, there are no further disclosures to be made in respect of employees and human rights. The Board notes that the companies in which the Company invests directly or indirectly may have an employee, community, human rights or social impact of which the Board has no visibility or control.
Certain Service ProvidersIndependent AuditorKPMG Channel Islands Limited (“KPMG”), who are Chartered Accountants and are registered auditors qualified to practice, have been appointed to serve as the Company’s auditor (the “Independent Auditor”). In such capacity, the Independent Auditor is responsible for auditing and expressing an opinion on the financial statements of the Company in accordance with applicable law and auditing standards.
Investment ManagerThe Directors are responsible for the determination of the Company’s investment policy and have overall responsibility for the Company’s business activities. The Company and the Investment Manager have entered into the Investment Management Agreement (as amended, supplemented or modified from time to time), pursuant to which the Investment Manager has been appointed as the Company’s investment manager and has been delegated the authority and responsibility to manage the Company’s investment portfolio.
Principal and emerging risks and uncertaintiesThe Company’s assets consist of investments in promising therapies and technologies in the pharmaceutical industry. There is inherent uncertainty in the long term viability of developing biopharmaceutical technologies and whether these technologies can translate scientific theory into commercially viable business opportunities. Its principal and emerging risks are therefore related to the particular circumstances of the businesses in which it is invested. The Company seeks to mitigate these risks through active asset management initiatives and carrying out due diligence work on potential targets before entering into any investments.
Each Director is aware of the risks inherent in the Company’s business and understands the importance of identifying, evaluating and monitoring these risks. The Board has adopted procedures and controls that enable it to manage these risks within acceptable limits and to meet all of its legal and regulatory obligations.
The Board considers the process for identifying, evaluating and managing any significant risks faced by the Company on an on-going basis and these risks are reported and discussed at Board Meetings. It ensures that effective controls are in place to mitigate these risks and that a satisfactory compliance regime exists to ensure all applicable local and international laws and regulations are upheld. Particular attention has been given to the effectiveness of controls to monitor liquidity risk, asset values and counterparty exposure.
For each material risk, the likelihood and consequence are identified, management controls and frequency of monitoring are confirmed and results reported and discussed at the quarterly Board meetings and through updating of the Company’s risk matrix. An extraction of the highest rated risks post mitigation forms the basis of the Principal and Emerging Risks and Uncertainties disclosure in the Strategic Report.
Further details on the Company’s principal risks and uncertainties can be found on page 41.
The financial risks of the Company are discussed in Note 8 to the financial statements.
The Company’s other risk factors are fully discussed in the Company’s prospectus, available on the Company’s website (www.rtwfunds.com/venture-fund) and should be reviewed by Shareholders.
Going concernIn forming a view on whether the Company is a Going Concern, the Directors have considered the following factors:
– A three year stressed cash-flow forecast prepared by the Investment Manager for the purposes of assessing viability;
– A viability and going concern memorandum from the Investment Manager taking into account the impact of COVID-19 on the Company’s business model and operations;
– The Company’s ability to raise additional capital both during and after the current financial year-end.
After making enquiries and given the nature of the Company and its investments, the Directors are satisfied that it is appropriate to continue to adopt the going concern basis in preparing the financial statements, and, after due consideration, the Directors consider that the Company is able to continue for the foreseeable future.
By order of the Board
William SimpsonChairman 28 April 2021
The Directors are responsible for preparing the Annual Report and financial statements in accordance with applicable law and regulations.
Company law requires the directors to prepare financial statements for each financial year. Under that law they are required to prepare the financial statements in accordance with accounting principles generally accepted in the United States of America and applicable law.
Under company law the Directors must not approve the financial statements unless they are satisfied that they give a true and fair view of the state of affairs of the Company and of its profit or loss for that period. In preparing these financial statements, the Directors are required to:
– select suitable accounting policies and then apply them consistently;
– make judgements and estimates that are reasonable, relevant and reliable;
– state whether applicable accounting standards have been followed, subject to any material departures disclosed and explained in the financial statements;
– assess the Company’s ability to continue as a going concern, disclosing, as applicable, matters related to going concern; and
– use the going concern basis of accounting unless liquidation is imminent.
The Directors confirm that they have complied with the above requirements in preparing the financial statements.
The Directors are responsible for keeping proper accounting records that are sufficient to show and explain the Company’s transactions and disclose with reasonable accuracy at any time the financial position of the Company and enable them to ensure that its financial statements comply with the Companies (Guernsey) Law, 2008. They are responsible for such internal control as they determine is necessary to enable the preparation of financial statements that are free from material misstatement, whether due to fraud or error, and have general responsibility for taking such steps as are reasonably open to them to safeguard the assets of the Company and to prevent and detect fraud and other irregularities.
The Directors are responsible for the maintenance and integrity of the corporate and financial information included on the Company’s website (www.rtwfunds.com/venture-fund). Legislation in Guernsey governing the preparation and dissemination of financial statements may differ from legislation in other jurisdictions.
The Directors who hold office at the date of approval of this Director’s Report confirm that so far as they are aware, there is no relevant audit information of which the Company’s auditor is unaware, and that each Director has taken all the steps he ought to have taken as a director to make himself aware of any relevant audit information and to establish that the Company’s auditor is aware of that information.
We confirm that to the best of our knowledge:
– the financial statements, prepared in accordance with the applicable set of accounting standards, give a true and fair view of the assets, liabilities, financial position and profit or loss of the Company; and
– the Annual Report includes a fair review of the development and performance of the business and the position of the issuer, together with a description of the principal risks and uncertainties that they face.
We consider the Annual Report and accounts, taken as a whole, is fair, balanced and understandable and provides the information necessary for shareholders to assess the Company’s position and performance, business model and strategy.
By order of the Board
William SimpsonChairman 28 April 2021
Paul Le PageDirector 28 April 2021
Statement of Directors’ Responsibilities
Report of the Directors (continued)
56 RTW Venture Fund Limited Annual Report and accounts 2020 57RTW Venture Fund Limited
Annual Report and accounts 2020
Governance
Strategic reportFinancial statem
ents

Our opinion is unmodifiedWe have audited the financial statements of RTW Venture Fund Limited (the “Company”), which comprise the statement of assets and liabilities including the condensed schedule of investments as at 31 December 2020, the statements of operations, changes in net assets and cash flows for the year then ended, and notes, comprising significant accounting policies and other explanatory information.
In our opinion, the accompanying financial statements:
– give a true and fair view of the financial position of the Company as at 31 December 2020, and of the Company’s financial performance and cash flows for the year then ended;
– are prepared in conformity with U.S. generally accepted accounting principles; and
– comply with the Companies (Guernsey) Law, 2008.
Basis for opinionWe conducted our audit in accordance with International Standards on Auditing (UK) (“ISAs (UK)”) and applicable law. Our responsibilities are described below. We have fulfilled our ethical responsibilities under, and are independent of the Company in accordance with, UK ethical requirements including FRC Ethical Standards, as applied to listed entities. We believe that the audit evidence we have obtained is a sufficient and appropriate basis for our opinion.
Key audit matters: our assessment of the risks of material misstatementKey audit matters are those matters that, in our professional judgement, were of most significance in the audit of the financial statements and include the most significant assessed risks of material misstatement (whether or not due to fraud) identified by us, including those which had the greatest effect on: the overall audit strategy; the allocation of resources in the audit; and directing the efforts of the engagement team. These matters were addressed in the context of our audit of the financial statements as a whole, and in forming our opinion thereon, and we do not provide a separate opinion on these matters. In arriving at our audit opinion above, the key audit matter was as follows (unchanged from 2019):
Valuation of investment in securities, at fair value The risk Our response
Valuation of investment in securities, at fair value $390,790,635; (2019 $170,653,009)
Refer to the Report of the Audit Committee on pages 48 to 50, the Condensed Schedule of Investments as at 31 December 2020 on pages 63 and 64, note 1 fair value significant accounting policies and note 2 fair value measurements disclosures.
Basis:The Company’s investment portfolio represents the most significant balance on the statement of assets and liabilities and is the principal driver of the Company’s net asset value (2020: 95%; 2019: 80%). The investment portfolio is composed of publicly quoted and private unquoted life science investments (together the “Investments”).
Publicly quoted life science investments, representing 88% of the fair value of Investments, are valued using third party data sources.
Private unquoted life science investments, representing 12% of the fair value of Investments, are valued using recognised valuation methodologies, including option pricing models.
The Investment Manager utilises an Independent Valuer to assist them in their determination of the fair value of private unquoted life science investments.
Risk:The valuation of the Company’s investments is considered a significant area of our audit, given that it represents the majority of the net assets of the Company.
The valuation risk of the private unquoted life science investments incorporates both a risk of fraud and error given the significance of estimates and judgements that are involved in the determination of fair value.
Our audit procedures included, but were not limited to:
Controls evaluation:We assessed the design and implementation of the Investment Manager’s review control in relation to the valuation of private unquoted life science investments.
Challenging managements’ Investments valuation, including the use of our KPMG valuation specialists, as applicable:
For all Investments we assessed the appropriateness of the valuation methodology used to estimate fair value.
Publicly quoted life science investments
For publicly quoted life science investments, we independently priced 100% by fair value to third party data sources.
Private unquoted life science investments
For a value driven selection of the private unquoted life science investments we performed the following procedures, as applicable:
– Obtained and read the valuation memorandums produced by the Investment Manager;
– Assessed the objectivity, capabilities and competency of the Independent Valuer. We considered the scope of work and methodology applied by the Independent Valuer in performing their work. We obtained and assessed their findings and considered the impact, if any, on our audit work;
– Agreed the price of investments acquired during the year to supporting documentation such as purchase agreements, funding drawdown requests and bank statements. We performed public searches for contradictory or dis-confirming evidence to challenge both the absence or appropriateness of fair value movements;
– Considered the participation of external investors in any funding round either at, or subsequent to, the transaction date;
– Assessed and challenged the key assumptions based on available market information and corroborated key inputs to supporting documentation; and
– Considered market transactions in close proximity to the year-end and assessed their appropriateness as being representative of fair value.
Assessing disclosures:We also considered the Company’s financial statement disclosures in relation to the use of estimates and judgements regarding the fair value of investments in securities and the Company’s investment valuation policies adopted and the fair value disclosures, in notes 1 and 2 respectively, for conformity with US GAAP.
Independent Auditor’s Report to the members of RTW Venture Fund Limited
58 RTW Venture Fund Limited Annual Report and accounts 2020 59RTW Venture Fund Limited
Annual Report and accounts 2020
Governance
Strategic reportFinancial statem
ents

Our application of materiality and an overview of the scope of our auditMateriality for the financial statements as a whole was set at $8.3m, determined with reference to a benchmark of net assets of $412.6m, of which it represents approximately 2.0% (2019: 2.0%).
In line with our audit methodology, our procedures on individual account balances and disclosures were performed to a lower threshold, performance materiality, so as to reduce to an acceptable level the risk that individually immaterial misstatements in individual account balances add up to a material amount across the financial statements as a whole. Performance materiality for the Company was set at 75% (2019: 75%) of materiality for the financial statements as a whole, which equates to $6.2m. We applied this percentage in our determination of performance materiality because we did not identify any factors indicating an elevated level of risk.
We reported to the Audit Committee any corrected or uncorrected identified misstatements exceeding $0.4 million, in addition to other identified misstatements that warranted reporting on qualitative grounds.
Our audit of the Company was undertaken to the materiality level specified above, which has informed our identification of significant risks of material misstatement and the associated audit procedures performed in those areas as detailed above.
Going concernThe directors have prepared the financial statements on the going concern basis as they do not intend to liquidate the Company or to cease its operations, and as they have concluded that the Company’s financial position means that this is realistic. They have also concluded that there are no material uncertainties that could have cast significant doubt over its ability to continue as a going concern for at least a year from the date of approval of the financial statements (the “going concern period”).
In our evaluation of the directors’ conclusions, we considered the inherent risks to the Company’s business model and analysed how those risks might affect the Company’s financial resources or ability to continue operations over the going concern period. The risk that we considered most likely to affect the Company’s financial resources or ability to continue operations over this period was the availability of capital to meet operating costs and other financial commitments.
We considered whether this risk could plausibly affect the liquidity in the going concern period by comparing severe, but plausible downside scenarios that could arise from this risk against the level of available financial resources indicated by the Company’s financial forecasts.
We considered whether the going concern disclosure in note 1 to the financial statements gives a full and accurate description of the directors’ assessment of going concern.
Our conclusions based on this work:
– we consider that the directors’ use of the going concern basis of accounting in the preparation of the financial statements is appropriate;
– we have not identified, and concur with the directors’ assessment that there is not, a material uncertainty related to events or conditions that, individually or collectively, may cast significant doubt on the Company’s ability to continue as a going concern for the going concern period; and
– we found the going concern disclosure in the notes to the financial statements to be acceptable.
The Company is subject to other laws and regulations where the consequences of non-compliance could have a material effect on amounts or disclosures in the financial statements, for instance through the imposition of fines or litigation or impacts on the Company’s ability to operate. We identified financial services regulation as being the area most likely to have such an effect, recognising the regulated nature of the Company’s activities and its legal form. Auditing standards limit the required audit procedures to identify non-compliance with these laws and regulations to enquiry of management and inspection of regulatory and legal correspondence, if any. Therefore if a breach of operational regulations is not disclosed to us or evident from relevant correspondence, an audit will not detect that breach.
Context of the ability of the audit to detect fraud or breaches of law or regulation
Owing to the inherent limitations of an audit, there is an unavoidable risk that we may not have detected some material misstatements in the financial statements, even though we have properly planned and performed our audit in accordance with auditing standards. For example, the further removed non-compliance with laws and regulations is from the events and transactions reflected in the financial statements, the less likely the inherently limited procedures required by auditing standards would identify it.
In addition, as with any audit, there remains a higher risk of non-detection of fraud, as this may involve collusion, forgery, intentional omissions, misrepresentations, or the override of internal controls. Our audit procedures are designed to detect material misstatement. We are not responsible for preventing non-compliance or fraud and cannot be expected to detect non-compliance with all laws and regulations.
Other informationThe directors are responsible for the other information. The other information comprises the information included in the annual report and audited financial statements but does not include the financial statements and our auditor’s report thereon. Our opinion on the financial statements does not cover the other information and we do not express an audit opinion or any form of assurance conclusion thereon.
In connection with our audit of the financial statements, our responsibility is to read the other information and, in doing so, consider whether the other information is materially inconsistent with the financial statements or our knowledge obtained in the audit, or otherwise appears to be materially misstated. If, based on the work we have performed, we conclude that there is a material misstatement of this other information, we are required to report that fact. We have nothing to report in this regard.
We have nothing to report on other matters on which we are required to report by exceptionWe have nothing to report in respect of the following matters where the Companies (Guernsey) Law, 2008 requires us to report to you if, in our opinion:
– the Company has not kept proper accounting records; or
– the financial statements are not in agreement with the accounting records; or
– we have not received all the information and explanations, which to the best of our knowledge and belief are necessary for the purpose of our audit.
However, as we cannot predict all future events or conditions and as subsequent events may result in outcomes that are inconsistent with judgements that were reasonable at the time they were made, the above conclusions are not a guarantee that the Company will continue in operation.
Fraud and breaches of laws and regulations – ability to detectIdentifying and responding to risks of material misstatement due to fraud
To identify risks of material misstatement due to fraud (“fraud risks”) we assessed events or conditions that could indicate an incentive or pressure to commit fraud or provide an opportunity to commit fraud. Our risk assessment procedures included:
– enquiring of management as to the Company’s policies and procedures to prevent and detect fraud as well as enquiring whether management have knowledge of any actual, suspected or alleged fraud;
– reading minutes of meetings of those charged with governance; and
– using analytical procedures to identify any unusual or unexpected relationships.
As required by auditing standards, and taking into account possible incentives or pressures to misstate performance and our overall knowledge of the control environment, we perform procedures to address the risk of management override of controls, in particular the risk that management may be in a position to make inappropriate accounting entries, and the risk of bias in accounting estimates such as valuation of private unquoted life science investments. On this audit we do not believe there is a fraud risk related to revenue recognition because the Company’s revenue streams are simple in nature with respect to accounting policy choice, and are easily verifiable to external data sources or agreements with little or no requirement for estimation from management. We did not identify any additional fraud risks.
We performed procedures including:
– identifying journal entries and other adjustments to test based on risk criteria and comparing any identified entries to supporting documentation;
– incorporating an element of unpredictability in our audit procedures; and
– assessing significant accounting estimates for bias.
Further detail in respect of valuation of private unquoted life science investments is set out in the key audit matter section of this report.
Identifying and responding to risks of material misstatement due to non-compliance with laws and regulations
We identified areas of laws and regulations that could reasonably be expected to have a material effect on the financial statements from our sector experience and through discussion with management (as required by auditing standards), and from inspection of the Company’s regulatory and legal correspondence, if any, and discussed with management the policies and procedures regarding compliance with laws and regulations. As the Company is regulated, our assessment of risks involved gaining an understanding of the control environment including the entity’s procedures for complying with regulatory requirements.
The Company is subject to laws and regulations that directly affect the financial statements including financial reporting legislation and taxation legislation and we assessed the extent of compliance with these laws and regulations as part of our procedures on the related financial statement items.
Respective responsibilitiesDirectors’ responsibilitiesAs explained more fully in their statement set out on page 57, the directors are responsible for: the preparation of the financial statements including being satisfied that they give a true and fair view; such internal control as they determine is necessary to enable the preparation of financial statements that are free from material misstatement, whether due to fraud or error; assessing the Company’s ability to continue as a going concern, disclosing, as applicable, matters related to going concern; and using the going concern basis of accounting unless liquidation is imminent.
Auditor’s responsibilitiesOur objectives are to obtain reasonable assurance about whether the financial statements as a whole are free from material misstatement, whether due to fraud or error, and to issue our opinion in an auditor’s report. Reasonable assurance is a high level of assurance, but does not guarantee that an audit conducted in accordance with ISAs (UK) will always detect a material misstatement when it exists. Misstatements can arise from fraud or error and are considered material if, individually or in aggregate, they could reasonably be expected to influence the economic decisions of users taken on the basis of the financial statements.
A fuller description of our responsibilities is provided on the FRC’s website at www.frc.org.uk/auditorsresponsibilities.
The purpose of this report and restrictions on its use by persons other than the Company’s members as a bodyThis report is made solely to the Company’s members, as a body, in accordance with section 262 of the Companies (Guernsey) Law, 2008. Our audit work has been undertaken so that we might state to the Company’s members those matters we are required to state to them in an auditor’s report and for no other purpose. To the fullest extent permitted by law, we do not accept or assume responsibility to anyone other than the Company and the Company’s members, as a body, for our audit work, for this report, or for the opinions we have formed.
Dermot Dempsey
For and on behalf of KPMG Channel Islands Limited
Chartered Accountants and Recognised Auditors
Guernsey
28 April 2021
Independent Auditor’s Report to the members of RTW Venture Fund Limited (continued)
60 RTW Venture Fund Limited Annual Report and accounts 2020 61RTW Venture Fund Limited
Annual Report and accounts 2020
Governance
Strategic reportFinancial statem
ents

Statement of Assets and Liabilities as at 31 December 2020 and 31 December 2019 (Expressed in United States Dollars)
2020US$
2019US$
ASSETS:Investment in securities, at fair value (cost at 31 December 2020: US$151,961,275; cost at 31 December 2019: US$92,446,333) 390,790,635 170,653,009Derivative contracts, at fair value (cost at 31 December 2020: US$1,763,991; cost at 31 December 2019: US$10,930) 4,713,942 1,326,441Cash and cash equivalents 4,553,481 10,731,354
Due from brokers 20,032,971 33,083,714Receivable from unsettled trades 685,498 –Other assets 124,575 5,808
TOTAL ASSETS 420,901,102 215,800,326
LIABILITIES:Securities sold short, at fair value (proceeds at 31 December 2020: US$4,986,163; proceeds at 31 December 2019: US$193,650) 6,672,359 202,933Derivative contracts, at fair value (proceeds at 31 December 2020: US$6,903; proceeds at 31 December 2019: US$nil) 579,782 –Due to brokers 361,032 17,484Accrued expenses 530,070 660,232Payable for unsettled trades 145,930 532,702
TOTAL LIABILITIES 8,289,173 1,413,351
TOTAL NET ASSETS 412,611,929 214,386,975
NET ASSETS attributable to Ordinary Shares (shares at 31 December 2020: 191,515,735; shares at 31 December 2019: 161,544,695) 375,281,126 205,695,869
NET ASSETS attributable to Performance Allocation Shares (shares at 31 December 2020: 1; shares at 31 December 2019: 1) 37,330,803 8,691,106
NAV per Ordinary Share 1.9595 1.2733
The audited financial statements of the Company were approved and authorised for issue by the Board of Directors on 28 April 2021 and signed on its behalf by:
William SimpsonChairman
Paul Le PageDirector
See accompanying notes to the financial statements.
Condensed Schedule of Investments as at 31 December 2020 (Expressed in United States Dollars)
DescriptionsNumber
of SharesCostUS$
Fair ValueUS$
Percentage of Net Assets
%
Investments in securities, at fair valueCommon stocks
United StatesHealthcareRocket Pharmaceuticals, Inc. 3,089,728 8,131,396 169,440,683 41.07Others* 97,062,100 176,270,298 42.72Total United States 105,193,496 345,700,981 83.79
CanadaHealthcare 3,891,345 2,360,037 0.57
NetherlandsHealthcare 2,011,065 1,695,645 0.41
Cayman IslandsHealthcare 749,216 938,398 0.23
British Virgin IslandsHealthcare 226,450 383,740 0.09
ChinaHealthcare 7,325 13,224 0.00
Total common stocks 112,078,897 351,102,025 85.09
Convertible preferred stocks
United StatesHealthcare* 23,972,095 23,591,822 5.72
United KingdomHealthcare 7,402,614 7,707,415 1.87
Cayman IslandsHealthcare 6,862,515 6,862,515 1.66IrelandHealthcare 116,545 109,806 0.03
Total convertible preferred stocks 38,353,769 38,271,558 9.28
* No individual investment security or contract constitutes greater than 5 percent of net assets.
See accompanying notes to the financial statements.
62 RTW Venture Fund Limited Annual Report and accounts 2020 63RTW Venture Fund Limited
Annual Report and accounts 2020
Governance
Strategic reportFinancial statem
ents
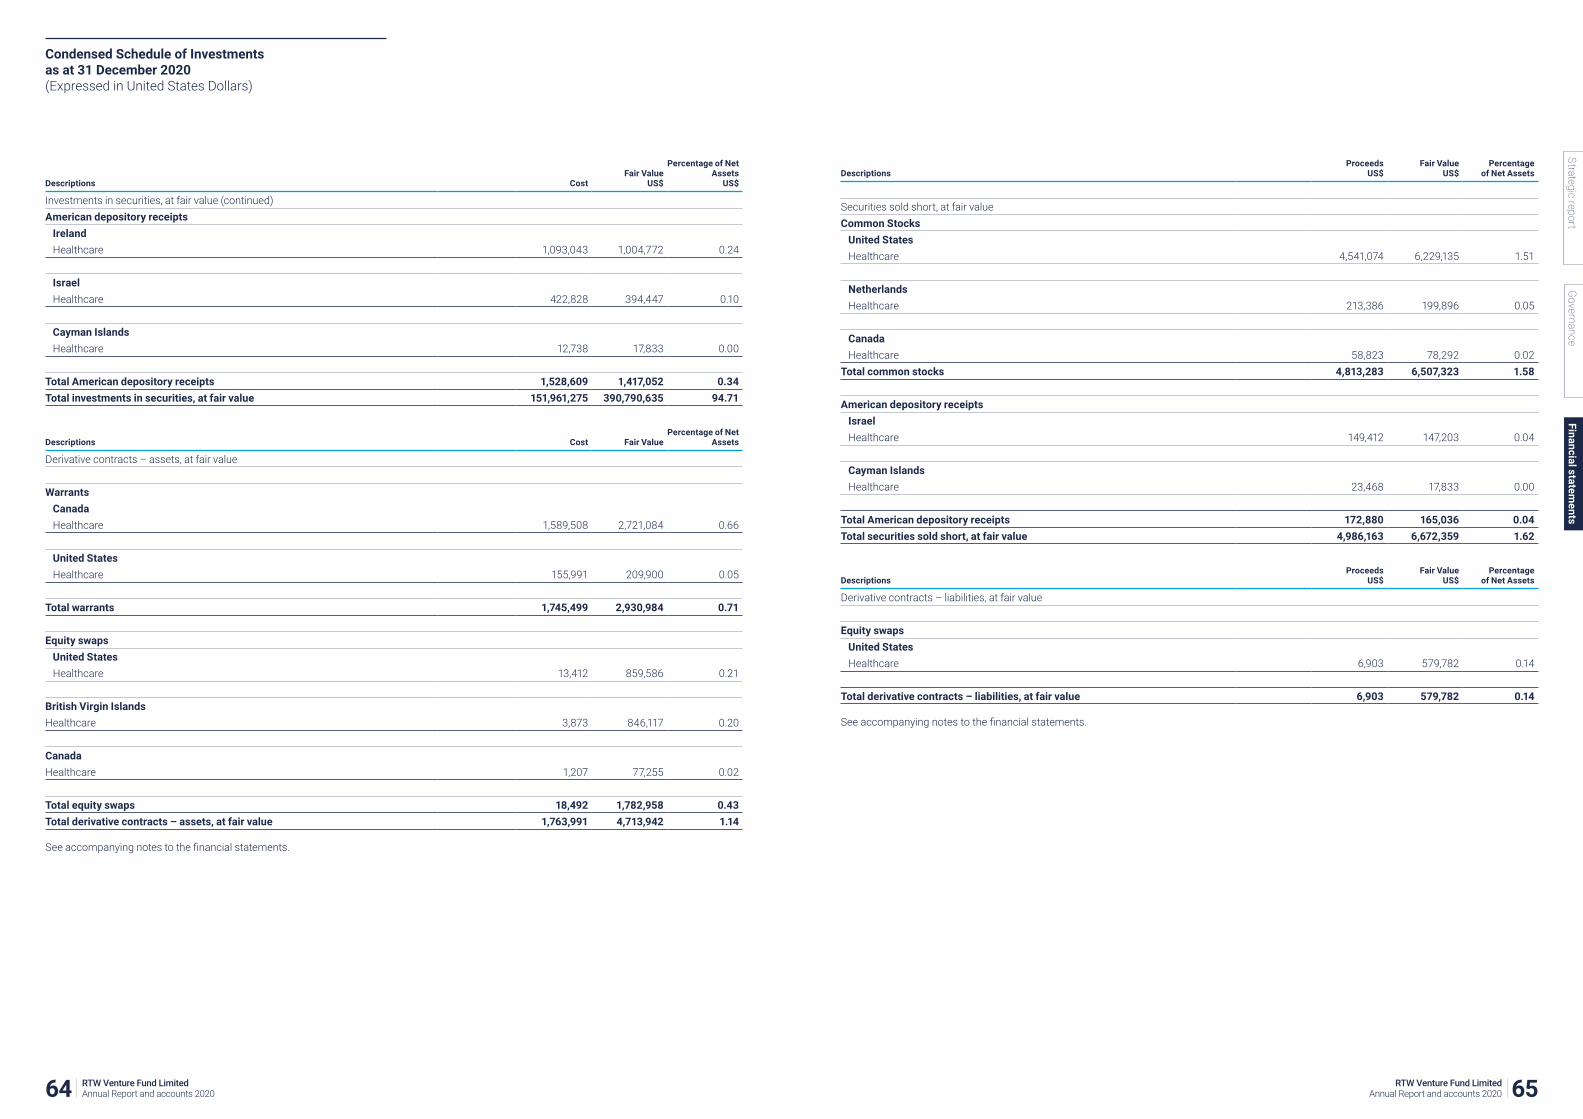
Descriptions CostFair Value
US$
Percentage of Net Assets
US$
Investments in securities, at fair value (continued)American depository receipts
IrelandHealthcare 1,093,043 1,004,772 0.24
IsraelHealthcare 422,828 394,447 0.10
Cayman IslandsHealthcare 12,738 17,833 0.00
Total American depository receipts 1,528,609 1,417,052 0.34Total investments in securities, at fair value 151,961,275 390,790,635 94.71
Descriptions Cost Fair ValuePercentage of Net
Assets
Derivative contracts – assets, at fair value
WarrantsCanadaHealthcare 1,589,508 2,721,084 0.66
United StatesHealthcare 155,991 209,900 0.05
Total warrants 1,745,499 2,930,984 0.71
Equity swapsUnited StatesHealthcare 13,412 859,586 0.21
British Virgin IslandsHealthcare 3,873 846,117 0.20
CanadaHealthcare 1,207 77,255 0.02
Total equity swaps 18,492 1,782,958 0.43Total derivative contracts – assets, at fair value 1,763,991 4,713,942 1.14 See accompanying notes to the financial statements.
DescriptionsProceeds
US$Fair Value
US$Percentage
of Net Assets
Securities sold short, at fair valueCommon Stocks
United StatesHealthcare 4,541,074 6,229,135 1.51
NetherlandsHealthcare 213,386 199,896 0.05
CanadaHealthcare 58,823 78,292 0.02
Total common stocks 4,813,283 6,507,323 1.58
American depository receiptsIsraelHealthcare 149,412 147,203 0.04
Cayman IslandsHealthcare 23,468 17,833 0.00
Total American depository receipts 172,880 165,036 0.04Total securities sold short, at fair value 4,986,163 6,672,359 1.62
DescriptionsProceeds
US$Fair Value
US$Percentage
of Net Assets
Derivative contracts – liabilities, at fair value
Equity swapsUnited StatesHealthcare 6,903 579,782 0.14
Total derivative contracts – liabilities, at fair value 6,903 579,782 0.14
See accompanying notes to the financial statements.
Condensed Schedule of Investments as at 31 December 2020 (Expressed in United States Dollars)
64 RTW Venture Fund Limited Annual Report and accounts 2020 65RTW Venture Fund Limited
Annual Report and accounts 2020
Governance
Strategic reportFinancial statem
ents

Condensed Schedule of Investments as at 31 December 2019 (Expressed in United States Dollars)
DescriptionsNumber
of SharesCostUS$
Fair ValueUS$
Percentage of Net Assets
Investments in securities, at fair valueCommon stocks
United StatesHealthcareRocket Pharmaceuticals, Inc. 3,089,728 8,131,396 70,322,209 34.19Others* 51,241,547 65,572,787 31.88Total United States 59,372,943 135,894,996 66.07
CanadaHealthcare 3,479,856 3,696,538 1.80
NetherlandsHealthcare 2,529,607 3,299,137 1.60
FranceHealthcare 66,650 57,715 0.03
SingaporeHealthcare 453,993 452,727 0.22
Total common stocks 65,903,049 143,401,113 69.72
Convertible preferred stocksUnited StatesHealthcare 20,500,001 20,634,308 10.03
United KingdomHealthcare 4,999,999 5,430,243 2.64
Total convertible preferred stocks 25,500,000 26,064,551 12.67
American depository receiptsIrelandHealthcare 736,375 873,580 0.42
IsraelHealthcare 306,909 313,765 0.15
Total American depository receipts 1,043,284 1,187,345 0.57
Total investment in securities 92,446,333 170,653,009 82.96
See accompanying notes to the financial statements.
DescriptionsCostUS$
Fair ValueUS$
Percentage of Net Assets
Derivative contracts, at fair value
Equity swapsUnited StatesHealthcare 7,210 680,085 0.33
British Virgin IslandsHealthcare 2,579 355,878 0.17
CanadaHealthcare (934) 4,430 0.00
NetherlandsHealthcare 2,075 286,048 0.14
Total derivative contracts, at fair value 10,930 1,326,441 0.64
DescriptionsProceeds
US$Fair Value
US$Percentage
of Net Assets
Securities sold short, at fair value
Common StocksUnited StatesHealthcare 193,650 202,933 0.10
Total securities sold short, at fair value 193,650 202,933 0.10
See accompanying notes to the financial statements.
66 RTW Venture Fund Limited Annual Report and accounts 2020 67RTW Venture Fund Limited
Annual Report and accounts 2020
Governance
Strategic reportFinancial statem
ents

Statement of Operations For the year ended 31 December 2020 and 31 December 2019 (Expressed in United States Dollars)
2020US$
2019US$
Investment IncomeInterest (net of withholding taxes of US$nil; 2019: US$nil) 70,291 76,507Dividends (net of withholding taxes of US$nil; 2019: US$nil) 83,814 4,435Total Investment Income 154,105 80,942
ExpensesInterest 73,545 17,484Research fees 130,489 97,972Administrative fee 233,459 70,389Audit fees 162,016 205,274Directors fees 220,875 33,140Management fee 2,912,850 368,611Professional fees 1,068,017 549,478Other expenses 305,856 36,456Total expenses 5,107,107 1,378,804
Net investment loss (4,953,002) (1,297,862)
Realised and change in unrealised gain/loss on investments, derivatives and foreign currency transactionsNet realised gain on securities and foreign currency transactions 8,337,422 14,561,226Net change in unrealised gain on securities and foreign currency translation 159,009,990 24,138,987Net realised loss on derivative contracts (2,880,680) –Net change in unrealised gain on derivative contracts 1,139,850 1,315,511
Net realised and unrealised gain on investments, derivatives and foreign currency transactions 165,606,582 40,015,724
Net increase in net assets resulting from operations 160,653,580 38,717,862
See accompanying notes to the financial statements.
Statement of Changes in Net Assets For the year ended 31 December 2020 (Expressed in United States Dollars)
Ordinary Share Class Fund
US$
Performance Allocation Share
Class FundUS$
Total Shareholders’
FundsUS$
OperationsNet investment loss (4,953,002) – (4,953,002)Net realised gain on securities and foreign currency transactions 8,337,422 – 8,337,422Net change in unrealised gain on securities and foreign currency translation 159,009,990 – 159,009,990Net realised loss on derivative contracts (2,880,680) – (2,880,680)Net change in unrealised gain on derivative contracts 1,139,850 – 1,139,850Performance Allocation (32,787,677) 32,787,677 –
Net change in net assets resulting from operations 127,865,903 32,787,677 160,653,580
Capital transactionsIssuance of Shares (net of issuance costs of US$209,676) 41,719,354 – 41,719,354Performance Allocation distribution – (4,147,980) (4,147,980)Net change in net assets resulting from capital transactions 41,719,354 (4,147,980) 37,571,374
Net change in net assets 169,585,257 28,639,697 198,224,954
Net assets, beginning of year 205,695,869 8,691,106 214,386,975
Net assets, end of year 375,281,126 37,330,803 412,611,929
68 RTW Venture Fund Limited Annual Report and accounts 2020 69RTW Venture Fund Limited
Annual Report and accounts 2020
Governance
Strategic reportFinancial statem
ents
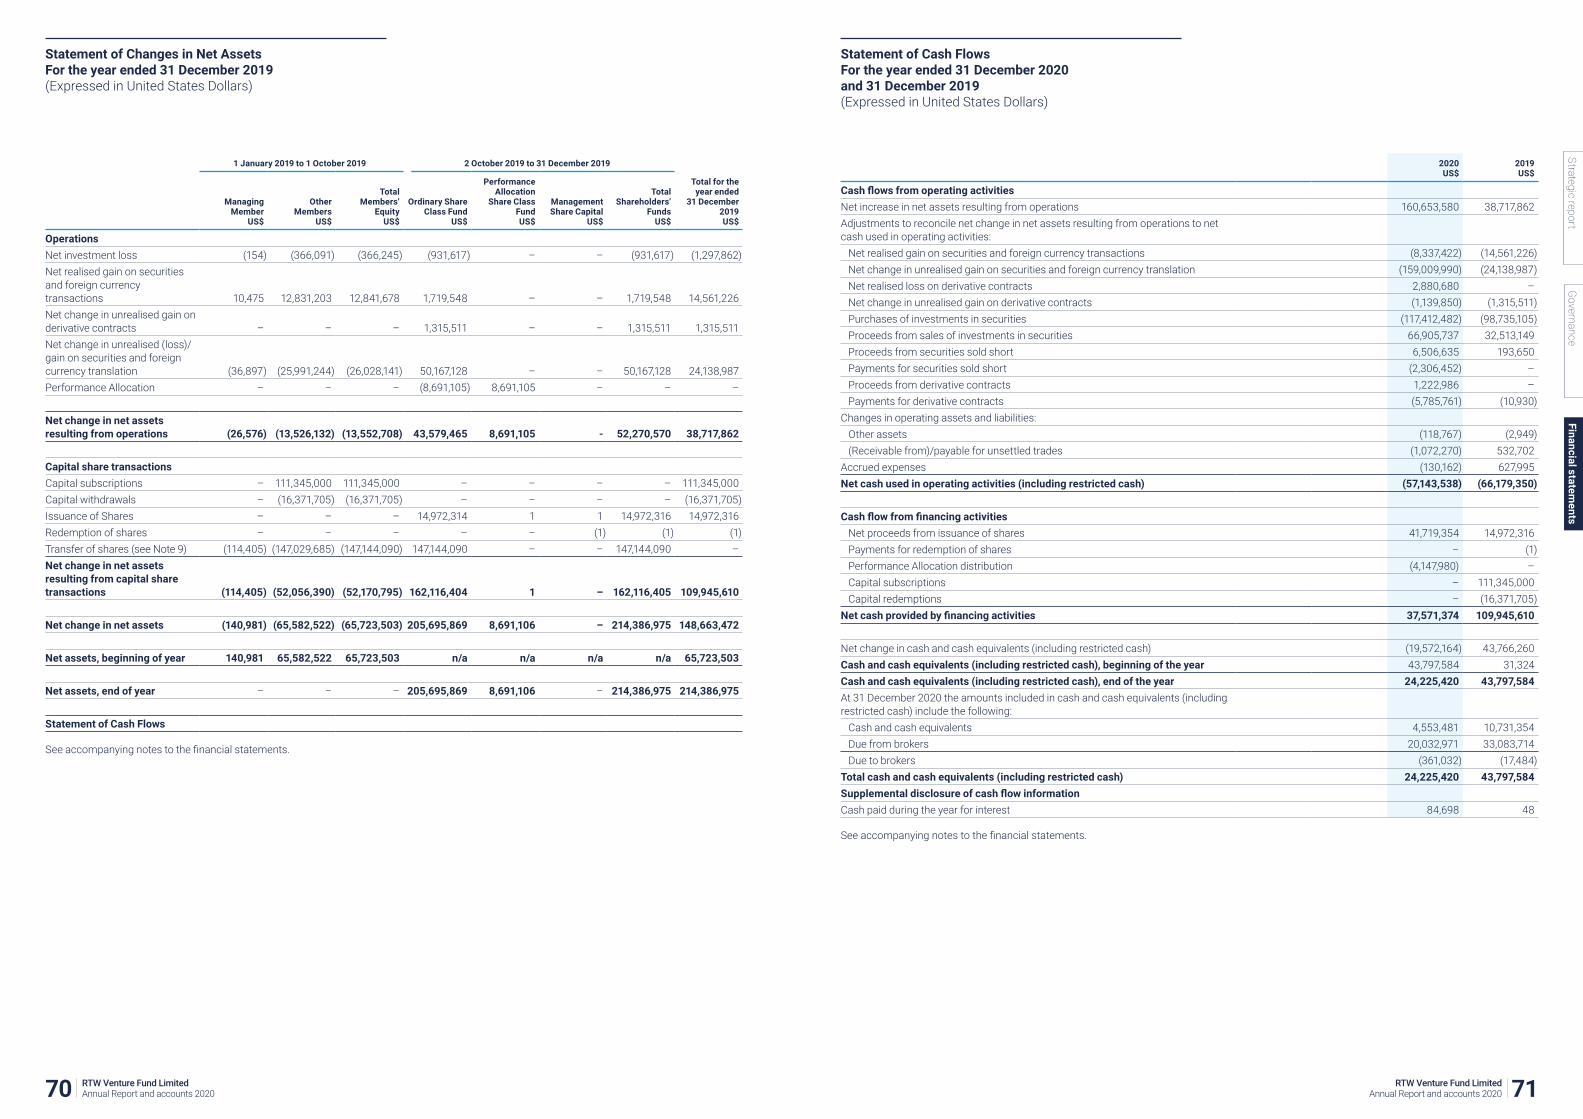
Statement of Changes in Net Assets For the year ended 31 December 2019 (Expressed in United States Dollars)
1 January 2019 to 1 October 2019 2 October 2019 to 31 December 2019
Total for the year ended
31 December 2019US$
Managing Member
US$
Other Members
US$
Total Members’
EquityUS$
Ordinary Share Class Fund
US$
Performance Allocation
Share Class FundUS$
Management Share Capital
US$
Total Shareholders’
FundsUS$
OperationsNet investment loss (154) (366,091) (366,245) (931,617) – – (931,617) (1,297,862)Net realised gain on securities and foreign currency transactions 10,475 12,831,203 12,841,678 1,719,548 – – 1,719,548 14,561,226Net change in unrealised gain on derivative contracts – – – 1,315,511 – – 1,315,511 1,315,511Net change in unrealised (loss)/gain on securities and foreign currency translation (36,897) (25,991,244) (26,028,141) 50,167,128 – – 50,167,128 24,138,987Performance Allocation – – – (8,691,105) 8,691,105 – – –
Net change in net assets resulting from operations (26,576) (13,526,132) (13,552,708) 43,579,465 8,691,105 - 52,270,570 38,717,862
Capital share transactionsCapital subscriptions – 111,345,000 111,345,000 – – – – 111,345,000Capital withdrawals – (16,371,705) (16,371,705) – – – – (16,371,705)Issuance of Shares – – – 14,972,314 1 1 14,972,316 14,972,316Redemption of shares – – – – – (1) (1) (1)Transfer of shares (see Note 9) (114,405) (147,029,685) (147,144,090) 147,144,090 – – 147,144,090 –Net change in net assets resulting from capital share transactions (114,405) (52,056,390) (52,170,795) 162,116,404 1 – 162,116,405 109,945,610
Net change in net assets (140,981) (65,582,522) (65,723,503) 205,695,869 8,691,106 – 214,386,975 148,663,472
Net assets, beginning of year 140,981 65,582,522 65,723,503 n/a n/a n/a n/a 65,723,503
Net assets, end of year – – – 205,695,869 8,691,106 – 214,386,975 214,386,975
Statement of Cash Flows
See accompanying notes to the financial statements.
Statement of Cash Flows For the year ended 31 December 2020 and 31 December 2019 (Expressed in United States Dollars)
2020US$
2019US$
Cash flows from operating activitiesNet increase in net assets resulting from operations 160,653,580 38,717,862Adjustments to reconcile net change in net assets resulting from operations to net cash used in operating activities:
Net realised gain on securities and foreign currency transactions (8,337,422) (14,561,226)Net change in unrealised gain on securities and foreign currency translation (159,009,990) (24,138,987)Net realised loss on derivative contracts 2,880,680 –Net change in unrealised gain on derivative contracts (1,139,850) (1,315,511)Purchases of investments in securities (117,412,482) (98,735,105)Proceeds from sales of investments in securities 66,905,737 32,513,149Proceeds from securities sold short 6,506,635 193,650Payments for securities sold short (2,306,452) –Proceeds from derivative contracts 1,222,986 –Payments for derivative contracts (5,785,761) (10,930)
Changes in operating assets and liabilities:Other assets (118,767) (2,949)(Receivable from)/payable for unsettled trades (1,072,270) 532,702
Accrued expenses (130,162) 627,995Net cash used in operating activities (including restricted cash) (57,143,538) (66,179,350)
Cash flow from financing activitiesNet proceeds from issuance of shares 41,719,354 14,972,316Payments for redemption of shares – (1)Performance Allocation distribution (4,147,980) –Capital subscriptions – 111,345,000Capital redemptions – (16,371,705)
Net cash provided by financing activities 37,571,374 109,945,610
Net change in cash and cash equivalents (including restricted cash) (19,572,164) 43,766,260Cash and cash equivalents (including restricted cash), beginning of the year 43,797,584 31,324Cash and cash equivalents (including restricted cash), end of the year 24,225,420 43,797,584At 31 December 2020 the amounts included in cash and cash equivalents (including restricted cash) include the following:
Cash and cash equivalents 4,553,481 10,731,354Due from brokers 20,032,971 33,083,714Due to brokers (361,032) (17,484)
Total cash and cash equivalents (including restricted cash) 24,225,420 43,797,584Supplemental disclosure of cash flow informationCash paid during the year for interest 84,698 48
See accompanying notes to the financial statements.
70 RTW Venture Fund Limited Annual Report and accounts 2020 71RTW Venture Fund Limited
Annual Report and accounts 2020
Governance
Strategic reportFinancial statem
ents

Notes to the financial statements
1. Nature of operations and summary of significant accounting policiesRTW Venture Fund Limited (formerly known as RTW Special Purpose Fund I, LLC) (the “Company”), is a publicly listed Guernsey non-cellular company limited by shares. It was originally incorporated in the State of Delaware, United States of America, and re-domiciled into Guernsey under the Companies Law on 2 October 2019 with registration number 66847 on the Guernsey Register of Companies. On 30 October 2019, all of the issued Ordinary Shares of the Company were listed and admitted to trading on the Specialist Fund Segment of the LSE (“SFS”) under ticker symbol: RTW.
The Company seeks to use equity capital (from the net proceeds of any share issuance or, where appropriate, from the net proceeds of investment divestments or other related profits) to provide seed and additional growth capital to the private investments. To mitigate cash-drag, the uninvested portion is invested across public stocks largely replicating the public stock portfolios of the Investment Manager’s (as defined below) existing US-based funds. The Company focuses on creating, building, and supporting world-class life sciences, biopharmaceutical and medical technology companies. The Company’s investment objective is to generate attractive risk-adjusted returns through investments in securities, both equity and debt, long and short, of companies with a focus on the pharmaceutical sector.
Prior to re-domiciliation, RTW Special Purpose Fund I, LLC had been created for the purpose of acquiring securities issued by Rocket Pharmaceuticals, Inc. (“Rocket”) which was its sole designated investment. The overall investment objective of RTW Special Purpose Fund I, LLC was to generate attractive returns through its investment in Rocket, a biotechnology company with a pipeline of early-stage gene therapy programs that address rare paediatric diseases that cause debilitating conditions, cancer and death. Rocket is attempting to achieve proof of concept and deliver commercially available, first-in-class, curative therapies to devastating, rare diseases.
On 4 January 2018, Rocket completed the reverse merger with Inotek Pharmaceutical, Inc. and became a publicly traded company with ticker RCKT on the NASDAQ national market.
Pursuant to an investment management agreement, the Company is managed by RTW Investments, LP, a Delaware limited partnership (the “Investment Manager”). The Investment Manager is an investment adviser registered with the U.S. Securities and Exchange Commission under the Investment Advisers Act of 1940.
Basis of presentationThe financial statements are expressed in United States dollars. The financial statements which give a true and fair view and have been prepared in conformity with US generally accepted accounting principles (“GAAP”) and are in compliance with the Companies (Guernsey) Law, 2008. The Company is an investment company and follows the accounting and reporting guidance in Financial Accounting Standards Board’s (“FASB”) Accounting Standards Codification Topic 946, Financial Services – Investment Companies.
The Directors considered that it is appropriate to adopt a going concern basis of accounting in preparing the financial statements. In reaching this assessment, the Directors have considered a wide range of information relating to present and future conditions including the balance sheets, future projections, cash flows and the longer-term strategy of the business.
The Board continues to monitor the ongoing impacts of the COVID-19 pandemic and has concluded that the biggest threat to the Company with regards to this pandemic is the failure for a key service provider to maintain business continuity and resiliency while maintaining work from home and social distancing practices. The Board has assessed the measures in place by key service providers to produce business continuity and so far has not identified any significant issues that affect the Company. The financial impact of the Company has not been negatively impacted by the pandemic either. For these reasons, the Board is confident that the outbreak of COVID-19 has not impacted the going concern assessment of the Company.
Cash and cash equivalents (including restricted cash)Cash represents cash deposits held at financial institutions. Cash equivalents include short-term highly liquid investments of sufficient credit quality that are readily convertible to known amounts of cash and have original maturities of three months or less. Cash equivalents are carried at cost plus accrued interest, which approximates fair value. Cash equivalents are held for the purpose of meeting short-term liquidity requirements, rather than for investment purposes. As at 31 December 2020 and 31 December 2019, the Company had no cash equivalents.
Restricted cash is subject to a legal or contractual restriction by third parties as well as a restriction as to withdrawal or use, including restrictions that require the funds to be used for a specified purpose and restrictions that limit the purpose for which the funds can be used. The Company considers cash pledged as collateral for securities sold short, cash collateral posted with counterparties for derivative contracts and further amounts due from brokers to be restricted cash, as outlined in note 3.
Fair Value – Definition and Hierarchy Fair value is defined as the price that would be received to sell an asset or paid to transfer a liability (i.e. the ‘exit price’) in an orderly transaction between market participants at the measurement date.
In determining fair value, the Company uses various valuation techniques. A fair value hierarchy for inputs is used in measuring fair value that maximizes the use of observable inputs and minimizes the use of unobservable inputs by requiring that the most observable inputs are to be used when available. Observable inputs are those that market participants would use in pricing the asset or liability based on market data obtained from sources independent of the Company.
Unobservable inputs reflect the Company’s assumptions about the inputs market participants would use in pricing the asset or liability developed based on the best information available in the circumstances. The fair value hierarchy is categorised into three levels based on the inputs as follows:
– Level 1 – Valuations based on unadjusted quoted prices in active markets for identical assets or liabilities that the Company has the ability to access. Valuation adjustments are not applied to Level 1 investments. Since valuations are based on quoted prices that are readily and regularly available in an active market, valuation of these investments does not entail a significant degree of judgement.
– Level 2 – Valuations based on inputs, other than quoted prices included in Level 1, that are observable, either directly or indirectly.
– Level 3 – Valuations based on inputs that are unobservable and significant to the overall fair value measurement.
The availability of valuation techniques and observable inputs can vary from investment to investment and is affected by a wide variety of factors, including the type of investment, whether the investment is new and not yet established in the marketplace, and other characteristics particular to the transaction. To the extent that valuation is based on models or inputs that are less observable or unobservable in the market, the determination of fair value requires more judgement. Those estimated values do not necessarily represent the amounts that may be ultimately realised due to the occurrence of future circumstances that cannot be reasonably determined. Because of the inherent uncertainty of valuation, those estimated values may be materially higher or lower than the values that would have been used had a ready market for the investments existed. Accordingly, the degree of judgement exercised by the Company in determining fair value is greatest for investments categorised in Level 3. In certain cases, the inputs used to measure fair value may fall into different levels of the fair value hierarchy. In such cases, for disclosure purposes, the level in the fair value hierarchy within which the fair value measurement falls in its entirety is determined based on the lowest level input that is significant to the fair value measurement.
Fair value is a market-based measure considered from the perspective of a market participant rather than an entity-specific measure. Therefore, even when market assumptions are not readily available, the Company’s own assumptions are set to reflect those that market participants would use in pricing the asset or liability at the measurement date. The Company uses prices and inputs that are current as of the measurement date, including periods of market dislocation. In periods of market dislocation, the observability of prices and inputs may be reduced for many investments. This condition could cause an investment to be reclassified to a lower level within the fair value hierarchy.
Fair Value – Valuation Techniques and InputsInvestments in Securities and Securities Sold ShortListed investmentsThe Company values investments in securities including exchange traded funds and securities sold short that are freely tradable and are listed on a national securities exchange or reported on the NASDAQ national market at their closing sales price as of the valuation date. To the extent these securities are actively traded and valuation adjustments are not applied, they are categorised in Level 1 of the fair value hierarchy. Securities traded on inactive markets or valued by reference to similar instruments or where a discount may be applied are categorised in Level 2 or 3 of the fair value hierarchy. A discount for lack of marketability based on 180 days restriction period under SEC Rule 144 is applied for investments that the Company purchases prior to an IPO and that subsequently begin trading on the NASDAQ national market.
Unlisted investmentsUnlisted investments are valued at fair value by the Directors following a detailed review and appropriate challenge of the valuations proposed by the Investment Manager. As part of their valuation process, the Investment Manager engages an Independent Valuer to challenge their assessed fair value on certain unlisted investments. The Investment Manager’s unlisted investment valuation policy applies to techniques consistent with the IPEV Guidelines.
The valuation techniques applied are either a market based approach or an income approach such as discounted cash flows. The IPEV Guidelines recognise that the price of a recent transaction, if resulting from an orderly transaction, generally represents fair value as at the transaction date and may be an appropriate starting point for estimating fair value at subsequent measurement dates. Consideration is given to the facts and circumstances as at the subsequent measurement date including changes in the market and/or performance of the investee company. Milestone analysis is used where appropriate to incorporate operational progress at the investee company level. In addition, a trigger event such as a subsequent round of financing by the investee company would influence the market technique used to calibrate fair value at the
measurement date.
The market approach utilizes guideline public companies relying on projected revenues to derive an indicated enterprise value. Due to the nature of the investments, being in the early stages of development, the projected revenues are used as a proxy for stable state revenue. A selected multiple is then applied based on the observed market multiples of the guideline public companies. To reflect the risk associated with the achievement of the projected revenues, the early development stage of each of the investments and the indicated enterprise value is discounted at an appropriate rate.
The income approach utilizes the discounted cash flow method. Projected cash flows for each investment were discounted to determine an assumed enterprise value.
Where applicable, the indicated enterprise value was determined using a back-solve model based on the pricing of the most recent round of financing. The internal rate of return for each investment was compared to the selected venture capital rate applied in the market approach to assess the reasonableness of the indicated value implied by each financing round. The derived enterprise value was allocated to the equity class on either a fully diluted basis or using an option pricing model. The resulting indicated value on a per share basis is then multiplied by the number of shares to derive the fair market value.
American Depository ReceiptsThe Company values investments in American depositary receipts that are freely tradable and are listed on a national securities exchange or reported on the NASDAQ national market at their last reported sales price as of the valuation date. These investments are categorised in Level 1 of the fair value hierarchy.
Convertible preferred stockLevel 1 investments in convertible preferred stock are valued on an as-if converted or fully dilutive liquidation basis. Level 3 investments in convertible preferred stock are valued in accordance with the unlisted investments section above. As of 31 December 2020, these investments are categorised in Level 1 and Level 3 of the fair value hierarchy.
Equity swapsEquity swaps may be centrally cleared or traded on the over-the-counter market. The fair value of equity swaps is calculated based on the terms of the contract and current market data, such as changes in fair value of the reference asset. The fair value of equity swaps is generally categorised in Level 2 of the fair value hierarchy.
WarrantsWarrants that are listed on major securities exchanges are valued at their last reported sales price as of the valuation date. The fair value of over the counter (“OTC”) warrants is determined using the Black-Scholes option pricing model, a valuation technique that follows the income approach. This pricing model takes into account the contract terms (including maturity) as well as multiple inputs, including time value, implied volatility, equity prices, interest rates and currency rates. Warrants are generally categorised in Level 2 or 3 of the fair value hierarchy.
Fair Value – Valuation ProcessesThe Company establishes valuation processes and procedures to ensure that the valuation techniques are fair and consistent, and valuation inputs are supportable. The Company designates the Investment Manager’s Valuation Committee to oversee the entire valuation process of the Company’s investments. The Valuation Committee comprises various members of the Investment Manager, including those separate from the Company’s portfolio management and trading functions, and reports to the Board. The Valuation Committee is responsible for developing the Company’s written valuation processes and procedures, conducting periodic reviews of the valuation policies, and evaluating the overall
72 RTW Venture Fund Limited Annual Report and accounts 2020 73RTW Venture Fund Limited
Annual Report and accounts 2020
Governance
Strategic reportFinancial statem
ents
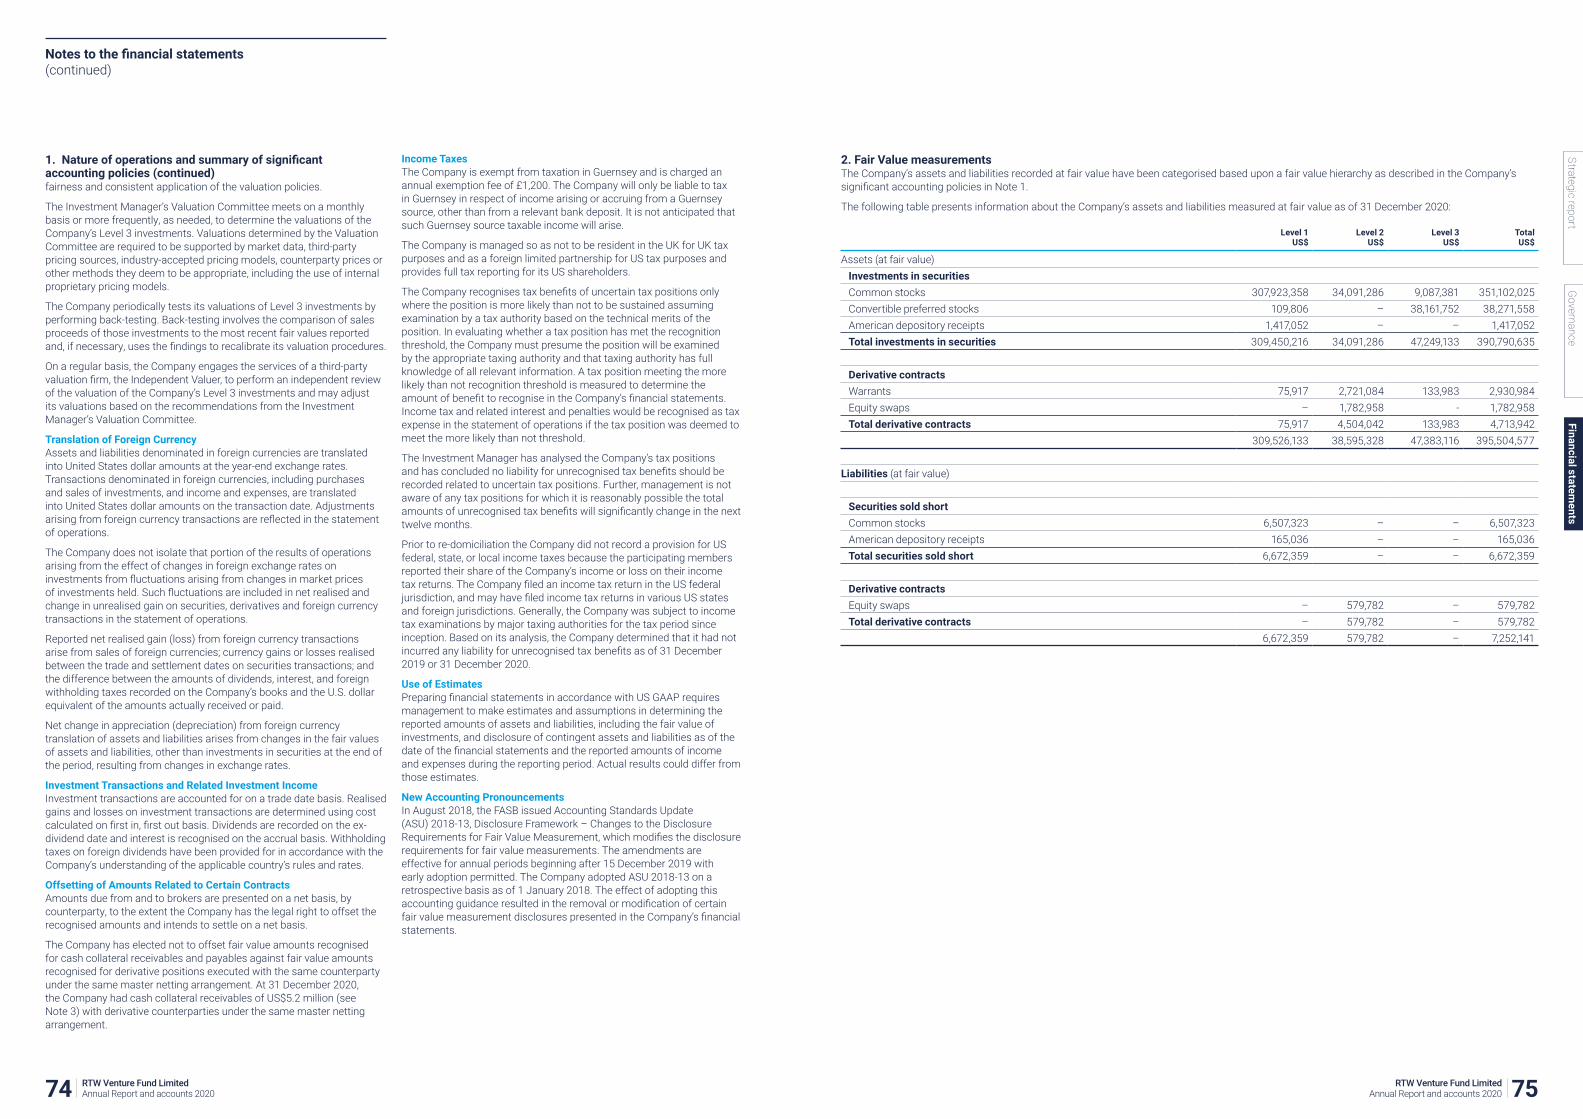
1. Nature of operations and summary of significant accounting policies (continued)fairness and consistent application of the valuation policies.
The Investment Manager’s Valuation Committee meets on a monthly basis or more frequently, as needed, to determine the valuations of the Company’s Level 3 investments. Valuations determined by the Valuation Committee are required to be supported by market data, third-party pricing sources, industry-accepted pricing models, counterparty prices or other methods they deem to be appropriate, including the use of internal proprietary pricing models.
The Company periodically tests its valuations of Level 3 investments by performing back-testing. Back-testing involves the comparison of sales proceeds of those investments to the most recent fair values reported and, if necessary, uses the findings to recalibrate its valuation procedures.
On a regular basis, the Company engages the services of a third-party valuation firm, the Independent Valuer, to perform an independent review of the valuation of the Company’s Level 3 investments and may adjust its valuations based on the recommendations from the Investment Manager’s Valuation Committee.
Translation of Foreign CurrencyAssets and liabilities denominated in foreign currencies are translated into United States dollar amounts at the year-end exchange rates. Transactions denominated in foreign currencies, including purchases and sales of investments, and income and expenses, are translated into United States dollar amounts on the transaction date. Adjustments arising from foreign currency transactions are reflected in the statement of operations.
The Company does not isolate that portion of the results of operations arising from the effect of changes in foreign exchange rates on investments from fluctuations arising from changes in market prices of investments held. Such fluctuations are included in net realised and change in unrealised gain on securities, derivatives and foreign currency transactions in the statement of operations.
Reported net realised gain (loss) from foreign currency transactions arise from sales of foreign currencies; currency gains or losses realised between the trade and settlement dates on securities transactions; and the difference between the amounts of dividends, interest, and foreign withholding taxes recorded on the Company’s books and the U.S. dollar equivalent of the amounts actually received or paid.
Net change in appreciation (depreciation) from foreign currency translation of assets and liabilities arises from changes in the fair values of assets and liabilities, other than investments in securities at the end of the period, resulting from changes in exchange rates.
Investment Transactions and Related Investment IncomeInvestment transactions are accounted for on a trade date basis. Realised gains and losses on investment transactions are determined using cost calculated on first in, first out basis. Dividends are recorded on the ex-dividend date and interest is recognised on the accrual basis. Withholding taxes on foreign dividends have been provided for in accordance with the Company’s understanding of the applicable country’s rules and rates.
Offsetting of Amounts Related to Certain ContractsAmounts due from and to brokers are presented on a net basis, by counterparty, to the extent the Company has the legal right to offset the recognised amounts and intends to settle on a net basis.
The Company has elected not to offset fair value amounts recognised for cash collateral receivables and payables against fair value amounts recognised for derivative positions executed with the same counterparty under the same master netting arrangement. At 31 December 2020, the Company had cash collateral receivables of US$5.2 million (see Note 3) with derivative counterparties under the same master netting arrangement.
Income TaxesThe Company is exempt from taxation in Guernsey and is charged an annual exemption fee of £1,200. The Company will only be liable to tax in Guernsey in respect of income arising or accruing from a Guernsey source, other than from a relevant bank deposit. It is not anticipated that such Guernsey source taxable income will arise.
The Company is managed so as not to be resident in the UK for UK tax purposes and as a foreign limited partnership for US tax purposes and provides full tax reporting for its US shareholders.
The Company recognises tax benefits of uncertain tax positions only where the position is more likely than not to be sustained assuming examination by a tax authority based on the technical merits of the position. In evaluating whether a tax position has met the recognition threshold, the Company must presume the position will be examined by the appropriate taxing authority and that taxing authority has full knowledge of all relevant information. A tax position meeting the more likely than not recognition threshold is measured to determine the amount of benefit to recognise in the Company’s financial statements. Income tax and related interest and penalties would be recognised as tax expense in the statement of operations if the tax position was deemed to meet the more likely than not threshold.
The Investment Manager has analysed the Company’s tax positions and has concluded no liability for unrecognised tax benefits should be recorded related to uncertain tax positions. Further, management is not aware of any tax positions for which it is reasonably possible the total amounts of unrecognised tax benefits will significantly change in the next twelve months.
Prior to re-domiciliation the Company did not record a provision for US federal, state, or local income taxes because the participating members reported their share of the Company’s income or loss on their income tax returns. The Company filed an income tax return in the US federal jurisdiction, and may have filed income tax returns in various US states and foreign jurisdictions. Generally, the Company was subject to income tax examinations by major taxing authorities for the tax period since inception. Based on its analysis, the Company determined that it had not incurred any liability for unrecognised tax benefits as of 31 December 2019 or 31 December 2020.
Use of EstimatesPreparing financial statements in accordance with US GAAP requires management to make estimates and assumptions in determining the reported amounts of assets and liabilities, including the fair value of investments, and disclosure of contingent assets and liabilities as of the date of the financial statements and the reported amounts of income and expenses during the reporting period. Actual results could differ from those estimates.
New Accounting PronouncementsIn August 2018, the FASB issued Accounting Standards Update (ASU) 2018-13, Disclosure Framework – Changes to the Disclosure Requirements for Fair Value Measurement, which modifies the disclosure requirements for fair value measurements. The amendments are effective for annual periods beginning after 15 December 2019 with early adoption permitted. The Company adopted ASU 2018-13 on a retrospective basis as of 1 January 2018. The effect of adopting this accounting guidance resulted in the removal or modification of certain fair value measurement disclosures presented in the Company’s financial statements.
2. Fair Value measurementsThe Company’s assets and liabilities recorded at fair value have been categorised based upon a fair value hierarchy as described in the Company’s significant accounting policies in Note 1.
The following table presents information about the Company’s assets and liabilities measured at fair value as of 31 December 2020:
Level 1US$
Level 2US$
Level 3US$
TotalUS$
Assets (at fair value)Investments in securitiesCommon stocks 307,923,358 34,091,286 9,087,381 351,102,025Convertible preferred stocks 109,806 – 38,161,752 38,271,558American depository receipts 1,417,052 – – 1,417,052Total investments in securities 309,450,216 34,091,286 47,249,133 390,790,635
Derivative contractsWarrants 75,917 2,721,084 133,983 2,930,984Equity swaps – 1,782,958 - 1,782,958Total derivative contracts 75,917 4,504,042 133,983 4,713,942
309,526,133 38,595,328 47,383,116 395,504,577
Liabilities (at fair value)
Securities sold shortCommon stocks 6,507,323 – – 6,507,323American depository receipts 165,036 – – 165,036Total securities sold short 6,672,359 – – 6,672,359
Derivative contractsEquity swaps – 579,782 – 579,782Total derivative contracts – 579,782 – 579,782
6,672,359 579,782 – 7,252,141
Notes to the financial statements (continued)
74 RTW Venture Fund Limited Annual Report and accounts 2020 75RTW Venture Fund Limited
Annual Report and accounts 2020
Governance
Strategic reportFinancial statem
ents
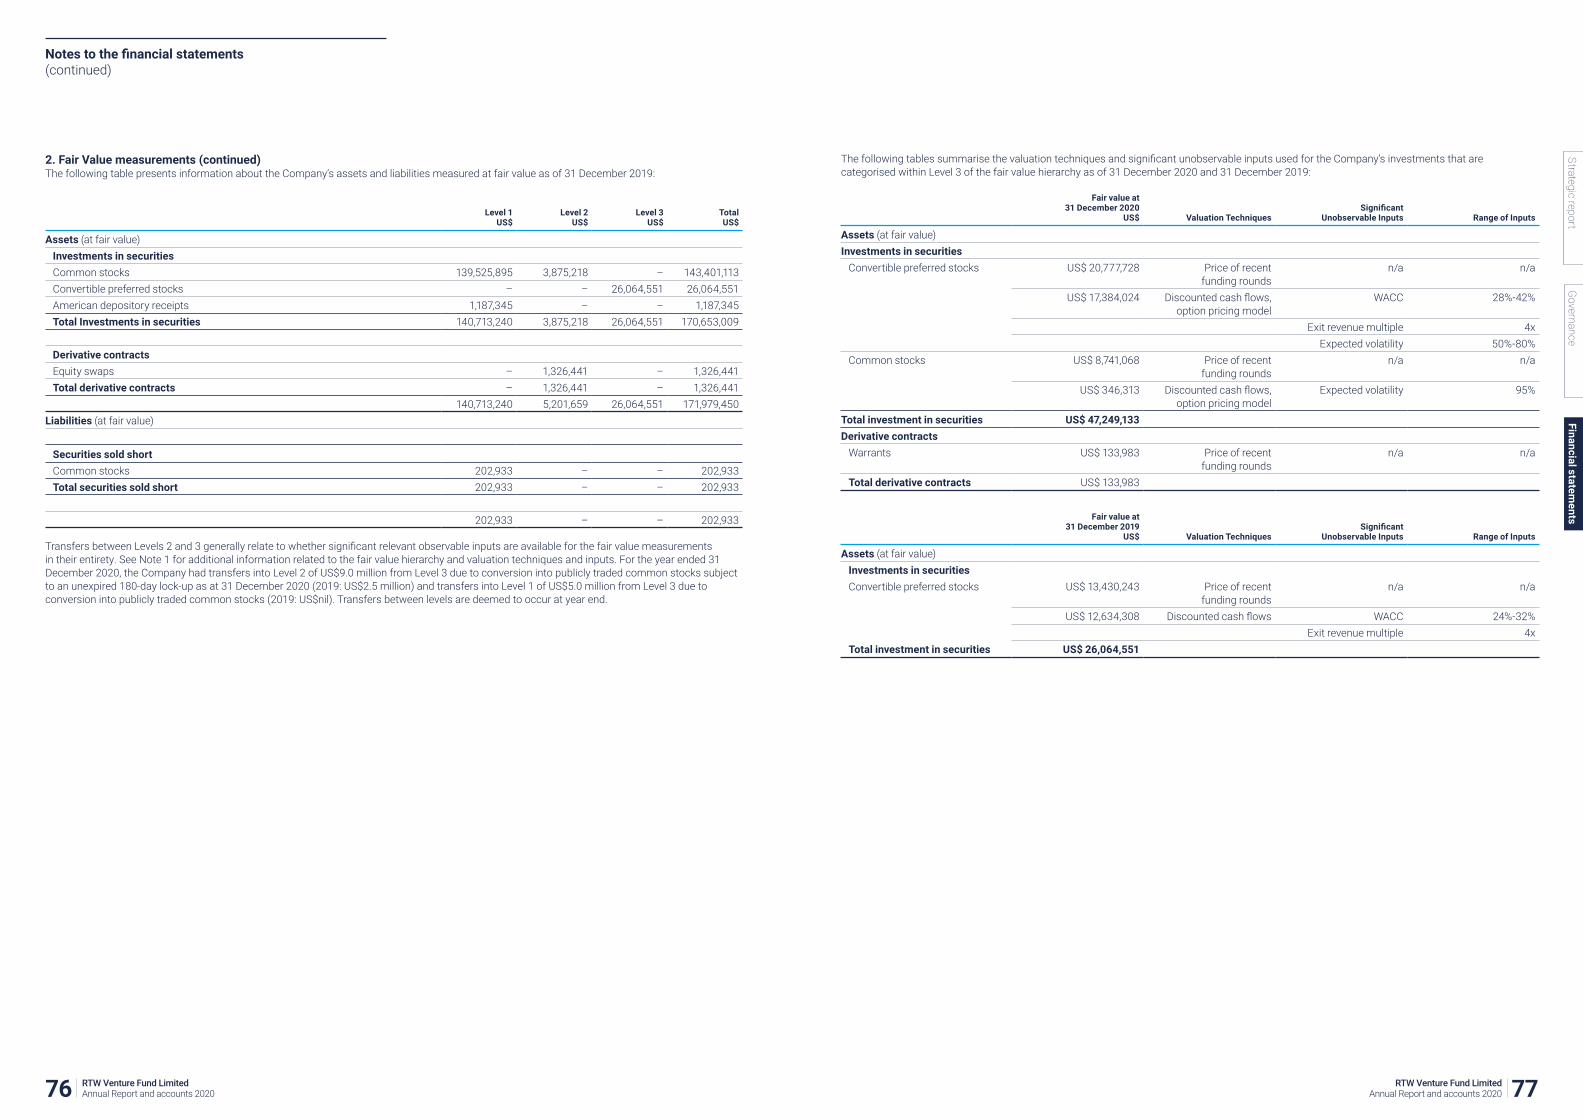
2. Fair Value measurements (continued)The following table presents information about the Company’s assets and liabilities measured at fair value as of 31 December 2019:
Level 1US$
Level 2US$
Level 3US$
TotalUS$
Assets (at fair value)Investments in securitiesCommon stocks 139,525,895 3,875,218 – 143,401,113Convertible preferred stocks – – 26,064,551 26,064,551American depository receipts 1,187,345 – – 1,187,345Total Investments in securities 140,713,240 3,875,218 26,064,551 170,653,009
Derivative contractsEquity swaps – 1,326,441 – 1,326,441Total derivative contracts – 1,326,441 – 1,326,441
140,713,240 5,201,659 26,064,551 171,979,450Liabilities (at fair value)
Securities sold shortCommon stocks 202,933 – – 202,933Total securities sold short 202,933 – – 202,933
202,933 – – 202,933
Transfers between Levels 2 and 3 generally relate to whether significant relevant observable inputs are available for the fair value measurements in their entirety. See Note 1 for additional information related to the fair value hierarchy and valuation techniques and inputs. For the year ended 31 December 2020, the Company had transfers into Level 2 of US$9.0 million from Level 3 due to conversion into publicly traded common stocks subject to an unexpired 180-day lock-up as at 31 December 2020 (2019: US$2.5 million) and transfers into Level 1 of US$5.0 million from Level 3 due to conversion into publicly traded common stocks (2019: US$nil). Transfers between levels are deemed to occur at year end.
The following tables summarise the valuation techniques and significant unobservable inputs used for the Company’s investments that are categorised within Level 3 of the fair value hierarchy as of 31 December 2020 and 31 December 2019:
Fair value at 31 December 2020
US$ Valuation TechniquesSignificant
Unobservable Inputs Range of Inputs
Assets (at fair value)Investments in securities
Convertible preferred stocks US$ 20,777,728 Price of recent funding rounds
n/a n/a
US$ 17,384,024 Discounted cash flows, option pricing model
WACC 28%-42%
Exit revenue multiple 4xExpected volatility 50%-80%
Common stocks US$ 8,741,068 Price of recent funding rounds
n/a n/a
US$ 346,313 Discounted cash flows, option pricing model
Expected volatility 95%
Total investment in securities US$ 47,249,133Derivative contracts
Warrants US$ 133,983 Price of recent funding rounds
n/a n/a
Total derivative contracts US$ 133,983
Fair value at 31 December 2019
US$ Valuation TechniquesSignificant
Unobservable Inputs Range of Inputs
Assets (at fair value)Investments in securitiesConvertible preferred stocks US$ 13,430,243 Price of recent
funding roundsn/a n/a
US$ 12,634,308 Discounted cash flows WACC 24%-32%Exit revenue multiple 4x
Total investment in securities US$ 26,064,551
Notes to the financial statements (continued)
76 RTW Venture Fund Limited Annual Report and accounts 2020 77RTW Venture Fund Limited
Annual Report and accounts 2020
Governance
Strategic reportFinancial statem
ents

2. Fair Value measurements (continued)The significant unobservable inputs used in the fair value measurements of Level 3 convertible preferred stocks are WACC, exit revenue multiple, and expected volatility. Increases in the WACC in isolation would result in a lower fair value for the security, and vice versa. Increases in the exit multiple would result in a higher fair value of the security, and vice versa. Increases in volatility could result in a higher or lower fair value for the security, and vice versa.
The following table presents additional information about Level 3 assets and liabilities measured at fair value. Both observable and unobservable inputs may be used to determine the fair value of positions that the Company has classified within the Level 3 category. As a result, the unrealised gains and losses for assets and liabilities within the Level 3 category may include changes in fair value that were attributable to both observable and unobservable inputs.
Changes in Level 3 assets and liabilities measured at fair value for the year ended 31 December 2020 were as follows:
Balance Beginning
1 January 2020US$
Realised Gains (Losses)(a)
US$
Change inUnrealised Gains
(Losses)(a)
US$Purchases
US$Sales
US$
Transfers into (from) Level 3*
US$
Ending Balance 31 December
2020
Assets (at fair value)Investment in securitiesConvertible preferred stocks 26,064,551 – (640,023) 28,972,718 (3,000,004) (13,235,490) 38,161,752Convertible notes – – – 762,640 – (762,640) -Common stocks – – 125,210 8,966,519 – (4,348) 9,087,381Total investment in securities 26,064,551 – (514,813) 38,701,877 (3,000,004) (14,002,478) 47,249,133
Derivative contractsWarrants – – – 133,983 – – 133,983Total derivative contracts – – – 133,983 – – 133,983
* Conversions of preferred stock and convertible notes into common stock.
Changes in Level 3 assets and liabilities measured at fair value for the year ended 31 December 2019 were as follows:
Beginning Balance 1
January 2019US$
Realised Gains (Losses)(a)
US$
Change in Unrealised Gains
(Losses)(a)
US$Purchases
US$Sales
US$
Transfers into (from) Level 3*
US$
Ending Balance 31 December
2019US$
Assets (at fair value)Investment in securitiesConvertible preferred stocks – – 564,551 27,999,999 – (2,499,999) 26,064,551Total Investment in securities – – 564,551 27,999,999 – (2,499,999) 26,064,551 * Conversions of preferred stock into common stock.
(a) Realised and unrealised gains and losses are included in net realised and unrealised gain on investments, derivatives and foreign currency transactions in the statement of operations.
Changes in Level 3 unrealised gains and losses during the year for assets still held at year end were as follows:
2020US$
2019US$
Convertible preferred stocks (640,023) 564,551Common stocks 125,210 –Change in unrealised gains and losses during the year for assets still held at 31 December (514,813) 564,551
Total realised gains and losses and unrealised gains and losses in the Company’s investment in securities, derivative contracts and securities sold short are made up of the following gain and loss elements:
2020US$
2019US$
Realised gains 17,159,030 14,973,801Realised losses (11,702,288) (412,575)Net realised gain on securities, derivative contracts and securities sold short 5,456,742 14,561,226
2020US$
2019US$
Change in unrealised gains 218,626,449 26,313,452Change in unrealised losses (58,476,609) (858,954)Net change in unrealised gain on securities, derivative contracts and securities sold short 160,149,840 25,454,498
3. Due to/from BrokersDue to/from brokers includes cash balances held with brokers and collateral on derivative transactions. Amounts due from brokers may be restricted to the extent that they serve as deposits for securities sold short or cash posted as collateral for derivative contracts.
At 31 December 2020, amounts included within due from brokers of US$14,841,134 (31 December 2019: US$31,190,294) can be used for investment. The Company pledged cash collateral to counterparties to over-the-counter derivative contracts of US$5,191,837 (31 December 2019: US$1,893,420) which is included in due from brokers.
In the normal course of business, substantially all of the Company’s securities transactions, money balances, and security positions are transacted with the Company’s prime brokers, Goldman Sachs & Co. LLC, Cowen Financial Products, LLC, UBS AG and Bank of America Merrill Lynch. The Company is subject to credit risk to the extent any broker with which it conducts business is unable to fulfil contractual obligations on its behalf. The Company’s management monitors the financial condition of such brokers and does not anticipate any losses from these counterparties.
4. Derivative Contracts In the normal course of business, the Company utilizes derivative contracts in connection with its proprietary trading activities. Investments in derivative contracts are subject to additional risks that can result in a loss of all or part of an investment. The Company’s derivative activities and exposure to derivative contracts are classified by the primary underlying risk, equity price risk and foreign currency exchange rate risk. In addition to its primary underlying risk, the Company is also subject to additional counterparty risk due to the inability of its counterparties to meet the terms of their contracts.
WarrantsThe Company may receive warrants from its portfolio companies upon an investment in the debt or equity of a portfolio company. The warrants provide the Company with exposure and potential gains upon equity appreciation of the portfolio company’s share price.
The value of a warrant has two components: time value and intrinsic value. A warrant has a limited life and expires on a certain date. As time to the expiration date of a warrant approaches, the time value of a warrant will decline. In addition, if the stock underlying the warrant declines in price, the intrinsic value of an “in the money” warrant will decline. Further, if the price of the stock underlying the warrant does not exceed the strike price of the warrant on the expiration date, the warrant will expire worthless. As a result, there is the potential for the Company to lose its entire investment in a warrant.
The Company is exposed to counterparty risk from the potential failure of an issuer of warrants to settle its exercised warrants. The maximum risk of loss from counterparty risk to the Company is the fair value of the contracts and the purchase price of the warrants. The Company considers the effects of counterparty risk when determining the fair value of its investments in warrants.
Equity swap contractsThe Company is subject to equity price risk in the normal course of pursuing its investment objectives. The Company may enter into equity swap contracts either to manage its exposure to the market or certain sectors of the market, or to create exposure to certain equities to which it is otherwise not exposed.
Equity swap contracts involve the exchange by the Company and a counterparty of their respective commitments to pay or receive a net amount based on the change in the fair value of a particular security or index and a specified notional amount.
Volume of Derivative ActivitiesThe Company considers the average month-end notional amounts during the year, categorised by primary underlying risk, to be representative of the volume of its derivative activities during the year ended 31 December 2020:
(notional amounts in thousands)Primary underlying risk
31 December 2020 31 December 2019
Long exposureUS$
Short exposureUS$
Long exposureUS$
Short exposureUS$
Notional amounts
Notional amounts
Notional amounts
Notional amounts
Equity priceWarrants(a) 1,487 – – –Equity swaps 5,757 7,118 3,449 –
7,244 7,118 3,449 –
(a) Notional amounts presented for warrants are based on the fair value of the underlying shares as if the warrants were exercised at each respective month end date.
Notes to the financial statements (continued)
78 RTW Venture Fund Limited Annual Report and accounts 2020 79RTW Venture Fund Limited
Annual Report and accounts 2020
Governance
Strategic reportFinancial statem
ents

4. Derivative Contracts (continued)Impact of Derivatives on the Statement of Assets and Liabilities and Statement of OperationsThe following tables identify the fair value amounts of derivative instruments included in the statement of assets and liabilities as derivative contracts, categorised by primary underlying risk, at 31 December 2020 and 31 December 2019. The following table also identifies the gain and loss amounts included in the statement of operations as net realised gain (loss) on derivative contracts and net change in unrealised gain (loss) on derivative contracts, categorised by primary underlying risk, for the year ended 31 December 2020 and 31 December 2019.
(in thousands)Primary underlying risk
31 December 2020
Derivative assets
US$
Derivative liabilities
US$
Realised gain (loss)
US$
Change in unrealised gain
(loss)US$
Equity priceWarrants 2,931 – – 1,186Equity swaps 1,783 580 (2,881) (46)
4,714 580 (2,881) 1,140
(in thousands)Primary underlying risk
31 December 2019
Derivative assets
US$
Derivative liabilities
US$
Realised gain (loss)
US$
Change in unrealised gain
(loss)US$
Equity priceEquity swaps 1,326 – – 1,316
1,326 – – 1,316
5. Securities lending agreementsThe Company has entered into securities lending agreements with its prime brokers. From time to time, the prime brokers lend securities on the Company’s behalf. As of 31 December 2020 and 31 December 2019, no securities were loaned and no collateral was received.
6. Offsetting assets and liabilitiesThe Company is required to disclose the impact of offsetting assets and liabilities represented in the statement of assets and liabilities to enable users of the financial statements to evaluate the effect or potential effect of netting arrangements on its financial position for recognised assets and liabilities. These recognised assets and liabilities are financial instruments and derivative instruments that are either subject to an enforceable master netting arrangement or similar agreement or meet the following right of setoff criteria: the amounts owed by the Company to another party are determinable, the Company has the right to offset the amounts owed with the amounts owed by the other party, the Company intends to offset and the Company’s right of setoff are enforceable at law.
As of 31 December 2020 and 31 December 2019, the Company held financial instruments and derivative instruments that were eligible for offset in the statement of assets and liabilities and are subject to a master netting arrangement. The master netting arrangement allows the counterparty to net applicable collateral held on behalf of the Company against applicable liabilities or payment obligations of the Company to the counterparty. These arrangements also allow the counterparty to net any of its applicable liabilities or payment obligations they have to the Company against any collateral sent to the Company.
As discussed in Note 1, the Company has elected not to offset assets and liabilities in the statement of assets and liabilities. The following table presents the potential effect of netting arrangements for asset derivative contracts presented in the statement of assets and liabilities:
(in thousands)Description
Gross amounts of recognised
assetsUS$
Gross amounts offset in the
statement of assets and
liabilitiesUS$
Net amounts of assets presented in the statement
of assets and liabilities
US$
31 December 2020Gross amounts not offset in the
statement of assets and liabilities
Net amountUS$
Financial instruments(a)
US$
Cash collateral received(b)
US$
Equity swapsCowen Financial Products, LLC 1,488 – 1,488 (296) – 1,192UBS AG 323 – 323 (61) – 262Bank of America Merrill Lynch 33 – 33 (33) – –
1,844 – 1,844 (390) – 1,454
(in thousands)Description
Gross amounts of recognised
assetsUS$
Gross amounts offset in the
statement of assets and
liabilitiesUS$
Net amounts of assets presented in the statement
of assets and liabilities
US$
31 December 2019Gross amounts not offset in the
statement of assets and liabilities
Net amountUS$
Financial instruments
US$
Cash collateral received
US$
Equity swapsCowen Financial Products, LLC 1,326 – 1,326 – – 1,326
1,326 – 1,326 – – 1,326
(a) Amounts related to master netting agreements (e.g. ISDA), determined by the Company to be legally enforceable in the event of default and if certain other criteria are met in accordance with applicable offsetting accounting guidance but were not offset due to management’s accounting policy election.
(b) Amounts related to master netting agreements and collateral agreements determined by the Company to be legally enforceable in the event of default, but certain other criteria are not met in accordance with applicable offsetting accounting guidance. The collateral amounts may exceed the related net amounts of financial assets and liabilities presented in the statement of assets and liabilities, If this is the case, the total amount reported is limited to the net amounts of financial assets and liabilities with that counterparty.
The following table presents the potential effect of offsetting of netting arrangements for liability derivative contracts presented in the statement of assets and liabilities:
(in thousands)Description
Gross amounts of recognised
liabilities US$
Gross amounts offset in the
statement of assets and
liabilitiesUS$
Gross amounts of recognised
liabilitiesUS$
31 December 2020Gross amounts not offset in the
statement of assets and liabilities
Net amountUS$
Financial instruments(a)
US$
Cash collateral received (b)
pledged US$
Equity swapsCowen Financial Products, LLC 296 – 296 (296) – –UBS AG 61 – 61 (61) – –Bank of America Merrill Lynch 284 – 284 (33) – 251
641 – 641 (390) – 251
(in thousands)Description
Gross amounts of recognised
liabilities US$
Gross amounts offset in the
statement of assets and
liabilitiesUS$
Gross amounts of recognised
liabilitiesUS$
31 December 2019Gross amounts not offset in the
statement of assets and liabilities
Net amountUS$
Financial instruments
US$
Cash collateral pledged
US$
Equity swapsCowen Financial Products, LLC – – – – – –
– – – – – –
(a) Amounts related to master netting agreements (e.g. ISDA), determined by the Company to be legally enforceable in the event of default and if certain other criteria are met in accordance with applicable offsetting accounting guidance but were not offset due to management’s accounting policy election.
(b) Amounts related to master netting agreements and collateral agreements determined by the Company to be legally enforceable in the event of default, but certain other criteria are not met in accordance with applicable offsetting accounting guidance. The collateral amounts may exceed the related net amounts of financial assets and liabilities presented in the statement of assets and liabilities, If this is the case, the total amount reported is limited to the net amounts of financial assets and liabilities with that counterparty.
Notes to the financial statements (continued)
80 RTW Venture Fund Limited Annual Report and accounts 2020 81RTW Venture Fund Limited
Annual Report and accounts 2020
Governance
Strategic reportFinancial statem
ents

7. Securities sold shortThe Company is subject to certain inherent risks arising from its investing activities of selling securities short. The ultimate cost to the Company to acquire these securities may exceed the liability reflected in these financial statements.
8. Risk factorsSome underlying investments may be deemed to be a highly speculative investment and are not intended as a complete investment program. The Company is designed only for sophisticated persons who are able to bear the economic risk of the loss of their entire investment in the Company and who have a limited need for liquidity in their investment. The following risks should be carefully evaluated before making an investment in the Company:
Market riskCertain events particular to each market in which Portfolio Companies conduct operations, as well as general economic and political conditions, may have a significant negative impact on the operations and profitability of the Company’s investments and/or on the fair value of the Company’s investments. Such events are beyond the Company’s control, and the likelihood they may occur and the effect on the Company cannot be predicted. The Company intends to mitigate market risk generally by investing in LifeSci Companies in various geographies.
Portfolio Company products are subject to regulatory approvals and actions with new drugs, medical devices and procedures being subject to extensive regulatory scrutiny before approval, and approvals can be revoked.
The market value of the Company’s holdings in public Portfolio Companies could be affected by a number of factors, including, but not limited to; a change in sentiment in the market regarding the public Portfolio Companies, the market’s appetite for specific asset classes, and the financial or operational performance of the public Portfolio Companies.
The size of investments in public Portfolio Companies or involvement in management may trigger restrictions on buying or selling securities. Laws and regulations relating to takeovers and inside information may restrict the ability of the Company to carry out transactions, or there may be delays or disclosure requirements before transactions can be completed.
Equity prices and returns from investing in equity markets are sensitive to various factors, including but not limited to; expectations of future dividends and profits, economic growth, exchange rates, interest rates, and inflation.
Biotech/healthcare companiesThe Portfolio Companies are biotechnology companies. Biotech companies are generally subject to greater governmental regulation than other industries at both the state and federal levels. Changes in governmental policies may have a material effect on the demand for or costs of certain products and services.
Any failure by a Portfolio Company to develop new technologies or to accurately evaluate the technical or commercial prospects of new technologies could result in it failing to achieve a growth in value and this could have a material adverse effect on the Company’s financial condition.
Portfolio Companies may not successfully translate promising scientific theory into a commercially viable business opportunity. Further, the Companies’ therapies in development may fail clinical trials and therefore no longer be viable.
Portfolio Company products are subject to intense competition and there are many factors that will affect whether the new therapies released by the Portfolio Companies gain market share against competitors and existing therapies.
Portfolio Companies may be newer small and mid-size LifeSci Companies. These companies may be more volatile and have less experience and fewer resources than more established companies.
Concentration riskThe Company may not make an investment or a series of investments in a Portfolio Company that result in the Company’s aggregate investment in such Portfolio Company exceeding 15 per cent. of the Company’s gross assets, save for Rocket for which the limit will be 30 per cent. as stated in the Company’s prospectus. Each of these investment restrictions will be calculated as at the time of investment. As such, it is possible that the Company’s portfolio may be concentrated at any given point in time, potentially with more than 15 per cent. of gross assets held in one Portfolio Company as Portfolio Companies increase or decrease in value following such initial investment. The Company’s portfolio of investments may also lack diversification among LifeSci Companies and related investments.
Concentration of credit riskIn the normal course of business, the Company maintains its cash balances in financial institutions, which at times may exceed US federal or UK insured limits, as applicable. The Company is subject to credit risk to the extent any financial institution with which it conducts business is unable to fulfil contractual obligations on its behalf. Management monitors the financial condition of such financial institutions and does not anticipate any losses from these counterparties.
Counterparty riskThe Company invests in equity swaps and takes the risk of non-performance by the other party to the contract. This risk may include credit risk of the counterparty, the risk of settlement default, and generally, the risk of the inability of counterparties to perform with respect to transactions, whether due to insolvency, bankruptcy or other causes.
In an effort to mitigate such risks, the Company will attempt to limit its transactions to counterparties which are established, well capitalised and creditworthy.
Liquidity riskDerivative transactions may not be liquid in all circumstances, such that in volatile markets it may not be possible to close out a position without incurring a loss. The illiquidity of the derivatives markets may be due to various factors, including congestion, disorderly markets, limitations on deliverable supplies, the participation of speculators, government regulation and intervention, and technical and operational or system failures.
Foreign exchange riskThe Company will make investments in various jurisdictions in a number of currencies and will be exposed to the risk of currency fluctuations that may materially adversely affect, amongst other things, the value of the Portfolio Company or the Company’s investment in such Portfolio Company, or any distributions received from the Portfolio Company. Under its investment policy, the Company does not intend to enter into any securities or financially engineered products designed to hedge portfolio exposure or mitigate portfolio risk as a core part of its investment strategy.
9. Share CapitalPre re-domiciliationPrior to re-domiciliation into Guernsey on 2 October 2019, while still a limited liability company, the minimum capital contribution by an investor in the Company was $100,000, although RTW Fund Group GP, LLC as Managing Member could have, in its sole discretion, accepted smaller capital contributions with respect to any non-managing member. Prior to July 2019, the minimum capital contribution by an investor was $1 million. Voluntary withdrawals from Non-Managing Members were not permitted, unless the Managing Member was able to facilitate a transfer to a third party investor, another existing Non-Managing Member, or the Managing Member itself or any of its affiliates.
The initial closing for the sale of membership interests in the Company occurred on or about 17 February 2017. RTW Fund Group GP, LLC as Managing Member extended the offering period and held one or more subsequent closings until the final closing on 1 September 2019.
Post re-domiciliationUpon re-domiciliation, the Company had 147,144,094 Ordinary Shares in issue. On 30 October 2019, the Company also issued 14,400,601 Ordinary Shares in connection with the IPO. During the year ended 31 December 2020 the Company has issued a further 29,971,040 Ordinary Shares in subsequent offerings. This can be illustrated as follows:
2020 2019
Number of Ordinary Shares Number of Ordinary Shares
As at 1 January / 2 October 161,544,695 147,144,094Issuance of Ordinary Shares 29,971,040 14,400,601As at 31 December 191,515,735 161,544,695
Ordinary Shares carry the right to receive all income of the Company attributable to the Ordinary Shares and to participate in any distribution of such income made by the Company. Such income shall be divided pari passu among the holders of Ordinary Shares in proportion to the number of Ordinary Shares held by them.
Ordinary Shares shall carry the right to receive notice of and attend and vote at any general meeting of the Company, and at any such meeting on a show of hands, every holder of Ordinary Shares present in person (includes present by attorney or by proxy or, in the case of a corporate member, by duly authorised corporate representative) and entitled to vote shall have one vote, and on a poll, subject to any special voting powers or restrictions, every holder of Ordinary Shares present in person or by proxy shall be entitled to one vote for each Ordinary Share, or fraction of an Ordinary Share, held.
The Performance Allocation Amount will be allocated to the Performance Allocation Share Class Fund. All Performance Allocation Shares are held by RTW Venture Performance, LLC. As at 31 December 2020, there is one Performance Allocation Shares in issue (31 December 2019: one).
Performance Allocation Shares shall carry the right to receive, and participate in, any dividends or other distributions of the Company available for dividend or distribution. Performance Allocation Shares shall not be entitled to receive notice of, to attend or to vote at general meetings of the Company.
Management Shares shall not be entitled to receive, and participate in, any dividends or other distributions of the Company available for dividend or distribution. Management Shares shall be entitled to receive notice of, to attend or to vote at general meetings of the Company. Upon admission the Management shares of the Company were compulsorily redeemed by the Directors for nil consideration.
For all share classes, subject to compliance with the solvency test set out in the Companies Law, the Board may declare and pay such annual or interim dividends and distributions as appear to be justified by the position of the Company. The Board may, in relation to any dividend or distribution, direct that the dividend or distribution shall be satisfied wholly or partly by the distribution of assets, and in particular of paid up shares or reserves of any nature as approved by the Company.
Notes to the financial statements (continued)
82 RTW Venture Fund Limited Annual Report and accounts 2020 83RTW Venture Fund Limited
Annual Report and accounts 2020
Governance
Strategic reportFinancial statem
ents

10. Related party transactionsThe Company considers the Investment Manager, its principal owners, members of management, and members of their immediate families, as well as entities under common control, to be related parties. Amounts due from and due to related parties are generally settled in the normal course of business without formal payment terms.
Management FeePrior to 1 August 2019, the Investment Manager was entitled to receive from the Company a quarterly management fee, in advance, as of the beginning of each quarter in an amount equal to 0.5% (2.0% per annum) of each non-managing member’s capital account. For the period from 1 January 2019 through 1 October 2019 the investors were not subject to Management Fees under side letter agreements.
In preparation for the IPO, effective from 1 August 2019, no management or performance fees were charged until after the IPO.
Following the IPO, effective 30 October 2019, the Investment Manager receives a monthly management fee, in advance, as of the beginning of each month in an amount equal to 0.104% (1.25% per annum) of the net assets of the Company (the “Management Fee”). For purposes of determining the Management Fee, private investments will be valued at the fair value. The Management Fee will be prorated for any period that is less than a full month. The Investment Management Fees charged for the year amounted to US$2,912,850 (2019: US$386,611) of which US$nil (2019: US$198,794) was outstanding at the year end, included within accrued expenses.
Performance AllocationFollowing the IPO, the Articles provide that in respect of each Performance Allocation Period, the Performance Allocation Amount shall be allocated to the Performance Allocation Share Class Fund, subject to the satisfaction of a hurdle condition.
The Performance Allocation Amount relating to the Performance Allocation Period shall be an amount equal to:
((A-B) x C) x 20 per cent.
where:
A is the Adjusted Net Asset Value per Ordinary Share on the Calculation Date, adjusted by:
adding back (i) the total net Distributions (if any) per Ordinary Share (whether paid, or declared but not yet paid) during the Performance Allocation Period; and (ii) any accrual for the Performance Allocation for the current Performance Allocation Period reflected in the Net Asset Value per Ordinary Share; and deducting any accretion in the Net Asset Value per Ordinary Share resulting from either the issuance of Ordinary Shares at a premium or the repurchase or redemption of Ordinary Shares at a discount during the Performance Allocation Period;
B is the Adjusted Net Asset Value per Ordinary Share at the start of the Performance Allocation Period; and
C is the time weighted average number of Ordinary Shares in issue during the Performance Allocation Period.
The Hurdle Amount shall represent an 8 per cent. annualised compounded rate of return in respect of the Adjusted Net Asset Value per Ordinary Share from the start of the initial Performance Allocation Period through the then current Performance Allocation Period.
The Performance Allocation Share Class Fund can elect to receive the Performance Allocation Amount in Ordinary Shares; cash; or a mixture of the two, subject to a minimum 50% as Ordinary Shares. During the year, the Performance Allocation Share Class Fund entered into an agreement dated 21 April 2020 and subsequent to the year end on 20 January 2021, pursuant to which the Performance Allocation Share Class Fund agreed to defer distributions of the Company’s Ordinary Shares that would otherwise be distributed to RTW Venture Performance LLC (the Performance Allocation Share Class Fund) no later than 30 business days after the publication of the Company’s audited annual financial statements. Under that letter agreement, such Ordinary Shares shall be distributed to the Performance Allocation Share Class Fund at such time or times as determined by the Board of Directors of the Company.
The Company will increase or decrease the amount owed to the Performance Allocation Share Class Fund based on its investment exposure to the Company’s portfolio had such Performance Ordinary Shares been so issued. The Performance Allocation Amount for the year ended 31 December 2020 assumes that the residual, undistributed Performance Allocation Amount for the year ended 31 December 2019 of US$4,543,125 converted into 3,567,993 Notional Ordinary shares at the 31 December 2019 Ordinary NAV per shareof US$1.2733. These unissued and therefore Notional Ordinary Shares, subject to market risk alongside the Ordinary Shares, made a mark to market gain of US$2,448,357 as the Company’s NAV appreciated during the financial year and is incorporated into the value of the 31 December 2020 Performance Allocation balance of US$37,330,803.
Until the Company makes a distribution of Ordinary Shares to the Performance Allocation Share Class Fund, the Company will have an unsecured discretionary obligation to make such distribution at such time or times as the Board of Directors of the Company determines. The Company will increase or decrease the amount owed to the Performance Allocation Shares Class Fund based on its investment exposure to the Company’s portfolio had such Performance Ordinary Shares been so issued. RTW Venture Performance, LLC has agreed to the deferral of the distributions of the Company’s Ordinary Shares in connection with its own tax planning. The Company does not believe that the deferral of such distributions to the Performance Allocation Share Class Fund will have any negative effects on holders of the Company’s Ordinary Shares.
The Investment Manager is a member of the Performance Allocation Share Class Fund, and will therefore receive a proportion of the Performance Allocation Amount. In April 2020, the Board approved the distribution of US$4.1 million to the Performance Allocation Share Class Fund (2019: US$nil). At the year end the Performance Allocation was US$37.3 million (31 December 2019: US$8.7 million).
Non-Managing Members that made a capital contribution prior to 1 September 2019 are deemed founding members and are entitled to a one-time rebate of 50% of any Performance Allocation paid to the Performance Allocation Share Class Fund until they achieve a 25% net return on their initial investment. In May 2020, the one-time rebate was paid to the founding members and this rebate has now been discharged in full.
The Investment Manager is also refunded any research costs incurred on behalf of the Company.
One of the directors of the Company, Stephanie Sirota, is also a partner and the Chief Business Officer of the Investment Manager. During the year ended 31 December 2020, two partners and one other employee of the Investment Manager served on the board of directors of both Rocket and HSAC 2 Holdings II, one partner and one employee serves on the board of Ji Xing and one partner served on the board of directors of Avidity, Landos and NiKang, investments of the Company. As of 31 December 2020, the fair value of such investments held by the Company was US$169.4 million (2019: US$70.3 million), US$0.5 million (2019: US$nil), US$16.2 million (2019: US$5.0 million), US$4.3 million (2019: US$5.1 million), US$5.4 million (2019: US$nil) and US$2.7 million (2019: US$nil) in Rocket, HSAC 2 Holdings II, Avidity, Landos, Ji Xing and NiKang, respectively.
While still a limited liability company, the Company had a series of private funding rounds and made investments in six portfolio companies (“Seed Assets”). Prior to re-domiciliation the NAV of the Company was US$147.1 million of which US$56.2 million represented the Seed Assets. The valuations of the Seed Assets were performed in line with the Company’s valuation policies. Upon re-domiciliation the members’ interests were converted into 147,144,094 Ordinary Shares, one Management Share and one Performance Allocation Share. The Management Share was redeemed upon initial admission to trading on the SFS. An Independent Valuer was engaged to produce a valuation report on the Seed Assets and this report was approved following discussions in the pre-IPO Board Meeting of 27 September 2019.
On 1 August 2019, investors from RTW Special Purpose Fund I, LLC (“RTW Special Purpose Fund I”) who did not consent to the re-domiciliation of RTW Special Purpose Fund I from Delaware to Guernsey withdrew (in whole or in part) from RTW Special Purpose Fund I and accepted relevant distributions in consideration thereof, through the issuance of membership interests in RTW Special Purpose Fund II, LLC (“RTW Special Purpose Fund II”) to such investors equal to their respective pro rata, indirect, in-kind ownership stake in the assets, rights and liabilities in RTW Special Purpose Fund I. Such investors provided non-managing members’ representations and warranties in connection with their investment in RTW Special Purpose Fund I. As a result of such issuance, US$16,381,186 of securities in Rocket Pharmaceuticals, Inc. were transferred in-kind to RTW Special Purpose Fund II on 12 August 2019.
As at 31 December 2020, the number of Ordinary Shares held by each Director was as follows:
2020 2019
Number of Ordinary Shares
Number of Ordinary Shares
William Simpson 100,000 –Paul Le Page 103,000 –William Scott 100,000 50,000Stephanie Sirota 763,004 494,004
The directors added to their holdings during the year by purchasing shares in the Company’s share issuance programme at a premium to NAV. William Simpson has also acquired an additional 25,000 shares since 31 December 2020.
Roderick Wong is a major shareholder and also a member of the Investment Manager, at year end he held 27,286,368 (2019: 24,814,619) Ordinary Shares in the Company.
The total Directors’ fees expense for the year amounted to US$220,875 (2019: US$33,140) of which US$53,136 was outstanding at 31 December 2020 (2019: US$33,140), included within accrued expenses.
During the year ended 31 December 2020, the Company also invested in three RTW managed entities; HSAC 2 Holdings II, LLC, Ji Xing and RTW Royalty Holdings, LLC. As of 31 December 2020 the fair value of such investments held by the Company was US$0.5 million, US$5.4 million and US$8.2 million, respectively, and cost of such investments was US$0.5 million, US$5.3 million and US$8.2 million, respectively.
11. Administrative ServicesNAV Consulting, Inc. served as the Company’s administrator until the Company re-domiciled to Guernsey on 2 October 2019. Effective from this date, Ocorian Administration (Guernsey) Limited (“OAGL”) was appointed as Administrator to the Company taking over the administration, corporate secretarial, corporate governance and compliance services from NAV Consulting, Inc. On 1 February 2021, Elysium Fund Management Limited was appointed as Administrator taking over the administration, corporate secretarial, corporate governance and compliance services from OAGL. Further, from 1 February 2021 Morgan Stanley Fund Services USA LLC was appointed to serve as the Company’s Sub-Administrator.
During the year OAGL charged administration fees of US$233,459 of which US$51,947 was outstanding at year end, included within accrued expenses. During the period from 2 October 2019 to 31 December 2019, OAGL charged administration fees of US$58,381 of which US$29,439 was outstanding at 31 December 2019, and NAV consulting, Inc. charged administration fees of US$12,008 for the period from 1 January 2019 to 1 October 2019 none of which was outstanding at 31 December 2019.
Notes to the financial statements (continued)
84 RTW Venture Fund Limited Annual Report and accounts 2020 85RTW Venture Fund Limited
Annual Report and accounts 2020
Governance
Strategic reportFinancial statem
ents
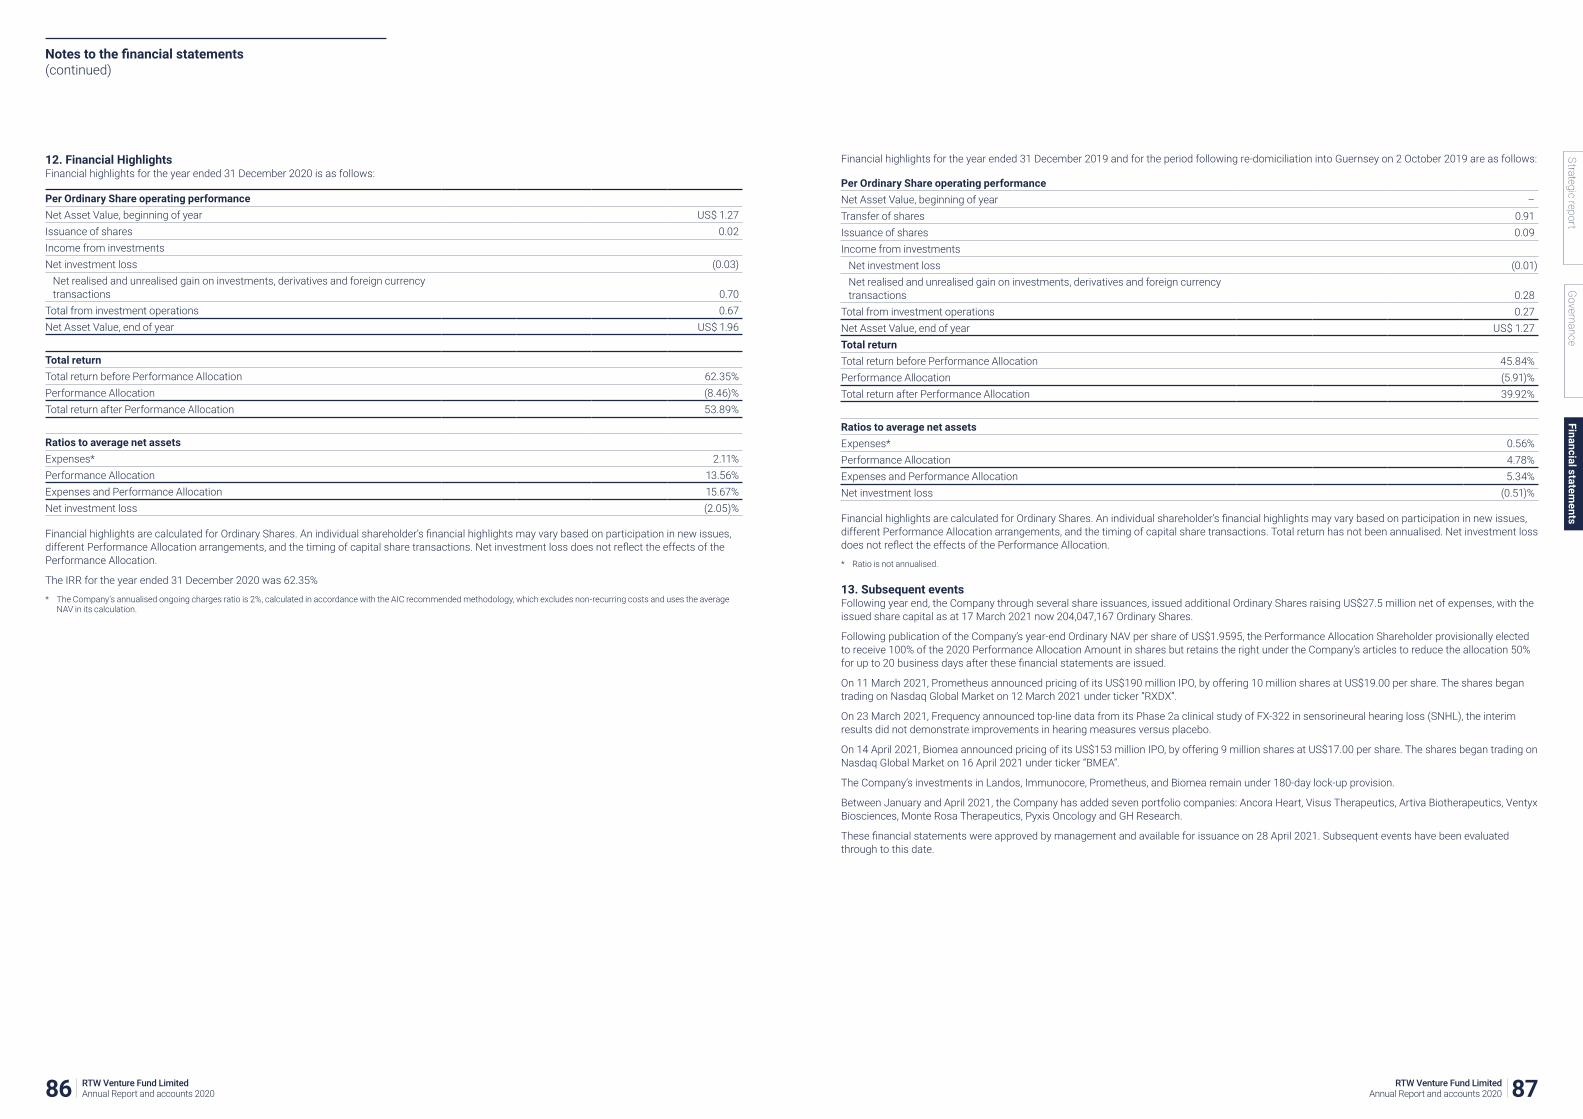
12. Financial HighlightsFinancial highlights for the year ended 31 December 2020 is as follows:
Per Ordinary Share operating performanceNet Asset Value, beginning of year US$ 1.27Issuance of shares 0.02Income from investmentsNet investment loss (0.03)
Net realised and unrealised gain on investments, derivatives and foreign currency transactions 0.70
Total from investment operations 0.67Net Asset Value, end of year US$ 1.96
Total returnTotal return before Performance Allocation 62.35%Performance Allocation (8.46)%Total return after Performance Allocation 53.89%
Ratios to average net assetsExpenses* 2.11%Performance Allocation 13.56%Expenses and Performance Allocation 15.67%Net investment loss (2.05)%
Financial highlights are calculated for Ordinary Shares. An individual shareholder’s financial highlights may vary based on participation in new issues, different Performance Allocation arrangements, and the timing of capital share transactions. Net investment loss does not reflect the effects of the Performance Allocation.
The IRR for the year ended 31 December 2020 was 62.35%
* The Company’s annualised ongoing charges ratio is 2%, calculated in accordance with the AIC recommended methodology, which excludes non-recurring costs and uses the average NAV in its calculation.
Financial highlights for the year ended 31 December 2019 and for the period following re-domiciliation into Guernsey on 2 October 2019 are as follows:
Per Ordinary Share operating performanceNet Asset Value, beginning of year –Transfer of shares 0.91Issuance of shares 0.09Income from investments
Net investment loss (0.01)Net realised and unrealised gain on investments, derivatives and foreign currency transactions 0.28
Total from investment operations 0.27Net Asset Value, end of year US$ 1.27Total returnTotal return before Performance Allocation 45.84%Performance Allocation (5.91)%Total return after Performance Allocation 39.92%
Ratios to average net assetsExpenses* 0.56%Performance Allocation 4.78%Expenses and Performance Allocation 5.34%Net investment loss (0.51)%
Financial highlights are calculated for Ordinary Shares. An individual shareholder’s financial highlights may vary based on participation in new issues, different Performance Allocation arrangements, and the timing of capital share transactions. Total return has not been annualised. Net investment loss does not reflect the effects of the Performance Allocation.
* Ratio is not annualised.
13. Subsequent eventsFollowing year end, the Company through several share issuances, issued additional Ordinary Shares raising US$27.5 million net of expenses, with the issued share capital as at 17 March 2021 now 204,047,167 Ordinary Shares.
Following publication of the Company’s year-end Ordinary NAV per share of US$1.9595, the Performance Allocation Shareholder provisionally elected to receive 100% of the 2020 Performance Allocation Amount in shares but retains the right under the Company’s articles to reduce the allocation 50% for up to 20 business days after these financial statements are issued.
On 11 March 2021, Prometheus announced pricing of its US$190 million IPO, by offering 10 million shares at US$19.00 per share. The shares began trading on Nasdaq Global Market on 12 March 2021 under ticker “RXDX”.
On 23 March 2021, Frequency announced top-line data from its Phase 2a clinical study of FX-322 in sensorineural hearing loss (SNHL), the interim results did not demonstrate improvements in hearing measures versus placebo.
On 14 April 2021, Biomea announced pricing of its US$153 million IPO, by offering 9 million shares at US$17.00 per share. The shares began trading on Nasdaq Global Market on 16 April 2021 under ticker “BMEA”.
The Company’s investments in Landos, Immunocore, Prometheus, and Biomea remain under 180-day lock-up provision.
Between January and April 2021, the Company has added seven portfolio companies: Ancora Heart, Visus Therapeutics, Artiva Biotherapeutics, Ventyx Biosciences, Monte Rosa Therapeutics, Pyxis Oncology and GH Research.
These financial statements were approved by management and available for issuance on 28 April 2021. Subsequent events have been evaluated through to this date.
Notes to the financial statements (continued)
86 RTW Venture Fund Limited Annual Report and accounts 2020 87RTW Venture Fund Limited
Annual Report and accounts 2020
Governance
Strategic reportFinancial statem
ents

Glossary
Defined Terms“Adjusted Net Asset Value” the NAV adjusted by deducting the unrealised gains and unrealised losses in respect of private Portfolio Companies;
“Administrator” means Elysium Fund Management Limited;
“AIC” the Association of Investment Companies;
“AIC Code” the AIC Code of Corporate Governance dated February 2019;
“AIFM” means Alternative Investment Fund Manager;
“AIFMD” the Alternative Investment Fund Managers Directive;
“Annual General Meeting” or “AGM” the annual general meeting of the shareholders of the Company;
“Annual Report” the Annual Report and Audited Financial Statements;
“Antibody” a large Y-shaped blood protein that can stick to the surface of a virus, bacteria, or receptor on a cell;
“Athira” Athira Pharma, Inc.;
“Antibody-Oligonucleotide Conjugates” or “AOC” molecules that combine structures of an antibody and an oligo;
“Autoimmune diseases” conditions, where the immune system mistakenly attacks a body tissue;
“Avidity” Avidity Biosciences, Inc.;
“Beta Bionics” Beta Bionics, Inc.;
“Biomea” Biomea Fusion, Inc.;
“BLA” or “Biological License Application” a request for permission to introduce, or deliver for introduction, a biologic product into interstate commerce;
“C4 Therapeutics” or “C4T” C4 Therapeutics, Inc.;
“Cardiac myosin” a target of the treatment development for a cardiovascular condition;
“Cardiovascular disease” conditions affecting heart and vascular system;
“CD18 protein” a protein that helps white blood cells adhere;
“Clinical stage” or “clinical trial” a therapy in development goes through a number of clinical trials to ensure its safety and efficacy. The trials in human subjects range from Phase 1 to Phase 3. All studies done prior to clinical testing in human subjects are considered preclinical;
“Cochlea” a spiral-shaped part of the inner ear;
“Companies Law” the Companies (Guernsey) Law, 2008 (as amended);
“Company” or “RTW Venture Fund Limited” RTW Venture Fund Limited is a company incorporated in and controlled from Guernsey as a close-ended Investment Company. The Company has an unlimited life and is registered with the GFSC as a Registered Closed-ended Collective Investment Scheme. The registered office of the Company is 1st Floor, Royal Chambers, St Julian’s Avenue, St Peter Port, Guernsey, GY1 3JX;
“Company’s Articles” means the Company’s Articles of Incorporation;
“Corporate Brokers” being Barclays and J.P. Morgan Cazenove;
“Crohn’s Disease” a condition, in which a part(s) of digestive tract is inflamed;
“Danon Disease” a rare genetic heart condition in children, predominantly boys;
“Directors” or “Board” the directors of the Company as at the date of this document and “Director” means any one of them;
“Dravet Syndrome” a type of rare paediatric epilepsy;
“DTR” Disclosure Guidance and Transparency Rules of the UK’s FCA;
“Emergency Use Authorization” or “EUA” an Emergency Use Authorization in the United States is an authorization granted by the Food and Drug Administration to allow the use of a drug prior to its approval;
“Encoded” Encoded Therapeutics, Inc.;
“EU” or “European Union” the European Union first established by the treaty made at Maastricht on 7 February 1992;
“Fanconi Anemia” a rare genetic blood condition in young children;
“FATCA” the Foreign Account Tax Compliance Act;
“FCA” the Financial Conduct Authority;
“FCA Rules” the rules or regulations issued or promulgated by the FCA from time to time and for the time being in force (as varied by any waiver or modification granted, or guidance given, by the FCA);
“FcRn” neonatal Fc receptor, a receptor facilitating IgG antibody recycling;
“FDA” the US Food and Drug Administration;
“FDA Breakthrough Device Designation” a process designed to facilitate the development and expedite the review of the device that provides a more effective treatment or diagnosis of life-threatening or irreversibly debilitating human disease or conditions;
“FDA Breakthrough Drug Designation” a process designed to expedite the development and review of drugs which may demonstrate substantial improvement over available therapy;
“FDA Fast Track designation” a process designed to facilitate the development and expedite the review of drugs to treat serious conditions and fill an unmet medical need;
“FRC” the Financial Reporting Council;
“Frequency” Frequency Therapeutics, Inc.;
“Gene therapy” a biotechnology that uses gene delivery systems to treat or prevent a disease;
“Genetic Medicine” an approach to treat or prevent a disease using gene therapy or RNA medicines;
“GFSC” the Guernsey Financial Services Commission;
“GFSC Code” the GFSC Finance Sector Code of Corporate Governance as amended February 2016;
“HCM” or “Hypertrophic cardiomyopathy” a cardiovascular disease characterized by an abnormally thick heart muscle;
“ImmTAC®” bi-specific biologic molecules designed to fight cancer or viral infections;
“Immunocore” Immunocore Limited;
“Independent Valuer” Alvarez & Marsal Valuation Services, LLC;
“Infantile Malignant Osteopetrosis” or “IMO” a rare genetic bone disease in young children, manifesting in an increased bone density;
“Interim Report” the Interim Financial Report;
“Investigational New Drug” or “IND” the FDA’s investigational New Drug program is the means by which a pharmaceutical company obtains permission to start human clinical trials;
“IPEV Guidelines” the International Private Equity and Venture Capital Valuation Guidelines;
“IPO” an initial public offering;
“IRR” internal rate of return;
“ISDA” International Swaps and Derivatives Association;
“iTeos” iTeos Therapeutics, Inc.;
“Ji Xing” Ji Xing Pharmaceuticals, formerly China New Co;
“Landos” Landos Biopharma, Inc.;
“Latest Practicable Date” 31 December 2020, being the latest practicable date for valuing an asset for inclusion in this report;
“Lentiviral vector or “LVV” based gene therapy – a type of viral vector used to deliver a gene;
“Leukocyte adhesion deficiency” or “LAD-I” a rare genetic disorder of immunodeficiency in young children;
“LifeSci Companies” companies operating in the life sciences, biopharmaceutical, or medical technology industries;
“Listing Rules” the listing rules made under section 73A of the Financial Services and Markets Act 2000 (as set out in the FCA Handbook), as amended;
“London Stock Exchange” London Stock Exchange plc;
“LSE” London Stock Exchange’s main market for listed securities;
“MAGE-A4” a protein expressed on certain types of tumours;
“Medtech” medical technology sector within healthcare;
“Menin” a target for the treatment development in oncology;
“Milestone” Milestone Pharmaceuticals, Inc.;
“MOC” Multiple on capital is the ratio of realised and unrealised gains divided by the acquisition cost of an investment;
“Multiple sclerosis” a condition, in which the immune system attacks the protective sheath (myelin) that covers nerve fibres and causes miscommunication between the brain and the body;
“Myotonic Dystrophy” a genetic condition that affects muscle function;
“NASDAQ Biotech” a stock market index made up of securities of NASDAQ-listed companies classified according to the Industry Classification Benchmark as either the Biotechnology or the Pharmaceutical industry;
“Net Asset Value” or “NAV” the value of the assets of the Company less its liabilities, calculated in accordance with the valuation guidelines laid down by the Board;
“NewCo” a new company;
“NiKang” Nikang Therapeutics, Inc;
“Non-core portfolio assets” investments made in public companies as a part of cash management strategy;
“Notional Ordinary Shares” Performance Allocation Shares, in which receipt of such shares has been deferred;
“Nuance” Nuance Pharma;
“Official List” the official list of the UK Listing Authority;
“Oligonucleotides” or “Oligos” a short DNA or RNA molecules that have a wide range of applications in genetic testing and research;
“Oncology” a therapeutic area focused on diagnosis, prevention and treatment of cancer;
“Ophthalmic conditions” conditions affecting the eye;
“Orchestra BioMed” or “Orchestra” Orchestra BioMed, Inc.:
“Ordinary Shares” the Ordinary Shares of the Company;
“Performance Allocation Amount” an allocation connected with the performance of the Company to be allocated to the Performance Allocation Share Class Fund in such amounts and as such times as shall be determined by the Board;
“Performance Allocation Period” the First Performance Allocation Period and/or a subsequent Performance Allocation Period, as the context so requires;
“Performance Allocation Share Class Fund” a class fund for the Performance Allocation Shares to which the Performance Allocation will be allocated;
“Performance Allocation Shares” performance allocation shares of no-par value in the capital of the Company;
“Performance allocation shareholder” the holder of Performance Allocation Shares;
“Pilot study” a small-scale study;
“POI Law” The Protection of Investors (Bailiwick of Guernsey) Law, 1987, as amended;
88 RTW Venture Fund Limited Annual Report and accounts 2020 89RTW Venture Fund Limited
Annual Report and accounts 2020
Governance
Strategic reportFinancial statem
ents

“Portfolio Companies” Private and public companies included into the portfolio;
“PRAME” a cancer-testis antigen (CTA) that is highly expressed in a broad range of solid and hematologic malignancies;
“PRIority Medicines” or “PRIME” to be accepted for PRIME, a medicine has to show its potential to benefit patients with unmet medical needs based on early clinical data;
“Prometheus” Prometheus Biosciences, Inc.;
“Prospectus” the prospectus of the Company, most recently updated on 14 October 2019 and available on the Company’s website (www.rtwfunds.com/venture-fund);
“Pulmonary conditions” pathologic conditions that affect lungs;
“Pulmonx” Pulmonx Corporation;
“Pyruvate Kinase Deficiency” or “PKD” a rare genetic disorder affecting red blood cells;
“Rare disease” a disease that affects a small percentage of the population;
“Registrar” Link Market Services (Guernsey) Limited;
“RNA medicines” a type of biotechnology that uses RNA to treat a disease;
“Rocket Pharmaceuticals” or “Rocket” Rocket Pharmaceuticals, Inc.;
“RTW RoyaltyCo” RTW Royalty Holding Company;
“Russell 2000 Biotech” a stock index of small cap biotechnology and pharmaceutical companies;
“SEC Rule 144” selling restricted and control securities;
“Seed Assets” the initial portfolio of the Company, consisting of: Beta Bionics, Frequency, Immunocore, Landos, Orchestra BioMed and Rocket;
“SFS” Specialist Fund Segment of the London Stock Exchange;
“Small molecule” a compound that can regulate a biologic activity;
“Sensorineural hearing loss” a type of hearing loss caused by damage to the inner ear;
“SPAC” Special Purpose Acquisition Company;
“Tachycardia” a heart rhythm disorder;
“Tarsus” Tarsus, Inc.;
“Tenaya” Tenaya Therapeutics. Inc.;
“TIGIT” a target for a checkpoint antibody development in immune-oncology;
“TL1A” a target for the treatment of inflammation associated with inflammatory bowel disease (IBD);
“Type 1 Diabetes” or “TD1” a type of insulin resistance;
“Total shareholder return” a measure of shareholders’ investment in a company with reference to movements in share price and dividends paid over time;
“UK” United Kingdom;
“UK Code” the UK Corporate Governance Code 2018 published by the Financial Reporting Council in July 2018;
“Ulcerative Colitis” an inflammatory bowel disease that causes sores in the digestive tract;
“US” the United States of America;
“US GAAP” US Generally Accepted Accounting Principles;
“Uveal melanoma” a type of eye cancer;
“WACC” weighted average cost of capital;
“XIRR” an internal rate of return calculated using irregular time intervals.
Alternative Performance Measures unaudited
APM Definition Purpose Calculation
Cash Cash held by the Company’s Bankers, Prime Broker and an ISDA counterparty.
A measure of the Company’s liquidity, working capital and investment level.
Cash and cash equivalents, Due from brokers less Due to brokers on the Statement of Assets & Liabilities.
NAV per Or-dinary share The Company's NAV divided by the num-ber of ordinary shares.
A measure of the value of one ordinary share.
The net assets attributable to ordinary shares on the statement of financial position (US$375.3m) divided by the number of ordinary shares in issue (191,515,735) as at the calculation date.
Price per share The Company’s closing share price on the London Stock Exchange for a specified date.
A measure of the supply and demand for the Company’s shares.
Extracted from the official list of the London Stock Exchange
NAV Growth The percentage increase(decrease) in the NAV per Ordinary share during the re-porting period.
A key measure of the success of the Investment Manager’s investment strategy.
The quotient of the NAV per share at the end of the period (US$1.96) and the NAV per share at the beginning of the period (US$1.27) minus one expressed as a percentage.
Share price growth/Total Shareholder Return
The percentage increase(decrease) in the price per share during the reporting period.
A measure of the return that could have been obtained by holding a share over the reporting period.
The quotient of the price per share at the end of the period (US$1.88) and the price per share at the beginning of the period (US$1.37) minus one expressed as a percent-age. The measure excludes transaction costs.
Share Price Premium (Discount) The amount by which the ordinary share price is higher/lower than the NAV per ordinary share, ex-pressed as a percentage of the NAV per ordinary share.
A key measure of supply and demand for the Company’s shares. A premium implies excess demand versus supply and vice versa.
The quotient of the price per share at the end of the period (US$1.88) and the NAV per share at the end of the period (US$1.96) minus one expressed as a percentage.
Ongoing charges ratio The recurring costs that the Company has incurred during the period excluding performance fees and one off legal and professional fees expressed as a percentage of the Company’s average NAV for the period.
A measure of the minimum gross profit that the Company needs to produce to make a positive return for shareholders.
Calculated in accordance with the AIC methodology detailed on the web link below.https://www.theaic.co.uk/sites/default/files/hidden-files/ AICOngoingChargesCalculationMay12.pdf
Ongoing Charges2020US$
Fees to Investment Manager 2,912,850Legal and professional fees 1,068,017Administration fees 233,459Director’s remuneration 220,875Audit fees 162,016Other ongoing expenses 509,890Total expenses 5,107,114Non-recurring expenses (18,331)Total ongoing expenses 5,088,776Average NAV 241,755,741Annualised Ongoing charges (using AIC methodology) 2.10 %
Glossary (continued)
90 RTW Venture Fund Limited Annual Report and accounts 2020 91RTW Venture Fund Limited
Annual Report and accounts 2020
Governance
Strategic reportFinancial statem
ents

The CompanyRTW Venture Fund Limited (the “Company”) is a company that was incorporated as a limited liability corporation in the State of Delaware, United States of America on 16 February 2017, with the name “RTW Special Purpose Fund I, LLC”, and re-domiciled into Guernsey under the Companies Law on 2 October 2019 with registration number 66847 on the Guernsey Register of Companies.
The Company is registered with the Guernsey Financial Services Commission (“GFSC”) as a Registered Closed-ended Collective Investment Scheme and is an investment company limited by shares. The registered office of the Company is 1st Floor, Royal Chambers, St Julian’s Avenue, St Peter Port, Guernsey, GY1 3JX.
On 30 October 2019, the issued Ordinary Shares of the Company were listed and admitted to trading on the Specialist Fund Segment of the Main Market of the London Stock Exchange. The ISIN of the Company’s ordinary shares is GG00BKTRRM22 and trades under the ticker symbol “RTW”.
Investment ObjectiveThe Company seeks to achieve positive absolute performance and superior long-term capital appreciation, with a focus on forming, building, and supporting world-class life sciences, biopharmaceutical and medical technology companies. It intends to create a diversified portfolio of investments across a range of businesses, each pursuing the development of superior pharmacological or medical therapeutic assets to enhance the quality of life for patients and/or extend life spans.
Investment PolicyThe Company will seek to achieve its investment objective by leveraging RTW Investments, LP’s (the “Investment Manager”) proprietary data-first approach to identify superior innovative life science, biotechnology and medical technology assets and businesses:
– across various geographies (primarily the US, Europe, and China);
– across various therapeutic categories and product types (including but not limited to genetic medicines, biologics, traditional modalities such as small molecule pharmaceuticals and antibodies, and medical devices); and
– in both a passive and active capacity and intends, from time to time, to take a controlling or majority position with active involvement in a Portfolio Company to assist and influence its management. In those situations, it is expected that the Investment Manager’s senior executives may serve in temporary executive capacities.
The Company will seek to use equity capital (from the net proceeds of any share issuance or, where appropriate, from the net proceeds of investment divestments or other related profits) to provide seed and additional growth capital to the existing Portfolio Companies and future private investments. To mitigate cash-drag, the uninvested portion will be invested across public stocks largely replicating the public stock portfolios of the Investment Manager’s existing US-based funds.
While the Company expects to make direct investments into Portfolio Companies, the Company may invest in Portfolio Companies indirectly through another company or one or more investment vehicles or other structures alongside other investors.
The Company may use derivatives to optimise the risk-reward of individual positions or the portfolio as a whole.
Report on remuneration and quantitative remuneration disclosureUnder the Alternative Investment Fund Managers Directive (‘AIFMD’), we are required to make disclosures relating to remuneration of staff working for the Investment Manager for the year to 31 December 2020.
Amount of remuneration paidThe Investment Manager paid the following remuneration to staff in respect of the financial year ending on 31 December 2020 in relation to work on the Company.
US$’000
Fixed remuneration 451Variable remuneration 962Total remuneration 1,413Number of beneficiaries 36
The amount of the aggregate remuneration paid (or to be paid) by the Investment Manager to its partners which has been attributed to the Company in respect of the financial year ending on 31 December 2020 was US$21.3 million. The amount of the total remuneration paid by the Investment Manager to members of its staff whose actions have a material impact on the risk profile of the Company which has been attributed to the Company in respect of financial year ending on 31 December 2020 was US$18.9 million.
LeverageThe Company may employ leverage and borrow cash, up to a maximum of 50 per cent of the NAV at the time of incurrence, in accordance with its stated investment policy. The use of borrowings and leverage has attendant risks and can, in certain circumstances, substantially increase the adverse impact to which the Company’s investment portfolio may be subject. For the purposes of this disclosure, leverage is any method by which the Company’s exposure is increased, whether through borrowing of cash or securities, or leverage embedded in foreign exchange forward contracts or by any other means. AIFMD requires that each leverage ratio be expressed as the ratio between a Company’s exposure and its net asset value, and prescribes two required methodologies, the gross methodology and the commitment methodology (as set out in AIFMD Level 2 Implementation Guidance), for calculating such exposure. Using the methodologies prescribed under AIFMD, the leverage of the Company is detailed in the table below:
Commitment leverage as at31 December
2020
Gross leverage as at 31 December
2020
Leverage ratio 102% 102%
Other risk disclosuresThe risk disclosures relating to risk framework and risk profile of the Company are set out in note 8 to the Financial Statements on pages 82 to 83 and the principal risks and uncertainties on page 41.
Pre-investment disclosuresAIFMD requires certain information to be made available to investors in an Alternative Investment Fund (‘AIF’) before they invest and requires that material changes to this information be disclosed in the Annual Report of the AIF. There have been no material changes (other than those reflected in these financial statements) to this information requiring disclosure.
AIFMD Disclosures unaudited Company information
RTW Venture Fund Limited (the “Company”) is a closed-ended fund listed on the Specialist Fund Segment of the London Stock Exchange. We invest and partner with innovative healthcare companies looking to bring novel and transformational therapies to patients.
Investing in pioneers
92 RTW Venture Fund Limited Annual Report and accounts 2020 93RTW Venture Fund Limited
Annual Report and accounts 2020
Governance
Strategic reportFinancial statem
ents
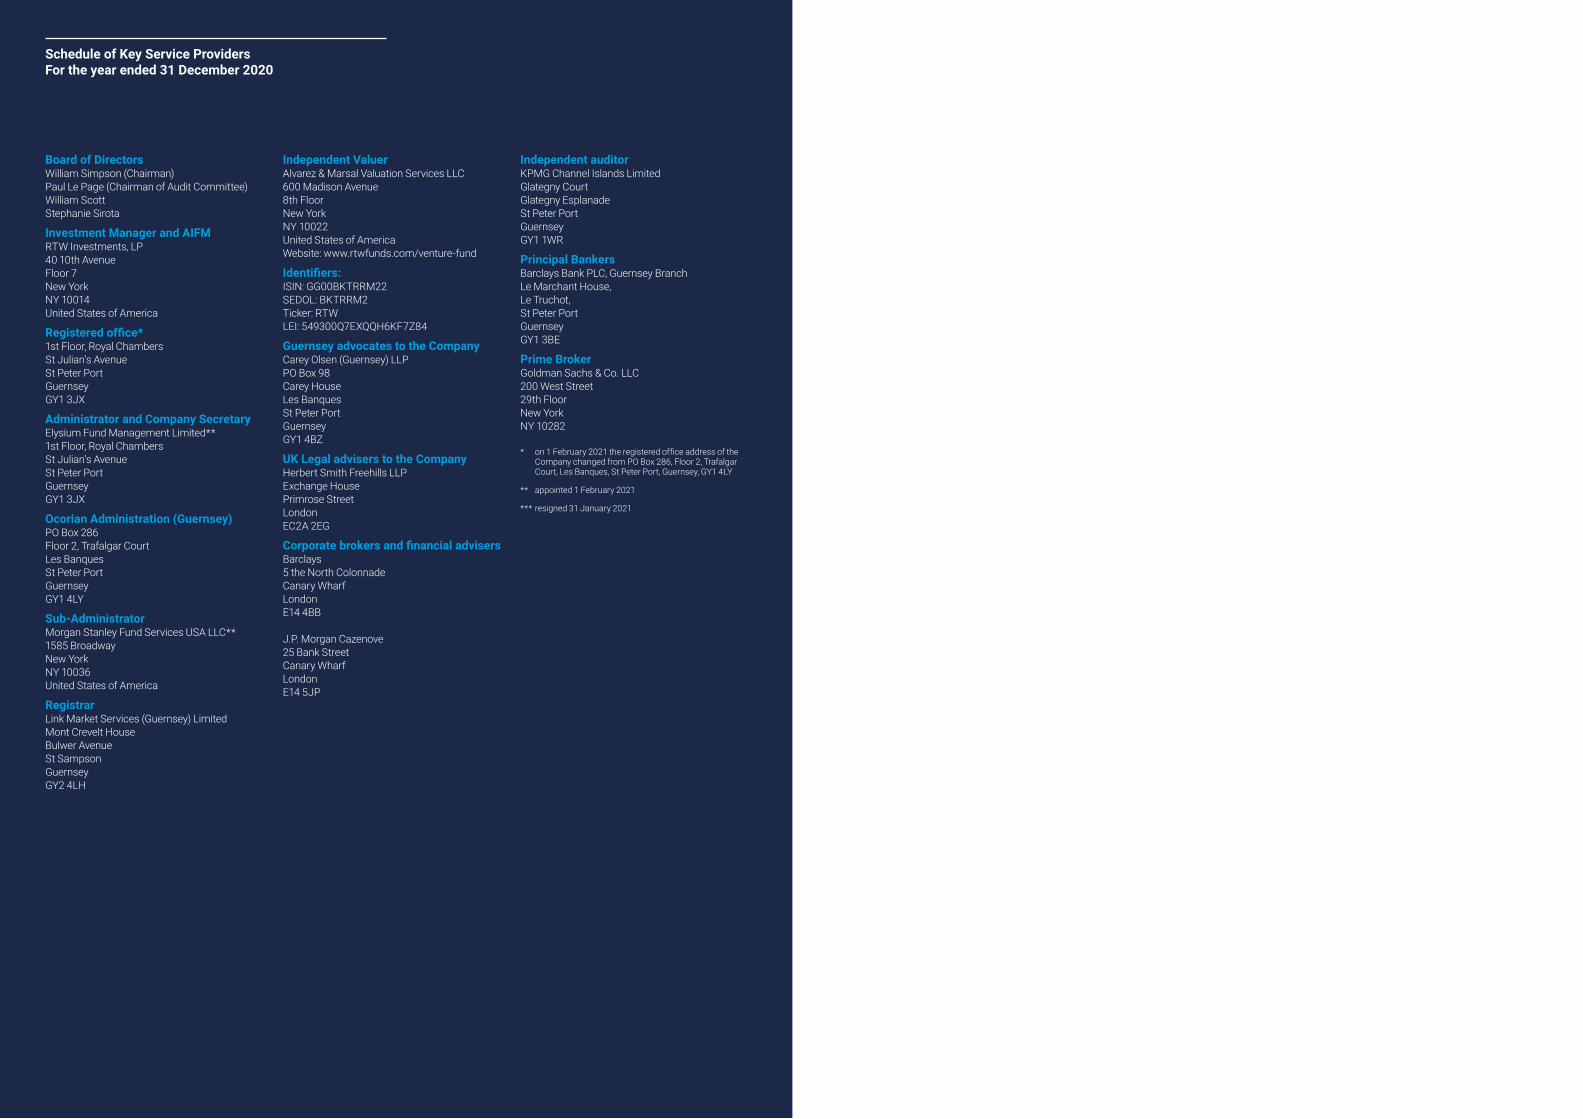
Board of DirectorsWilliam Simpson (Chairman)Paul Le Page (Chairman of Audit Committee)William Scott Stephanie Sirota
Investment Manager and AIFM RTW Investments, LP40 10th AvenueFloor 7New YorkNY 10014United States of America
Registered office* 1st Floor, Royal ChambersSt Julian’s Avenue St Peter PortGuernseyGY1 3JX
Administrator and Company Secretary Elysium Fund Management Limited**1st Floor, Royal ChambersSt Julian’s Avenue St Peter PortGuernseyGY1 3JX
Ocorian Administration (Guernsey) *** PO Box 286Floor 2, Trafalgar CourtLes BanquesSt Peter PortGuernseyGY1 4LY
Sub-AdministratorMorgan Stanley Fund Services USA LLC**1585 Broadway New YorkNY 10036United States of America
RegistrarLink Market Services (Guernsey) LimitedMont Crevelt House Bulwer AvenueSt SampsonGuernsey GY2 4LH
Independent ValuerAlvarez & Marsal Valuation Services LLC600 Madison Avenue8th FloorNew YorkNY 10022United States of AmericaWebsite: www.rtwfunds.com/venture-fund
Identifiers:ISIN: GG00BKTRRM22SEDOL: BKTRRM2Ticker: RTWLEI: 549300Q7EXQQH6KF7Z84
Guernsey advocates to the CompanyCarey Olsen (Guernsey) LLPPO Box 98Carey HouseLes BanquesSt Peter PortGuernseyGY1 4BZ
UK Legal advisers to the CompanyHerbert Smith Freehills LLPExchange HousePrimrose StreetLondon EC2A 2EG
Corporate brokers and financial advisersBarclays 5 the North ColonnadeCanary WharfLondonE14 4BB
J.P. Morgan Cazenove25 Bank StreetCanary WharfLondonE14 5JP
Independent auditorKPMG Channel Islands LimitedGlategny CourtGlategny EsplanadeSt Peter PortGuernseyGY1 1WR
Principal Bankers Barclays Bank PLC, Guernsey BranchLe Marchant House,Le Truchot, St Peter PortGuernsey GY1 3BE
Prime BrokerGoldman Sachs & Co. LLC200 West Street29th FloorNew YorkNY 10282
* on 1 February 2021 the registered office address of the Company changed from PO Box 286, Floor 2, Trafalgar Court, Les Banques, St Peter Port, Guernsey, GY1 4LY
** appointed 1 February 2021
*** resigned 31 January 2021
Schedule of Key Service Providers For the year ended 31 December 2020

RTW Venture Fund Limited Guernsey advocates to the Company Carey Olsen (Guernsey) LLP PO Box 98 Carey House Les Banques St Peter Port Guernsey GY1 4BZ
rtwfunds.com/venture-fund