innovation in railways: platform for maintenance … are constantly changing in collaboration with...
TRANSCRIPT

1JR EAST Technical Review-No.29
Special feature article
More than 10 years have passed since we entered the 21st century. Yet the nature of innovation in recent years as seen in services that have changed the world is clearly different from the “object-centered revolution” seen in the previous century.
Railways, automobiles and other modes of transport, and means of communication such as telephones were born out of the industrial revolution, which started in the 18th century. People’s lives became drastically more convenient into the 20th century due to many innovations such as home electronics, and productivity in industry also expanded.
Many companies in Japan also came out with high-quality, reasonably priced, competitive products, leading the world in their individual markets. This age can be called the age of industrialized society; in other words, it was an “age of innovation centering on objects”.
The innovative services that came out of the information revolution of the late 20th century have brought about major changes to people’s lives and to industry in recent years. But rather than being products centered on physical objects, those services are by intangible “structures and platforms using information and data”.
For example, the logistics revolution by Amazon, SNS such as Facebook, the various services available from smartphone apps, and more have greatly changed the world. But the core to services is the structures and platforms supporting them, rather than products made up of physical objects as in the 20th century. Moreover, the structures are constantly changing in collaboration with the users who enjoy those services, and the core of technologies supporting those structures is ICT, which came into being after the industrial revolution.
The differences in the 20th century business model and that of the 21st century are shown in Fig. 1 and 2. Those are demonstrated through the “products” that are the center of services and technologies supporting those along with their relation to users who are recipients of the services.
In the 20th century model, products that are the center of services are physical objects such as automobiles, telephones, and home electronics. The technologies supporting them are mainly internal combustion engines and electric power, which came out of the industrial revolution. Those products are mainly made by large corporations, and the relationship with users is one-way (company to user). It is common for those products to undergo model changes and improvements once every few years.
In contrast, “products” at the center 21st century innovation are not objects. Rather, they are structures (platforms), and the technologies supporting those include ICT and biotechnology, which came into being after the industrial revolution. The relationship with users is interactive (two-way), and users constantly play a role in increasing the value of “products” while using them. Typical examples include Amazon’s customer review
Atsushi Yokoyama
Innovation in Railways: Platform for Maintenance Innovation Using ICT
Technical Center, Research and Development Center of JR East Group
Innovation in the 21st Century1
and recommendation functions.Creating innovation in this age is not improvement of physical
objects by means such as making TV images clearer or improving the functionality of feature phones. It can be said to be providing new structure (platforms) for constantly raising service levels in collaboration with users.
Railways have long been called a mature industry. But by achieving 21st century innovation in terms of services for customers and technology supporting railway operations, it should be possible to accomplish things such as differentiation from other modes of transportation, improved safety, and great improvements to cost structure.
ICT-based Smart Maintenance Initiative2The Research and Development Center of JR East Group has proposed the Smart Maintenance Initiative as 21st century innovation in maintenance of railway equipment. The Smart Maintenance Initiative goes beyond the aspects of simply improving methods of repair work. It is a proposal for new structures and platforms in maintenance overall as mentioned in Chapter 1, and we pride ourselves in it being “21st century innovation” that continues to bring about effects while constantly evolving.
One-way
Users
Products
Technologies
20th century business model(Emphasis on supplying high value-added products from manufacturer)
Users select products provided
Automobiles
Electronic appliances
Telephones
Railways
Industrial inventionsSteam enginesInternal combustion engines Electrical power systems
Users as recipients of products
Structure by which revolutionary innovation is difficult
Value is in the product, and the company decides
that value.○ Large corporations are at the center,
producing products, and industry is formed.
○ Corporations decide product specs and the timing of spec updates done every few years.
○ Technologies are originally developed and closed.
Provide structure
Users
Products
Technologies
21st century business model (Emphasis on creating new value by interaction between users and manufacturer)
Amazon: Recommendation functioniPod, iTunes: iTunes store (music distribution system) Facebook(SNS: social networking service)KOMTRAX(Komatsu construction machinery monitoring system)
Scientific invention
Biotechnology, nanotechnology, IT
Users and corporation are joint producers of services obtained
from physical objects.
Providing new structures and platforms by open innovation
○ Users and corporation create together. ○ Creation by open innovation is possible.○ Innovation does not occur with
technologies being closed or by simply improving existing products.
Interactive
Fig. 1 20th Century Business Model
Fig. 2 21st Century Business Model

2 JR EAST Technical Review-No.29
Special feature article
With CBM, the cycle shown in Fig. 6 can be followed on a daily and dynamic basis. That cycle entails obtaining data, identifying the state of deterioration by data analysis, making decisions regarding time/method/location of repairs, conducting repairs, and confirming and evaluating the results of repairs. The more data is accumulated, the smarter the important decision-making process in maintenance is.
Justification for decision-making in TBM is prescribed by rules (internal regulations, etc.), so there is inevitably little awareness of reviewing on a daily basis. In fact, maintenance criteria for track maintenance have not changed in about 50 years.
The Research and Development Center of JR East Group is currently developing a device for measuring track irregularity with trains in operation. Tests runs using that device are underway on the Keihin-Tohoku Line.
Results have been very favorable, and we have been able to continuously perceive track irregularity as shown in Fig. 7 as well as predict future irregularity. We also have been able to accurately identify the results of repairs using tamping machines and the like, allowing judgment at the worksite on the appropriateness of repair methods, items requiring improvements, and more.
As we are now able to obtain such data on track irregularity, work is underway on developing a system for supporting decision-making in places such as the worksite. That system is shown
2.1 Details of the Smart Maintenance Initiative The Smart Maintenance Initiative is composed of four key parts (Fig. 3).
First is changing the basis of maintenance from Time Based Maintenance (TBM) to Condition Based Maintenance (CBM). This entails a major change in the philosophy of maintenance. By achieving the change, much more streamlined maintenance than now will be possible. The difference is explained as follows using an example of maintenance for tracks, a typical type of railway equipment.
As shown in Fig. 4, inspections in TBM up to now are conducted at regular cycles (once every three months for conventional line track) to obtain data on track irregularity. Decisions on whether or not to conduct repairs are made based on this data, and decision-making is done based on predetermined rules where repairs are conducted when set criteria (for example, 23 mm) are exceeded.
Such criteria are decided on based on maximum progression of irregularity taking into consideration the track irregularity (for example, 40 mm) at which derailment could occur from past data and the three-month inspection cycle. As derailment must not occur, repair criteria needs to be set with much leeway, taking into consideration maximum progression of irregularity under the assumption that inspections are performed in a set cycle.
Conversely, CBM is based on monitoring of large volumes of data obtained rather than performing inspections at set intervals. In the example of tracks, obtaining track displacement data from trains in operation would allow such displacement data to be obtained every day. Analyzing that data would allow us to identify the speed at which track deteriorates (i.e., the condition of the equipment) in units of 1 m. Decisions can thus be made on when to conduct repairs at the optimum timing while accurately predicting track irregularity by individual location, allowing very streamlined preventive maintenance.
Changing from TBM to CBM means a fundamental change in justification for decision-making for the priority matter in maintenance of “when to conduct what sort of repairs” (Fig. 5).
The effects of repairs will also greatly improve by being able to obtain track irregularity data on a daily basis.
Achieving CBM Introduction of asset management
Work support by AI Integrated database
TBM
Uniform rules basedon past data
Perceive change rate, emit alarm,and repair at optimal timingCBM
Preventive maintenancebased on real-time data
Limit
Time
Para
met
er
Change varies by individual location
600 m or greater radius and straight: 20 mm 200 m to 600 m radius: 25 mm Less than 200m radius: 20 mm
Manage by twist23 mm 25 mm 27 mm 30 mm23 mm 25 mm 27 mm 30 mm
23 mm (including amount of cant transition)
Gauge
Cross levelLongitudinalAlignment
Twist
Displacement type
Track class Firstclass
Secondclass
Thirdclass
Fourthclass
Trace results Obtain much data
Identify deterioration
Evaluate timing and method of repairs, inspection frequency, etc. from progression of deterioration, and reflect results in next cycle.
Repair “smartly”Present necessary information from results of past repairs.
Evaluate Accumulate
Repair Analyze
Makedecision
Make optimum decision based on analysis results.
Perceive changes and conductmaintenance at appropriate timing.
Predict deterioration from data, and propose changes and causes.
Display of track irregularity data
Select any location
Display temporalchange in track
irregularity progression
Deteriorationprogressesafter repair
Deterioration slowafter repair
Differences in progressionof track irregularity
with different repair methods
Repair by machine tamping
Repair by manual tamping
Repair
Repair
Current Future
Use of frequentlyobtained data
RegulationsEngineerInspection data
Carried out under uniform rules
· Special track inspection car run four times a year
· Material condition inspected visually
· Track irregularity and material condition data obtained frequently by trains in operation.
Jan. Jan.April July
Irreg
ular
ity
Decision-makingsupport systemEngineer
Frequentlyobtained data
Carried out using decision-making support system according to individual situations
April July
Irreg
ular
ity
Fig. 3 Smart Maintenance Initiative
Fig. 4 TBM and CBM in Example of Track Irregularity
Fig. 5 Justification for Decision-making in TBM and CBM
Fig. 6 Cycle of Maintenance Work
Fig. 7 Development of Train Track Facility Monitoring Equipment
3JR EAST Technical Review-No.29
Special feature article
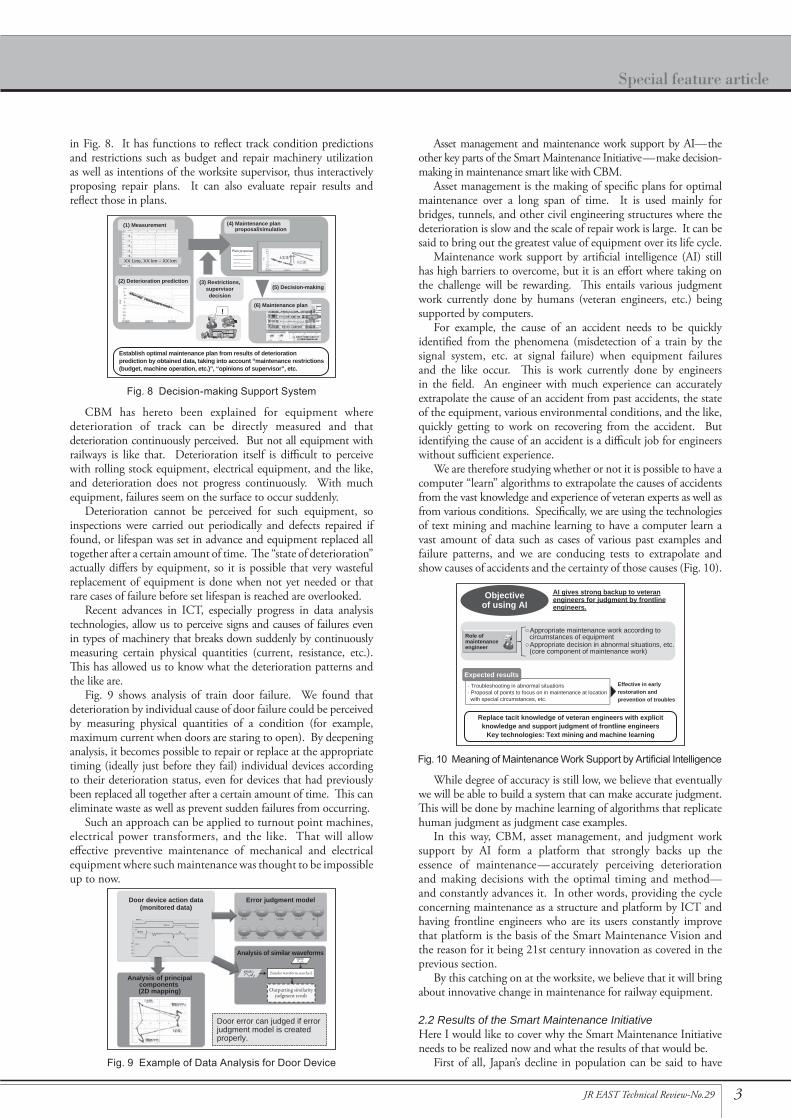
in Fig. 8. It has functions to reflect track condition predictions and restrictions such as budget and repair machinery utilization as well as intentions of the worksite supervisor, thus interactively proposing repair plans. It can also evaluate repair results and reflect those in plans.
CBM has hereto been explained for equipment where deterioration of track can be directly measured and that deterioration continuously perceived. But not all equipment with railways is like that. Deterioration itself is difficult to perceive with rolling stock equipment, electrical equipment, and the like, and deterioration does not progress continuously. With much equipment, failures seem on the surface to occur suddenly.
Deterioration cannot be perceived for such equipment, so inspections were carried out periodically and defects repaired if found, or lifespan was set in advance and equipment replaced all together after a certain amount of time. The “state of deterioration” actually differs by equipment, so it is possible that very wasteful replacement of equipment is done when not yet needed or that rare cases of failure before set lifespan is reached are overlooked.
Recent advances in ICT, especially progress in data analysis technologies, allow us to perceive signs and causes of failures even in types of machinery that breaks down suddenly by continuously measuring certain physical quantities (current, resistance, etc.). This has allowed us to know what the deterioration patterns and the like are.
Fig. 9 shows analysis of train door failure. We found that deterioration by individual cause of door failure could be perceived by measuring physical quantities of a condition (for example, maximum current when doors are staring to open). By deepening analysis, it becomes possible to repair or replace at the appropriate timing (ideally just before they fail) individual devices according to their deterioration status, even for devices that had previously been replaced all together after a certain amount of time. This can eliminate waste as well as prevent sudden failures from occurring.
Such an approach can be applied to turnout point machines, electrical power transformers, and the like. That will allow effective preventive maintenance of mechanical and electrical equipment where such maintenance was thought to be impossible up to now.
Asset management and maintenance work support by AI—the other key parts of the Smart Maintenance Initiative—make decision-making in maintenance smart like with CBM.
Asset management is the making of specific plans for optimal maintenance over a long span of time. It is used mainly for bridges, tunnels, and other civil engineering structures where the deterioration is slow and the scale of repair work is large. It can be said to bring out the greatest value of equipment over its life cycle.
Maintenance work support by artificial intelligence (AI) still has high barriers to overcome, but it is an effort where taking on the challenge will be rewarding. This entails various judgment work currently done by humans (veteran engineers, etc.) being supported by computers.
For example, the cause of an accident needs to be quickly identified from the phenomena (misdetection of a train by the signal system, etc. at signal failure) when equipment failures and the like occur. This is work currently done by engineers in the field. An engineer with much experience can accurately extrapolate the cause of an accident from past accidents, the state of the equipment, various environmental conditions, and the like, quickly getting to work on recovering from the accident. But identifying the cause of an accident is a difficult job for engineers without sufficient experience.
We are therefore studying whether or not it is possible to have a computer “learn” algorithms to extrapolate the causes of accidents from the vast knowledge and experience of veteran experts as well as from various conditions. Specifically, we are using the technologies of text mining and machine learning to have a computer learn a vast amount of data such as cases of various past examples and failure patterns, and we are conducing tests to extrapolate and show causes of accidents and the certainty of those causes (Fig. 10).
While degree of accuracy is still low, we believe that eventually we will be able to build a system that can make accurate judgment. This will be done by machine learning of algorithms that replicate human judgment as judgment case examples.
In this way, CBM, asset management, and judgment work support by AI form a platform that strongly backs up the essence of maintenance—accurately perceiving deterioration and making decisions with the optimal timing and method—and constantly advances it. In other words, providing the cycle concerning maintenance as a structure and platform by ICT and having frontline engineers who are its users constantly improve that platform is the basis of the Smart Maintenance Vision and the reason for it being 21st century innovation as covered in the previous section.
By this catching on at the worksite, we believe that it will bring about innovative change in maintenance for railway equipment.
2.2 Results of the Smart Maintenance InitiativeHere I would like to cover why the Smart Maintenance Initiative needs to be realized now and what the results of that would be.
First of all, Japan’s decline in population can be said to have
Establish optimal maintenance plan from results of deterioration prediction by obtained data, taking into account “maintenance restrictions (budget, machine operation, etc.)”, “opinions of supervisor”, etc.
(1) Measurement
(2) Deterioration prediction
(4) Maintenance plan proposal/simulation
XX Line, XX km – XX km
(5) Decision-making
Plan proposal
(3) Restrictions,supervisordecision
(6) Maintenance plan
· Troubleshooting in abnormal situations· Proposal of points to focus on in maintenance at location with special circumstances, etc.
AI gives strong backup to veteran engineers for judgment by frontline engineers.
Role of maintenance engineer
Objectiveof using AI
○Appropriate maintenance work according to circumstances of equipment○Appropriate decision in abnormal situations, etc. (core component of maintenance work)
Expected resultsEffective in early restoration and prevention of troubles
Replace tacit knowledge of veteran engineers with explicit knowledge and support judgment of frontline engineers
Key technologies: Text mining and machine learning
Fig. 8 Decision-making Support System
Outputting similarityjudgment result
Door error can judged if error judgment model is created properly.
Error judgment model
Analysis of similar waveforms
Door device action data(monitored data)
Analysis of principalcomponents (2D mapping)
[Similar waveform searcher]
Fig. 9 Example of Data Analysis for Door Device
Fig. 10 Meaning of Maintenance Work Support by Artificial Intelligence

4 JR EAST Technical Review-No.29
Special feature article
greatly affected the circumstances surrounding railway operations. Fig. 11 shows the change in Japan’s demographics along with the change in maintenance expenses for railway facilities at JR East since the breakup and privatization of Japanese National Railways.
Maintenance expenses make up just under a third of overall expenses of railway operation expenses. With future decrease in population, the number of passengers will probably decrease, naturally resulting in a decrease in railway revenues. That and the anticipated increase in personnel costs as a result of reduced workforce will necessitate a drastic overhaul of the cost structure. It is for that reason the Smart Maintenance Initiative must be achieved.
Population decrease is more rapid in provincial regions (Fig. 12). Taking that into account, how maintenance is performed must be greatly changed for equipment of JR East’s many regional local lines.
The maintenance expense reduction effects of the Smart Maintenance Initiative are difficult to accurately estimate, but decision-making becomes “smarter” as more data is accumulated. Due to that nature of the vision, the effects will continued into the future (become permanent) as shown in Fig. 13.
Moreover, the relationship between the level of maintenance for equipment and costs can be clearly visualized through the Smart Maintenance Initiative. This enables the major benefit of being able to make more precise management decisions such as what to do about expenses.
Moreover, the predicted continued advancement of ICT will allow data analysis that currently is difficult to do. The structure of the Smart Maintenance Initiative will be refined along with amassing of data, and expectations are thus high for decision-making to continue to become smarter.
Systems Supporting Future Railway Facilities3
JR East currently utilizes a variety of systems. Those systems were created separately, however, so there currently is no integrated database or common data strategy.
In order to realize the Smart Maintenance Vision, support the front lines of maintenance, and make accurate management decisions, a large volume of data upon which those efforts are based needs to be appropriately managed and operated. JR East as a whole thus needs to review its data strategy and create a data center and communications network to accumulate, integrate, and analyze data. We also need expert personnel who can handle that work (data scientists) and organizations with authority to do so.
Fig. 14 shows the construction of a large system (platform centering on databases) for integrating the separate internal systems, organically analyzing external data (weather information and SNS data) and the like, and allowing decision-making by the same database for everyone from front line organizations to management. This is still in the conception stage, but we feel that it will be effective for improving service to customers and achieving environmental management in addition to realizing the Smart System Initiative.
Conclusion4I believe that it is our duty to recognize the changes in the environment surrounding railways into the 21st century, such as the decline in population, progress of globalization, and rapid advancements in ICT. Moreover, we must further advance railways as a representative infrastructure supporting Japan.
For that reason, it is important to go beyond the boundaries of railway technologies and go steadily forward in R&D with open innovation as the key to that.
In conclusion, I would like to thank all those involved for their support and cooperation.
Improvement of servicequality and stability
Improve service qualityMaximize asset value at low cost
Now
Equipment enhancementand augmentation
(1) Population outlook and JR East Railway transport revenues
(2) JR East cost structure and maintenance expenses
JR East unit business expenses
Maintenance expenses
Makes up 1/4 to 1/3 of business expenses
Popu
latio
n (in
thou
sand
s)
Year
Am
ount
(100
mill
ion
yen)
Year
Approx. 440 billion yenApprox. 440 billion yen
▲ 50.00
▲ 45.00
▲ 40.00
▲ 35.00
▲ 30.00
▲ 25.00
▲ 20.00
▲ 15.00
▲ 10.00
▲ 5.00
0.00
0
5,000
10,000
15,000
20,000
25,000
30,000
2010 2015 2020 2025 2030 2035 2040
Three prefectures of northern Tohoku
Six prefectures of Tohoku
Greater Tokyo area
Rate of population decrease (Three prefectures of Northern Tohoku)
Rate of population decrease (Six prefectures of Tohoku)
Rate of population decrease (Greater Tokyo area)
Predicted change in working-agepopulation (15 to 65) by region
Fiscal year
Wor
king
-age
pop
ulat
ion
(in th
ousa
nds)
Rat
e of
pop
ulat
ion
decr
ease
(com
pare
d to
fisc
al 2
013)
Platform enabling support of the core competencesof maintenance with ICTSmart maintenance platform
Integrated database
Planning/judgment supportin maintenance work Dashboard for management
Ability to support various work
Platform can be built from existing dataService/bus traversing data of individual departments
Civil engineeringdata
Track data
Signal data
Power data
Rolling stock data
Operational data
Maintenance procedure data
Trouble data
External dataExisting internal data
Deepening of decision-making support system
Monitor deterioration of equipment Safety securedAble to identify signs of equipment failure Equipment failures caused by internal factors reduced
Repair
Inspection
Current Afterintroducing
CBM
Future
Cost effects
Safety
Stable transport
Optimization of maintenance (effects gradually exhibited)
○Image of change in total costs if same target levels as now
Decision-making in PDCA constantly improved
Effects gradually appear and continue
Decision-making becomes smarter
Investment costs and maintenance level can be visualized
Management decisions can be made in line with changes on business environment
Analyzedata
Makedecision
ObtaindataEvaluate
Do
Fig. 12 Regional Demographics
Fig. 13 Effects of Smart Maintenance
Fig. 14 Data Platform Concept
Fig. 11 Japan’s Population Demographics and Changes in Maintenance Expenses