innovation in london’s transport: big data for a better customer experience
TRANSCRIPT

Innovations in London’s transport:Big Data for a better customer experience
Lauren Sager WeinsteinHead of AnalyticsCustomer Experience, Transport for London
Innovations in London’s transport:Big Data for a better customer experience
Lauren Sager WeinsteinHead of AnalyticsCustomer Experience, Transport for London

Today’s presentation - agenda
1. About TfL
2. Our Big Data
3. Case studies on customer benefits
1. About TfL
2. Our Big Data
3. Case studies on customer benefits
2

About Transport for London
3
Integrated body created in 2000 responsible for the Capital's transport system
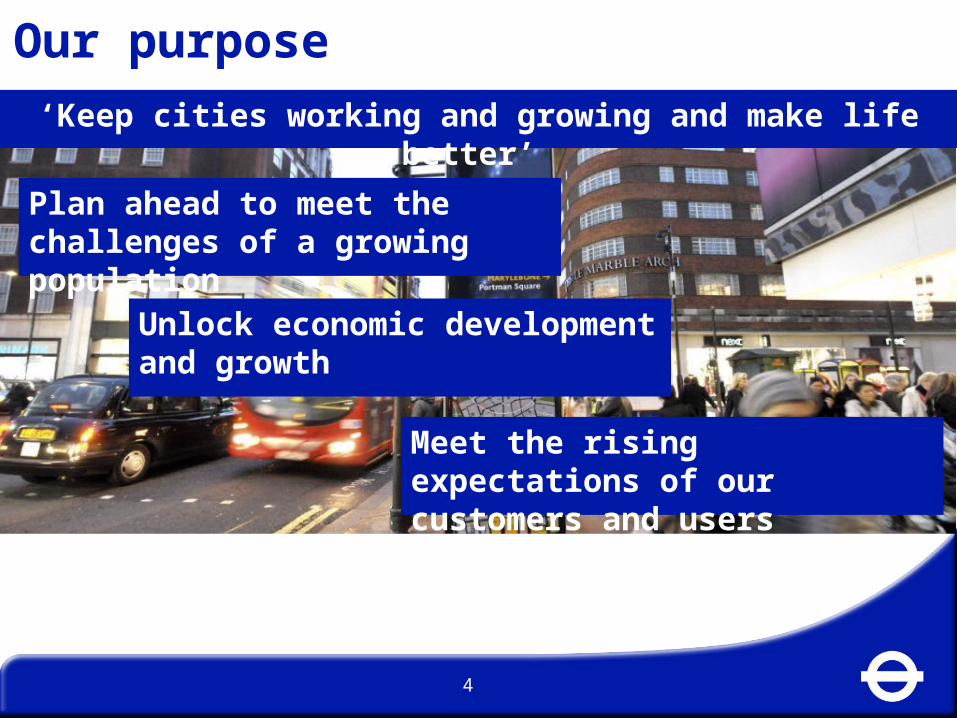
Our purpose
‘Keep cities working and growing and make life better’
Plan ahead to meet the challenges of a growing population
Unlock economic development and growth
Meet the rising expectations of our customers and users
4

5
Data is gold dust
• Open Data – Information that we make freely available to power travel information apps and other tools
• Big Data – The analysis of one or more large data sets to reveal patterns or trends and enable action to be taken
Data is at the centre of delivering better urban transport:
This presentation concentrates on ‘Big Data’

London’s Big Data
6
25 million London Underground
journeys a week
8.6 million people rising to 10 million
people by 2030
46 million bus journeys a week
London is ‘Big’, so our data is ‘Big’ too...

Sources of Big Data
7
Social media
Asset DataTraffic information
Bus location data
Oyster and contactless cards
BigData

Case Study: Tailored Customer Travel Info
Database holds more than 4 million email addressees
260 million emails sent in 2014
Message content is often tailored to customer journey patterns
Key sources: Oyster Contactless Congestion ChargeCycle HireRegistered cyclists
Integrated roads & public transport message reaches 2m customers every week
83% of customers rate the email service as useful or very useful
8

Case study: Planning the bus network
A customer taps an Oyster card on the reader, which records the location and time
Can we infer the exit point?
bus route of current journey
segment
Stop B
Stop A
Boarding Stop
Bus events are recorded in the iBus system and we can match this with our Oyster data
9

bus route of current journey
segment
bus route R
Station Y
Underground line
Stop X
Stop B
Stop A
Where is the next tap?
From the location of the next tap (if there is one), we can infer where a customer alights
If next trip begins at stop X, the current segment is inferred to end at stop A
If next trip begins at station Y, the current segment inferred to end at stop B
10

Big Data tools in action
11
Bus Trip Number - Route 468 (Load percentage)Stop Name 13 15 17 19 21 23 25 27 29 31 33 35 37 39
SWAN & SUGAR LOAF 3% 4% 3% 7% 2% 0% 9% 1% 3% 0% 9% 7% 4% 11%COOMBE ROAD 3% 4% 3% 7% 2% 0% 8% 0% 3% 0% 9% 6% 4% 11%
CROYDON FLYOVER 4% 7% 7% 8% 2% 3% 9% 2% 3% 1% 10% 13% 4% 16%CROYDON LIBRARY 9% 8% 12% 11% 8% 7% 15% 3% 10% 3% 10% 24% 12% 31%WHITGIFT CENTRE 9% 8% 12% 11% 7% 12% 20% 9% 11% 3% 10% 30% 24% 37%
DELTA POINT 8% 10% 15% 16% 11% 15% 21% 11% 11% 10% 7% 35% 25% 48%BEDFORD HALL 8% 11% 16% 16% 13% 15% 22% 12% 13% 13% 7% 35% 29% 53%
HOGARTH CRESCENT 8% 12% 18% 16% 15% 15% 22% 12% 14% 17% 7% 38% 30% 62%DEVONSHIRE ROAD 12% 13% 18% 20% 16% 16% 28% 19% 15% 22% 9% 49% 35% 69%
THE CRESCENT 15% 15% 20% 20% 16% 18% 28% 20% 15% 28% 8% 49% 35% 70%PAWSONS ROAD 15% 18% 21% 24% 21% 19% 33% 26% 17% 35% 10% 55% 36% 74%
TALBOT ROAD 16% 19% 25% 28% 28% 30% 38% 28% 24% 47% 11% 63% 38% 80%CLIFTON ROAD 19% 19% 27% 30% 28% 31% 38% 29% 25% 52% 11% 65% 39% 80%
PARK ROAD / SELHURST PARK STADIUM 19% 20% 28% 31% 30% 34% 38% 35% 25% 56% 12% 66% 40% 79%WHITWORTH ROAD 21% 21% 30% 36% 31% 36% 40% 37% 28% 62% 13% 66% 40% 79%
HOWDEN ROAD 21% 24% 29% 40% 31% 37% 43% 37% 30% 9% 61% 65% 44% 78%WHARNCLIFFE GARDENS 22% 25% 30% 42% 31% 38% 44% 38% 30% 10% 61% 65% 46% 76%
GRANGE AVENUE 22% 25% 30% 43% 31% 39% 44% 38% 30% 10% 61% 65% 46% 75%SOUTH NORWOOD HILL / ALL SAINTS CHURCH 24% 26% 33% 46% 33% 40% 47% 40% 30% 15% 61% 66% 49% 76%
UPPER BEULAH HILL 21% 26% 36% 46% 33% 43% 49% 43% 30% 17% 60% 66% 53% 76%BEULAH SPA 24% 28% 39% 62% 34% 52% 52% 45% 29% 25% 60% 70% 55% 81%
HERMITAGE ROAD 24% 28% 40% 65% 35% 52% 54% 45% 29% 29% 58% 69% 57% 80%CONVENT HILL 25% 29% 44% 70% 36% 53% 54% 46% 29% 30% 58% 67% 58% 80%
BIGGIN HILL 26% 33% 44% 71% 37% 54% 54% 51% 29% 30% 58% 64% 55% 80%
Monitor congestion and change bus services where needed

Case Study: Major bridge closure
• Summer 2014: Wandsworth Borough Council had to close Putney Bridge for emergency repair work.
• Bus services had to stop either side of bridge. People could walk or cycle across.
• We used Oyster taps and iBus location data to predict how many bus passengers affected
12

• Approx 40,000 unique Oyster made 111,000 bus journeys a week that crossed the bridge
• Roughly half of these journeys started or ended very close to the bridge, so no bus transfer necessary.
• 56,000 journeys crossed the bridge in the middle of a trip. These would require two bus trips, one either side of the bridge
• Result: arranged to offer transfer facilities so that customers would not be charged twice
• Sent targeted emails to provide customers with information about alternative routes to minimise the impact
Analytics in Action – Putney Bridge
13

Case Study: Automated fare refunds
Revenue collection Operational issues or customer mistakes
Pattern matchingAutomated refunds
14
Sometimes things go wrong and we refund fares

Case Study: Customer Segmentation at Stations
36%
30%
18%
16%
B aker S treet - C lus ter S izes
1
2
3
4
15
Cluster Description Median Start Time
Journeys / travelled
day
Ratio unique stations / days
travelled
# of Regular
Days
# of Irregular
Days
Cluster Sample Size
1Regular Frequent
User08:11 2.5 0.7 11.6 4.6 36%
2Occasional User
(Resident)12:53 1.9 1.3 2.5 3.6 30%
3Irregular Frequent
User11:50 2.6 0.9 4.1 12.1 18%
4Occasional User
(Visitor)11:01 3.4 3.1 1.9 2.0 16%
Understanding who is using our stations helps us plan ticket facilities, signage and commercial offering

Case Study: Influencing travel demand
Whiteboard posterLeaflet Email
Leytonstone – to be played from 0800 – 0830
“TfL is investing to improve the capacity and frequency of Tube services but we know that at certain times and places the network can be very busy.
The busiest time here is between 08:15 and 08:30. If you are able to travel outside this time you could have a more comfortable journey.”
Announcement
16
Analysis of travel patterns helps customers with flexibility

Bethnal Green Results
Target Time Period
Pro
por
tion
of d
em
and
bet
wee
n 7
am
and
10a
m in
eac
h pe
riod
Pro
port
ion
of
dem
an
d b
etw
een
7am
an
d 1
0am
The results suggests change in passenger behaviour:
• Demand distribution over the peak period consistent between pre trial and September periods
• Approximate 5% shift in demand during target time period of 08:15 to 08:45.
• Total Peak Demand over the trial period relatively unchanged
17
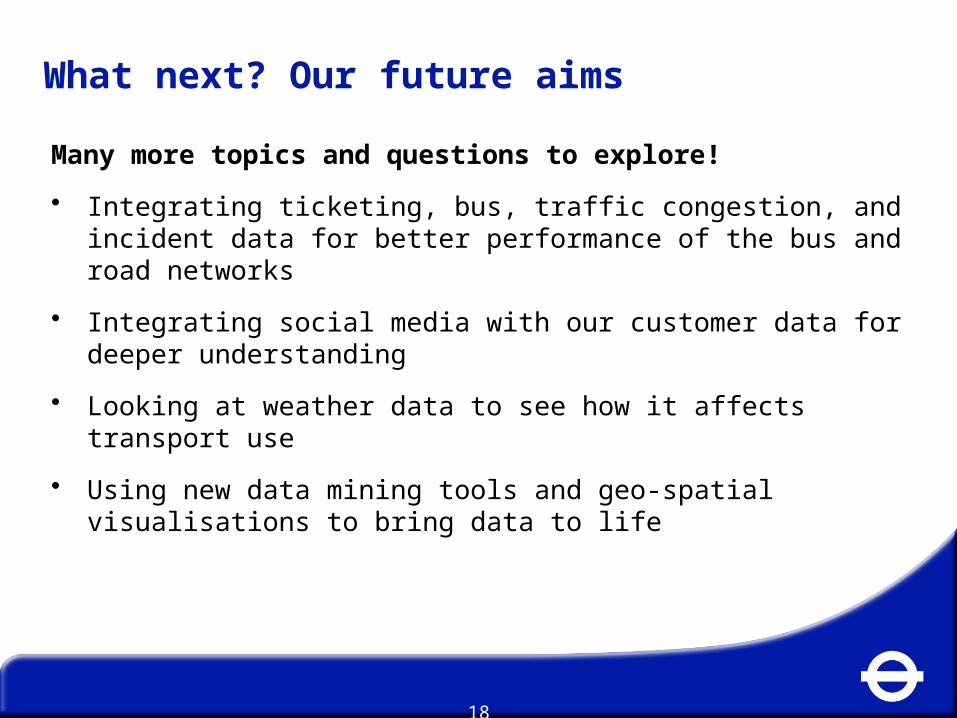
What next? Our future aims
Many more topics and questions to explore!
• Integrating ticketing, bus, traffic congestion, and incident data for better performance of the bus and road networks
• Integrating social media with our customer data for deeper understanding
• Looking at weather data to see how it affects transport use
• Using new data mining tools and geo-spatial visualisations to bring data to life
18

Questions? and... We’re hiring!tfl.gov.uk/corporate/careers/customer-experience-roles
19