innovation diffusion in networks: the microeconomics of
TRANSCRIPT

Paper to be presented at the
35th DRUID Celebration Conference 2013, Barcelona, Spain, June 17-19
Innovation diffusion in networks: the microeconomics of percolationPaolo Zeppini
Eindhoven University of TechnologySchool of Innovation Sciences
Koen FrenkenTU Eindhoven
School of Innovation [email protected]
Luis Izquierdo
University of BurgosDepartment of Civil Engineering
AbstractWe implement a diffusion model for an innovative product in a market with a structure of social relationships. Diffusion isdescribed with a percolation approach in the price space. Percolation shows a phase transition from a diffusion to ano-diffusion regime. This has strong implications for market demand and pricing. We study the effect of networkstructure on market diffusion efficiency by considering a number of cases, such as one-dimensional andtwo-dimensional lattices, small worlds, Poisson networks and Scale-free networks. We consider two measures ofdiffusion efficiency: the size of diffusion and the diffusion time-length. We find that network connectivity `spreading' is themost important factor for the size of diffusion. Clustering is ineffective. This means that societies with higherdimensionality are better markets for diffusion. This result is most evident for the size of diffusion, while a short averagepath-length is more important for the speed of diffusion. Endogenous learning curves shift the percolation threshold tohigher prices, and constitute an endogenous mechanism of price discrimination. The best market strategy of innovationdiffusion is to start with high price and allow for a learning curve.
Jelcodes:C63,O33

Innovation diffusion in networks:
the microeconomics of percolation
Key words: critical transition, demand, learning curves, market efficiency, pricediscrimination, social networks.
JEL classification: C63; D42; O33.
Abstract
We implement a diffusion model for an innovative product in a market witha structure of social relationships. Diffusion is described with a percolation ap-proach in the price space. Percolation shows a phase transition from a diffusion
to a no-diffusion regime. This has strong implications for market demand andpricing. We study the effect of network structure on market diffusion efficiencyby considering a number of cases, such as one-dimensional and two-dimensionallattices, small worlds, Poisson networks and Scale-free networks. We consider twomeasures of diffusion efficiency: the size of diffusion and the diffusion time-length.We find that network connectivity “spreading” is the most important factor for thesize of diffusion. Clustering is ineffective. This means that societies with higherdimensionality are better markets for diffusion. This result is most evident for thesize of diffusion, while a short average path-length is more important for the speedof diffusion. Endogenous learning curves shift the percolation threshold to higherprices, and constitute an endogenous mechanism of price discrimination. The bestmarket strategy of innovation diffusion is to start with high price and allow for alearning curve.
1 Introduction
1.1 Modelling innovation diffusion as percolation
The success of an innovative technology and the market penetration of a new product
largely depend on the diffusion process. Seminal works on innovation diffusion (Griliches,
1957; Mansfield, 1961; Bass, 1969; Davies, 1979) have identified a number of factors that
drive and sometimes delay the establishment of new technologies, as consumer hetero-
geneity, imperfect information, sunk costs of adoption. Yet, the role of market network
structure in the diffusion of innovations is a rather recent research topic (Banerjee et al.,
2012), and can play a fundamental role in the success or failure of innovations. This is
1

particularly relevant to the problem of more efficient innovations that do not diffuse in
face of less desirable incumbent technologies.
In this article we study innovation diffusion in networks with a percolation model.
Percolation refers to the slow flow of liquid through a porous medium, and is a natural
model to describe phenomena that present a sharp separation between a diffusion and
a no-diffusion regimes (phases) (Stauffer and Aharony, 1994). Percolation models has
been successfully applied to epidemiology (Davis et al., 2008). We claim that percolation
is a very ‘economic’ model in that it combines the contagion mechanism of information
diffusion (Bass, 1969) with the economic approach of rank models (Stoneman, 2002).
Several empirical studies document the presence of these two factors behind diffusion
patterns (Canepa and Stoneman, 2004). Moreover, a percolation model introduces a
network structure, which allows to study local effects in adoption decisions and to derive
diffusion patterns with a bottom-up approach. This gives a micro-founded explanation
of S-shaped adoption time series, and allows to evaluate the effect of different market
network structures on innovation diffusion.
In our model consumers are the nodes in a network of social relationships, and are
heterogeneous in terms of their preferences, which are expressed as a reservation price. A
consumer adopts the innovation only if two conditions are met: first, she is informed about
its existence, second, the innovation price is below her reservation price. We make the
two following assumptions: first, information is local, meaning that one consumers knows
about the innovative product only if a neighbour consumer adopts. Second, reservation
price levels are random, and follow a uniform distribution. The uniform distribution of
reservation prices would lead to a linear demand in case of perfect information. We show
how the percolation mechanism of innovation diffusion modifies the demand with respect
to this benchmark.
The assumptions above define a social “percolation” model, where the price plays the
role of the density in a material layer: the higher the price, the less likely percolation
occur. Drawing consumers’ reservation prices is like randomly “shutting down” or re-
moving nodes from the network. Consumers with too low reservation price stop diffusion
locally. Diffusion has a sizable extent only if a giant connected component remains after
the removal. As it happens, the size of the connected component depends non-linearly
on the innovation price, with a critical transition that separates the diffusion from the
non-diffusion regime.
A model of social diffusion suggests a number of variants. We consider two major
2

modifications of the traditional percolation model. First, we consider a number of dif-
ferent network structures, other than the two-dimensional lattice. Second, we introduce
learning curves, with an innovation price decreasing in the number of adopters. Learning
curves are a stylized fact of technological change (Wright, 1936; Abernathy and Wayne,
1974; Argote and Epple, 1990), which can strongly affect the diffusion process. With
our model we address the following questions. How the market network structure affects
diffusion efficiency, and what are the main structural drivers of diffusion? What are
the implications of the diffusion phase transition for market demand? How endogenous
learning curves affect the percolation phase transition, and for which network structures
learning is most effective?
Our methodology is based on batch simulation experiments. The model is run a
number of times in each parameter setting, and the parameter space is searched system-
atically for all different network structures. The main findings are the following. The
average degree of the network has a moderate effect on the extent of diffusion, while
the average path-length is far more important. Even more important is that a market
presents connectivity “spreading”, meaning that neighbours of successive orders (friends
of friends) are increasing in number. Connectivity spreads in networks where nodes can
be arranged in more dimensions. In a society, dimensions are identified with the number
of different social domains or environments, from family ties and friendship relations to
professional activities, sports, leisure, and so on. The message from our analysis is that
societies with higher dimensionality are better markets for diffusion.
The accent on connectivity spreading reconciles results on regular lattices with results
on random networks. A popular hypothesis is that connectivity dispersion favours diffu-
sion (Vega-Redondo, 2007; Goyal, 2007). This does not apply to regular lattices, where
the degree is fixed. However, in the limit of infinitely many dimensions a regular lattice
is a Poisson random network (Albert and Barabasi, 2002). By evaluating networks in
terms of connectivity spreading allows to compare regular lattices and random networks.
A further result of our analysis is that markets structured as small-worlds are relatively
inefficient in a percolation model, showing a relatively small diffusion size. This result
is relevant to the question whether clustering (which is relatively high in a small-world)
is good or bad for diffusion: as far as diffusion is driven by a percolation mechanism,
clustering is ineffective. The intuition is that clusters have many redundant links. A
triplet is useless for the percolation process, since a consumer does not need to have more
than a friend adopting to be informed, and the adoption decision is independent on the
3

number of neighbours adopting.
The result on the effect of clustering is in line with empirical evidence on technology
diffusion (Fogli and Veldkamp, 2012) and against experimental evidence on behaviour
diffusion (Centola, 2010). For technology diffusion highly clustered collectivist societies
present lower innovation diffusion rates, compared to individualist societies. On the other
hand, high clustering favours behaviour diffusion, due to social reinforcement. Our per-
colation model offers a clear benchmark for the adoption mechanism: when innovation
adoption is driven by individual preferences only, and links only bring information, clus-
tering does not favour diffusion. This is true also in presence of local reinforcement: while
small-worlds benefit strongly from learning, one-dimensional lattices do not, which indi-
cates that learning effects are not favoured by clustering, but by a relatively low average
path-length.
Learning curves have a strong impact on diffusion efficiency, shifting the percolation
threshold so as to enlarge the diffusion phase. Learning is particularly effective in a two-
dimensional lattice and in small-worlds. By shifting the percolation threshold, learning
reduces the elasticity of demand of a structured market. This fact has strong implica-
tions for pricing in a monopoly. Learning curves can be used as a price discrimination
mechanism. As with durable goods (Tirole, 1988), the best strategy is to start with a
high price of the innovation, and let learning lower the price adaptively, as diffusion goes
through. This allows to selectively reach the consumers with the higher reservation prices
at the right time.
1.2 Models of economic diffusion
Most economic literature on the diffusion of ideas or products is based on the idea of
contagion. Geroski (2000) is a survey of models that use different mechanisms to explain
the stylized fact of S-shaped diffusion curves. A stronger accent on social interactions
is in Young (2009), who classifies diffusion mechanism as either social contagion, social
influence and social learning. These models deliberately discard the role of a network
topology of social interactions in the diffusion dynamics.
Standard contagion models in theoretical epidemiology are the SI (Susceptible-Infected)
model, the SIS (Susceptible-Infected-Susceptible) model and the SIR (Susceptible-Infected-
Recovered) model. A review of these models is in Vega-Redondo (2007). Network models
of information cascades such as Watts (2002) are slightly different from percolation, since
they are generally based on social pressure as decision mechanism. Pastor-Satorras and
4

Vespignani (2001) study epidemic spreading in scale-free networks using the SIS diffu-
sion rule. Lopez-Pintado (2008) extends this model to other diffusion rules, as imitation
and threshold rule. Both these models rely on a mean-field approximation of the social
interaction network that allows to derive analytical results
In the game-theoretic literature models of local strategic interaction address the issue
of diffusion of strategies or more generally of behaviours. Blume (1995) considers regular
lattices of strategic local interactions. Morris (2000) develops analytical techniques for the
study of general local interaction networks. Although the diffusion of strategic behaviours
shares many aspect with the diffusion of new products or ideas, peculiar issues of strategic
interactions, as revision of strategies, and best-response equilibrium constitute important
differences.
In the management literature there are models that consider the role of complex
network structures on product diffusion. Lee et al. (2006) address market competition
of two products, and show that in some cases the network structure allows a laggard
product to survive even in presence of positive adoption externalities. Choi et al. (2010)
instead focus on the effect of network structure on diffusion rates and market penetration.
Pegoretti et al. (2012) extend the two models above by considering competition of more
than two products. Their main focus is on the role of information. They show that in
a small-world network imperfect information increases the probability of one innovation
becoming dominant in the market, while at the same time it favours market adoption.
This is possible due to frictions between non-compatible products, which have a lower
impact when there is one dominant product.
1.3 Percolation models of economic diffusion
The first percolation model of innovation diffusion has been proposed by Solomon et al.
(2000). They address the metaphorical example of movies markets, and show how “hits”
and “flops” can be explained by the critical transition of percolation. Moreover, when-
ever movies producers and consumers “adapt” by adjusting the product quality and the
subjective quality requirement, respectively, the market presents a self-organized criti-
cality that drives it to the percolation threshold. Silverberg and Verspagen (2005) bring
percolation into the realm of technological change, introducing a complex space where
one dimension is the product performance and the other is a measure of technological
distance. Their main focus is on stylized facts of technological change such as cumula-
tiveness and clustering in time. Hohnisch et al. (2008) show how learning curves explain
5

the empirical evidence of delayed diffusion take-off.
Frenken et al. (2008) extend the percolation model to the competition of different
products in a Hotelling space. Consumers can choose to buy a product that is similar
but not identical to the one purchased by the neighbour. An application of the perco-
lation model of product diffusion to environmental economics is proposed by Cantono
and Silverberg (2009), who study the effect of subsidies for green energy technologies on
the percolation threshold. Iribarren and Moro (2011) ist a study of information diffu-
sion on real social networks. They show the importance of “affinity” between the carrier
of the information message (the agent) and the message content in sustaining a path
of diffusion. In a recent work Campbell (2012) analyses the micro-economic effects of
percolation, focusing on monopoly pricing and advertising strategies.
Percolation models and epidemic diffusion network models are very much related:
the susceptible and infected states of an SI model correspond to accessible and inac-
cessible states of percolation. Percolation is a peculiar model of diffusion in a network.
When nodes’ accessibility is drawn from a probability distribution inaccessible nodes
are “switched-off”, their links deleted, and a random network results, that we name the
operational network. This is defined by two factors: the initial network (which can be
a regular lattice or a random network) and the preference distribution. An interesting
technical question is how the starting network and the preferences distribution jointly
determine the resulting operational network.
Random networks present a second order critical transition in the connectivity space:
there is a threshold value of connectivity such that below all connected components have
negligible size, while above a component of macroscopic size is present, the so-called
giant component. The critical transition of a giant component is at the core of all critical
transitions of processes on networks, including percolation. Percolation occurs whenever
a giant operational component is created after the draw of nodes accessibility (material
porosity, consumers reservation price, etc.). In a social percolation model, the final
number of adopters is the size of the giant operational component, as long as at least an
initial adopter (seed) belongs to it.
Two important points must be kept in mind when studying diffusion with a percolation
model. The first is that whenever we use a regular lattice, connectivity in the resulting
operational network is bounded by the connectivity of the starting network. For instance,
if we start with a regular squared lattice, four is the upper bound of connectivity in
the operational network. The second difference hinges on the different nature of the
6
two factors giving place to the operational network in percolation: the starting network
represents physical or social connections between nodes, while the accessibility random
variable represents a specific state of the node, which may change as it happens with
endogenous learning curves in our model.
The reminder of this article is organized as follows. Section 2 presents the standard
social percolation model, and addresses the implications for demand theory. Section 3
compares different network structures for the market. Section 4 addresses the effects on
endogenous learning curves on percolation for the different networks. Section 5 concludes.
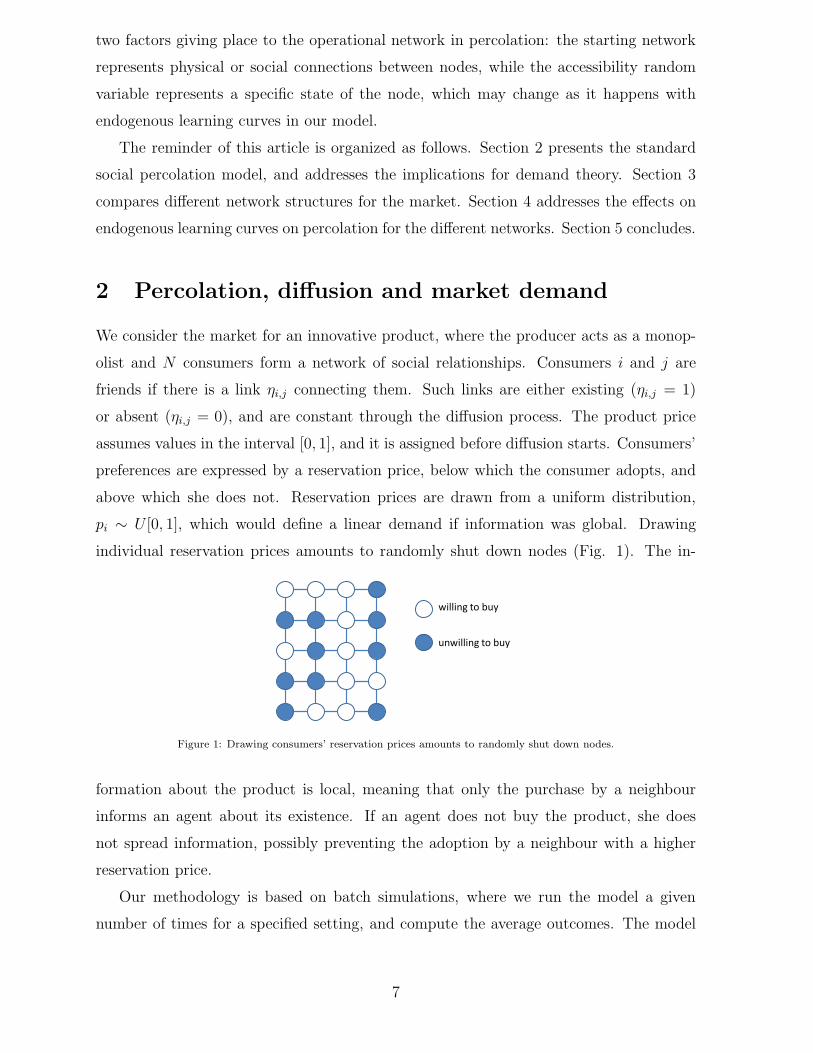
2 Percolation, diffusion and market demand
We consider the market for an innovative product, where the producer acts as a monop-
olist and N consumers form a network of social relationships. Consumers i and j are
friends if there is a link ηi,j connecting them. Such links are either existing (ηi,j = 1)
or absent (ηi,j = 0), and are constant through the diffusion process. The product price
assumes values in the interval [0, 1], and it is assigned before diffusion starts. Consumers’
preferences are expressed by a reservation price, below which the consumer adopts, and
above which she does not. Reservation prices are drawn from a uniform distribution,
pi ∼ U [0, 1], which would define a linear demand if information was global. Drawing
individual reservation prices amounts to randomly shut down nodes (Fig. 1). The in-
willing to buy
unwilling to buy
Figure 1: Drawing consumers’ reservation prices amounts to randomly shut down nodes.
formation about the product is local, meaning that only the purchase by a neighbour
informs an agent about its existence. If an agent does not buy the product, she does
not spread information, possibly preventing the adoption by a neighbour with a higher
reservation price.
Our methodology is based on batch simulations, where we run the model a given
number of times for a specified setting, and compute the average outcomes. The model
7

is initiated by setting the initial adopters (seeds).1 The percolation model is setup with
the following steps:2
1. model settings: network structure, number of consumers N , product price p;
2. draw consumer reservation prices (uniform distribution)
3. draw initial adopters (uniform distribution)
In this section we show the implications of a percolation critical transition for market
demand. With this aim we consider the standard percolation framework used in physics,
a regular two-dimensional lattice (henceforth the ‘grid’, Fig. 2). Different structures are
studied in Section 3. The network structure of the market introduces a non-linearity in
Figure 2: A grid with 100 consumers and degree 4.
the adoption process. If the innovative product has a price p, with a uniform distribution
of reservation prices the probability that a consumer is willing-to-buy is q = 1 − p. If
there were not local effects, the expected number of adopters would be N(1−p). Instead
the social network structure of the market introduces a threshold level of the price above
which product diffusion is way below its potential market penetration (Fig. 3). Below the
threshold the product diffuses (percolates) and reaches its potential penetration. This is
a second-order critical transition. In the non-diffusion phase, the number of adopters is
negligible. In the diffusion phase, this number is almost equal to the number of willing-
to-buy consumer N(1 − p), and the relationships with the product price is linear as it
would be without a network structure.
1These can be consumers that are given the product for free. Our model also allows for a different
setting where initial consumers are like other consumer, and evaluate the product based on their reser-
vation price. We do not use this setting, because the number of seeds becomes a random variable which
affects the comparative analysis of different simulations of the model in different conditions.2The model is implemented in NetLogo, a programmable framework for agent-based modelling
(http://ccl.northwestern.edu/netlogo/)
8

0
1000
2000
3000
4000
5000
6000
7000
8000
9000
10000
0 0.1 0.2 0.3 0.4 0.5 0.6 0.7 0.8 0.9 1
n-o
f-a
do
pte
rs
price
0
0.1
0.2
0.3
0.4
0.5
0.6
0.7
0.8
0.9
1
0 2000 4000 6000 8000 10000
pri
ce
n-of-adopters
n-of-adopters
linear trend
0
500
1000
1500
2000
2500
0 0.1 0.2 0.3 0.4 0.5 0.6 0.7 0.8 0.9 1
revenue
price
Figure 3: Simulated diffusion in a percolation model with a two-dimensional lattice. Left: number
of adopters as a function of the product price. Centre: adoption values reported as a demand curve.
Right: monopoly revenues. Model setting: N = 10000 consumers, 10 seeds. Values are averages over
50 simulation runs. The standard deviation is maximum at the critical transition (about 25%).
In Fig. 3 the values reported for the final number of adopters (squared symbols)
are averages from 50 simulation runs, which are repeated in each setting of the model
(here is the product price p that changes in the range [0, 1] with steps ∆p = 0.05). The
dashed red line represents the theoretical values N(1−p), that is the expected number of
adopters without local effects. In this simulation experiment there are 10000 consumers
arranged in a thorus (a 100x100 grid wrapped horizontally and vertically, which rules
out boundary problems), with ten seeds. The diffusion is very low above 0.5. Between
0.5 and 0.4 there is an abrupt increase of the final diffusion size, towards full efficiency
below 0.4. The critical transition of percolation is not sharp due to the finiteness of the
network. For an infinite two-dimensional lattice with degree 4 the percolation threshold
is about 0.407.3 Different regular lattices have different percolation thresholds (Stauffer
and Aharony, 1994). These values are a static topological characteristic of the lattice.
The negative effect of a percolation mechanism on diffusion size is a market inefficiency
due to local information effects. Many consumers with high reservation price are willing
to buy the innovative product above the threshold, but do not buy because they are not
informed.
The total number of adopters is a measure of the aggregate market demand (Fig.
3, central panel). Without a network structure, if all consumers would be exogenously
informed, we would have a linear demand expressed by Q = N(1 − p). The percolation
phase transition strongly affects the demand (Campbell, 2012). Consider the market
equilibrium where demand equals supply, and assume the monopolist sets supply where
the marginal revenues equal marginal costs, as in a standard monopoly framework. Above
the percolation threshold, the demand is more elastic. In a monopoly market, the price
3Often percolation is defined in the dual space q = 1− p, where the threshold is 1-0.407=0.593.
9

corresponding to the quantity level where marginal revenues equal marginal costs is lower
due to the percolation phase transition. The best strategy for a monopolist is to price
just above the threshold. This carries a large increase of adoption for a relatively small
increase of the price (Fig. 3), and consequently an increase of monopoly revenues, the
price that maximizes revenues is just above the threshold. (Fig. 3, right panel).
3 Market network structures
Different network structures are expected to present different features of percolation crit-
ical transition. Here we consider two-dimensional regular lattice, one-dimensional regular
lattice, Small-worlds as defined by Watts and Strogatz (1998), Poisson random networks,
and Scale-free random networks. Moore and Newman (2000) provide analytical results
for percolation thresholds in one dimensional small-world networks. Newman et al. (2002)
introduce a formalism for the study of percolation in two-dimensional small-world net-
works. We compare these different network structures by looking at the following diffusion
outcomes: the extent of diffusion, measured by the final number of adopters, the result-
ing demand curve, the monopoly revenues associated to such demand and the speed of
diffusion, measured by the time required to reach an equilibrium value of adoption.
We consider two levels of network connectivity (number of links per node), a degree
4 and a degree 8 (for the power law network we use degree 2 and degree 4). For random
networks these values are the mean of the degree distribution.
3.1 Two-dimensional lattices
We start by considering again a two-dimensional lattice with degree 4. In Fig. 4 we
report the diffusion time-length (right) beside diffusion size (left). The time-length of
0
1000
2000
3000
4000
5000
6000
7000
8000
9000
10000
0 0.1 0.2 0.3 0.4 0.5 0.6 0.7 0.8 0.9 1
n-o
f-a
do
pte
rs
price
number of adopters
0
20
40
60
80
100
120
140
0 0.1 0.2 0.3 0.4 0.5 0.6 0.7 0.8 0.9 1
tim
e
price
time to equilibrium
Figure 4: Percolation in a Two-dimensional lattice with degree 4. Left: final number of adopters.
Right: diffusion time-length. Values are 50 runs averages. The standard deviation of the number of
adopters is maximum at the threshold (about 25%). For the diffusion time-length it is larger in the
no-diffusion phase (about 40%).
10
diffusion has a pronounced spike which is typical of phase transitions (Watts, 2002). At
the threshold price the percolation operational component has a macroscopic size already,
but many nodes are connected with only one link, which makes diffusion slow. The time-
length spike can be used to locate the critical transition threshold, which here occurs at
p = 0.4. The threshold value gives an indication of the optimal price for a monopolist.
Moreover, above the threshold diffusion is relatively faster, which is another desirable
aspect.
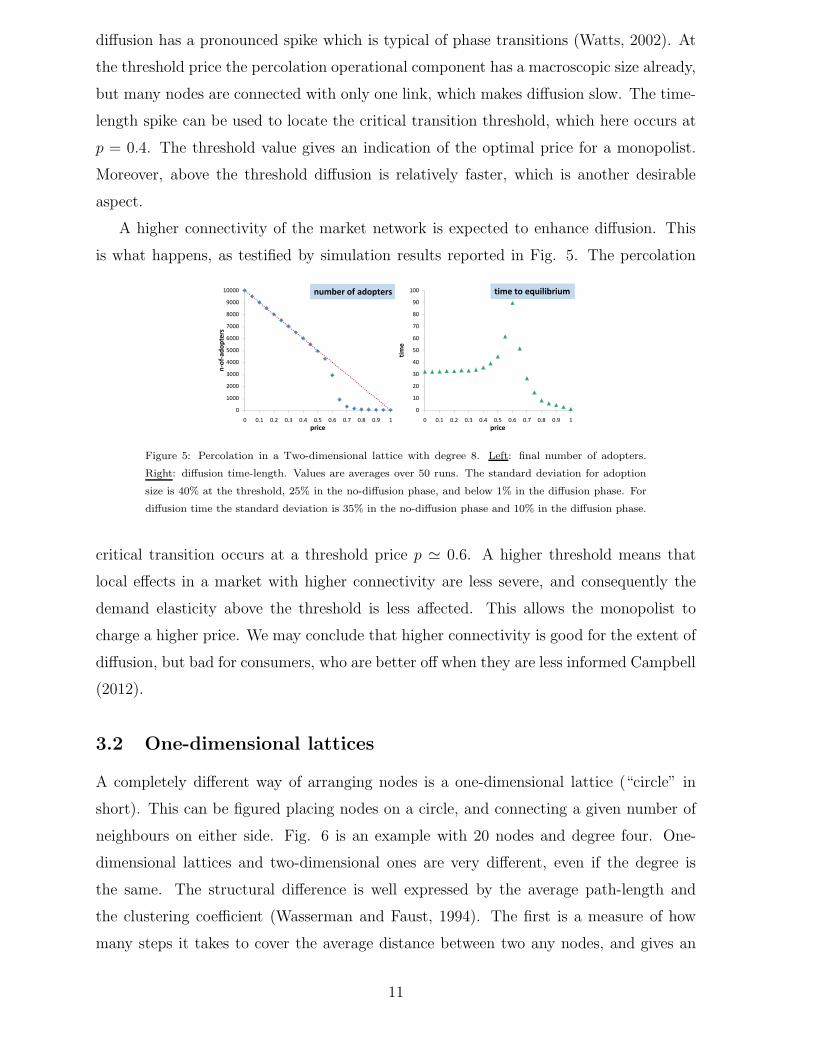
A higher connectivity of the market network is expected to enhance diffusion. This
is what happens, as testified by simulation results reported in Fig. 5. The percolation
0
1000
2000
3000
4000
5000
6000
7000
8000
9000
10000
0 0.1 0.2 0.3 0.4 0.5 0.6 0.7 0.8 0.9 1
n-o
f-a
do
pte
rs
price
number of adopters
0
10
20
30
40
50
60
70
80
90
100
0 0.1 0.2 0.3 0.4 0.5 0.6 0.7 0.8 0.9 1
tim
e
price
time to equilibrium
Figure 5: Percolation in a Two-dimensional lattice with degree 8. Left: final number of adopters.
Right: diffusion time-length. Values are averages over 50 runs. The standard deviation for adoption
size is 40% at the threshold, 25% in the no-diffusion phase, and below 1% in the diffusion phase. For
diffusion time the standard deviation is 35% in the no-diffusion phase and 10% in the diffusion phase.
critical transition occurs at a threshold price p ≃ 0.6. A higher threshold means that
local effects in a market with higher connectivity are less severe, and consequently the
demand elasticity above the threshold is less affected. This allows the monopolist to
charge a higher price. We may conclude that higher connectivity is good for the extent of
diffusion, but bad for consumers, who are better off when they are less informed Campbell
(2012).
3.2 One-dimensional lattices
A completely different way of arranging nodes is a one-dimensional lattice (“circle” in
short). This can be figured placing nodes on a circle, and connecting a given number of
neighbours on either side. Fig. 6 is an example with 20 nodes and degree four. One-
dimensional lattices and two-dimensional ones are very different, even if the degree is
the same. The structural difference is well expressed by the average path-length and
the clustering coefficient (Wasserman and Faust, 1994). The first is a measure of how
many steps it takes to cover the average distance between two any nodes, and gives an
11

Figure 6: A circle with 20 nodes and degree 4.
indication of how closely connected is the network. The second measures the relative
number of clusters. Technically this is given by the number of triads. Loosely speaking,
it tells how often two neighbour nodes are also neighbour of each other. Compared with
two-dimensional lattices of the same degree, one-dimensional lattices have much larger
average path-length and and clustering (the latter is zero in two-dimensional lattices with
degree 4).
Fig. 7 and Fig. 8 report simulation results of the percolation model for one-dimensional
networks with degree 4 and 8, respectively. In this case we run only 20 simulations for
each setting, due to a longer values of diffusion time-length. One-dimensional lattices
0
1000
2000
3000
4000
5000
6000
7000
8000
9000
10000
0 0.1 0.2 0.3 0.4 0.5 0.6 0.7 0.8 0.9 1
n-o
f-a
do
pte
rs
price
number of adopters
0
100
200
300
400
500
600
700
800
0 0.1 0.2 0.3 0.4 0.5 0.6 0.7 0.8 0.9 1
tim
e
price
time to equilibrium
Figure 7: Percolation in a One-dimensional lattice with degree 4. Left: final number of adopters.
Right: diffusion time-length. Values are averages over 20 runs. Standard deviation is 10% - 25% for
the number of adopters and 20% - 40% for the diffusion time-length.
present much lower diffusion levels than two-dimensional lattices. This translates into
lower prices and lower revenues for the monopolist. For a given connectivity, the one-
dimensional structure is less efficient than the two-dimensional one: the grid with degree
4 does better than the circle with degree 8. This indicates that average connectivity is
not very important for the diffusion in a network. A crucial aspect for diffusion is whether
the network connectivity “spreads”. Starting from any node, one should consider how
the number of successive order neighbours evolve. In a circle with degree 4 the r-order
neighbours (number of neighbours after r steps) are always 4. In a grid of degree 4 the
12

0
1000
2000
3000
4000
5000
6000
7000
8000
9000
10000
0 0.1 0.2 0.3 0.4 0.5 0.6 0.7 0.8 0.9 1
n-o
f-a
do
pte
rs
price
number of adopters
0
50
100
150
200
250
300
350
400
450
500
0 0.1 0.2 0.3 0.4 0.5 0.6 0.7 0.8 0.9 1
tim
e
price
time to equilibrium
Figure 8: Percolation in a One-dimensional lattice with degree 8. Left: final number of adopters.
Right: diffusion time-length. Values are averages over 20 runs. Standard deviation is 10% - 25% for
the number of adopters and 25% - 40% for the diffusion time-length.
number of r-order neighbours is 4r: with one step 4 neighbours can be reached, with two
steps 8 neighbours, 12 with three steps, and so on. Topological “spreading” multiplies
diffusion size.
The spreading of connectivity reflects onto the average path length. Consider the limit
case of only one initial adopter. Assume that all consumers are willing to buy. In order
to cover the entire market, we must look at the diameter of the network (the maximum
distance between two nodes). For a regular grid of degree 4 and N nodes, the diameter
is√N . For a circle of degree 4 and the same number of nodes, the diameter is N/4. If
N = 10000, adoption in a circle must “travel” for distances that are 25 times longer than
in a grid, to reach the whole network.
The low diffusion extent of circles reflects in a very high elasticity of demand. Due
to a low percolation threshold, the monopoly price mark-up is very little compared to
the two-dimensional lattice. As a consequence, equilibrium prices are much lower in a
market structured as a circle than in a market structured as a grid.
3.3 Random networks
In this sub-section we study percolation in a number of different random networks, namely
Small-worlds, Poisson networks and Scale-free networks. Small-worlds were introduced by
Watts and Strogatz (1998). They are constructed starting with a regular one-dimensional
lattice as the ones of Section 3.2. One defines a rewiring probability µ based on which
any link can be re-wired. Fig. 9 shows examples with N = 50 nodes and degree 4 (the
total number of links is 4 × 50/2 = 100). In the middle panel there is a small-world
network where eleven links have been rewired (the rewiring probability was µ = 0.1). For
µ = 0 we have the starting regular lattice, while for µ = 1 we have a fully random Poisson
network of the type introduced by Erdos and Renyi (1960). It is important to notice that
13
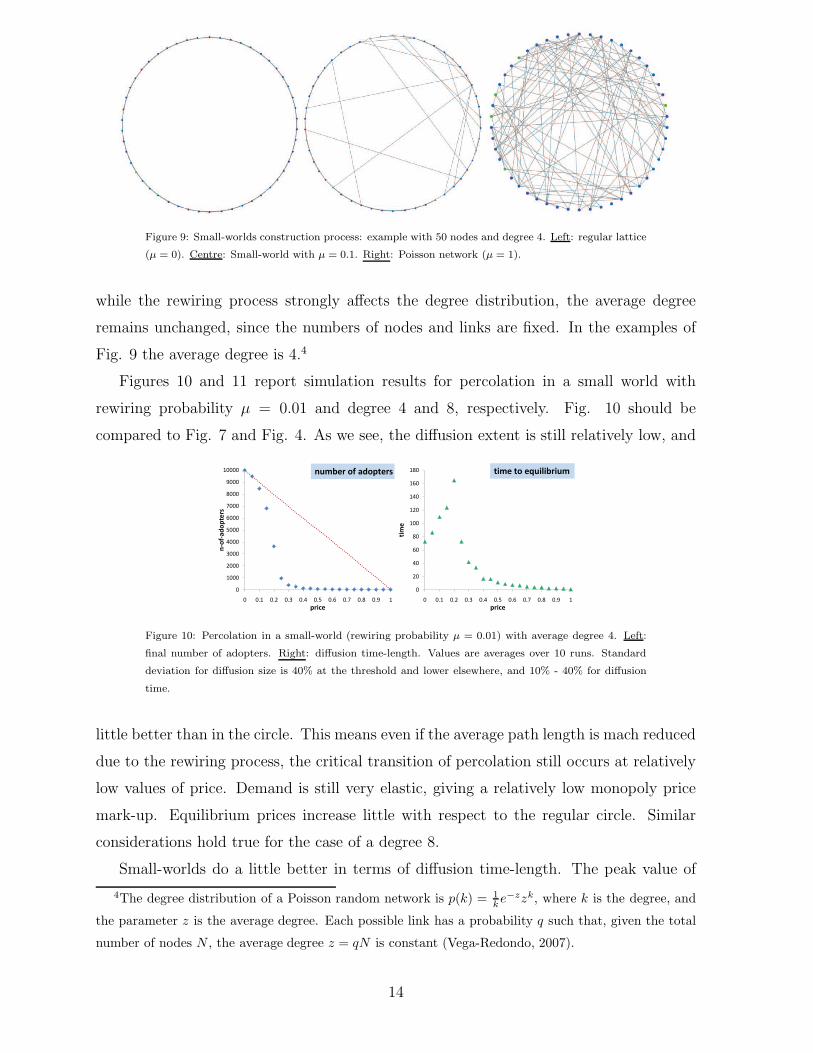
Figure 9: Small-worlds construction process: example with 50 nodes and degree 4. Left: regular lattice
(µ = 0). Centre: Small-world with µ = 0.1. Right: Poisson network (µ = 1).
while the rewiring process strongly affects the degree distribution, the average degree
remains unchanged, since the numbers of nodes and links are fixed. In the examples of
Fig. 9 the average degree is 4.4
Figures 10 and 11 report simulation results for percolation in a small world with
rewiring probability µ = 0.01 and degree 4 and 8, respectively. Fig. 10 should be
compared to Fig. 7 and Fig. 4. As we see, the diffusion extent is still relatively low, and
0
1000
2000
3000
4000
5000
6000
7000
8000
9000
10000
0 0.1 0.2 0.3 0.4 0.5 0.6 0.7 0.8 0.9 1
n-o
f-a
do
pte
rs
price
number of adopters
0
20
40
60
80
100
120
140
160
180
0 0.1 0.2 0.3 0.4 0.5 0.6 0.7 0.8 0.9 1
tim
e
price
time to equilibrium
Figure 10: Percolation in a small-world (rewiring probability µ = 0.01) with average degree 4. Left:
final number of adopters. Right: diffusion time-length. Values are averages over 10 runs. Standard
deviation for diffusion size is 40% at the threshold and lower elsewhere, and 10% - 40% for diffusion
time.
little better than in the circle. This means even if the average path length is mach reduced
due to the rewiring process, the critical transition of percolation still occurs at relatively
low values of price. Demand is still very elastic, giving a relatively low monopoly price
mark-up. Equilibrium prices increase little with respect to the regular circle. Similar
considerations hold true for the case of a degree 8.
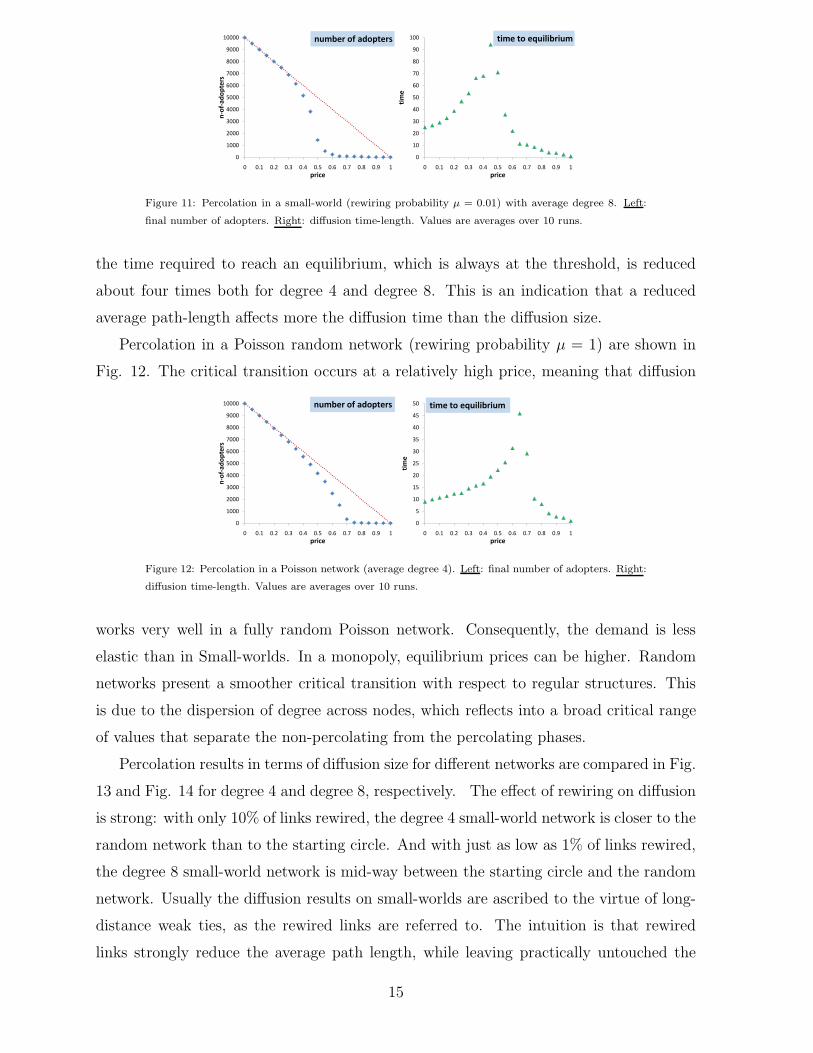
Small-worlds do a little better in terms of diffusion time-length. The peak value of
4The degree distribution of a Poisson random network is p(k) = 1
ke−zzk, where k is the degree, and
the parameter z is the average degree. Each possible link has a probability q such that, given the total
number of nodes N , the average degree z = qN is constant (Vega-Redondo, 2007).
14
0
1000
2000
3000
4000
5000
6000
7000
8000
9000
10000
0 0.1 0.2 0.3 0.4 0.5 0.6 0.7 0.8 0.9 1
n-o
f-a
do
pte
rs
price
number of adopters
0
10
20
30
40
50
60
70
80
90
100
0 0.1 0.2 0.3 0.4 0.5 0.6 0.7 0.8 0.9 1
tim
e
price
time to equilibrium
Figure 11: Percolation in a small-world (rewiring probability µ = 0.01) with average degree 8. Left:
final number of adopters. Right: diffusion time-length. Values are averages over 10 runs.
the time required to reach an equilibrium, which is always at the threshold, is reduced
about four times both for degree 4 and degree 8. This is an indication that a reduced
average path-length affects more the diffusion time than the diffusion size.
Percolation in a Poisson random network (rewiring probability µ = 1) are shown in
Fig. 12. The critical transition occurs at a relatively high price, meaning that diffusion
0
1000
2000
3000
4000
5000
6000
7000
8000
9000
10000
0 0.1 0.2 0.3 0.4 0.5 0.6 0.7 0.8 0.9 1
n-o
f-a
do
pte
rs
price
number of adopters
0
5
10
15
20
25
30
35
40
45
50
0 0.1 0.2 0.3 0.4 0.5 0.6 0.7 0.8 0.9 1
tim
e
price
time to equilibrium
Figure 12: Percolation in a Poisson network (average degree 4). Left: final number of adopters. Right:
diffusion time-length. Values are averages over 10 runs.
works very well in a fully random Poisson network. Consequently, the demand is less
elastic than in Small-worlds. In a monopoly, equilibrium prices can be higher. Random
networks present a smoother critical transition with respect to regular structures. This
is due to the dispersion of degree across nodes, which reflects into a broad critical range
of values that separate the non-percolating from the percolating phases.
Percolation results in terms of diffusion size for different networks are compared in Fig.
13 and Fig. 14 for degree 4 and degree 8, respectively. The effect of rewiring on diffusion
is strong: with only 10% of links rewired, the degree 4 small-world network is closer to the
random network than to the starting circle. And with just as low as 1% of links rewired,
the degree 8 small-world network is mid-way between the starting circle and the random
network. Usually the diffusion results on small-worlds are ascribed to the virtue of long-
distance weak ties, as the rewired links are referred to. The intuition is that rewired
links strongly reduce the average path length, while leaving practically untouched the
15

0
1000
2000
3000
4000
5000
6000
7000
8000
9000
10000
0 0.1 0.2 0.3 0.4 0.5 0.6 0.7 0.8 0.9 1
n-o
f-a
do
pte
rs
price
circle
SW 0.001
SW 0.01
SW 0.1
random
linear demand
number of adopters
0
100
200
300
400
500
600
700
0 0.1 0.2 0.3 0.4 0.5 0.6 0.7 0.8 0.9 1
n-o
f-a
do
pte
rs
price
circle
SW 0.001
SW 0.01
SW 0.1
random
time to equilibrium
Figure 13: Percolation in different networks with degree 4. Left: final number of adopters. Right:
diffusion time-length.
0
1000
2000
3000
4000
5000
6000
7000
8000
9000
10000
0 0.1 0.2 0.3 0.4 0.5 0.6 0.7 0.8 0.9 1
n-o
f-a
do
pte
rs
price
circle
SW 0.001
SW 0.01
SW 0.1
random
linear demand
number of adopters
0
100
200
300
400
500
600
700
0 0.1 0.2 0.3 0.4 0.5 0.6 0.7 0.8 0.9 1
n-o
f-a
do
pte
rs
price
circle
SW 0.001
SW 0.01
SW 0.1
random
time to equilibrium
Figure 14: Percolation in different networks with degree 8. Left: final number of adopters. Right:
diffusion time-length.
clustering coefficient. Fig. 15 reports clustering coefficient C(p) and average path-length
L(p) in Small-World networks from Watts and Strogatz (1998). The combination of low
0
0.2
0.4
0.6
0.8
1
0.0001 0.001 0.01 0.1 1
p
L(p) / L(0)
C(p) / C(0)
Figure 15: Clustering coefficient C(p) and average path-length L(p) in Small-World networks.
average path-length and high clustering characterizes the typical small-world network,
which in our theoretical setting is obtained with a rewiring probability µ = 0.01. The
popular hypothesis is that such combination is good for diffusion. Our results challenge
this hypothesis. In Fig. 16 we compare the final number of adopters for a selection
16

0
1000
2000
3000
4000
5000
6000
7000
8000
9000
10000
0 0.1 0.2 0.3 0.4 0.5 0.6 0.7 0.8 0.9 1
n-of-adopters
price
grid 4
grid 8
SW 4, 0.01
SW 8, 0.01
SW 4, 0.1
SW 8, 0.1
random 4
random 8
linear demand
6750
7250
7750
8250
0.175 0.225 0.275 0.325
Figure 16: Percolation in different networks with degree 4 and 8.
of networks studied so far. Two groups of networks show similar diffusion results. In
the first group are the grid with degree 4, the small-world with degree 4 and µ = 0.1
and the small-world with degree 8 and µ = 0.01. The grid performs less well in terms
of diffusion size below the threshold, but better above the threshold. In particular, the
onset of Fig. 16 shows how the grid performs better even than the random network at low
prices. The second group of networks consists of the grid with degree 8 and the Poisson
network with degree 4. Again, the grid performs less well above the threshold and better
below. The message from this analysis is the following: the crucial factor for diffusion as
percolation is not the average path-length itself, but the topological “spreading” of the
network, a structure where neighbours of successive order are increasing in number (see
Section 3.2). In a random network the number zr of neighbours at distance r is given by
(Vega-Redondo, 2007)
zr =
[
z2z1
]r−1
. (1)
Connectivity spreads whenever the second order neighbours are in larger number than
direct neighbours, z2 > z1. This is the case if the connectivity variance is large enough,
〈k2〉 > 2〈k〉. For Poisson random networks this simplifies to 〈k〉 > 1. In other words,
nodes must have more than one link, on average.
Usually a low average path-length and topological spreading are associated Albert
and Barabasi (2002). But small-world show that this is not necessarily the case: a small-
world with µ = 0.01 has a quite low average path-length (Fig. 15), but presents diffusion
sizes that are by far lower than a random network or even a grid with same degree.
Whenever diffusion is based on a percolation mechanism, a small-world only works well
when it gets close to a random network. This means that connectivity spreading is the
17

key-factor, which is high in random networks and in grids. Clustering is quite high in
a small-world with µ = 0.01, but this does not help diffusion quite at all. Clustering is
ineffective in a percolation process, not entering either the information diffusion and the
adoption decision. This result is in line with empirical evidence on technology diffusion
Fogli and Veldkamp (2012), and against results on behaviour diffusion in online social
networks experiments Centola (2010). This suggests that a percolation model may be
better suited for technological innovation diffusion than for behaviour diffusion.
As a final remark, we observe that random network often do not present full diffusion
at zero price, and regular lattices have higher diffusion sizes at low prices. The reason is
that a random network may present unconnected component, which are never reached by
the information about the new product, so that some consumer never buy even at zero
price.
Often social networks present a “hubs” structure, which is not captured by Small-
worlds or Poisson random networks. Few nodes, the hubs, have many links (high degree),
while the majority as only a few links (low degree). The hubs network structure is
characterized by degree distribution that follows a power law, or Pareto distribution.
Such random networks were studied extensively for the first time by Barabasi and Albert
(1999). They noticed an important characteristics of networks with hubs, which is a
“scale-free” distribution. Technically such distribution is linear on a double logarithmic
plot. The implication is that at any scale or value of the degree, the probability of
occurrence of nodes with such degree “scales” with the same rate. Scale-free networks are
found in many socio-economic systems (Albert and Barabasi, 2002). Here we study how
percolation works on scale-free networks. Fig. 17 compares diffusion sizes in two scale-
free networks with a small world and a Poisson random network. We consider scale-free
networks with average degree 2 and 4. The case of degree 4 shows that scale-free networks
are quite efficient in terms of diffusion size, being comparable with the Poisson random
network. In particular, the scale free-network with degree 4 has a critical transition
threshold at a higher price than the random network, meaning that it favours diffusion
when the price is relatively high. Below the threshold the Poisson network catches-up
and overcomes the scale free-network. The reason is that when the innovation price is
relatively high hubs are useful, because whenever a hub adopts the innovation, it can
“test” many neighbours and very likely find some with reservation price high enough.
This effect is even more striking when comparing a scale-free network of average degree 2
to a small-world of average degree 4: below p = 0.6 percolation in the scale-free network
18
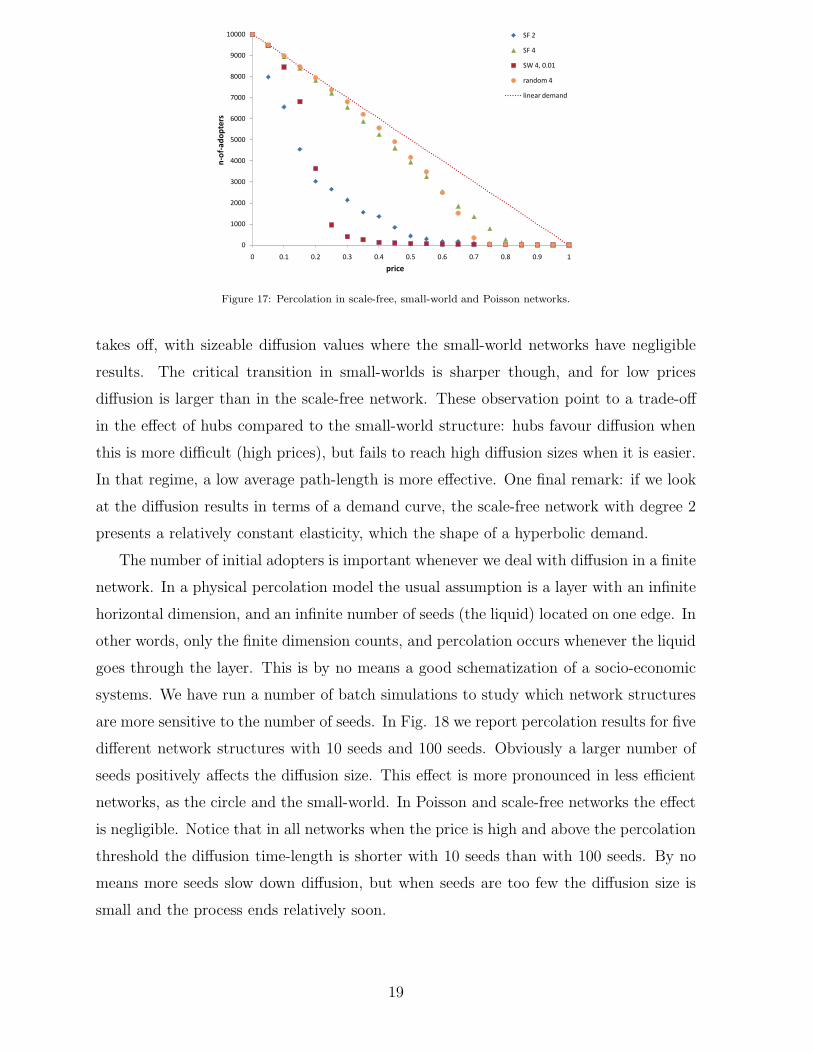
0
1000
2000
3000
4000
5000
6000
7000
8000
9000
10000
0 0.1 0.2 0.3 0.4 0.5 0.6 0.7 0.8 0.9 1
n-of-adopters
price
SF 2
SF 4
SW 4, 0.01
random 4
linear demand
Figure 17: Percolation in scale-free, small-world and Poisson networks.
takes off, with sizeable diffusion values where the small-world networks have negligible
results. The critical transition in small-worlds is sharper though, and for low prices
diffusion is larger than in the scale-free network. These observation point to a trade-off
in the effect of hubs compared to the small-world structure: hubs favour diffusion when
this is more difficult (high prices), but fails to reach high diffusion sizes when it is easier.
In that regime, a low average path-length is more effective. One final remark: if we look
at the diffusion results in terms of a demand curve, the scale-free network with degree 2
presents a relatively constant elasticity, which the shape of a hyperbolic demand.
The number of initial adopters is important whenever we deal with diffusion in a finite
network. In a physical percolation model the usual assumption is a layer with an infinite
horizontal dimension, and an infinite number of seeds (the liquid) located on one edge. In
other words, only the finite dimension counts, and percolation occurs whenever the liquid
goes through the layer. This is by no means a good schematization of a socio-economic
systems. We have run a number of batch simulations to study which network structures
are more sensitive to the number of seeds. In Fig. 18 we report percolation results for five
different network structures with 10 seeds and 100 seeds. Obviously a larger number of
seeds positively affects the diffusion size. This effect is more pronounced in less efficient
networks, as the circle and the small-world. In Poisson and scale-free networks the effect
is negligible. Notice that in all networks when the price is high and above the percolation
threshold the diffusion time-length is shorter with 10 seeds than with 100 seeds. By no
means more seeds slow down diffusion, but when seeds are too few the diffusion size is
small and the process ends relatively soon.
19

0
1000
2000
3000
4000
5000
6000
7000
8000
9000
10000
0 0.1 0.2 0.3 0.4 0.5 0.6 0.7 0.8 0.9 1
n-o
f-a
do
pte
rs
price
10 seeds
100 seeds
linear trend
two-dimensional lattice
0
1000
2000
3000
4000
5000
6000
7000
8000
9000
10000
0 0.1 0.2 0.3 0.4 0.5 0.6 0.7 0.8 0.9 1
n-o
f-a
do
pte
rs
price
10 seeds
100 seeds
linear trend
one-dimensional lattice
0
1000
2000
3000
4000
5000
6000
7000
8000
9000
10000
0 0.1 0.2 0.3 0.4 0.5 0.6 0.7 0.8 0.9 1
n-o
f-a
do
pte
rs
price
10 seeds
100 seeds
linear trend
Small-world, ´=0.01
0
1000
2000
3000
4000
5000
6000
7000
8000
9000
10000
0 0.1 0.2 0.3 0.4 0.5 0.6 0.7 0.8 0.9 1
n-o
f-a
do
pte
rs
price
10 seeds
100 seeds
linear trend
Poisson random network
0
1000
2000
3000
4000
5000
6000
7000
8000
9000
10000
0 0.1 0.2 0.3 0.4 0.5 0.6 0.7 0.8 0.9 1
n-o
f-a
do
pte
rs
price
10 seeds
100 seeds
linear trend
Scale-free network
0
20
40
60
80
100
120
140
0 0.1 0.2 0.3 0.4 0.5 0.6 0.7 0.8 0.9 1
time
price
10 seeds
100 seeds
0
100
200
300
400
500
600
700
0 0.1 0.2 0.3 0.4 0.5 0.6 0.7 0.8 0.9 1time
price
10 seeds
100 seeds
0
20
40
60
80
100
120
140
160
180
0 0.1 0.2 0.3 0.4 0.5 0.6 0.7 0.8 0.9 1
time
price
10 seeds
100 seeds
0
5
10
15
20
25
30
35
40
45
50
0 0.1 0.2 0.3 0.4 0.5 0.6 0.7 0.8 0.9 1
time
price
10 seeds
100 seeds
0
2
4
6
8
10
12
14
16
18
20
0 0.1 0.2 0.3 0.4 0.5 0.6 0.7 0.8 0.9 1
time
price
10 seeds
100 seeds
Figure 18: Effect of the number of seeds on different networks (average degree 4).
4 The effect of technological progress
The price of an innovative technology or product may change during diffusion. For
technological innovations there is wide empirical evidence of so-called learning curves,
a stylized fact showing that prices fall dawn as output quantity increases (Argote and
Epple, 1990). There are many reasons behind learning curves: technological progress,
upfront investment costs, economies of scale, learning-by-doing. In our model a proxy
for output is the number of adopters. We model endogenous learning by assuming the
following relationship between the price pt and the number of adopters Nt at time t:
pt = pN−αt , (2)
where p is the initial price and α is the price reduction rate. The value of α is an empirical
issue, and varies across sectors. For our purposes a value around 0.2 is a good estimate.5
A stylized fact of innovation diffusion is a S-shaped time series of diffusion size (Rogers,
1995). For illustrative purpose we report this time series in five different networks, without
and with endogenous learning. In the five examples of Fig. 19 the innovation price is
p = 0.1, which is well into the diffusion phase for all networks but the circle, for which
we are just at the threshold. The percolation model is able to reproduce the S-shape
of empirical diffusion patterns. Different networks present different features, in terms of
steepness of the curve and position of the inflection point. The features of innovation
diffusion curves have been explained with learning mechanisms of adoption dynamics
(Young, 2009) and with rational expectations logic combined with social interactions
(Brock and Durlauf, 2010). Our illustrative comparative analysis shows how the time-
5Learning curves are difficult to measure because often price reduction goes along with increased
product quality or increased profitability of the technology under study. As a consequence, falling prices
are always an underestimate of technological progress.
20

0
1000
2000
3000
4000
5000
6000
7000
8000
9000
10000
1 3 5 7 9 11 13 15 17 19 21 23 25 27 29 31 33 35 37
n-o
f-a
do
pte
rs
time
Two-dimensional lattice
no learning
learning
0
1000
2000
3000
4000
5000
6000
7000
8000
9000
10000
1
30
59
88
11
7
14
6
17
5
20
4
23
3
26
2
29
1
32
0
34
9
37
8
40
7
43
6
46
5
49
4
52
3
n-o
f-a
do
pte
rs
time
One-dimensional lattice
no learning
learning
0
1000
2000
3000
4000
5000
6000
7000
8000
9000
10000
1 7
13
19
25
31
37
43
49
55
61
67
73
79
85
91
97
10
3
10
9
n-o
f-a
do
pte
rs
time
Small-world, ´=0.01
no learning
learning
0
1000
2000
3000
4000
5000
6000
7000
8000
9000
10000
1 2 3 4 5 6 7 8 9 10 11 12
n-o
f-a
do
pte
rs
time
Poisson network
no learning
learning
0
1000
2000
3000
4000
5000
6000
7000
8000
9000
10000
1 2 3 4 5 6 7 8 9
n-o
f-a
do
pte
rs
time
Scale-free network
no learning
learning
Figure 19: Adoption time series in five different networks, without learning (α = 0) and with learning
(α = 0.1). The innovation price is p = 0.1 in all examples, with N = 10000 consumers and 10 seeds.
pattern of diffusion dynamics is also influenced by the topological structure of social
interactions.
Learning curve introduce a positive feedback in the model. Although the network
topology is unaffected, the ‘accessibility’ of nodes increases with diffusion. The network
does not just ‘affect’ but is also ‘affected’ by the diffusion dynamics, so that network and
diffusion co-evolve. Different network structures are affected differently by endogenous
learning. Fig. 20 reports percolation results from simulations on a two-dimensional
regular lattice. The left panel reports the final number of adopters as a function of
0
1000
2000
3000
4000
5000
6000
7000
8000
9000
10000
0 0.1 0.2 0.3 0.4 0.5 0.6 0.7 0.8 0.9 1
n-o
f-a
do
pte
rs
price
c"?"2
c"?"203
c"?"204
c"?"205
number of adopters
0
20
40
60
80
100
120
140
160
0 0.2 0.4 0.6 0.8 1
tim
e
price
a = 0
a = 0.1
a = 0.2
a = 0.3
time to equilibrium
Figure 20: Percolation model with an endogenous learning curve. Two-dimensional lattice with degree
4. Left: final number of adopters. Right: diffusion time-length.
the initial price value. The first effect of learning is a shift of the percolation critical
transition threshold to higher prices, as it is also testified by a shift of the diffusion time-
length peak in the right panel. The diffusion phase enlarges due to learning, and one
obtains sizeable market penetration for values of the initial price where it is negligible
with a fixed price. The relative effect of learning is indeed larger in this price range, that
in the example of Fig. 20 is [0.5, 0.8]. The implication for market equilibrium and pricing
are also important. Although it is difficult to visualize a demand curve that change
in time due to diffusion, learning allows to charge a higher price initially, and lower it
adaptively as adoption takes place. In other words, learning is an endogenous adaptive
price discrimination mechanism that resembles price discrimination for durable goods
(Tirole, 1988), based on which a monopolist can extract more surplus from demand.
21

Fig. 21 shows how learning affects percolation in a one-dimensional regular lattice.
The effect is lower and more gradual than in two-dimensional lattices. In particular
we notice that one-dimensional lattices present quite similar shapes of diffusion size and
diffusion time as functions of price. This means that diffusion in one-dimensional networks
is a linear process, so that size and time of diffusion are interchangeable. The intuition
is that a one-dimensional lattice does not “spread”, and adoption has only one route to
travel. The linearity of diffusion in one-dimensional lattices is also testified by the overall
0
1000
2000
3000
4000
5000
6000
7000
8000
9000
10000
0 0.1 0.2 0.3 0.4 0.5 0.6 0.7 0.8 0.9 1
n-o
f-a
do
pte
rs
price
c"?"2
c"?"203
c"?"204
c"?"205
number of adopters
0
100
200
300
400
500
600
700
800
900
1000
0 0.2 0.4 0.6 0.8 1
tim
eprice
c"?"2
c"?"203
c"?"204
c"?"205
time to equilibrium
Figure 21: Percolation model with an endogenous learning curve. One-dimensional lattice with degree
4. Left: final number of adopters. Right: diffusion time-length.
increase in the diffusion time-length in the whole price range, which reflects a larger size
of potential adopters to fulfill.
In a small world endogenous learning has a strong effect (Fig. 22). The relative shifts
0
1000
2000
3000
4000
5000
6000
7000
8000
9000
10000
0 0.1 0.2 0.3 0.4 0.5 0.6 0.7 0.8 0.9 1
n-o
f-a
do
pte
rs
price
c"?"2
c"?"203
c"?"204
c"?"205
number of adopters
0
50
100
150
200
250
0 0.2 0.4 0.6 0.8 1
tim
e
price
c"?"2
c"?"203
c"?"204
c"?"205
time to equilibrium
Figure 22: Percolation model with an endogenous learning curve. Small-world (rewiring probability
µ = 0.01) with average degree 4. Left: final number of adopters. Right: diffusion time-length.
of the percolation threshold are comparable to a two-dimensional network. A learning
rate α = 0.2 moves the percolation threshold by half the price range, from 0.2 to 0.7.
An explanation resides on the fact that a small-world represents a middle state between
two very different structures as the one-dimensional lattice and the Poisson network,
which makes it very sensitive to changes. Learning ‘switches-on’ links. Re-wired links are
22

very important, as they make the average path-length low. Whenever learning happens
to switch-on a re-wired link, diffusion has a sudden increase, because a new region of
adopters is accessed. Since re-wired links are relatively few (only 1% in the example of
0
1000
2000
3000
4000
5000
6000
7000
8000
9000
10000
0 0.1 0.2 0.3 0.4 0.5 0.6 0.7 0.8 0.9 1
n-o
f-a
do
pte
rs
price
c"?"2
c"?"203
c"?"204
c"?"205
number of adopters
0
5
10
15
20
25
30
35
40
45
50
0 0.2 0.4 0.6 0.8 1
tim
e
price
c"?"2
c"?"203
c"?"204
c"?"205
time to equilibrium
Figure 23: Percolation model with an endogenous learning curve. Poisson network with average degree
4. Left: final number of adopters. Right: diffusion time-length.
Fig. 22), this event has a larger impact than in other structures, such as the Poisson
network (Fig. 23). The Poisson network is a fairly homogenous structure, and the link
switching-on process of learning has a lower impact. This is particularly true at high
learning rates. In a small world the marginal impact of increasing the learning rate
is always large, while, in a Poisson random network the biggest improvement realizes
already for α = 0.1, while more sustained learning have an ever decreasing impact.
The picture is quite different for scale-free networks (Fig. 24). Here we notice the
0
1000
2000
3000
4000
5000
6000
7000
8000
9000
10000
0 0.1 0.2 0.3 0.4 0.5 0.6 0.7 0.8 0.9 1
n-o
f-a
do
pte
rs
price
c"?"2
c"?"203
c"?"204
c"?"205
number of adopters
0
2
4
6
8
10
12
14
16
18
0 0.2 0.4 0.6 0.8 1
tim
e
price
c"?"2
c"?"203
c"?"204
c"?"205
time to equilibrium
Figure 24: Percolation model with an endogenous learning curve. Scale-free network with average
degree 2. Left: final number of adopters. Right: diffusion time-length.
following. First, learning has relatively little effect on scale-free networks compared to
other structures. Second, the percolation threshold is less evident with learning, and
almost no phase transition occurs above α = 0.2. In other words, learning reduces the
demand elasticity in a quite homogenous manner, so as to make the resulting demand
curve quite linear. Third, in this scale-free network we find again a tight correspondence
23

between extent and time of diffusion, as it is the case with regular one-dimensional lattices.
In this case the explanation of a linear diffusion process is different: the reason is the
very nature of a scale-free network, which is the lack of a characteristic scale. Learning
enlarges the network by switching-on nodes (and links). This enlargement process is
linear, and there is not a point where the increase in network size is higher or lower.
We may say that percolation is a way to elicit the fundamental property of a scale-free
network. A final remark is that simulation results have a large variability for scale-free
networks. This is due to the randomness of the construction of a scale-free network,
which is based on a preferential attachment stochastic process.
The conclusive message for this section is that learning curves favour innovation dif-
fusion in very different ways depending on the network structure. In all cases though,
learning curves are an adaptive price discrimination tool. In the case of a monopoly
market for the innovation, the best strategy is to target consumers in connected net-
work components, and initially charge a high price. Then let the price fall, and reach
consumers with lower reservation prices. This allows to extract the most surplus from
demand. This message is opposite to the popular idea based on which the innovator
should initially price low, in order to launch the product and only later increase the
price. Both strategies may be right, depending on the adoption mechanism at work. If
there are strong network externalities that generate increasing returns on adoption (Katz
and Shapiro, 1986; Arthur, 1989), the popular strategy makes sense. This is the case
with communication technologies, for instance, as the fax machine or mobile telephones.
Network externalities can be accounted for in a percolation model by having reservation
prices go up with the number of adopters. Percolation results would be identical to what
has been presented for learning curves, because the adoption decision is still based on
comparing the product price with a reservation price: with learning curves the product
price reaches reservation prices from above, while network externalities take reservation
prices up to the product price. But the message for pricing is opposite in the two cases.
5 Conclusions
We have developed an agent-based percolation model to study how market network struc-
ture affects innovation diffusion. This study is relevant both for market diffusion efficiency
and for the analysis of market demand. The variable of interests are the diffusion size
(number of adopters) and the diffusion time-length. Our methodology is based on batch
24

simulations, with results that are averages over a number of different simulation runs.
A percolation model combines two important factors of economic diffusion, which are
information diffusion and individual preferences. This allows to obtain insightful results
in an economic perspective. First of all, the percolation model is able to reproduce S-
shaped time patterns of innovation adoption with a bottom-up approach. This result
indicates that social network interactions are another factor shaping innovation diffusion
dynamics beside rational expectations and learning mechanisms considered in the liter-
ature. Moreover, the percolation process shows a phase transition from a diffusion to a
no-diffusion regime (phase), with a price threshold value which depends on the network
structure. The percolation critical transition has two economic implications. First, it is
a result of market inefficiency: a sizeable portion of the demand is not satisfied in the
no-diffusion phase regime. Second, the demand curve is more elastic in the no-diffusion
phase, and the market equilibrium price is lower.
The comparative analysis of percolation in different network structures indicates the
main structural factors that affect innovation. We consider one-dimensional and two-
dimensional regular lattices, Small-worlds networks, Poisson networks and Scale-free net-
works. The main results are the following. The higher average degree favours diffusion,
as expected, but it is not the main driver. Structural factors may be more important.
The crucial factor for diffusion in a percolation model is not the average path-length,
but “connectivity spreading”, that is a topology where neighbours of successive order
are increasing in number. Connectivity spreading is a diffusion multiplier, whose effect
is striking when comparing a two-dimensional lattice to a one-dimensional lattice with
the same degree. Spreading is also a characteristic of Poisson random network, but not
of Small-worlds, where a relatively low average path-length is not enough to ensure high
diffusion efficiency. In particular clustering is useless for diffusion in a percolation model:
the triads that characterize clusters structures (where often two neighbours are also neigh-
bour of each other) have redundant links, which do not contribute to diffusion efficiency.
The reason is that in a percolation model links carry information, but adoption decisions
are based only on individual preferences. This result is relevant to the debate regarding
whether clustering is good or bad for diffusion. In this perspective, a percolation model
constitutes a clear benchmark: clustering is useless whenever adoption is based on indi-
vidual preferences and not on social pressure. The final message from this analysis is that
more individualist societies with high dimensionality are better markets for innovation
diffusion.
25
One-dimensional lattices and scale-free networks surprisingly present one similar fea-
ture, a linear correspondence between diffusion size and time-length: whenever the dif-
fusion extent is larger, also the time required to reach an equilibrium is longer, and
viceversa. This is true also with learning. The explanation for this result is different for
the two network structures. In a one-dimensional lattice connectivity does not “spread”,
and adoption has only one route to travel. For scale-free networks the reason behind such
linear correspondence between time and size of diffusion is the lack of a characteristic
network scale, the main property of a scale-free network. These results indicate that al-
though one-dimensional lattices and scale-free networks are very different structures, they
can be two paradigmatic benchmarks for less-developed societies, with low dimension-
ality, high clustering, and a hierarchical structure. On the contrary non-linear diffusion
patterns may be an indication of an individualist society, with low clustering and high
dimensionality, better represented by a two-dimensional lattice or a Poisson network.
Dimensionality is not captured by small-world networks, which are a popular model for
many social systems. Beside connectivity spreading, dimensionality is the second main
factor for innovation diffusion that we identify with our percolation model.
We have studied the effect of endogenous learning on percolation. During diffusion
the learning feedback enlarges the network connected component of consumers willing
to buy, and the percolation threshold shifts to a higher (initial) price. This has strong
implications for market demand and pricing. The price elasticity of demand decreases,
leading to a higher equilibrium price. In a monopoly market this effect can be used as
a price discrimination tool: the best strategy is to start charging a high price, targeting
consumers with high reservation price, and allow for a learning curve which adaptively
reaches consumers with lower reservation price. This strategy allows to extract more
surplus from the demand. For this strategy it is important that one consumer may be
reached by the information about the new product more than one time. This is why
learning has a strong impact on two-dimensional lattices and Poisson networks, and a
relatively low impact on one-dimensional lattices and scale free networks. The effect of
learning is particularly strong on small-world networks. Learning “switches-on” nodes
and consequently activates links progressively, with a strong effect on small-worlds where
only few links are responsible of a relatively low average path-length. Again, clustering
is unimportant for percolation also when learning is at work. Interestingly, learning has
the lower effect in structures where there is a linear correspondence between diffusion size
and diffusion time.
26

The two following tables summarize our findings by classifying the different network
structures on four dimensions related to the percolation process. Table 1 reports on the
small diffusion size large diffusion size
linear size-time relation One-dimensional lattices Scale-free networks
non-linear size-time relation Small-world networks Two-dimensional lattices
Poisson networks
Table 1: Classification of network structures based on the diffusion size and the relationship between
the size and the time-length of diffusion.
diffusion size together with the relationship between diffusion size and diffusion time-
length. Table 2 considers the impact of learning, and the effect of the number of seeds
(initial adopters).
low impact of seeds large impact of seeds
low impact of learning Scale-free networks One-dimensional lattices
large impact of learning Poisson networks Small-world networks
Two-dimensional lattices
Table 2: Classification of network structures based on the impact of endogenous learning and the
impact of the number of initial adopters (seeds).
We conclude with some ideas for future research. The percolation model can accom-
modate the diffusion of multiple innovations. Goyal and Kearns (2012) study the strategic
implications of diffusion for two competing innovative firms. An interesting question is
whether competition affects diffusion, and how the percolation critical transition affects
competition. Another possibility is to introduce local reinforcement beside the global
feedback of learning curves. Local reinforcement can work at reservation prices level,
accounting for imitation, peer-effect, and social pressure in general. A further modifi-
cation involves the distribution of reservation prices. The uniform distribution defines
a linear demand as the perfect information benchmark. A Pareto distribution (power-
law) better describes the social income distribution, and can shed light on the effects of
economic inequality on innovation diffusion. The analytical study of percolation with
non-uniform reservation price distribution can be approached with generating functions
(Callaway et al., 2000). Finally, a big step for a theoretical model of innovation diffusion
is to match empirical evidence. Percolation constitutes a simple benchmark of diffusion
27

dynamics, with clear results regarding the effects of structural factors of social networks.
A useful study would be to test innovation diffusion in a controlled web experiment (Cen-
tola, 2010), to see if the percolation mechanism is grounded on the evidence of human
behaviour.6
References
Abernathy, W.J., K. Wayne. 1974. Limits of the learning curve. Harvard Business Review
52(5) 109–119.
Albert, R., A.-L. Barabasi. 2002. Statistical mechanics of complex networks. Reviews of
Modern Physics 74 47–97.
Argote, L., D. Epple. 1990. Learning curves in manufacturing. Science 247 920–924.
Arthur, B. 1989. Competing technologies, increasing returns, and lock-in by historical
events. Economic Journal 99 116–131.
Banerjee, A., A. Chandrasekhar, E. Duflo, M. Jackson. 2012. The diffusion of microfi-
nance. Tech. Rep. 17743, NBER.
Barabasi, A.-L., R. Albert. 1999. Emergence of scaling in random networks. Science 286
509–512.
Bass, F. M. 1969. A new product growth for model consumer durables. Management
Science 15(5) 215–227.
Blume, L. E. 1995. The statistical mechanics of best-response strategy revision. Games
and Economic Behavior 11(2) 111–145.
Brock, W.A., S.N. Durlauf. 2010. Adoption curves and social interactions. Journal of the
European Economic Association 8(1) 232–251.
Callaway, D.S., M.E.J. Newman, S.H. Strogatz, D.J. Watts. 2000. Network robustness
and fragility: percolation on random graphs. Physical Review Letters 85 5468–5471.
Campbell, A. 2012. Word-of-mouth communication and percolation in social networks.
Tech. rep.
6The programmable simulation framework used for this article (NetLogo) is equipped with a technol-
ogy for participatory model simulations on networked computers (HubNet).
28

Canepa, A., P. Stoneman. 2004. Comparative international diffusion: patterns, determi-
nants and policies. Economics of Innovation and New Technology 13(3) 279–298.
Cantono, S., G. Silverberg. 2009. A percolation model of eco-innovation diffusion: the
relationship between diffusion, learning economies and subsidies. Technological Fore-
casting and Social Change 76 487–496.
Centola, D. 2010. The spread of behavior in an online social network experiment. Science
329 1194–1197.
Choi, H., S.-H. Kim, J. Lee. 2010. Role of network structure and network effects in
diffusion of innovations. Industrial Marketing Management 39 170–177.
Davies, S.W. 1979. Inter-firm diffusion of process innovations. European Economic Review
12(4) 299–317.
Davis, S., P. Trapman, H. Leirs, M. Begon, J.A. Heesterbeek. 2008. The abundance
threshold for plague as a critical percolation phenomenon. Nature 454 634–637.
Erdos, P., A. Renyi. 1960. On the evolution of random graphs. Publications of the
Mathematical Institute of the Hungarian Academy of Sciences 5 17–61.
Fogli, A., L. Veldkamp. 2012. Germs, social networks and growth. Tech. Rep. 9188,
CEPR.
Frenken, K., G. Silverberg, M. Valente. 2008. A percolation model of the product life-
cycle. Tech. Rep. 73, UNU-MERIT.
Geroski, P.A. 2000. Models of technology diffusion. Research Policy 29 603–625.
Goyal, S. 2007. Connections: an introduction to the economics of networks . Princeton
University Press, Princeton, NJ.
Goyal, S., M. Kearns. 2012. Competitive contagion in networks. Tech. rep.
Griliches, Z. 1957. Hybrid Corn: An Exploration in the Economics of Technological
Change. Econometrica .
Hohnisch, M., S. Pittnauer, D. Stauffer. 2008. A percolation-based model explaining
delayed takeoff in new-product diffusion. Industrial and Corporate Change 17(5) 1001–
1017.
29

Iribarren, J.-L., E. Moro. 2011. Affinity paths and information diffusion in social networks.
Social Networks 33 134–142.
Katz, M.L., C. Shapiro. 1986. Technology adoption in the presence of network external-
ities. Journal of Political Economy 94(4) 822–841.
Lee, E., J. Lee, J. Lee. 2006. Reconsideration of the winner-take-all hypothesis: complex
networks and local bias. Management Science 52(12) 1838–1848.
Lopez-Pintado, D. 2008. Diffusion in complex social networks. Games and Economic
Behavior 62 573–590.
Mansfield, E. 1961. Technical change and the rate of imitation. Econometrica 29(4)
741–766.
Moore, C., M.E.J. Newman. 2000. Epidemics and percolation in small-world networks.
Physical Review E 61 5678–5682.
Morris, S. 2000. Contagion. Review of Economic Studies 67 57–78.
Newman, M.E.J., I. Jensen, R.M. Ziff. 2002. Percolation and epidemics in a two-
dimensional small-world. Physical Review E 65(2) 1–7.
Pastor-Satorras, R., A. Vespignani. 2001. Epidemic spreading in scale-free networks.
Physical Review Letters 86 3200–3203.
Pegoretti, G., F. Rentocchini, G. Vittucci-Marzetti. 2012. An agent-based model of
innovation diffusion: network structure and coexistence under different information
regimes. Journal of Economic Interaction and Coordination 7(2) 145–165.
Rogers, E.M. 1995. Diffusion of innovations. Free Press, New York.
Silverberg, G., B. Verspagen. 2005. A percolation model of innovation in complex tech-
nology spaces. J. of Economic Dynamics and Control 29 225–244.
Solomon, S., G. Weisbuch, L. de Arcangelis, N. Jan, D. Stauffer. 2000. Social Percolation
Models. Physica A 277 239–247.
Stauffer, D., A. Aharony. 1994. Introduction to Percolation Theory . Taylor & Francis,
London.
Stoneman, P. 2002. The economics of technological diffusion. Basil Blackwell, Oxford.
30

Tirole, J. 1988. The theory of industrial organization. MIT Press, Cambridge, MA.
Vega-Redondo, F., ed. 2007. Complex Social Networks . Cambridge University Press,
Cambridge, England.
Wasserman, S., K. Faust, eds. 1994. Social Network Analysis. Cambridge University
Press, Cambridge, England.
Watts, D. 2002. A simple model of global cascades on random networks. Proceedings of
the National Academy of Sciences 99(9) 5766–5771.
Watts, D. J., S. H. Strogatz. 1998. Collective dynamics of ‘small-world’ networks. Nature
393 440–442.
Wright, T.P. 1936. Factors affecting the cost of airplanes. Journal of Areonautical Sciences
3 122–128.
Young, H.P. 2009. Innovation diffusion in heterogenous populations: contagion, social
influence and social learning. American Economic Review 99(5) 1899–1924.
31