innovation, competitiveness and growth: korean …disciplined work force, and technological...
TRANSCRIPT

Innovation, Competitiveness and Growth: Korean Experiences1
Sungchul Chung
Research Fellow Emeritus Science and Technology Policy Institute (STEPI)
Korea has transformed itself from a stagnant agrarian society into one of the most dynamic
industrial economies of the world within four decades. In the early 1960s when Korea first
launched its industrialization efforts, it was a typical poor developing country with poor
resource and production base, small domestic market, and a large population. Korea’s GNP in
1961 was only $ 2.3 billion (in 1980 prices) or $87 per capita which came mainly from the
primary sectors. 2 The manufacturing sector’s share in GNP remained at a mere 15%.
International trade was also at a very infant stage: in 1961, Korea’s export volume was only $55
million and imports $390 million. But it is now 13th largest economy and one of the major
trading countries of the world. It has also established world prominence in such technology
areas as semi-conductors, LCD, telecommunication equipment, automobiles, shipbuilding, and
so on. Indeed, it has emerged from nowhere as one of the key international players in the global
economy.
Some say that in three decades, Korea has achieved what it took more than a century for the
Western industrial countries to accomplish. There exist rich literatures on Korean growth that
attribute the Korean success to an assortment of diverse factors. But many seem to agree that
Korean government’s “outward-looking development strategy,” well-educated and well-
1 A first draft. Only for discussion at the ABCDE Seoul. 2 Korea is a very small, resource-poor country: its land area is only 220 thousand square kilometers or 99
thousand square kilometers if we exclude the northern part, which is currently under a different political and
economic system. Korea’s land, of which 75% is non-arable mountains, produces not a single drop of oil and
contains virtually no valuable natural resources. Still it has to support a population of 70 million people.
1
disciplined work force, and technological innovation have been well combined to bring about
what they call “Korean Miracle.”
Of the three factors, this paper focuses on the role of technological innovation. If
technological innovation was the key factor, one may ask: What stimulated and facilitated
Korean industries to engage so actively in R&D and innovation; and to what extent
technological innovation has contributed to improving the competitiveness of Korean industries
and to the growth of the economy. This paper discusses these issues, with a view to drawing
some lessons from the Korean development experiences. Toward this end, this paper start with a
review of what Korea has done to learn and acquire technologies for industrialization, and how
Korea has been able to promote R&D and innovation and build up technological capability. And
then we analyze the contribution of R&D and innovation to industrial competitiveness and
economic growth in Korea. Finally, we draw some lessons for late-comers from the Korean
experiences.
How Korea Learned and Acquired Technologies for Industrialization?
Back in the 1960s, Korea was no more than a barren land, so far as science and technology
was concerned. There were only two public institutions for scientific research and technological
development: the National Defense R&D Institute created right after the end of the Korean War,
and the Korea Atomic Energy Research Institute which was founded in 1959, and less than
5,000 research scientists and engineers.3 In 1963, R&D expenditures remained at $9.5 million.
Fortunately, however, Korea had well-educated workforce. Years of schooling of the
workforce of Korea was as high as 4.98 in 1960 and school enrollment rate reached 100% for
elementary education as early as in 1970. Indeed, Korea’s educational achievements stood
fairly close to the level expected for a country twice as wealthy as it was.(Cohen and Soto,
2001) For this, Korea owes much to the Confucian tradition that places highest esteem on
3 The number here is an estimate based on the figure for 1969, which was 5,337 (MOST 1984)
2

education and scholarship.4
Under such a setting, Korea launched the First Five-Year Economic Development Plan in
1962, which along with the subsequent plans generated huge demand for new technologies. As
Korea lacked in technological capability, it had to rely almost completely on foreign sources for
technologies. Korea’s policy strategy was geared to promoting the inward transfer of foreign
technologies, while, at the same time, developing domestic absorptive capacity to digest,
assimilate and improve upon the transferred technologies.
Korean Strategy for Technology Learning
Foreign direct investment (FDI) is often cited as a key to technological learning. Actually,
FDI is considered by many to be the most effective means for late-comers to learn new
production skills and acquire management expertise. But that was not the case in Korea. The
Korean government took a policy that restricted FDI in various ways, say, ownership restriction,
repatriation restriction, technology transfer requirement, export requirement, etc. Such a
restrictive policy was inevitable because of the public sentiment in those days that viewed multi-
nationals as promoting the perpetuation of economic and technological dependence, reinforcing
the asymmetrical relationship between the industrialized and the developing countries. (Koo
1984; Vernon 1977; Stewart 1978)5 So, unlike in other developing countries, FDI played less
important a role in Korea as a source of capital and technology.
Technology purchase through foreign licensing (FL) was also of modest importance in
Korea because of the foreign exchange control of the government. Being a typical agrarian
economy relying on agriculture for almost three quarters of the national production, Korea, in
4 However, the Confucianism may have adverse effects on the development of science and technology in
Korea: it stresses patriotism and demands loyalty to the traditional values and, therefore, tends to devalue new,
unconventional ideas. The Korean society, like other Confucian societies, is less open to different ideas and
systems, which works as a barrier to innovation.
5 Foreign investors also did not view Korea as an attractive place for investment. Even though Korea took a very
open and liberal policy on direct foreign investment in the 1960s, few investments were made primarily because of
3

the 1960s, simply could not afford to buy technologies from foreign sources. It is quite
understandable that a country with a per capita GNP of $ 87 (1962) and annual export revenue
of only $ 55 million (1962) took such a restrictive policy on FL which very often entails long-
term financial commitment.
As an alternative, Korea opted for long-term foreign loans to finance industrial investments.
The Korean government brought in large-scale foreign loans and allocated them for investments
in selected industries, which led to massive importation of foreign capital goods and turn-key
plants. Industries later reverse-engineered imported capital goods for the purpose of acquiring
necessary technologies. This policy contributed to the formation of a unique business
conglomerate called “Chaebol.” The government selected not only the target industries for
investment but also the entrepreneurs who would actually implement the new investment
projects, and some of those selected entrepreneurs later became owners of the “Chaebols.” So,
we can say that the FDI policy has much to do with the evolution of the unique industrial
structure of Korea.
How Private Industries Responded?
Private companies’ responses to such restrictive policies varied across industries. In the
case of such light industries as shoes, clothing, textiles, and some intermediate goods for import
substitution as well as export, the major sources of technological learning were OEM (original
equipment manufacturing) production arrangements. Korean firms benefited most from the
OEM production arrangements because they offered opportunities to work with foreign buyers
who provided everything from product designs and materials to quality control at the end of the
production. This was especially so in the case of garment and electronic industries. (Hobday
1995)
Turning into the 1970s, Korea’s development target was shifted to more capital- and
technology-intensive industries, and they implemented massive investment projects to build up
machinery and chemical industries. For the development of chemical industries, Korea relied
the questions about Korea’s political stability and economic outlook.
4
largely upon turn-key plant importation, which included technical training programs as part of
the packages. In the case of heavy machinery, FL was an important channel for technology
acquisition. (Chung and Branscomb 1996) To help industries adopt new technologies, the
government created GRIs in the fields of heavy machinery and chemicals, such as the Korea
Institute of Machinery and Metals (KIMM), the Electronics and Telecommunications Research
Institute (ETRI), the Korea Research Institute of Chemical Technology (KRICT), the Korea
Research Institute of Standards and Science (KRISS), the Korea Institute for Energy Research
(KIER), the Korea Ocean R&D Institute (KORDI), etc. These institutes worked with private
industries in building technological foundation for industrial development.
As a result, FDI had minimal impact on the Korean economy. For example, FDI accounted
for only 3.9% of the cumulative total of long-term foreign capital in Korea over the period of
1962-1982 ($ 9 billion). According to a United Nations report, FDI in all developing countries
in the early and mid-1970s accounted for 10-20% of their total foreign capital inflow. Over the
period of 1962-1972, FDI inflow in Korea remained at $ 223 million, while capital goods import
reached $ 2,857 million. (Ahn 1991)
In short, Korean industries depended more on informal channels for technology acquisition
than formal channels. As informal channels involve less market mediation and more active roles
of technology recipients, they are less costly but require higher capability of technology
recipients in not just identifying and selecting technologies but also absorbing, assimilating and
improving upon the transferred technologies.6 This means that Korea has been able to succeed
in acquiring technologies for industrialization largely owing to the rich pool of well-educated
people who are determined to work for the betterment of their lives.
Building-up a Base for R&D and Innovation
While promoting technological learning for industrialization, the Korean government also
made efforts to build up a base for S&T development during this period. The Science and
6 For more discussions on the roles of technology suppliers and recipients in different modes of technology transfer,
see Kim (1997) pp. 100-103.
5
Technology Promotion Act and the Science Education Act were enacted in 1967 as a legal base
for government’s policies for S&T development. In the same year, the government established
the Korea Institute of Science and Technology (KIST), and in the following year, the Ministry
of Science and Technology (MOST) was created as the central government agency responsible
for S&T policy. In 1970, the government enacted the Korea Advanced Institute of Sciences Act,
on the basis of which the Korea Advanced Institute of Sciences (KAIS; currently KAIST) was
founded. KIST was the first organization in Korea for R&D in a strict sense, while KAIS first
brought US graduate education system into Korea. It was also in the 1970s that various GRIs
were established to assist industries in absorbing and assimilating technologies. In the early
stage of the development, these institutions did two important contributions: first, as mentioned
earlier, they helped industries acquire new technologies, and second, they contributed to the
building up of indigenous R&D capability by bringing back many established scientists and
engineers from abroad.
Costs and Benefits of the Korean Strategy
In sum, the industrialization of Korea in the early phase was a process of learning how to
absorb and improve upon imported foreign technologies for industrial development.
Technological learning, as opposed to indigenous technology development, was in the core of
the development strategy in the early stage. The results of such efforts were amazing. Around
the end of the 1970s, Korea’s top 20 export items included ships, semi-conductors, TV sets,
radio cassette, and so on.
The Korean approach to technology acquisition resulted in both positive and negative
effects. On the positive side, this policy enabled Korea to acquire technologies at lower costs,
and precluded the constraints often imposed by multinationals on local firms’ efforts to develop
their own capability. The approach was effective in maintaining independence from the
dominance of multinationals. Negative effect is that Korea had to give up an important access
to new technologies that might have been available through direct equity links with foreign
firms. By restricting FDI, Korea failed to adopt global standards in domestic business
6

operation.7 The most important lesson here is that had it not been for the well-educated work
force, it would not have been possible for Korea to succeed in acquiring and utilizing
technologies through informal modes of technology transfer.
Table 1 Foreign Technology Transfer to Korea, 1962–81 ($ millions) FDI FL Capital Goods
1962-66 45.4 0.8 316
1967-71 218.6 16.3 2,541
1972-76 879.4 96.6 8,841
1977-81 720.6 451.4 27,978 Source: National Statistical Office
How Korea Has Been Able to Build up Indigenous R&D Capability?
As industrial development continued into the 1980s, the technological requirements of
Korean industries became more complex and sophisticated. At the same time, it became
increasingly difficult for Korea to acquire technologies through informal channels. Even though
the government loosened its regulation of FDI and liberalized FL, it did not result in significant
increases in FDI inflow and FL. The government viewed this as a signal that to sustain the
development, it is imperative to build indigenous R&D capability. The government launched the
National R&D Program in 1982 and took various policy measures to promote and facilitate
private R&D activities.
From Technology Learning to Technology Development
Private industries responded to the changing environments by investing in R&D in a
7 Another negative effect is that large-scale loans that had been brought in instead of FDI might have contributed to
the financial crisis of 1997 (Chung and Suh 2005)
7

massive way. As a result, the relationship between technology imports and R&D changed. The
ratio of technology imports to business R&D declined sharply from about 90% in 1975 to 30%
in the mid-1980s.8 This implies that by that time Korean industries turned to indigenous R&D
for technology acquisition. R&D investment has since undergone a quantum jump. Korea’s
R&D investment, which stood at only 368.8 billion Won ($526 million, 0.81 % GDP) in 1981,
rose to 10,878 billion Won ($13.5 billion, 2.8% of GNP) in 1996, to 13,848 billion Won ($12.2
billion, 2.7% of GDP) in 2000, and to 31,301.4 billion Won ($33.7 billion, 3.47% of GDP) in
2007. Over a period of twenty-five years, investment in R&D increased over sixty times.
Korea invests in R&D a lot more of its income than others with the same or higher income.
Korea now is the 6th largest spender in R&D among OECD countries.
Trends in R&D Invesment
0
5000
10000
15000
20000
25000
30000
35000
63 70 75 80 85 90 95 00 02 04 06 07
Year
Bill
ion
Won
0
0.5
1
1.5
2
2.5
3
3.5
4
R&D InvestmentGDP Ratio
Figure 1 Trend of R&D Investments: 1963-2007
8 OECD (1996) pp. 91-92; Ratio of technology imports to business R&D was 15% in 2007. (KOITA 2008)
8

0
10
20
30
40
50
60
70
80
90
1980 1985 1990 1995 2000 2007
%
Gov
Pri
Figure 2 Changes in the Shares of Government and Industries
in Total R&D Expenditures
Private Industries Took the Lead in R&D and Innovation
Private industries account for about 75% of the nation’s gross R&D expenditures in Korea.
This means that private industries are the dominant players in R&D in Korea. In 1980, there
were only 321 industrial R&D labs with 5,100 researchers, of whom only 56 were Ph.D. degree
holders. After 27 years, the number of industrial R&D labs grew to almost 14,975, employing
over 190,000 researchers, including about 10,000 Ph.D. degree holders. (KITA 2007)
Of the total industrial R&D expenditures in 2007, manufacturing industries took up about
90%. Manufacturing R&D is largely led by electronic equipment (including office equipment,
electronic components, and communication equipment: 49.2%), automobiles (17.9%), and
chemicals (11.2%). So, electronic equipment, automobiles, and chemical industries explain
almost 80% of the manufacturing R&D, suggesting a very high concentration of manufacturing
9

R&D in a few industries.
The average R&D intensity of Korean industries was 2.43% in 2007, and that of
manufacturing industries was 2.97%. The industries that invested largest shares of their sales
in R&D include medical and precision equipment (7.5%), communication equipment (6.71%),
and electronic components (6.33%). In contrast, constructions, pulp and paper industries, food
and beverages, textile industries invested less than 1% of their sales in R&D. (Table 2)
Quite naturally, industrial research is very much focused on development (72%) and applied
research (12.6%) with the remaining 12.6% devoted to basic research. Of the total industrial
R&D, 80% were for new product development, while only 20% were for the improvement or
development of processes.
Industrial R&D activities in Korea are highly concentrated in large enterprises. Twenty
largest companies account for 55.73% of the total manufacturing R&D, top ten companies
50.2%, and top five companies 44.3%. In the case of electronic components, top 20 companies’
share is 91.4%. (Table 3) The extremely high concentration of industrial R&D is a direct
reflection of the large-firm oriented industrial structure of Korea. Top five companies in R&D
investments are Samsung Electronics, LG Electronics, Hyundai Motors, Hynix, and GM
Daewoo Auto and Technology, all of which are Chaebol companies.
Another unique feature is that the participation of foreign funds and institutions in R&D and
innovation in Korea is very limited. Probably due to the once restrictive FDI policy, foreign
funds seldom flow into Korea for industrial R&D. The proportion of foreign funds in Korea’s
industrial R&D expenditures remains at 0.3%, while in many of the OECD countries, foreign
funds accounts for more than 10% of the domestic industrial R&D outlays. (OECD MSTI,
OECD STI Scoreboard) Considering the fact that Korea is one of the major trading countries
in the world, it is rather against expectation that Korea’s international interaction in research and
technology remains at such a level.
Recovery from the Damages of Financial Crisis of 1997
R&D in Korea had been growing rapidly and continuously until Korea was hit by the
financial crisis in 1997. R&D was one of the most damaged victims of the crisis. Actually,
industrial R&D expenditures decreased by 10% in a nominal term from 884.4 billion Won in
10
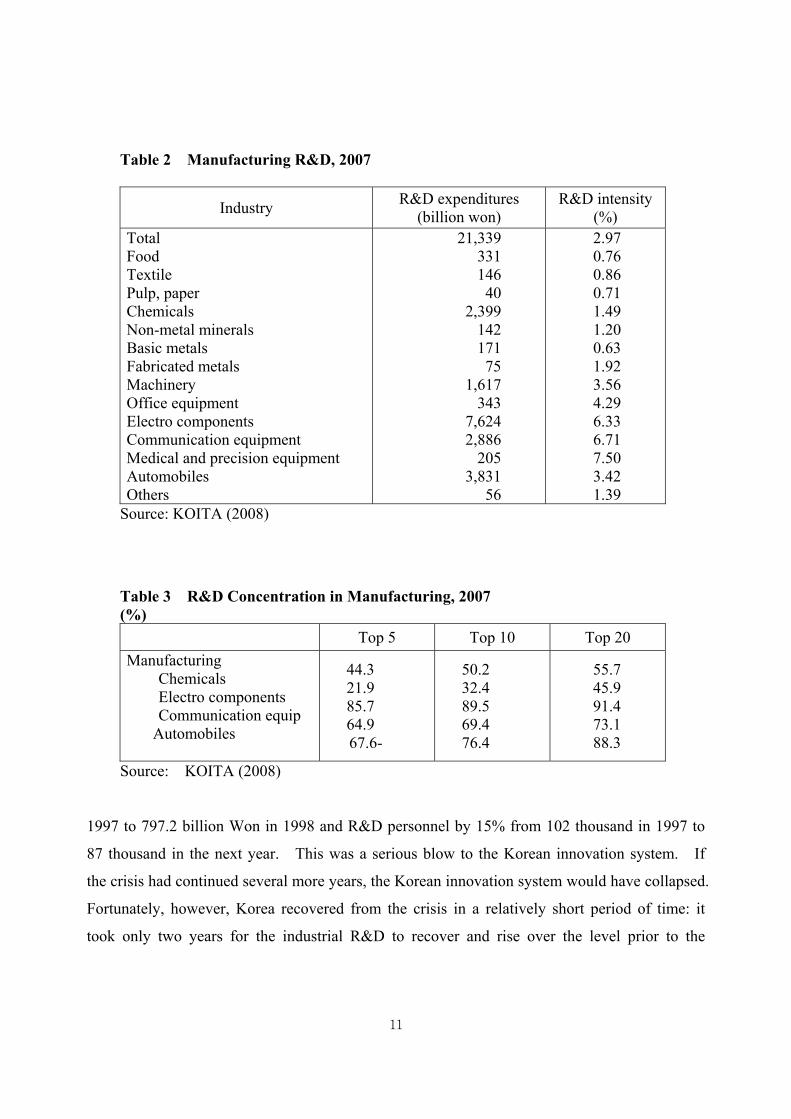
Table 2 Manufacturing R&D, 2007
Industry R&D expenditures (billion won)
R&D intensity (%)
Total Food Textile Pulp, paper Chemicals Non-metal minerals Basic metals Fabricated metals Machinery Office equipment Electro components Communication equipment Medical and precision equipment Automobiles Others
21,339 331 146 40
2,399 142 171 75
1,617 343
7,624 2,886
205 3,831
56
2.97 0.76 0.86 0.71 1.49 1.20 0.63 1.92 3.56 4.29 6.33 6.71 7.50 3.42 1.39
Source: KOITA (2008)
Table 3 R&D Concentration in Manufacturing, 2007 (%)
Top 5 Top 10 Top 20 Manufacturing Chemicals Electro components Communication equip
Automobiles
44.3 21.9 85.7 64.9 67.6-
50.2 32.4 89.5 69.4 76.4
55.7 45.9 91.4 73.1 88.3
Source: KOITA (2008)
1997 to 797.2 billion Won in 1998 and R&D personnel by 15% from 102 thousand in 1997 to
87 thousand in the next year. This was a serious blow to the Korean innovation system. If
the crisis had continued several more years, the Korean innovation system would have collapsed.
Fortunately, however, Korea recovered from the crisis in a relatively short period of time: it
took only two years for the industrial R&D to recover and rise over the level prior to the
11
financial crisis. There are two factors behind this development: one is the government’s efforts
to make up for the decrease in industrial R&D expenditures by increasing government R&D
expenditures. The share of government in the gross R&D expenditures increased from less
than 20% before the crisis to 27% after the crisis. Government R&D funds flew into private
industrial sectors, in particular, small technology-based firms and helped them maintain and
expand innovation activities. The other is the promotion of IT and IT-related ventures that led
to an IT boom in the early 2000s. The government’s commitment to IT development is well
reflected in the fact that the share of IT in government R&D expenditures rose to 33.5% in 2002
from 13% in 1997. Such a pro-IT policy fuelled innovation in IT sector, which then affected
innovation activities in other sectors. This policy not just helped the Korean innovation system
recover vitality but also resulted in promoting Korea’s transition toward an information society.
What Are the Factors behind the Rapid Growth of R&D and Innovation?
There are many factors that have contributed to the rapid increases in private sector R&D
investments. But the rapid growth in R&D expenditures can be explained by two sets of factors
– demand factors and supply factors. On the demand side, market competition placed
tremendous pressure on Korean industries for technological competitiveness. Such pressure
generated continuous demand for R&D and innovation. On the supply side, Korean industries
have been able to meet the increasing demand for R&D and innovation because they have been
financially able to do so and also because their investments have been backed up by well-trained
human resources. The government contributed to such a development in several indirect ways.
Competition best motivates R&D and innovation
First, the outward-looking development strategy (export-drive) of the government drove
domestic industries out to international market, putting them under fierce competition. In order
to survive the competition, they have had to keep up with technological changes by investing
heavily in R&D.
Many studies have shown that the more international trade-oriented a company is, the more
12

it invests in R&D and innovation. A recent study at the Science and Technology Policy Institute
(STEPI) has confirmed the relationship using the Korean Innovation Survey (KIS) data.9 The
empirical study shows that companies with higher export intensity (export volume/total sales)
tend to invest more in R&D and innovation. (Shin and others 2006) The study also found that
there exists a negative relationship between innovation activities and market concentration. In
other words, the study confirmed that companies operating in a more competitive market invest
more in R&D and innovation. This study seems to say that international competition motivates
companies to invest in innovation. But a reverse relationship may hold, too, as more
innovative companies are more likely to win international competition and sell more in the
international markets. In that sense, we can say that the two are mutually reinforcing and so the
effects of one on the other are determined simultaneously.
Chaebols’ role has been important
Second, on the supply side, the government’s industrial policy that favored large firms gave
birth to a unique business organization in Korea, “Chaebol,” which is similar to “Zaibatsu” of
Japan before WW II. Chaebols enjoy greater financial affluence owing to the economies of
both scale and scope of their business operation. Regarding the behavior of Chaebol companies
in terms of innovation, there are two conflicting arguments. One argues that in such a business
structure, the major share holder may pursue his/her private interests at the cost of other share
holders and is likely to seek short-term personal benefits rather than long-term benefits of the
company. And therefore, under such structure, innovation may not be actively pursued. The
other argument is that the business conglomerates like Chaebol may be able to reduce
transaction costs through internal transactions. In addition, they argue that Chaebol companies
can share risks, while, at the same time, pooling financial resources for major investment
projects. Furthermore, under Chaebol system, decision-making process is highly centralized and,
9 The survey (KIS 2005) covers 2,737 companies of 23 industries for the period from 2002 to 2004. The survey
follow the OECD Manual and has been authorized as a national statistics by the National Statistics Administration
of Korea.
13

therefore, they can be quicker in responding to emerging opportunities.
There have been many attempts to verify the arguments, but there are only a few studies that
directly investigate the differences in innovation behavior between companies belonging to
Chaebols and independent companies. Recently, a group of researchers at STEPI conducted a
research on this issue using the data-base of the Korea Information Service Inc covering 51,270
observations for the period of 1987-2003. (Shin and others 2006) Of the total observations,
2,064 are for Chaebol companies. The study divided the period into two – one before the
financial crisis (1987-1997) and the other after the crisis (2000-2003), because the government
changed the regulation governing the Chaebol system during the period of the economic crisis.
The new regulation bans cross- financing and cross-investment between and among Chaebol
companies, and, therefore, pooling financial resources and sharing financial risks between and
among Chaebol companies have become impossible. In other words, the Chaebol in the original
sense disappeared around the end of the 1990s.
The statistical analysis for the pre-crisis period shows that Chaebol companies are more able
and more likely to invest in R&D than independent companies. But the analysis for the post-
crisis period could not find any statistically significant differences in innovation behavior
between Chaebol companies and independent companies. This supports the argument perception
that Chaebol companies which are usually big international operators, have deeper pockets and
are able to engage in risky and expensive R&D projects that are even unthinkable for small- and
medium-sized firms.
Human resource was the key
Another supply factor is related to human resources. Korean industries have been able to
increase R&D investments at such rapidity, thanks to the abundant pool of highly-educated
manpower. Considering the fact that R&D investment is more constrained by the lack of human
resources than financial limitation in both developed and developing countries, we can say that
Korea prepared itself well for development by investing heavily in advance in education and
14

human resource development.10
Government support programs
No less important is the policy supports of the government for industrial R&D and
innovation. In order to promote private innovation, the Korean government, like many others,
offers various forms of incentives for industrial R&D and innovation.11 Overall, Korea employs
grants and tax credits as the major instruments to promote industrial R&D which are
complemented by such support programs as procurement, technical consultancy, information,
technology transfer and so on. According to a recent survey, there are currently more than 250
small and large programs to support private R&D and innovation. (Shin and others 2006)
How effective those programs have been in promoting industrial R&D is an issue of great
concern. There have been a few attempts to evaluate the effectiveness of the policy programs.12
In order to evaluate the policy programs, quantitative assessments on each of the programs is
most desired. But full-scale quantitative analysis is not practically possible due to the lack of
data. In 2006, STEPI undertook a survey of private industries to assess the effectiveness of the
government incentive programs. Using the results of the survey and the Korean Innovation
Survey (KIS 2005) data, they conducted econometric and statistical analyses. Interestingly, the
survey results and the econometric analysis using the KIS data showed a very similar result that
all categories of support programs have been effective in promoting private R&D and
innovation except for the procurement program. The econometric analysis further found the tax
incentive most effective, followed by loan program, human resource program, and technical
consultancy and so on. This is also consistent with the OECD evaluation that “Tax incentives
for R&D in Korea are generous and cover every stage: facility investment, R&D outlays,
10 There are cases where R&D investments are constrained by the shortage of suitable manpower. OECD (2003)
emphasizes the importance of the supply of skilled scientists and engineers as one of the framework conditions for
achieving R&D spending target. 11 The major legal bases for the incentives are the Technology Development Promotion Law (1967) and the
Industrial Development Promotion Law. 12 For example, Lee and Jang (1998), Song(2007), and Shin(2006)
15
technology transfer…” (Bae and Jones 2005)13
What We Reaped from the Investments?
As to the performance of R&D and innovation activities in Korea, evaluations are mixed.
Some have a negative view that Korea excels other countries in R&D inputs, say, human and
financial inputs, but lags way behind in outputs. Others say that R&D results have not been
effectively linked to industrial uses.
Despite such criticisms, one cannot deny the positive contributions that the R&D and
innovation efforts have made. Rapid growth in R&D investment has led to a remarkable
increase in patent registration. The number of KIPO (Korea Industrial Property Office) patents
increased from 1,808 in 1981 to 123,705 in 2007, more than a seven times increase in 26 years.
Furthermore, Korea ranked 4th in the world in terms of the number of 2007 PCT (Patent
Cooperation Treaty) applications, triadic patents registered in 2006, and 2007 US patents
registered. In the production of industrial property, Korea trails only after the US, Japan and
Germany. (KIPO, WIPO, OECD MSTI, USPTO) Of these, US patent is sometimes used as an
indicator of international technological competitiveness of a nation. The number of US patents
granted to Koreans was only five in 1969, but grew to 1,161 in 1995 and to 6,295 in 2007,
putting Korea at the 4th place in the world. (See Table 4) A patent analysis by the US
Department of Commerce in the late 1990s evaluated that Korea already established world
prominence in such technology areas as information/telecommunication, pharmaceuticals,
advanced materials, and automotive.14 The above statistics indicate that Korea has been rapidly
gaining in technological competitiveness.
Another important development is the remarkable increase in the number of scientific
publications in the internationally recognized academic journals. The number of scientific
made simpler and easier to13 Despite the overall effectiveness of the programs, the STEPI study assesses
that the numerous and diverse programs are so well understood by the potential users and need to be access.(STEPI
2006) 14 Albert (1998)
16

publications by Koreans reported by the Science Citation Index (SCI) increased from a mere
171 in 1980, 5,390 in 1995, 23,099 in 2005, and 25,494 in 2007. Korea now is the 12th largest
producer of SCI publications, which should be considered a phenomenal growth. (See Table 6)
R&D efforts have also contributed to the development of high-tech industries in Korea.
Korea’s technological competitiveness in semi-conductors, displays, cellular phones, computers,
telecommunication equipments and so on are partly the results of the government-industry
collaborative R&D. Considering the contribution of these technologies to the Korean exports
and economic growth, we can get a rough idea on the relationship between R&D and innovation
and the socio-economic changes in Korea.
Even though Korea acquired technological competitiveness in many of high-tech products,
its reliance on foreign core technology has not been reduced in s substantial way. For example,
Korea succeeded in commercializing the CDMA technology, but the Korean cellular phone
manufacturers have had to pay a cumulative royalty of over 5 trillion Won to Qualcomm over
the period from 1995 to 2008. (NSTC and KISTEP) So, Korea’s overseas royalty payments are
concentrated in the areas where Korea is known to have international competitiveness. It is
simply because Korea’s industrial R&D and innovation have been focused too much on
commercializing foreign technologies rather than on developing new original technologies, such
as new materials, components, devices or designs.
Table 4 Number of KIPO Patents Granted
1981 1985 1990 1995 2000 2005 2007
Number of Patents 1,808 2,687 7,620 12,512 34,956 73,512 123,705
Source: KOITA
Table5 Number of US Patents Granted to Koreans
1985 1990 1995 2000 2005 2007
Number 41 225 11,161 3,314 4,352 6,295
17

Rank in the world - 9 - - 7 4
Source: USPTO
Table 6 Number of SCI Publications
1980 1985 1993 1997 2000 2007
Number 171 1,227 2,997 9,124 12,245 25,494
Rank in the world - 37 27 17 16 12
* Source: KOITA
How R&D and Innovation Have Been Linked to Industrial Competitiveness?
In a Neo-Schumpeterian sense, success in forging industrial competitiveness through
innovation may imply a sustainable increase in the share in the market or in world trade.
(Cantwell 2003) Based on this, we can assess the contribution of R&D and innovation to
industrial competitiveness by examining how R&D and innovation affected the changes in
commodity structure of exports, and the changes in shares of major export commodities in world
trade.
Changes in Export Structure
As shown on Table 7, in the 1980s, Korea was engaged in trade of medium-low and low-
tech commodities, and gradually moved toward higher technology commodities. Now, Korea’s
exports are highly concentrated on high-tech products, such as semi-conductors,
telecommunication equipments, displays, and so on.15 The share of high-tech and high-medium-
tech products in Korea’s exports increased from 13.45% in 1980s to 43.2 in the 2000s. The
drastic changes in the technological components of Korea’s export products well explain the
technological developments Korea has gone through over the past three decades or so.
15 We follow here the OECD categorization of high-tech, high-medium-tech, medium-low-tech, and low-tech.
18

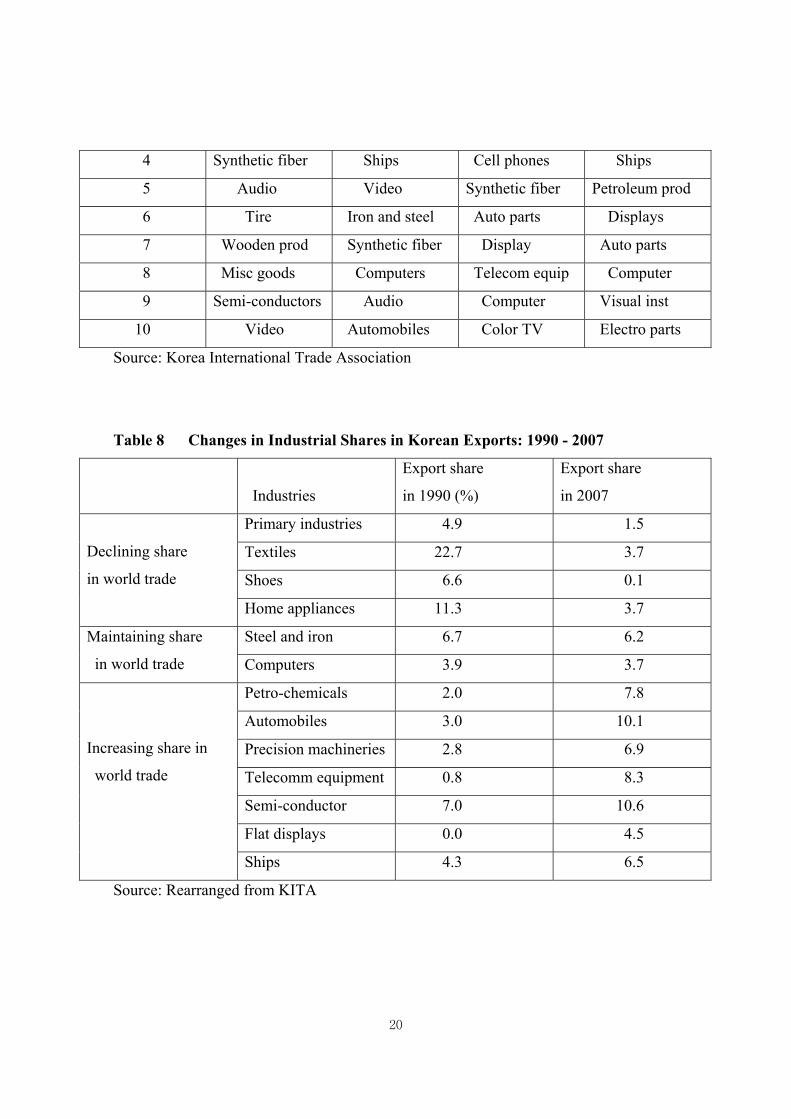
Individual industry’s contribution to exports has also changed drastically during the period
from 1990 to 2007. In the case of the primary and light industries, their shares in the total
exports have declined in a massive way. The primary industry’s share has gone down from 4.9%
to 1.5%, and textiles’ share from 26.7% down to 3.7%. On the other hand, the shares of high-
tech products have risen significantly during the period. In particular, precision machineries,
telecommunication equipments, displays and automobiles account for almost 40% of the total
exports of Korea. The highly concentrated export structure of Korea is a kind of reflection of the
highly concentrated distribution of Korea’s R&D expenditures and highly concentrated patents.
Of the Korean patents registered in 2006 (KOITA 2008), electronics and communications took
up 54.2% and machineries 15.0%, which is consistent with the data on Korean industrial R&D
expenditures which are concentrated in a few industries such as telecommunications,
transportation and so on. What is evident is that R&D-intensive industries have gained in their
market shares, while low-R&D industries have lost their pace in the international markets. This
is also confirmed by WTO data which show that Korea’s world market share has been increased
remarkably in technology-intensive products, such as office machineries, telecommunication
equipments, automotive parts and chemicals. (WTO ) Interestingly, in those areas, R&D
investments have also increased significantly in Korea.16
Table 7 Top Ten Export Commodities: 1980 - 2007
Rank 1980 1990 2000 2007
1 Apparels Apparels Semi-conductor Automobiles
2 Iron and steel Semi-conductor Automobiles Semi-conductor
3 Ships Shoes Ships Telecom equip
16 In the case of office machinery, the ratio of R&D expenditures to sales has increased from 4.74% to 6.05% in
Korea during 1990-2007, contributing to the increase in its share in world trade from 2% in 1980 to 6.1% in 2007.
More contrasting is the case of telecommunication equipments, where R&D intensity has also increased from
3.05% to 6.52% over the same period and this contributed to the change in its share in world trade from 0 in 1980
to 7.2% in 2007.
19
4 Synthetic fiber Ships Cell phones Ships
5 Audio Video Synthetic fiber Petroleum prod
6 Tire Iron and steel Auto parts Displays
7 Wooden prod Synthetic fiber Display Auto parts
8 Misc goods Computers Telecom equip Computer
9 Semi-conductors Audio Computer Visual inst
10 Video Automobiles Color TV Electro parts
Source: Korea International Trade Association
Table 8 Changes in Industrial Shares in Korean Exports: 1990 - 2007
Industries
Export share
in 1990 (%)
Export share
in 2007
Primary industries 4.9 1.5
Textiles 22.7 3.7
Shoes 6.6 0.1
Declining share
in world trade
Home appliances 11.3 3.7
Steel and iron 6.7 6.2 Maintaining share
in world trade Computers 3.9 3.7
Petro-chemicals 2.0 7.8
Automobiles 3.0 10.1
Precision machineries 2.8 6.9
Telecomm equipment 0.8 8.3
Semi-conductor 7.0 10.6
Flat displays 0.0 4.5
Increasing share in
world trade
Ships 4.3 6.5
Source: Rearranged from KITA
20

How Much R&D and Innovation Have Contributed to Economic Growth?
It is hard to estimate how much investments in R&D and innovation have contributed
to economic growth, because it involves many complex data and methodological issues.
One widely used method of measuring this was first suggested by Grilliches (1984) who
calculated the growth rate of total factor productivity (TFP) and related this to the changes
in R&D stock to measure the R&D elasticity of TFP. His estimates of R&D elasticity of
TFP ranged between 0.17 and 0.34. Coe and Helpman (1995) conducted the same
experiments using 22 OECD country data for the period of 1971-1990. They found that
the elasticity for G-7 countries was 0.234, but the estimated elasticity for OECD countries
was only 0.07, which suggests that R&D investments of G-7 countries were a lot more
efficient than those of OECD countries.
Similar attempts have been made to measure the R&D elasticity of TFP in Korea.
Kim (2004) estimated R&D elasticity of TFP in Korea for the period of 1970-2002 to be
0.13, while an earlier study by Shin (1996) came up with a higher number, 0.166. More
recently, Shin and others (2007) estimated R&D elasticities of individual OCED countries
and found that Japan is the most efficient (elasticity: 0.278-0.292) in terms of economic
contribution of R&D, followed by the US (elasticity: 0.167-0.263), and Korea (elasticity:
0.133-0.199). The elasticity for Korea turned out to be almost the same as the average
elasticity for all OECD countries (0.188). This suggests that R&D in Korea has performed
relatively well in enhancing the productivity of the economy.
There is a very interesting study in Korea (Lee and others 2007) that estimated the
R&D elasticity separately for high-tech, high-medium-tech, medium-low-tech, and low-
tech industry. They found that R&D elasticity of TFP for high-tech industry was 0.32 and
that for high-medium tech industry 0.10. But they found, interestingly, in medium-low-
tech, and low-tech industries, TFP does not respond to changes in R&D stocks, that is,
R&D does not affect the productivities in those industries.
Many economists use aggregate production function to estimate the contribution of
R&D stock to economic growth. The results of estimations vary depending on the periods
covered, data, and methods. A recent study (Lee 2008) in Korea estimates that R&D stock
accounts for 22.7% of the economic growth during the period of 1971-1990. According
21

to the study, R&D stock’s contribution to economic growth has been increasing along
with economic development. The share of R&D stock in the economic growth during the
period 1991-2006 was estimated to be 29.9%. But sometimes, study results vary too
widely to reconcile. For example, according to Hah (2004), R&D stock explains 48% of
the growth of TFP, while Bae and others (2006) came up with a result that the contribution
of R&D stock to TFP growth amounts to 82% which is much higher than that suggested
by Hah.
Table 9 Contribution to Economic Growth by Inputs
1971-1980 1981-1990 1991-2000 2001-2006
Growth(%) 6.99 8.37 5.90 4.52
Labor(%) 2.47 1.95 1.10 1.05
Capital(%) 3.29 3.08 2.75 1.43
TFP(%) 1.23 3.34 2.05 2.04
R&D (%) 1.74 1.61
Source: Lee (2008)
Achievements Korea Has Made and Challenges Ahead
What Korea Has Achieved
Korea has made enormous development in science and technology over the past four
decades. By making continuous and massive investments in R&D and innovation, Korea
succeeded in building up a unique Korean innovation system on a barren land, which will
facilitate sustainable growth of the Korean economy. The factors that have influenced the
Korean Innovation System (KIS) most are (1) outward-looking development strategy, (2) large-
firm oriented industrial policy, and (3) human resources, among many others. These are also the
sources of the strength and weakness of KIS.
The very strength of KIS is its dynamism that is fueled by the strong commitment of the
22

government to “technology-based national development” and private industries’ efforts for
competitiveness. Despite the short history of R&D, Korea has already harvested rich crops from
the endeavor in the forms of patents, scientific papers, and exports of technology-intensive
products, such as semiconductors, cellular phones, LCD, automobiles, and others. These
achievements have been the sources of growth in the past and will function as a base for further
growth in the future.
But Challenges Are There, Too
Yet there are problems, too. R&D activities in Korea have grown very rapidly, led by
private industries under active promotion policy of the government. Even though Korea
spends a larger share of GDP on R&D than other countries, it still lags far behind advanced
industrial countries in terms of the cumulative R&D stock which is really the determinant of a
nation’s knowledge power. The challenge is how to overcome the disadvantage of being a late
starter.
Second, the weakness in basic sciences poses a fundamental problem for KIS, because
scientific capability determines the technological potential of a nation. Since the Korean R&D
efforts have been devoted overly to industrial technology development, scientific research has
been more or less neglected. The lack of strong scientific base already works as a limit to
technological progress in Korea. The weakness in science as a matter of fact results not just
from the funding policy that favors technology development but also from weak university
research capability. Therefore, strengthening university research base poses one of the major
policy challenges.
Third, excessive reliance on private industries for R&D investments has made the
innovation system very vulnerable in two ways. On the one hand, the system places so much
emphasis on applied research and development that it failed to build up a strong foundation
required for the long-term development of science and technology. On the other hand, the
R&D system responds too sensitively to changes in economic and business environments. For
instance, large Korean enterprises responded to the financial crisis of 1997 by cutting their
R&D spending by about 14 %, destabilizing the R&D system. If the crisis had continued for
several more years, the whole system would have collapsed.
23

Fourth, the Korean innovation system needs to be made more open to the outer world.
Korea accounts for about 3% of the world R&D activities, which means that 97% of the world’s
R&D activities are taking place outside Korea. In order to access to the new knowledge, ideas
and technology generated and produced outside the country, Korea need to open the system
more and promote interactions with foreign scientists and institutions. The current level of
international interaction of Korea, which is the lowest among OECD countries, if not checked,
will work as a barrier to further growth of Korea into the future.
Fifth, the extremely high concentration of R&D activities poses a serious problem. High
concentration means that only a few large firms are actively involved in R&D, while others are
not. If this persists for long, this will dichotomize Korean industries into technologically
advanced and retarded firms and sectors. This will result in reducing inter-firm and inter-
industry interactions that are the key elements of innovation. This is important because even
Chaebol companies would not be able to sustain competitiveness without technologically strong
domestic SMEs.
Any Lessons to Offer?
Korean experiences offer some lessons for policy-makers responsible for education, trade,
and technology development of developing countries. There is no doubt that education builds
a nation’s ability to absorb new knowledge and technology. Education gives rise to
individual’s initial tacit knowledge, which is an essential building block in technological
learning. So, the government should assume full responsibility for the promotion of human
resource development. Investing in education in advance, as Korea did in the 1960s and 1970s,
is essential in laying a foundation for industrial development. As an economy develops toward
an advanced level, technological competence becomes a critical factor. To build up the
competence, it is required to nurture high-caliber scientists and engineers who are capable of
dealing with the developments at scientific and technological frontiers. In other words,
advanced education in science and technology should come first in preparing for entrance into a
developed world. In the case of Korea, education and industrialization helped each other in
sustaining and accelerating mutual development. Education made technological learning and
therefore industrialization possible, while industrialization enhanced the rate of return on
24
investment in education, further promoting demand for education.
Korea’s industrialization evolved from imitation to innovation. In the initial stage, Korean
industries attained technological capability through informal channels for technology transfer,
such as OEM production arrangements, reverse engineering of imported machines, technical
training as part of turn-key plant importation, and so on. Contrary to the experiences of other
developing countries, FDI played a modest role in technological learning in the course of
development in Korea. To lay the initial technological foundation, many Korean industries
resorted to non-market processes, relying on the technological absorptive capacity of their
workers for technology acquisition. This approach enabled them to acquire technology at
lower cost and maintain independence in business operation. But Korea had to pay a great cost
for this – it had to abandon many of the technological opportunities that foreign direct investors
might have offered.
By adopting an outward-looking development strategy, the government drove Korean
industries out into competitive international market, putting them under great pressure for
technological learning and/or development. Korean industries responded to such pressures by
investing heavily in technology development. By developing technological competence, they
have been able to survive international competition, and establish world prominence in such
high-technology areas as telecommunications, semi-conductor memory chips, LCD,
automobiles, shipbuilding, and so on. Protectionist policy may be effective in creating initial
market opportunities for domestic industries, but if such a policy is prolonged, industries will
develop immunity against market pressure for innovation. It may be for this reason that
export-oriented firms achieved technological learning more rapidly than import-substituting
firms
Since the early 1960s, the government has played a key role in Korea’s development. The
government first initiated science and technology development as part of the national economic
development plan, and has led the development, not just as a rule-setter but also as a target-
setter as well as a financier. But as industrial development proceeds, it has become increasingly
difficult for the government to intervene in economic as well as R&D activities because of the
increased scale and complexity of industrial activities. Therefore, the pattern of government
intervention in science and technology had to change from direct involvement as a target-setter
25

and commander-in-chief type leader to indirect involvement as a facilitator and promoter
In sum, Korea owes very much to its human resource and the outward-looking
development strategy for the technological development and industrialization. Two major
lessons form the Korean experiences are: First, human resource is the key to science and
technology development and thus to economic growth, and second, nothing can better motivate
private businesses to invest in technology development than market competition. But for
Korea to sustain the past development into the future, it has to further strengthen basic scientific
research capability and improve framework conditions for innovation, the core of which is
competitive market.
References
Albert, M.B. 1998, The New Innovators: Global Patenting Trends in Five Sectors,
US Department of Commerce, Washington DC
Amsden, A. 1989, Asia’s Next Giant, South Korea and Late Industrialization, Oxford:
University Press
Ahn, Choong-Yong. 1991, “Technology Transfer and Economic Development: the Case
of Korea,” in Minden, K. (Ed), Pacific Cooperation in Science and
Technology, Honolulu: East West Center,
Bae, Y. and Jones, R.S. 2005. “Sustaining High Growth through Innovation, Reforming
the R&D and Education System in Korea,” OECD Economics Department
Working Paper No 470, OECD, Paris
Bae, Y. and others. 2006. Innovation Strategy for Growth and Job Creation, STEPI Policy
Report 06-05, STEPI, Seoul (Koran)
Cantwell, J. 2003. “Innovation, Competitiveness and Growth,” Chapter 21 in Fargerberg,
J., D. C. Mowery, R. R. Nelson (Eds), Handbook of Innovation, Oxford:
Oxford University Press
Chung SC and L.M. Branscomb. 1996, “Technology Transfer and International
26
Cooperation,” in Branscomb and Choi (Ed), Korea at the Turning Point,
Westport: Praeger
Chung SC and J. Jang. 1993, Gisul Gaebal Tujaeu Kyungjejok Hyogwa Bunsuk (The
Economic Effects of R&D), Policy research 93-04, STEPI, Seoul (Korean)
Cohen, D. and M. Soto. 2001, “Growth and Human Capital: Good Data, Good Results,”
Technical Paper No. 179, OECD Development Center, Paris
Grilliches, Zvi., and F. Lichtenberg. 1984. “R&D and Productivity Growth at the Industry
LevelL Is there still a relationship?,” Zvi Grilliches (Ed) R&D, Patents, and
Productivity, Chicago: Chicago University Press
Hah, J. 2004. “Analysis of the Economic Effects of R&D,” Kyung-je Bun-suk, Kora
Financial Institute, Seoul (Korean)
Hobday, M. 1995, Innovation in East Asia: The Challenge to Japan, Aldershot: Edward
Elgar,
KEDI(various years), Educational Statistical Yearbook, KEDI, Seoul
Kim, Linsu. 1997, Imitation to Innovation, The Dynamics of Korea’s Technological
Learning, Cambbridge: Harvard Business School Press
Kim, L. and C. Dahlman. 1992, “Technology Policy for Industrialization: An Integrative
Framework and Korea’s Experience,” Research Policy (21), 437-452
Kim,W. 2004. Possibility of Productivity Loss Due to Ageing Population and Policy
Implications,” San-up-Kyung-je-Wol-bo No 329 (Korean)
Kim, Young-Gul (1996), “Innovation and the Role of Korea’s Universities,” in
Branscomb, L. and Y. Choi (Ed), Korea at the Turning Point, West Port:
Praeger,
KOITA (various years), Major Indicators of Industrial Technology, Seoul
Koo, Bohn-Young (1986), “Role of Government in Korea’s Industrial Development,” in
Lee, K. (Ed), Industrial Development Policies and Issues, KDI, Seoul
Lee, W-Y and J. Jang (1998), Sanup Gisul Gaebal Jiwon Jedoeu Jonghap Pyonggawa
Gaesun Bangan (Evaluation of the Government Supports for Industrial
Innovation and Policy Implication), Policy research 98-10, STEPI,
Seoul (Korean)
27

Lee, W. and others 2007. Technological Innovation Strategy and Policy Agenda to
Strengthen Economic Growth Potential, STEPI Policy Report 07-12, STEPI,
Seoul (Korean)
Leipziger, D.M. and V. Thomas. 1993, The Lessons of East Asia, An Overview of
Country Experiences, World Bank, Washington, DC
MOST (various years), Report on the Survey of R&D in Science and Technology,
Seoul
_____ 1997, Tukjung Yongu Gaebal Saub Shihaeng 15 Nyun (Fifteen Years of the
National R&D Program), Seoul (Korean)
______2004, 2004 Gisul Hyuksin Jiwon Jedo (Support programs to promote innovation)
, MOST, Seoul (Korean)
NSTC. 2004, “2005Nyundo Gukka Yungu Gaebal Tuja Usun Sunwi Suljung Yungu”
(National R&D Priority Setting for the Year 2005) (Korean), NSTC, Seoul
Nadiri, I.M. 1993, “Output and Labor Productivity, R&D Expenditure and Catch-up
Scenarios: A Comparison of the US, Japanese, and Korean Manufacturing
Sectors,” Mimeo, Department of Economics, New York University
OECD .1996, Review of National Science and Technology Policy, Republic of Korea,
OECD, Paris
_____ 2003, “Meeting R&D Funding Targets: Policy Implications,” DSTI/STP (2003)2,
OECD, Paris
Shin, T. and others. 2006. The Determinants of Technological Innovation in
Manufacturing Industries and Policy Implications, Policy Report 2006-02,
STEPT, Seoul (Korean)
Shin, T. and others. 20-6. A Comprehensive Appraisal of Policy Support Programs for
Technological Innovation, STEPI Policy Report 2006-04. STEPI, Seoul
Shin, T. 1996. Economic Impacts of R&D Budgets, STEPI policy paper 96-07, STEPI,
Seoul (Korean)
Song, Byung-Nak .1990, The Rise of Korean Economy, Hong Kong: Oxford University
Press
Stewart, F. 1978, Technology and Underdevelopment, London: Macmillan
28

Vernon, R. 1977, Storm over Multinationals, Cambridge: Harvard University Press
Websites: USPTO, WTO, KIPO, KOITA, KITA
29