innovation and growth in the lagging regions of europe: r ... · observations 1,451 1,451 995 995...
TRANSCRIPT

Innovation and Growth in the Lagging Regions of Europe
Neil Lee
London School of Economics

Introduction
• Innovation seen as vital for growth in Europe (Europa 2020) – Economic growth – Narrowing disparities
• Innovation highly uneven geographically
• “Lagging regions” may find it harder to translate inputs into
innovation
• Does the impact of innovation on economic growth differ in different regions?
• Is innovation a viable strategy for lagging regions?

Growth theories and innovation
• Neo-classical model
• Endogenous growth theory
• New Economic Geography
• Evolutionary economics
Theoretical work on innovation
• Camagni (1995) suggested that lagging regions lacked the ‘innovative milieu’ which helps create innovation
• Rodriguez-Pose (various) innovation ‘prone’ and averse societies
– ‘Social filter’ – conditions innovation / growth relationship

Empirical evidence (1)
• Crescenzi (2005)
– European regions, 1990 – 2003
– Innovation (index) impact different according to regional conditions (peripherality / education)
• Sterlacchini (2008)
– European regions, 1995 – 2002
– Innovation (R&D) only impacts on growth beyond threshold GDP
– Impact differs Northern / Southern Europe
• Antonelli et al. (2011)
– Total factor productivity (TFP) in European regions
– Show an ‘inverted u-shaped’

Empirical evidence (2)
• Firm level evidence
– Frenkel (2000) local environments important and access to innovative inputs important in helping firms succeed
– Beugelsdijk (2007) firm level factors more important than local context
– Lee and Rodriguez-Pose (under review) context can matter - ‘creative’ employment related to innovation activity in local firms

Gaps
• Evidence often dated e.g. Sterlacchini (2008) considers 1995 – 2002
• Much more evidence on drivers of innovation (e.g. Crescenzi and Rodríguez-Pose, 2013) than link innovation / growth
• Mostly focused on cross-sectional evidence

The data
• NUTS2 regions
• Eurostat Regio database
• Countries only included if 7 + regions (to allow calculation of ‘lagging’)
• Sample: unbalanced panel of 191 regions, 12 countries
Defining “lagging regions”
• Lagging regions –
– Less than 75% of national average GDP in the based year (1998)
– 52 lagging regions, from 191 (27%)
• Alternative measures –
– Structural funds
– Peripherality

Sample of regions by country
Country Not-lagging Lagging Total
Belgium 8 (73) 3 (27) 11
Czech Republic 6 (75) 2 (25) 8
Germany 25 (73) 9 (27) 34
Greece 9 (69) 4 (31) 13
Spain 14 (73) 5 (27) 19
France 16 (73) 6 (27) 22
Netherlands 9 (75) 3 (25) 12
Poland 11 (69) 5 (31) 16
Portugal 5 (71) 2 (29) 7
Romania 6 (75) 2 (25) 8
Sweden 6 (75) 2 (25) 8
UK 24 (73) 9 (27) 33
Total 139 (73) 52 (27) 191
Parenthesis give share of regions by country.

Defining innovation
• Patenting – Accounts for ‘technological frontier’ – But biased by sector – Only 6 percent of innovation active firms patent (Hall et al. 2013) – Variable: Total patents (linear interpolation)
• Research and development. – An input rather than an output – Biased by sector – Also can be used to ‘assimilate’ innovations from elsewhere – Variable: Total R&D expenditure (log) [not per GDP/ capita]
• Missing values filled with linear interpolation
The model
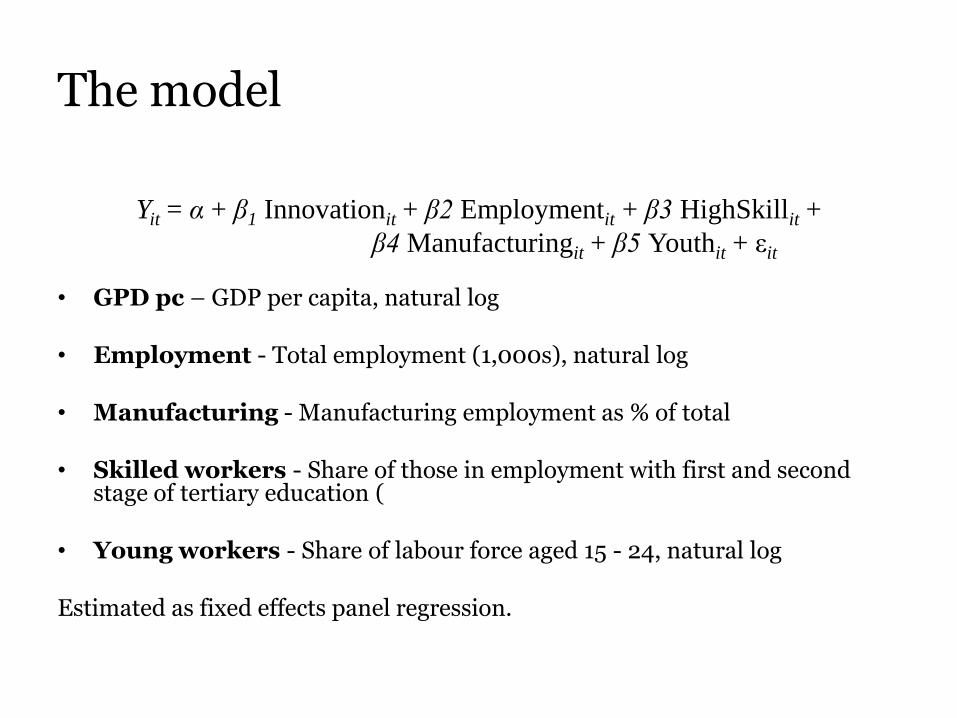
Yit = α + β1 Innovationit + β2 Employmentit + β3 HighSkillit +
β4 Manufacturingit + β5 Youthit + εit
• GPD pc – GDP per capita, natural log • Employment - Total employment (1,000s), natural log
• Manufacturing - Manufacturing employment as % of total
• Skilled workers - Share of those in employment with first and second
stage of tertiary education (
• Young workers - Share of labour force aged 15 - 24, natural log
Estimated as fixed effects panel regression.
Does innovation have different effects in lagging regions?

Panel estimation: Patenting & regional growth (1) (2) (3) (4) (5)
Dependent variable: GDP per capita, natural log
Patents per capita (ln) 0.0841*** 0.0493*** 0.0396*** 0.0558***
(0.0158) (0.0122) (0.0134) (0.0182)
Patents per capita (ln) * Non-lagging
0.0939***
(0.0225)
Patents per capita (ln) * Lagging
0.0664***
(0.0183)
Total employment (ln) -0.106 -0.255 -0.0553
(0.129) (0.317) (0.124)
Manufacturing (%) 0.0115* 0.0149** 0.0105
(0.00680) (0.00678) (0.00885)
Skilled workers (%) 0.242*** 0.322** 0.224**
(0.0728) (0.149) (0.0919)
Young workers (%) -0.379*** -0.275** -0.405***
(0.0593) (0.118) (0.0728) Constant 9.295*** 9.280*** 9.775*** 10.49*** 9.097***
(0.0655) (0.0740) (0.837) (2.066) (0.815)
Sample Full Full Full Lagging Non-lagging
Observations 1,451 1,451 1,451 398 1,053
R-squared 0.669 0.670 0.751 0.756 0.753
Number of NUTS2 176 176 176 46 130
Estimated as fixed effects panel regressions. All regressions include year dummies. Robust standard errors in parentheses. *** p<0.01, ** p<0.05, * p<0.1

Panel estimation: R&D & regional growth (1) (2) (3) (4) (5)
Dependent variable: GDP per capita, natural log
R&D (ln) 0.229*** 0.173***
(0.0473) (0.0423)
R&D (ln) * Non-lagging
0.248*** 0.248*** 0.188***
(0.0535) (0.0535) (0.0481)
R&D (ln) * Lagging
0.195*** 0.195*** 0.147**
(0.0652) (0.0652) (0.0599)
Total employment (ln) -0.0741 -0.0744
(0.118) (0.118)
Manufacturing (%) 0.0139** 0.0138**
(0.00622) (0.00603)
Skilled workers (%) 0.171** 0.176**
(0.0724) (0.0713)
Young workers (%) -0.307*** -0.301***
(0.0573) (0.0568) Constant 8.493*** 8.427*** 8.808*** 8.427*** 8.603***
(0.241) (0.237) (0.694) (0.237) (0.692)
Sample Full Full Full Full
Observations 1,013 1,013 1,013 1,013 1,013
R-squared 0.745 0.747 0.783 0.747 0.784
Number of NUTS2 173 173 173 173 173
Estimated as fixed effects panel regressions. All regressions include year dummies. Robust standard errors in parentheses. *** p<0.01, ** p<0.05, * p<0.1

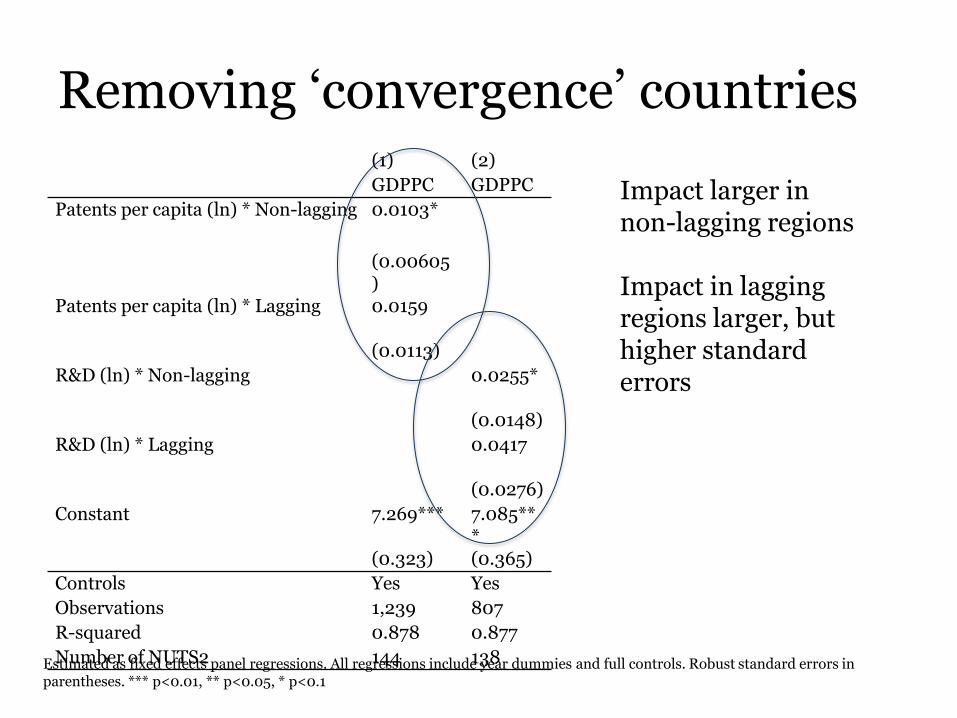
Removing ‘convergence’ countries (1) (2)
GDPPC GDPPC
Patents per capita (ln) * Non-lagging
0.0103*
(0.00605)
Patents per capita (ln) * Lagging
0.0159
(0.0113)
R&D (ln) * Non-lagging
0.0255*
(0.0148)
R&D (ln) * Lagging
0.0417
(0.0276)
Constant 7.269*** 7.085***
(0.323) (0.365)
Controls Yes Yes
Observations 1,239 807
R-squared 0.878 0.877
Number of NUTS2 144 138 Estimated as fixed effects panel regressions. All regressions include year dummies and full controls. Robust standard errors in parentheses. *** p<0.01, ** p<0.05, * p<0.1
Removing ‘convergence’ countries (1) (2)
GDPPC GDPPC
Patents per capita (ln) * Non-lagging
0.0103*
(0.00605)
Patents per capita (ln) * Lagging
0.0159
(0.0113)
R&D (ln) * Non-lagging
0.0255*
(0.0148)
R&D (ln) * Lagging
0.0417
(0.0276)
Constant 7.269*** 7.085***
(0.323) (0.365)
Controls Yes Yes
Observations 1,239 807
R-squared 0.878 0.877
Number of NUTS2 144 138
Impact larger in non-lagging regions Impact in lagging regions larger, but higher standard errors
Estimated as fixed effects panel regressions. All regressions include year dummies and full controls. Robust standard errors in parentheses. *** p<0.01, ** p<0.05, * p<0.1

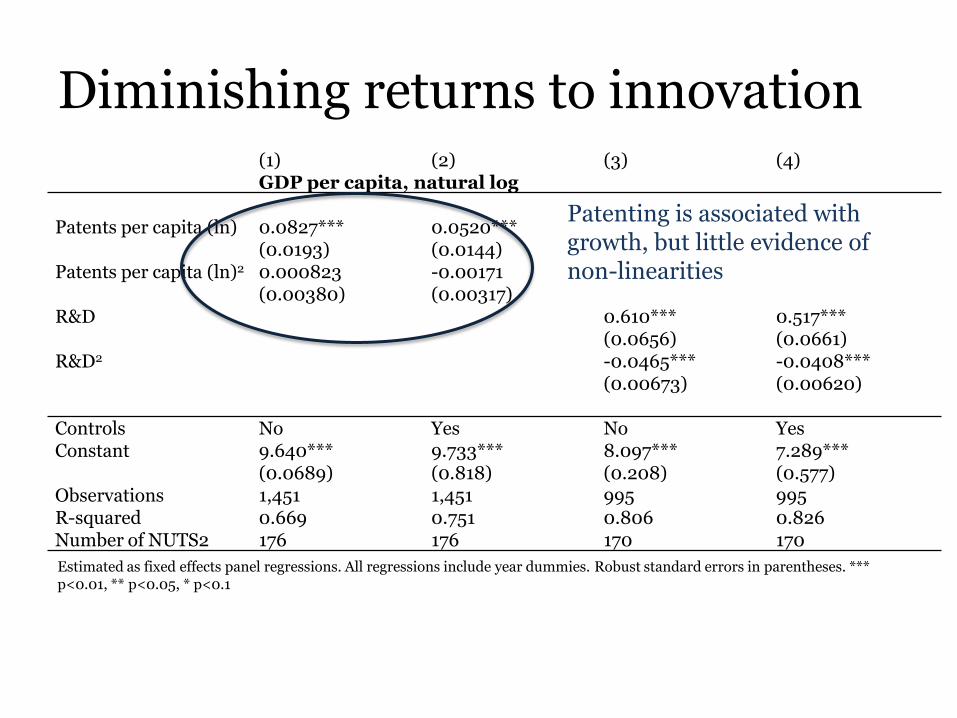
Diminishing returns to innovation?

Diminishing returns to innovation (1) (2) (3) (4)
GDP per capita, natural log Patents per capita (ln) 0.0827*** 0.0520*** (0.0193) (0.0144) Patents per capita (ln)2 0.000823 -0.00171 (0.00380) (0.00317) R&D 0.610*** 0.517*** (0.0656) (0.0661) R&D2 -0.0465*** -0.0408*** (0.00673) (0.00620)
Controls No Yes No Yes Constant 9.640*** 9.733*** 8.097*** 7.289*** (0.0689) (0.818) (0.208) (0.577) Observations 1,451 1,451 995 995 R-squared 0.669 0.751 0.806 0.826 Number of NUTS2 176 176 170 170
Estimated as fixed effects panel regressions. All regressions include year dummies. Robust standard errors in parentheses. *** p<0.01, ** p<0.05, * p<0.1
Patenting is associated with growth, but little evidence of non-linearities

Diminishing returns to innovation (1) (2) (3) (4)
GDP per capita, natural log Patents per capita (ln) 0.0827*** 0.0520*** (0.0193) (0.0144) Patents per capita (ln)2 0.000823 -0.00171 (0.00380) (0.00317) R&D 0.610*** 0.517*** (0.0656) (0.0661) R&D2 -0.0465*** -0.0408*** (0.00673) (0.00620)
Controls No Yes No Yes Constant 9.640*** 9.733*** 8.097*** 7.289*** (0.0689) (0.818) (0.208) (0.577) Observations 1,451 1,451 995 995 R-squared 0.669 0.751 0.806 0.826 Number of NUTS2 176 176 170 170
Estimated as fixed effects panel regressions. All regressions include year dummies. Robust standard errors in parentheses. *** p<0.01, ** p<0.05, * p<0.1
Strong evidence of diminishing returns to R&D
Link between R&D and patents

Impact of R&D on patenting (1)
Patents (ln)
R&D (ln) – Not lagging
0.312* (0.167)
R&D (ln) – Lagging 0.412*** (0.121)
Constant 2.040*** (0.717)
Obs 995
NUTS2 170
R2 0.4805
Estimated as fixed effects panel regressions. All regressions include year dummies. Robust standard errors in parentheses. *** p<0.01, ** p<0.05, * p<0.1

Some conclusions (1)
• Innovation has less of an impact on growth in lagging regions
• This applies for both an input (R&D) and an output (patents)
• However, difference is marginal - impact is still positive in (most) lagging regions
• But impact may be more variable

Some conclusions (2)
• Evidence of diminishing returns of R&D – Input into innovation, rather than output – But would be expected to help absorb innovation from elsewhere
• Less evidence of patenting – Output measure of innovation – Patents indicate position on frontier
• Quantile regression evidence (not shown) suggests even impact
• Tentative evidence R&D may lead to innovations in lagging regions (but no controls for ‘social filter’)
Some conclusions (3)
• Does not imply innovation has no impact on economic growth in lagging regions
• Actually, if value growth more in lagging regions trade-offs may be finer
• Highlights the equity versus efficiency trade-off

Some limitations
• Lagging regions variable – endogeneous?
• Lack of controls for convergence – GMM-SYS / removing eastern europe
• Interpolated values – but checks show unimportant