innovation and entrepreneurship: structural determinants ... · innovation and entrepreneurship :...
TRANSCRIPT
innovAtion And entrepreneurship : structurAl determinAnts of competitiveness
61
Innovation and entrepreneurship : structural determinants of competitiveness
B. robert
Introduction
In the context of a globalised and increasingly competitive economy, with shifting structural boundaries, innovation is a cornerstone of policy and regarded as the predomi-nant means of sharpening the competitive edge of the European and individual national economies. Stimulation of entrepreneurial spirit is another policy ingredient that is frequently added to it. Innovation and entrepreneurial spirit are thus at the heart of the process of structural reforms fostered by international organisations such as the OECD (Going for Growth) or the EU (Lisbon strategy).
This article aims to examine the complexity of these two essential drivers of economic growth and, in par-ticular, to shed light on innovation as a process involving multiple players and elements of the general economic operating framework. At the same time, it will report on the distinctive characteristics of innovation in Belgium.
In the first section, the article defines innovation and explains its role as a determinant of economic growth. It then proceeds to draw extensively on the results of the fourth Community Innovation Survey (CIS4). That survey, conducted under the aegis of the European Commission (EC), questions European enterprises about their innovation activity and offers an overall view of the innovation process and its various elements. It offers an original view of innovation in Belgium, positioning it in relation to the three main neighbouring countries and the EU.
The second section deals with innovation expenditure, primarily that relating to R&D. The specific measure of innovation according to the CIS, namely the introduction by an enterprise of a product or process which is new for itself or significantly improved, is discussed in the third section, revealing how the size of the enterprise and the branch of activity in which it operates influence both the innovative activity and the various stages of the process. The following section reviews other elements of the inno-vation process such as the information sources used and cooperation efforts made by the enterprise, the obstacles encountered and the final effects of the innovation for the enterprise.
The last two sections examine the policies which may be adopted to promote innovation. Many policies which affect the general framework of economic activity may influence innovation. Moreover, specific policies may be pursued. The fifth section focuses on public aid for inno-vation and the question of intellectual property rights. The final section discusses the key role played by entre-preneurship as the catalyst of innovation.
1. Innovation : definition, role and process
1.1 Definition
Innovation often implies new technology, but though innovation usually has a technological aspect, it would be wrong to consider that it comprises that alone, still less
innovAtion And entrepreneurship : structurAl determinAnts of competitiveness
62
just R&D activities. According to Berkhout et al. (2006), cited by Johansson et al. (2007), innovation needs science, both pure and applied, it needs development of a product in both its technical and social aspects, and it needs entre-preneurship, this last element being crucial.
In line with the OECD’s Oslo Manual, which aims to establish guiding principles for the collection and use of data on innovation activities in industry, the CIS defines innovation as the introduction of a product or production process which is new for the enterprise or significantly improved on the basis of technological knowledge. Innovation can therefore be considered primarily as a process, often protracted, aimed at applying knowledge ; this article will endeavour to explain the various stages of that process.
The innovation process is complex and implies multiple interactions between agents from various spheres (enter-prises, universities, governments, consumers, etc.). The idea of a linear process leading from R&D conducted in isolation by an enterprise to a patented invention, and then to the development and marketing of a new product exploiting that invention, belongs to the past. Consequently, the increase in R&D expenditure does not automatically lead to an improvement in the innova-tive performance of an economy, even though there is, broadly speaking, a positive link between these variables.
While innovation has an essential aspect of newness, the latter can be assessed at various levels : a product can be new to the firm making it, new to the market on which it is offered, or – in absolute terms – new to the world. An innovation can also be presented in multiple forms, just as the innovators do not constitute a homogenous group (Srholec and Verspagen, 2008). It is often technological, based on the R&D carried out by the firm or on absorp-tion of technologies developed elsewhere. Depending on the case, it will aim to improve an existing product or extend the range of products offered by the firm. While some radical innovations, such as the steam engine, are destined to take the economy into a new era, most inno-vations are more modest and incremental in character. Finally, an innovation may also be largely independent of technology, in cases where an enterprise reviews its method of internal organisation or arrangements with external partners, changes the presentation of its product or alters its strategy for bringing it to the market.
Owing to the length of the process, particularly in the case of R&D activities, innovation comprises a large element of uncertainty which is difficult to quantify in advance. That uncertainty is assessed and borne by economic agents presenting the typical characteristics of entrepreneurs.
1.2 Role of innovation in productivity and growth
The attention paid to innovation by economic growth the-ories has varied over time, as is succinctly demonstrated in Box 1. After the Second World War, the sustained growth of the “Thirty Glorious Years” was clearly based on the accumulation of production factors via full employment and extensive capitalisation of the production facilities. In the global economy based on knowledge and informa-tion, innovation is now considered the cornerstone of long-term economic growth, in addition to the expansion of the labour force. Development of an economy’s innova-tive potential via technological progress and the training of its human capital should lead to expansion of the range of products offered and improve their quality to make them attractive to external demand and to satisfy new consumption requirements.
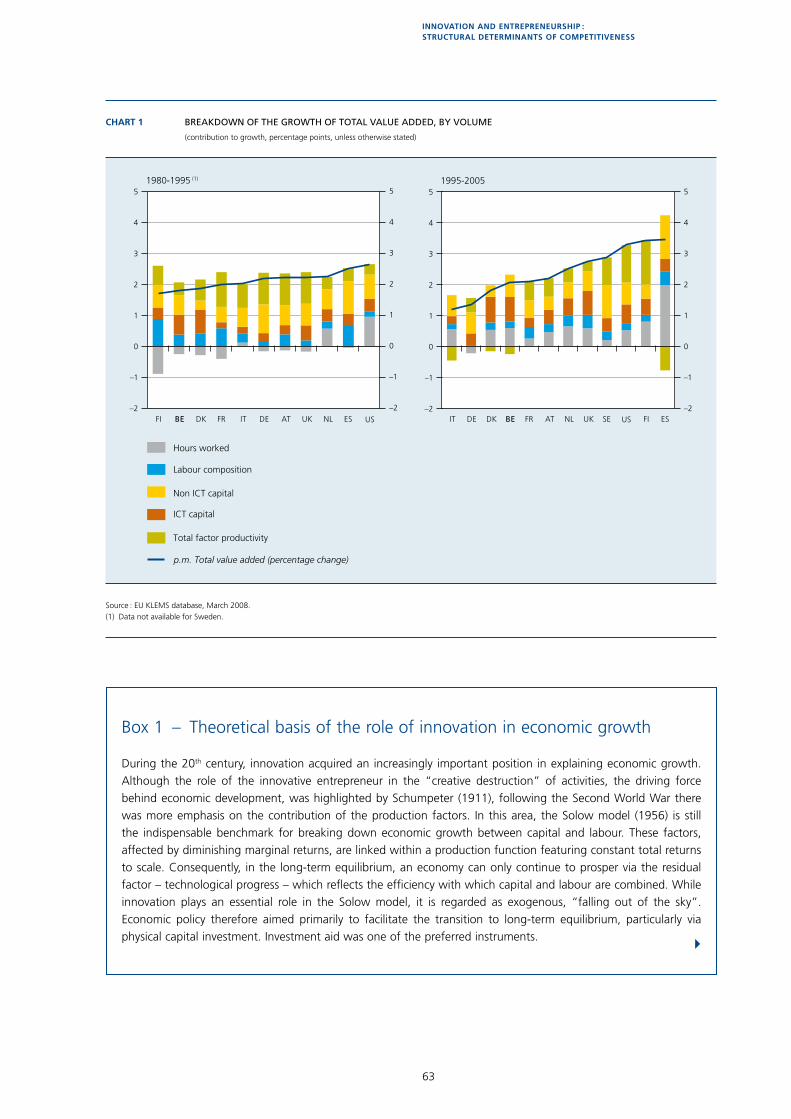
Observation of the sources of growth in recent decades in a number of European countries and in the United States confirms the growing importance of innovation. During the 1980-1995 period, economic growth was based largely on the accumulation of non-technological capi-tal, while the contribution of the volume of labour was negative in most of the countries considered. Growth, which was higher overall between 1995 and 2005, also appeared to be more widely dispersed between countries during this period. In the most dynamic countries – except Spain – it was driven by total factor productivity, tradition-ally associated with technological progress and – more generally – with innovation. In Sweden, the United States and Finland, the countries with the heaviest expenditure on R&D, the annual contribution to economic growth made by total factor productivity averaged between 0.9 and 1.4 percentage point ; on the other hand, it was negative in several countries, including Belgium where it was minus 0.3 percentage point. At the same time, the contribution of hours worked often proved to be greater than in the past, reflecting the employment policies ; how-ever, it was accompanied by a smaller contribution from the labour composition, possibly because less productive persons were being put to work.
innovAtion And entrepreneurship : structurAl determinAnts of competitiveness
63
FI BE DK FR IT DE AT UK NL ES–2
–1
0
1
2
3
4
5
–2
–1
0
1
2
3
4
5
IT DE DK BE FR AT NL UK SE FI ES–2
–1
0
1
2
3
4
5
–2
–1
0
1
2
3
4
5
p.m. Total value added (percentage change)
1995-20051980-1995 (1)
Hours worked
Labour composition
ICT capital
Non ICT capital
Total factor productivity
CHART 1 BREAKDOWN OF THE GROWTH OF TOTAL VALUE ADDED, BY VOLUME
(contribution to growth, percentage points, unless otherwise stated)
Source : EU KLEMS database, March 2008. (1) Data not available for Sweden.
US US
Box 1 – Theoretical basis of the role of innovation in economic growth
During the 20th century, innovation acquired an increasingly important position in explaining economic growth. Although the role of the innovative entrepreneur in the “creative destruction” of activities, the driving force behind economic development, was highlighted by Schumpeter (1911), following the Second World War there was more emphasis on the contribution of the production factors. In this area, the Solow model (1956) is still the indispensable benchmark for breaking down economic growth between capital and labour. These factors, affected by diminishing marginal returns, are linked within a production function featuring constant total returns to scale. Consequently, in the long-term equilibrium, an economy can only continue to prosper via the residual factor – technological progress – which reflects the efficiency with which capital and labour are combined. While innovation plays an essential role in the Solow model, it is regarded as exogenous, “falling out of the sky”. Economic policy therefore aimed primarily to facilitate the transition to long-term equilibrium, particularly via physical capital investment. Investment aid was one of the preferred instruments.
4
64
In order to allocate a central role to R&D and innovation, it was necessary to explain their origins. The “endogenous growth” movement which flourished from the latter half of the 1980s as an extension of the Solow model, aimed to satisfy this requirement in order to develop models based on a production function with increasing total returns. These were obtained successively by postulating the presence of externalities in the production of knowledge considered to be a public good (Romer, 1986), or by suggesting the existence of monopolistic returns on innovation (Romer, 1990). Aghion and Howitt (1992) added a Schumpeterian dimension by stipulating that each innovation replaces the previous one, thereby eliminating the existing returns. Since R&D is more or less certain to lead to innovation, a policy of promoting R&D, possibly within large structures favouring economies of scale, and the protection of its results via patents, appeared justified.
However, empirical reality demolished the idea of an automatic link between R&D and economic growth, as in recent decades total factor productivity in the advanced economies has not risen at the same rate as the number of staff allocated to R&D. Even within the “endogenous growth” movement, Jones (1995) considered that the diminishing returns of R&D were attributable in particular to the significance of the “fishing out effect” : the most accessible knowledge has already been discovered.
The conditions and framework surrounding R&D activity are nevertheless just as important as the scale of the effort put in. The “evolutionist” movement, based on hypotheses radically opposed to those of neoclassical theory, stresses the decisive role played by the socio-institutional context. Building on Schumpeter’s analysis, it first focused on the pattern of long waves in economic activity, with no tendency towards long-term equilibrium. These waves mark the progressive adaptation of the technical, economic and socio-institutional spheres to the emergence of major innovations, giving rise to new technological paradigms. In the conceptualisation proposed by Nelson and Winter (1982), economic development and innovation result from the constant introduction of new ideas, including minor ones, by heterogeneous agents driven by the profit motive, and the selection of those agents in a competitive environment. Given the complexity of the interactions thus generated, the evolutionist movement later turned to the study of national innovation systems.
(1) On this subject, see chapter 3 of the Bank’s 2007 Report.
(2) The CIS methodology is detailed in Box 2.
1.3 The innovation process
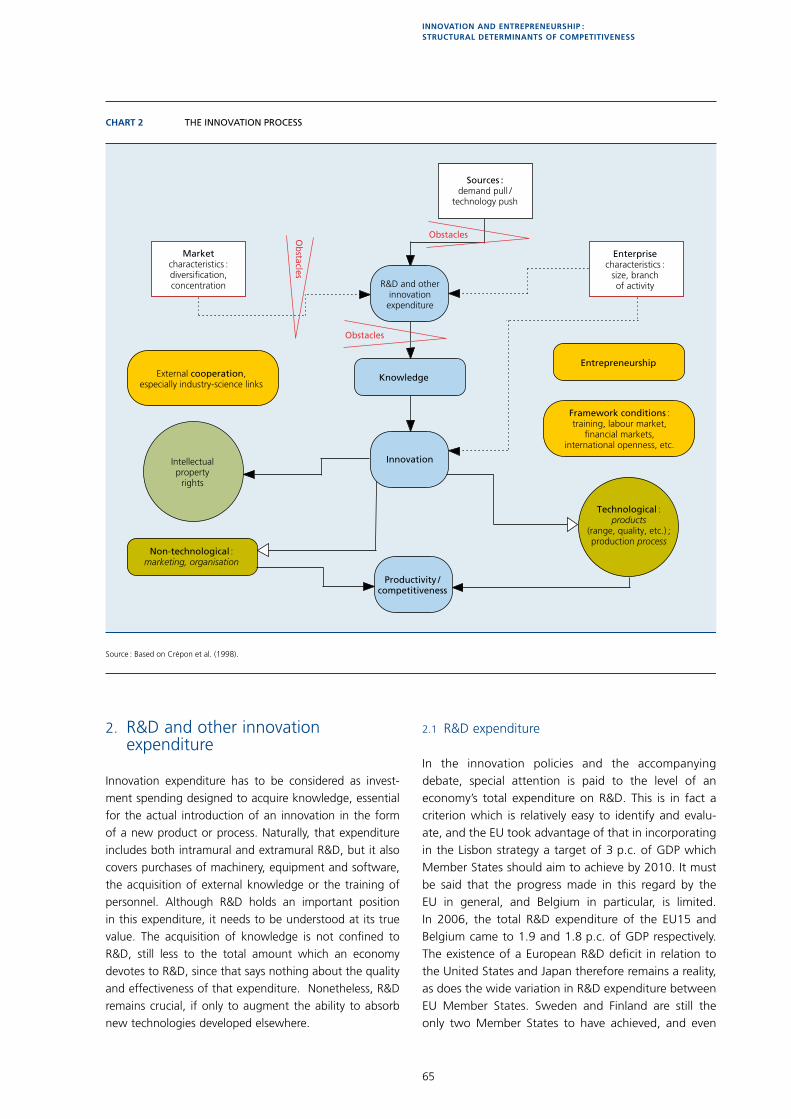
Innovation uses resources to obtain results, so that an input-output approach may provide an overall picture, in the same way as the European Innovation Scoreboard, although it is not always easy to ascertain whether some elements are inputs or outputs. This Scoreboard (1) estab-lishes the link between the innovation drivers, knowledge creation and innovative entrepreneurship, on the one hand, and the applications in terms of sales and jobs and requests for intellectual property protection, on the other. This article takes as its central theme the following chart based on Crépon et al. (1998), which reveals the various elements of the innovation process, illustrated subse-quently with the aid of the CIS4 results (2).
Fundamentally, an enterprise will be encouraged to spend money on innovation if it sees opportunities in terms of demand (demand pull) or if the emergence of
new technologies opens up new horizons (technology push). However, its behaviour is also influenced by more structural characteristics. These concern primarily the enterprise itself, and more specifically its size and branch of activity : a small service enterprise will, in principle, be less inclined to innovate than a large industrial firm. Market conditions are also a factor, particularly the degree of competition.
Starting from the expenditure committed, innovation will produce concrete effects only at the end of a lengthy process, which may entail cooperation with other eco-nomic agents and encounter various obstacles along the way. Ultimately, innovation may be measured in terms of patents and other methods of protection, indicating the completion of research efforts ; up to a point, these are easy to assess. However, they must be considered as an intermediate result, since a patent does not automatically lead to an innovation, just as an innovation does not have to be based on a patent. A survey such as the CIS is then a way of examining the introduction by a firm of a prod-uct or process innovation.
innovAtion And entrepreneurship : structurAl determinAnts of competitiveness
65
CHART 2 THE INNOVATION PROCESS
Source : Based on Crépon et al. (1998).
Marketcharacteristics :diversification,concentration
Enterprisecharacteristics :
size, branchof activity
Knowledge
Innovation
Productivity /competitiveness
Entrepreneurship
Non-technological :marketing, organisation
Intellectualproperty
rights
External cooperation,especially industry-science links
ObstaclesObstacles
Obstacles
R&D and otherinnovationexpenditure
Framework conditions :training, labour market,
financial markets,international openness, etc.
Technological :products
(range, quality, etc.) ;production process
Sources :demand pull /
technology push
2. R&D and other innovation expenditure
Innovation expenditure has to be considered as invest-ment spending designed to acquire knowledge, essential for the actual introduction of an innovation in the form of a new product or process. Naturally, that expenditure includes both intramural and extramural R&D, but it also covers purchases of machinery, equipment and software, the acquisition of external knowledge or the training of personnel. Although R&D holds an important position in this expenditure, it needs to be understood at its true value. The acquisition of knowledge is not confined to R&D, still less to the total amount which an economy devotes to R&D, since that says nothing about the quality and effectiveness of that expenditure. Nonetheless, R&D remains crucial, if only to augment the ability to absorb new technologies developed elsewhere.
2.1 R&D expenditure
In the innovation policies and the accompanying debate, special attention is paid to the level of an economy’s total expenditure on R&D. This is in fact a criterion which is relatively easy to identify and evalu-ate, and the EU took advantage of that in incorporating in the Lisbon strategy a target of 3 p.c. of GDP which Member States should aim to achieve by 2010. It must be said that the progress made in this regard by the EU in general, and Belgium in particular, is limited. In 2006, the total R&D expenditure of the EU15 and Belgium came to 1.9 and 1.8 p.c. of GDP respectively. The existence of a European R&D deficit in relation to the United States and Japan therefore remains a reality, as does the wide variation in R&D expenditure between EU Member States. Sweden and Finland are still the only two Member States to have achieved, and even
66
J J J
J
J
J
J J
J JJ J J
J J J JJ
JJ J
JJ J
J JJ
JJ
1996 1998 2000 2002 2004 20060.0
0.5
1.0
1.5
2.0
2.5
3.0
3.5
4.0
4.5
0.0
0.5
1.0
1.5
2.0
2.5
3.0
3.5
4.0
4.5
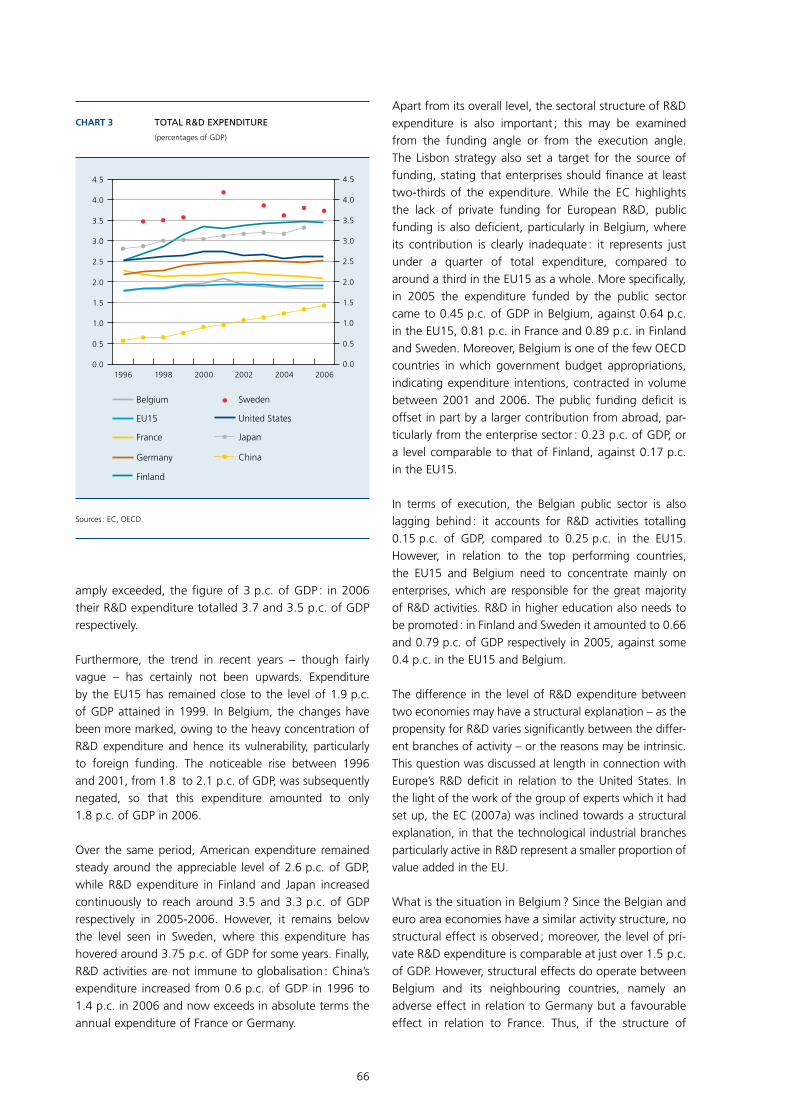
CHART 3 TOTAL R&D EXPENDITURE
(percentages of GDP)
Sources : EC, OECD.
Belgium
EU15
France
Germany
Finland
Sweden
United States
Japan
China
amply exceeded, the figure of 3 p.c. of GDP : in 2006 their R&D expenditure totalled 3.7 and 3.5 p.c. of GDP respectively.
Furthermore, the trend in recent years – though fairly vague – has certainly not been upwards. Expenditure by the EU15 has remained close to the level of 1.9 p.c. of GDP attained in 1999. In Belgium, the changes have been more marked, owing to the heavy concentration of R&D expenditure and hence its vulnerability, particularly to foreign funding. The noticeable rise between 1996 and 2001, from 1.8 to 2.1 p.c. of GDP, was subsequently negated, so that this expenditure amounted to only 1.8 p.c. of GDP in 2006.
Over the same period, American expenditure remained steady around the appreciable level of 2.6 p.c. of GDP, while R&D expenditure in Finland and Japan increased continuously to reach around 3.5 and 3.3 p.c. of GDP respectively in 2005-2006. However, it remains below the level seen in Sweden, where this expenditure has hovered around 3.75 p.c. of GDP for some years. Finally, R&D activities are not immune to globalisation : China’s expenditure increased from 0.6 p.c. of GDP in 1996 to 1.4 p.c. in 2006 and now exceeds in absolute terms the annual expenditure of France or Germany.
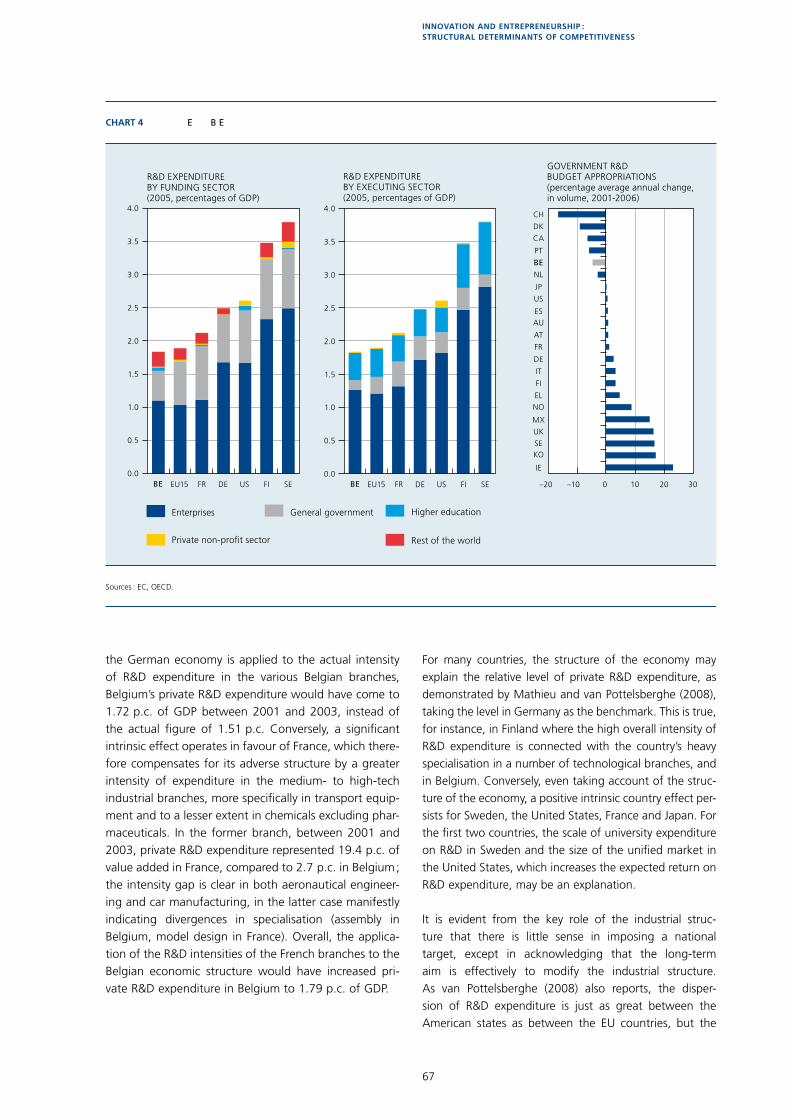
Apart from its overall level, the sectoral structure of R&D expenditure is also important ; this may be examined from the funding angle or from the execution angle. The Lisbon strategy also set a target for the source of funding, stating that enterprises should finance at least two-thirds of the expenditure. While the EC highlights the lack of private funding for European R&D, public funding is also deficient, particularly in Belgium, where its contribution is clearly inadequate : it represents just under a quarter of total expenditure, compared to around a third in the EU15 as a whole. More specifically, in 2005 the expenditure funded by the public sector came to 0.45 p.c. of GDP in Belgium, against 0.64 p.c. in the EU15, 0.81 p.c. in France and 0.89 p.c. in Finland and Sweden. Moreover, Belgium is one of the few OECD countries in which government budget appropriations, indicating expenditure intentions, contracted in volume between 2001 and 2006. The public funding deficit is offset in part by a larger contribution from abroad, par-ticularly from the enterprise sector : 0.23 p.c. of GDP, or a level comparable to that of Finland, against 0.17 p.c. in the EU15.
In terms of execution, the Belgian public sector is also lagging behind : it accounts for R&D activities totalling 0.15 p.c. of GDP, compared to 0.25 p.c. in the EU15. However, in relation to the top performing countries, the EU15 and Belgium need to concentrate mainly on enterprises, which are responsible for the great majority of R&D activities. R&D in higher education also needs to be promoted : in Finland and Sweden it amounted to 0.66 and 0.79 p.c. of GDP respectively in 2005, against some 0.4 p.c. in the EU15 and Belgium.
The difference in the level of R&D expenditure between two economies may have a structural explanation – as the propensity for R&D varies significantly between the differ-ent branches of activity – or the reasons may be intrinsic. This question was discussed at length in connection with Europe’s R&D deficit in relation to the United States. In the light of the work of the group of experts which it had set up, the EC (2007a) was inclined towards a structural explanation, in that the technological industrial branches particularly active in R&D represent a smaller proportion of value added in the EU.
What is the situation in Belgium ? Since the Belgian and euro area economies have a similar activity structure, no structural effect is observed ; moreover, the level of pri-vate R&D expenditure is comparable at just over 1.5 p.c. of GDP. However, structural effects do operate between Belgium and its neighbouring countries, namely an adverse effect in relation to Germany but a favourable effect in relation to France. Thus, if the structure of
innovAtion And entrepreneurship : structurAl determinAnts of competitiveness
67
0.0
0.5
1.0
1.5
2.0
2.5
3.0
3.5
4.0
BE DE FI SE0.0
0.5
1.0
1.5
2.0
2.5
3.0
3.5
4.0
IE
SE
UK
NO
EL
FI
IT
DE
FR
AT
AUES
JP
NL
BE
PT
CA
DK
CH
–20 –10 0 10 20 30FRBE DE FI SEFR
MX
KO
Enterprises General government Higher education
Private non-profit sector Rest of the world
R&D EXPENDITURE BY FUNDING SECTOR(2005, percentages of GDP)
R&D EXPENDITURE BY EXECUTING SECTOR(2005, percentages of GDP)
GOVERNMENT R&DBUDGET APPROPRIATIONS(percentage average annual change,in volume, 2001-2006)
CHART 4� �E�������B�E�������������
Sources : EC, OECD.
EU15EU15 US
US
US
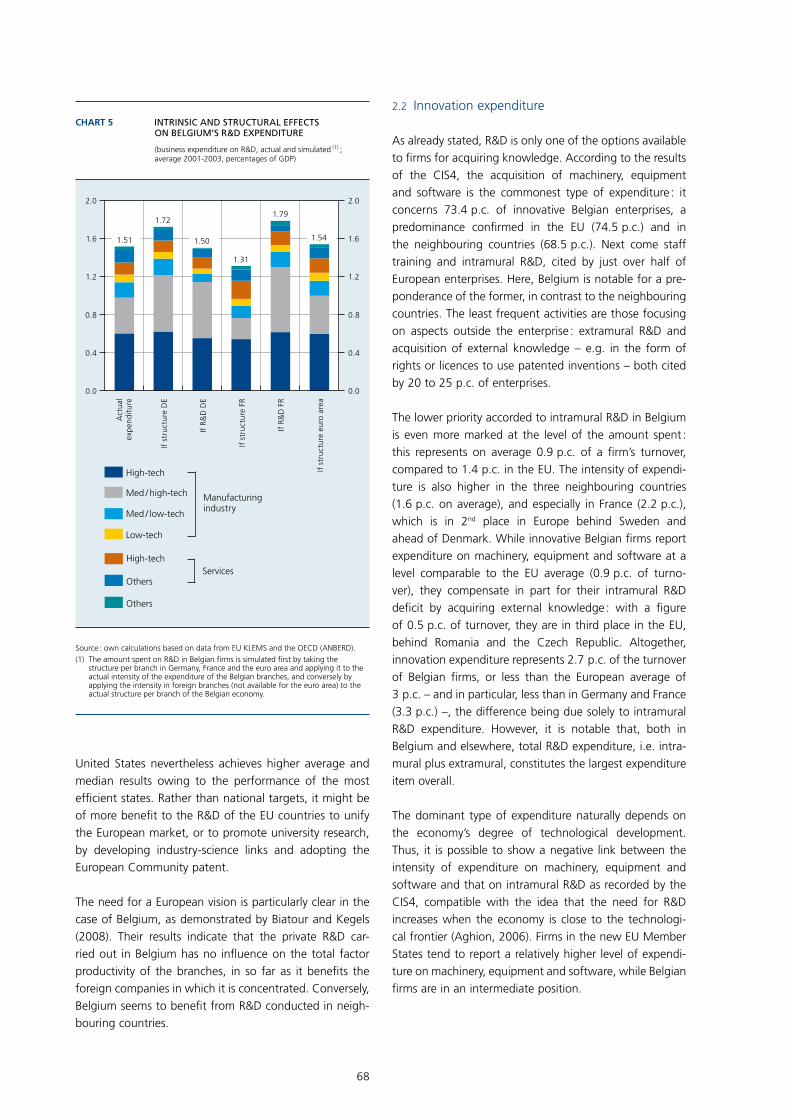
the German economy is applied to the actual intensity of R&D expenditure in the various Belgian branches, Belgium’s private R&D expenditure would have come to 1.72 p.c. of GDP between 2001 and 2003, instead of the actual figure of 1.51 p.c. Conversely, a significant intrinsic effect operates in favour of France, which there-fore compensates for its adverse structure by a greater intensity of expenditure in the medium- to high-tech industrial branches, more specifically in transport equip-ment and to a lesser extent in chemicals excluding phar-maceuticals. In the former branch, between 2001 and 2003, private R&D expenditure represented 19.4 p.c. of value added in France, compared to 2.7 p.c. in Belgium ; the intensity gap is clear in both aeronautical engineer-ing and car manufacturing, in the latter case manifestly indicating divergences in specialisation (assembly in Belgium, model design in France). Overall, the applica-tion of the R&D intensities of the French branches to the Belgian economic structure would have increased pri-vate R&D expenditure in Belgium to 1.79 p.c. of GDP.
For many countries, the structure of the economy may explain the relative level of private R&D expenditure, as demonstrated by Mathieu and van Pottelsberghe (2008), taking the level in Germany as the benchmark. This is true, for instance, in Finland where the high overall intensity of R&D expenditure is connected with the country’s heavy specialisation in a number of technological branches, and in Belgium. Conversely, even taking account of the struc-ture of the economy, a positive intrinsic country effect per-sists for Sweden, the United States, France and Japan. For the first two countries, the scale of university expenditure on R&D in Sweden and the size of the unified market in the United States, which increases the expected return on R&D expenditure, may be an explanation.
It is evident from the key role of the industrial struc-ture that there is little sense in imposing a national target, except in acknowledging that the long-term aim is effectively to modify the industrial structure. As van Pottelsberghe (2008) also reports, the disper-sion of R&D expenditure is just as great between the American states as between the EU countries, but the
68
0.0
0.4
0.8
1.2
1.6
2.0
0.0
0.4
0.8
1.2
1.6
2.0
1.51
1.72
1.50
1.31
1.79
1.54
CHART 5 INTRINSIC AND STRUCTURAL EFFECTS ON BELGIUM’S R&D EXPENDITURE
(business expenditure on R&D, actual and simulated (1)
; average 2001-2003, percentages of GDP)
Source : own calculations based on data from EU KLEMS and the OECD (ANBERD).(1) The amount spent on R&D in Belgian firms is simulated first by taking the
structure per branch in Germany, France and the euro area and applying it to the actual intensity of the expenditure of the Belgian branches, and conversely by applying the intensity in foreign branches (not available for the euro area) to the actual structure per branch of the Belgian economy.
Act
ual
expe
nditu
re
If st
ruct
ure
DE
If R&
D D
E
If st
ruct
ure
FR
If R&
D F
R
If st
ruct
ure
euro
are
a
High-tech
Med / high-tech
Med / low-tech
High-tech
Others
Others
Low-tech
Manufacturingindustry
Services
United States nevertheless achieves higher average and median results owing to the performance of the most efficient states. Rather than national targets, it might be of more benefit to the R&D of the EU countries to unify the European market, or to promote university research, by developing industry-science links and adopting the European Community patent.
The need for a European vision is particularly clear in the case of Belgium, as demonstrated by Biatour and Kegels (2008). Their results indicate that the private R&D car-ried out in Belgium has no influence on the total factor productivity of the branches, in so far as it benefits the foreign companies in which it is concentrated. Conversely, Belgium seems to benefit from R&D conducted in neigh-bouring countries.
2.2 Innovation expenditure
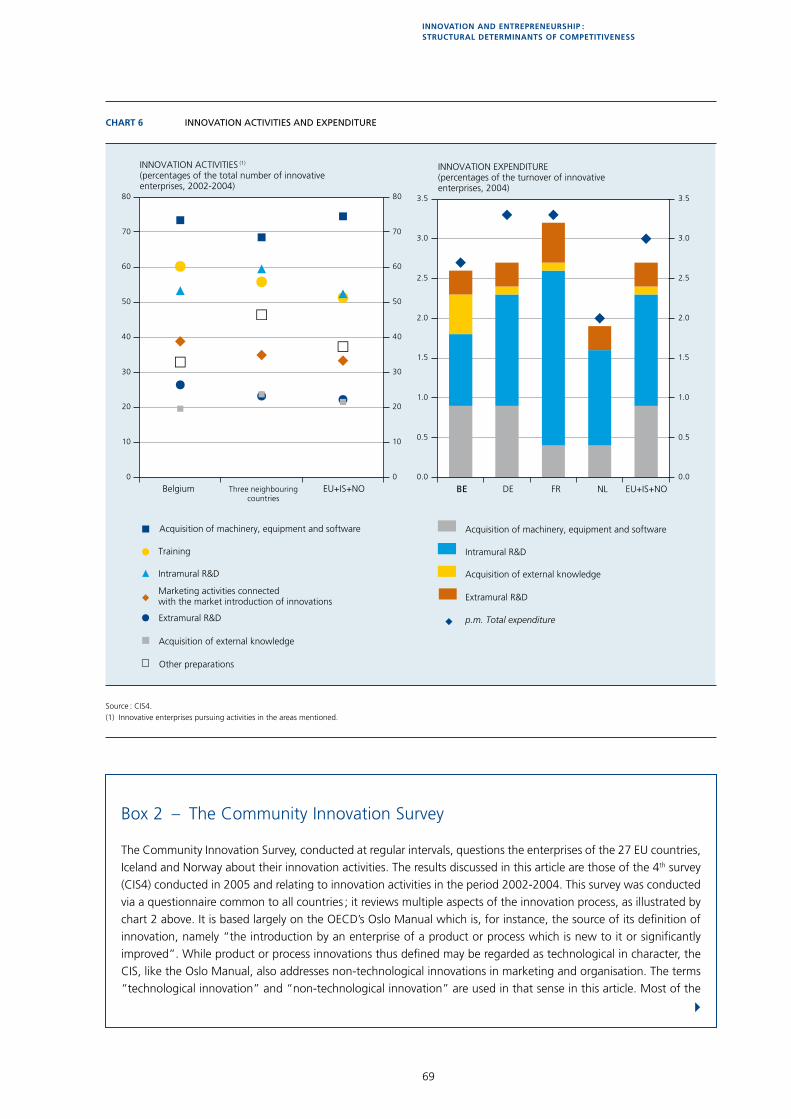
As already stated, R&D is only one of the options available to firms for acquiring knowledge. According to the results of the CIS4, the acquisition of machinery, equipment and software is the commonest type of expenditure : it concerns 73.4 p.c. of innovative Belgian enterprises, a predominance confirmed in the EU (74.5 p.c.) and in the neighbouring countries (68.5 p.c.). Next come staff training and intramural R&D, cited by just over half of European enterprises. Here, Belgium is notable for a pre-ponderance of the former, in contrast to the neighbouring countries. The least frequent activities are those focusing on aspects outside the enterprise : extramural R&D and acquisition of external knowledge – e.g. in the form of rights or licences to use patented inventions – both cited by 20 to 25 p.c. of enterprises.
The lower priority accorded to intramural R&D in Belgium is even more marked at the level of the amount spent : this represents on average 0.9 p.c. of a firm’s turnover, compared to 1.4 p.c. in the EU. The intensity of expendi-ture is also higher in the three neighbouring countries (1.6 p.c. on average), and especially in France (2.2 p.c.), which is in 2nd place in Europe behind Sweden and ahead of Denmark. While innovative Belgian firms report expenditure on machinery, equipment and software at a level comparable to the EU average (0.9 p.c. of turno-ver), they compensate in part for their intramural R&D deficit by acquiring external knowledge : with a figure of 0.5 p.c. of turnover, they are in third place in the EU, behind Romania and the Czech Republic. Altogether, innovation expenditure represents 2.7 p.c. of the turnover of Belgian firms, or less than the European average of 3 p.c. – and in particular, less than in Germany and France (3.3 p.c.) –, the difference being due solely to intramural R&D expenditure. However, it is notable that, both in Belgium and elsewhere, total R&D expenditure, i.e. intra-mural plus extramural, constitutes the largest expenditure item overall.
The dominant type of expenditure naturally depends on the economy’s degree of technological development. Thus, it is possible to show a negative link between the intensity of expenditure on machinery, equipment and software and that on intramural R&D as recorded by the CIS4, compatible with the idea that the need for R&D increases when the economy is close to the technologi-cal frontier (Aghion, 2006). Firms in the new EU Member States tend to report a relatively higher level of expendi-ture on machinery, equipment and software, while Belgian firms are in an intermediate position.
innovAtion And entrepreneurship : structurAl determinAnts of competitiveness
69
B
B
B
JJ
JH
H
H
FF FÑ
Ñ
Ñ
JJ J
B
BB
F
F F
F
F
B
J
H
F
Ñ
J
B
F
0
10
20
30
40
50
60
70
80
0
10
20
30
40
50
60
70
80
0.0
0.5
1.0
1.5
2.0
2.5
3.0
3.5
0.0
0.5
1.0
1.5
2.0
2.5
3.0
3.5
CHART 6 INNOVATION ACTIVITIES AND EXPENDITURE
Source : CIS4.(1) Innovative enterprises pursuing activities in the areas mentioned.
Belgium Three neighbouringcountries
EU+IS+NO BE DE FR NL EU+IS+NO
INNOVATION ACTIVITIES (1)
(percentages of the total number of innovativeenterprises, 2002-2004)
Acquisition of machinery, equipment and software
Training
Intramural R&D
Marketing activities connected with the market introduction of innovations
Other preparations
Extramural R&D
Acquisition of external knowledge
Acquisition of machinery, equipment and software
Intramural R&D
Acquisition of external knowledge
Extramural R&D
p.m. Total expenditure
INNOVATION EXPENDITURE(percentages of the turnover of innovative enterprises, 2004)
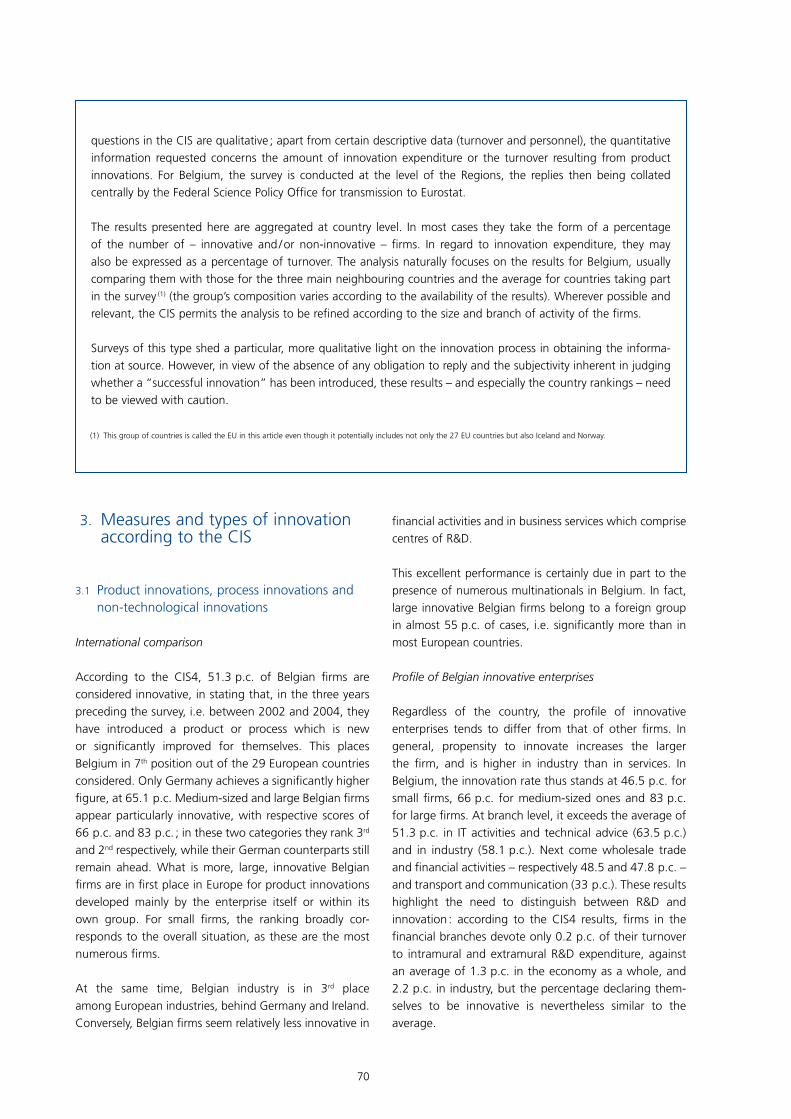
Box 2 – The Community Innovation Survey
The Community Innovation Survey, conducted at regular intervals, questions the enterprises of the 27 EU countries, Iceland and Norway about their innovation activities. The results discussed in this article are those of the 4th survey (CIS4) conducted in 2005 and relating to innovation activities in the period 2002-2004. This survey was conducted via a questionnaire common to all countries ; it reviews multiple aspects of the innovation process, as illustrated by chart 2 above. It is based largely on the OECD’s Oslo Manual which is, for instance, the source of its definition of innovation, namely “the introduction by an enterprise of a product or process which is new to it or significantly improved”. While product or process innovations thus defined may be regarded as technological in character, the CIS, like the Oslo Manual, also addresses non-technological innovations in marketing and organisation. The terms “technological innovation” and “non-technological innovation” are used in that sense in this article. Most of the
4
70
(1) This group of countries is called the EU in this article even though it potentially includes not only the 27 EU countries but also Iceland and Norway.
questions in the CIS are qualitative ; apart from certain descriptive data (turnover and personnel), the quantitative information requested concerns the amount of innovation expenditure or the turnover resulting from product innovations. For Belgium, the survey is conducted at the level of the Regions, the replies then being collated centrally by the Federal Science Policy Office for transmission to Eurostat.
The results presented here are aggregated at country level. In most cases they take the form of a percentage of the number of – innovative and / or non-innovative – firms. In regard to innovation expenditure, they may also be expressed as a percentage of turnover. The analysis naturally focuses on the results for Belgium, usually comparing them with those for the three main neighbouring countries and the average for countries taking part in the survey (1) (the group’s composition varies according to the availability of the results). Wherever possible and relevant, the CIS permits the analysis to be refined according to the size and branch of activity of the firms.
Surveys of this type shed a particular, more qualitative light on the innovation process in obtaining the informa-tion at source. However, in view of the absence of any obligation to reply and the subjectivity inherent in judging whether a “successful innovation” has been introduced, these results – and especially the country rankings – need to be viewed with caution.
3. Measures and types of innovation according to the CIS
3.1 Product innovations, process innovations and non-technological innovations
International comparison
According to the CIS4, 51.3 p.c. of Belgian firms are considered innovative, in stating that, in the three years preceding the survey, i.e. between 2002 and 2004, they have introduced a product or process which is new or significantly improved for themselves. This places Belgium in 7th position out of the 29 European countries considered. Only Germany achieves a significantly higher figure, at 65.1 p.c. Medium-sized and large Belgian firms appear particularly innovative, with respective scores of 66 p.c. and 83 p.c. ; in these two categories they rank 3rd and 2nd respectively, while their German counterparts still remain ahead. What is more, large, innovative Belgian firms are in first place in Europe for product innovations developed mainly by the enterprise itself or within its own group. For small firms, the ranking broadly cor-responds to the overall situation, as these are the most numerous firms.
At the same time, Belgian industry is in 3rd place among European industries, behind Germany and Ireland. Conversely, Belgian firms seem relatively less innovative in
financial activities and in business services which comprise centres of R&D.
This excellent performance is certainly due in part to the presence of numerous multinationals in Belgium. In fact, large innovative Belgian firms belong to a foreign group in almost 55 p.c. of cases, i.e. significantly more than in most European countries.
Profile of Belgian innovative enterprises
Regardless of the country, the profile of innovative enterprises tends to differ from that of other firms. In general, propensity to innovate increases the larger the firm, and is higher in industry than in services. In Belgium, the innovation rate thus stands at 46.5 p.c. for small firms, 66 p.c. for medium-sized ones and 83 p.c. for large firms. At branch level, it exceeds the average of 51.3 p.c. in IT activities and technical advice (63.5 p.c.) and in industry (58.1 p.c.). Next come wholesale trade and financial activities – respectively 48.5 and 47.8 p.c. – and transport and communication (33 p.c.). These results highlight the need to distinguish between R&D and innovation : according to the CIS4 results, firms in the financial branches devote only 0.2 p.c. of their turnover to intramural and extramural R&D expenditure, against an average of 1.3 p.c. in the economy as a whole, and 2.2 p.c. in industry, but the percentage declaring them-selves to be innovative is nevertheless similar to the average.
innovAtion And entrepreneurship : structurAl determinAnts of competitiveness
71
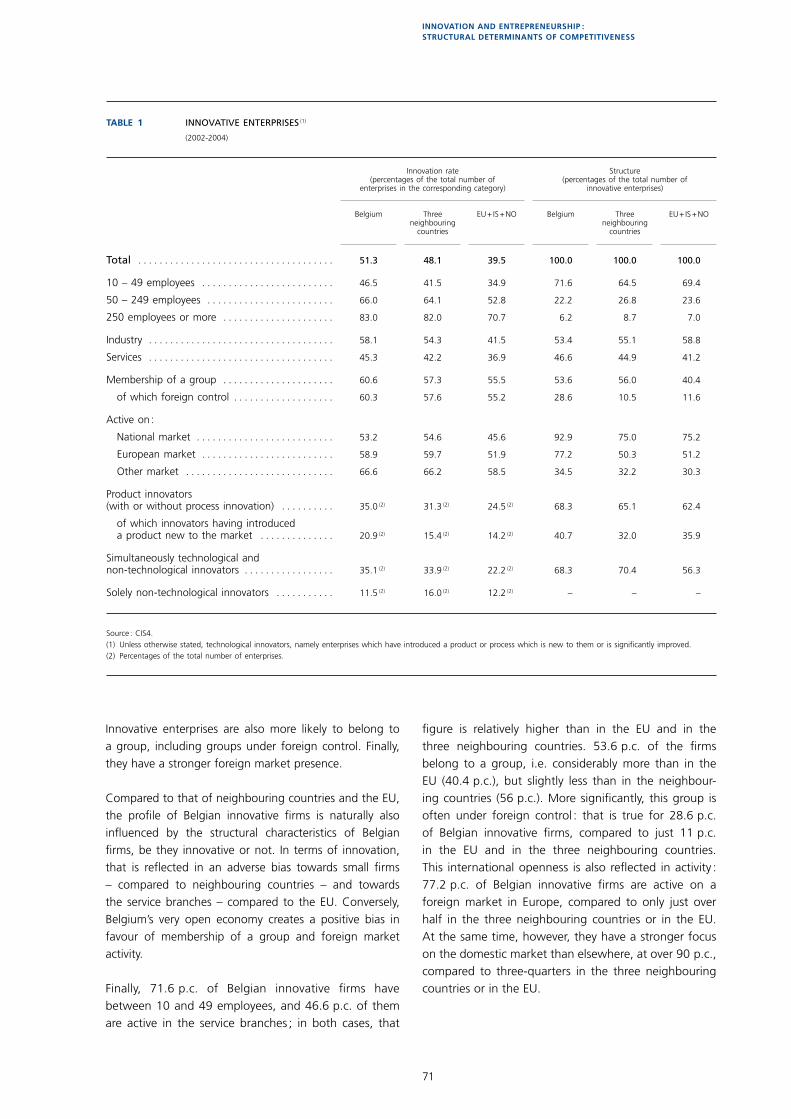
Table 1 InnovatIve enterprIses (1)
(2002-2004)
Innovation rate (percentages of the total number of
enterprises in the corresponding category)
Structure (percentages of the total number of
innovative enterprises)
Belgium
Three neighbouring
countries
EU + IS + NO
Belgium
Three neighbouring
countries
EU + IS + NO
total . . . . . . . . . . . . . . . . . . . . . . . . . . . . . . . . . . . . . 51.3 48.1 39.5 100.0 100.0 100.0
10 – 49 employees . . . . . . . . . . . . . . . . . . . . . . . . . 46.5 41.5 34.9 71.6 64.5 69.4
50 – 249 employees . . . . . . . . . . . . . . . . . . . . . . . . 66.0 64.1 52.8 22.2 26.8 23.6
250 employees or more . . . . . . . . . . . . . . . . . . . . . 83.0 82.0 70.7 6.2 8.7 7.0
Industry . . . . . . . . . . . . . . . . . . . . . . . . . . . . . . . . . . . 58.1 54.3 41.5 53.4 55.1 58.8
Services . . . . . . . . . . . . . . . . . . . . . . . . . . . . . . . . . . . 45.3 42.2 36.9 46.6 44.9 41.2
Membership of a group . . . . . . . . . . . . . . . . . . . . . 60.6 57.3 55.5 53.6 56.0 40.4
of which foreign control . . . . . . . . . . . . . . . . . . . 60.3 57.6 55.2 28.6 10.5 11.6
Active on :
National market . . . . . . . . . . . . . . . . . . . . . . . . . . 53.2 54.6 45.6 92.9 75.0 75.2
European market . . . . . . . . . . . . . . . . . . . . . . . . . 58.9 59.7 51.9 77.2 50.3 51.2
Other market . . . . . . . . . . . . . . . . . . . . . . . . . . . . 66.6 66.2 58.5 34.5 32.2 30.3
Product innovators (with or without process innovation) . . . . . . . . . . 35.0 (2) 31.3 (2) 24.5 (2) 68.3 65.1 62.4
of which innovators having introduced a product new to the market . . . . . . . . . . . . . . 20.9 (2) 15.4 (2) 14.2 (2) 40.7 32.0 35.9
Simultaneously technological and non-technological innovators . . . . . . . . . . . . . . . . . 35.1 (2) 33.9 (2) 22.2 (2) 68.3 70.4 56.3
Solely non-technological innovators . . . . . . . . . . . 11.5 (2) 16.0 (2) 12.2 (2) – – –
Source : CIS4.(1) Unless otherwise stated, technological innovators, namely enterprises which have introduced a product or process which is new to them or is significantly improved.(2) Percentages of the total number of enterprises.
Innovative enterprises are also more likely to belong to a group, including groups under foreign control. Finally, they have a stronger foreign market presence.
Compared to that of neighbouring countries and the EU, the profile of Belgian innovative firms is naturally also influenced by the structural characteristics of Belgian firms, be they innovative or not. In terms of innovation, that is reflected in an adverse bias towards small firms – compared to neighbouring countries – and towards the service branches – compared to the EU. Conversely, Belgium’s very open economy creates a positive bias in favour of membership of a group and foreign market activity.
Finally, 71.6 p.c. of Belgian innovative firms have between 10 and 49 employees, and 46.6 p.c. of them are active in the service branches ; in both cases, that
figure is relatively higher than in the EU and in the three neighbouring countries. 53.6 p.c. of the firms belong to a group, i.e. considerably more than in the EU (40.4 p.c.), but slightly less than in the neighbour-ing countries (56 p.c.). More significantly, this group is often under foreign control : that is true for 28.6 p.c. of Belgian innovative firms, compared to just 11 p.c. in the EU and in the three neighbouring countries. This international openness is also reflected in activity : 77.2 p.c. of Belgian innovative firms are active on a foreign market in Europe, compared to only just over half in the three neighbouring countries or in the EU. At the same time, however, they have a stronger focus on the domestic market than elsewhere, at over 90 p.c., compared to three-quarters in the three neighbouring countries or in the EU.
72
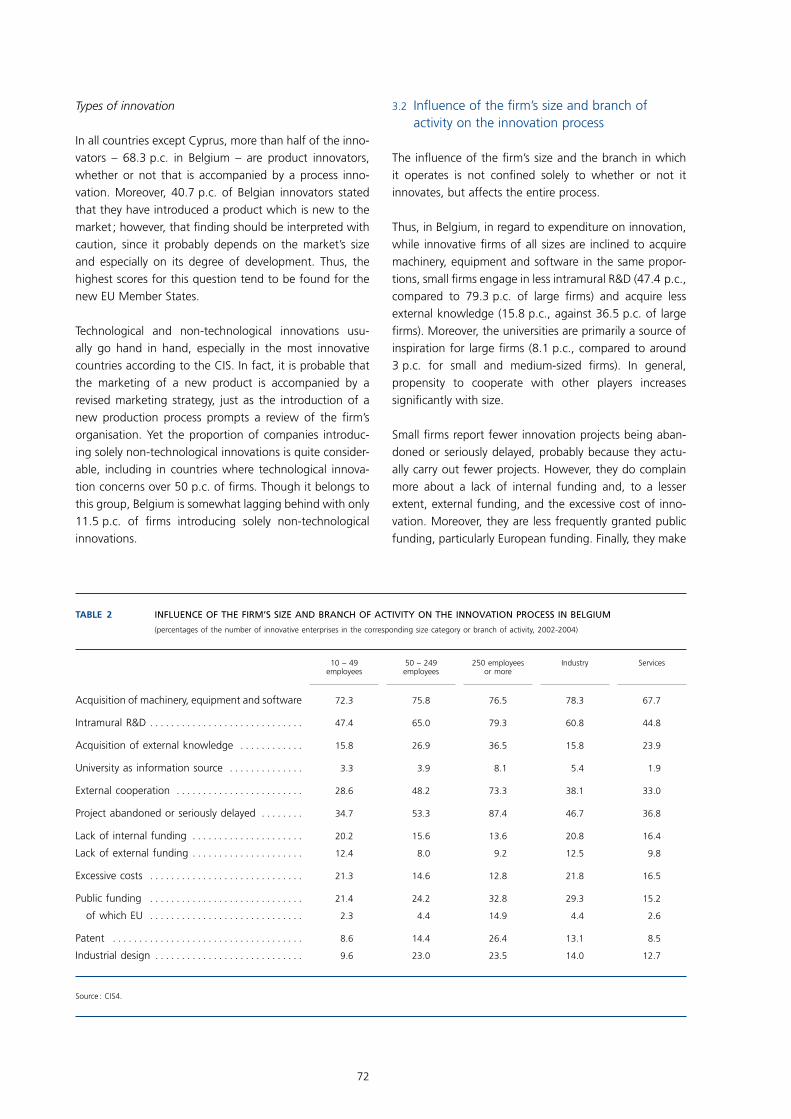
Table 2 Influence of the fIrm’s sIze and branch of actIvIty on the InnovatIon process In belgIum
(percentages of the number of innovative enterprises in the corresponding size category or branch of activity, 2002-2004)
10 – 49 employees
50 – 249 employees
250 employees or more
Industry
Services
Acquisition of machinery, equipment and software 72.3 75.8 76.5 78.3 67.7
Intramural R&D . . . . . . . . . . . . . . . . . . . . . . . . . . . . . 47.4 65.0 79.3 60.8 44.8
Acquisition of external knowledge . . . . . . . . . . . . 15.8 26.9 36.5 15.8 23.9
University as information source . . . . . . . . . . . . . . 3.3 3.9 8.1 5.4 1.9
External cooperation . . . . . . . . . . . . . . . . . . . . . . . . 28.6 48.2 73.3 38.1 33.0
Project abandoned or seriously delayed . . . . . . . . 34.7 53.3 87.4 46.7 36.8
Lack of internal funding . . . . . . . . . . . . . . . . . . . . . 20.2 15.6 13.6 20.8 16.4
Lack of external funding . . . . . . . . . . . . . . . . . . . . . 12.4 8.0 9.2 12.5 9.8
Excessive costs . . . . . . . . . . . . . . . . . . . . . . . . . . . . . 21.3 14.6 12.8 21.8 16.5
Public funding . . . . . . . . . . . . . . . . . . . . . . . . . . . . . 21.4 24.2 32.8 29.3 15.2
of which EU . . . . . . . . . . . . . . . . . . . . . . . . . . . . . 2.3 4.4 14.9 4.4 2.6
Patent . . . . . . . . . . . . . . . . . . . . . . . . . . . . . . . . . . . . 8.6 14.4 26.4 13.1 8.5
Industrial design . . . . . . . . . . . . . . . . . . . . . . . . . . . . 9.6 23.0 23.5 14.0 12.7
Source : CIS4.
Types of innovation
In all countries except Cyprus, more than half of the inno-vators – 68.3 p.c. in Belgium – are product innovators, whether or not that is accompanied by a process inno-vation. Moreover, 40.7 p.c. of Belgian innovators stated that they have introduced a product which is new to the market ; however, that finding should be interpreted with caution, since it probably depends on the market’s size and especially on its degree of development. Thus, the highest scores for this question tend to be found for the new EU Member States.
Technological and non-technological innovations usu-ally go hand in hand, especially in the most innovative countries according to the CIS. In fact, it is probable that the marketing of a new product is accompanied by a revised marketing strategy, just as the introduction of a new production process prompts a review of the firm’s organisation. Yet the proportion of companies introduc-ing solely non-technological innovations is quite consider-able, including in countries where technological innova-tion concerns over 50 p.c. of firms. Though it belongs to this group, Belgium is somewhat lagging behind with only 11.5 p.c. of firms introducing solely non-technological innovations.
3.2 Influence of the firm’s size and branch of activity on the innovation process
The influence of the firm’s size and the branch in which it operates is not confined solely to whether or not it innovates, but affects the entire process.
Thus, in Belgium, in regard to expenditure on innovation, while innovative firms of all sizes are inclined to acquire machinery, equipment and software in the same propor-tions, small firms engage in less intramural R&D (47.4 p.c., compared to 79.3 p.c. of large firms) and acquire less external knowledge (15.8 p.c., against 36.5 p.c. of large firms). Moreover, the universities are primarily a source of inspiration for large firms (8.1 p.c., compared to around 3 p.c. for small and medium-sized firms). In general, propensity to cooperate with other players increases significantly with size.
Small firms report fewer innovation projects being aban-doned or seriously delayed, probably because they actu-ally carry out fewer projects. However, they do complain more about a lack of internal funding and, to a lesser extent, external funding, and the excessive cost of inno-vation. Moreover, they are less frequently granted public funding, particularly European funding. Finally, they make
innovAtion And entrepreneurship : structurAl determinAnts of competitiveness
73
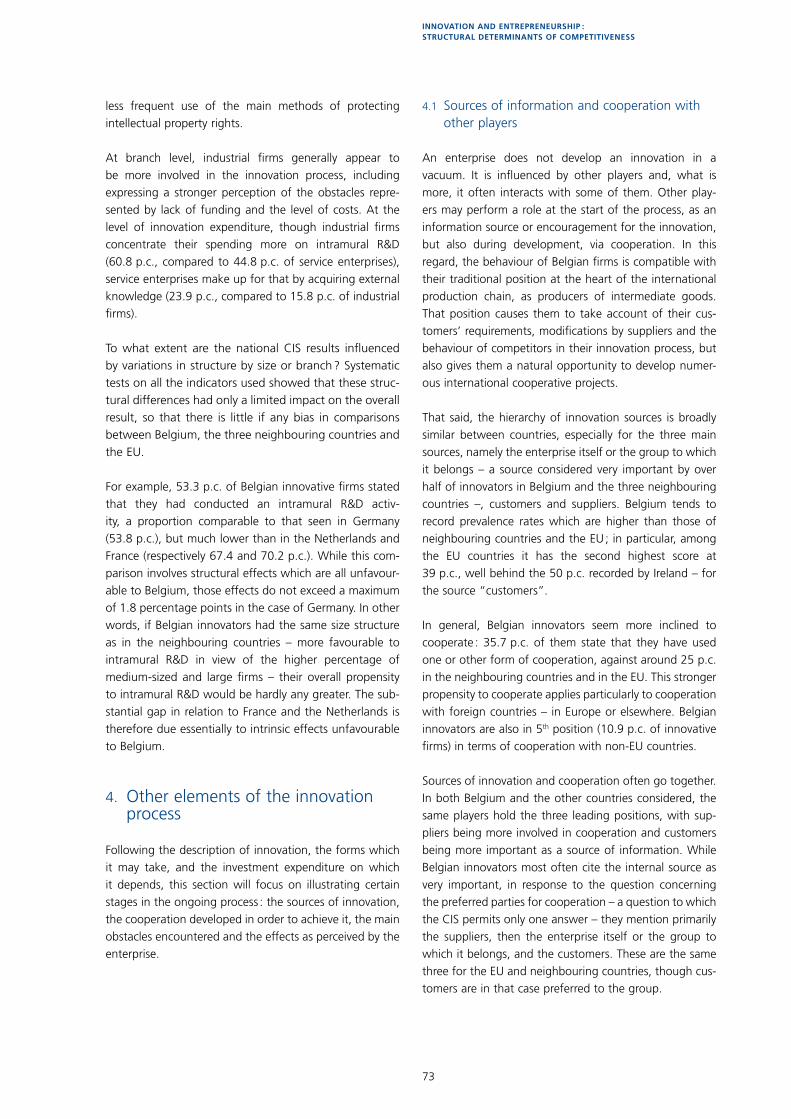
less frequent use of the main methods of protecting intellectual property rights.
At branch level, industrial firms generally appear to be more involved in the innovation process, including expressing a stronger perception of the obstacles repre-sented by lack of funding and the level of costs. At the level of innovation expenditure, though industrial firms concentrate their spending more on intramural R&D (60.8 p.c., compared to 44.8 p.c. of service enterprises), service enterprises make up for that by acquiring external knowledge (23.9 p.c., compared to 15.8 p.c. of industrial firms).
To what extent are the national CIS results influenced by variations in structure by size or branch ? Systematic tests on all the indicators used showed that these struc-tural differences had only a limited impact on the overall result, so that there is little if any bias in comparisons between Belgium, the three neighbouring countries and the EU.
For example, 53.3 p.c. of Belgian innovative firms stated that they had conducted an intramural R&D activ-ity, a proportion comparable to that seen in Germany (53.8 p.c.), but much lower than in the Netherlands and France (respectively 67.4 and 70.2 p.c.). While this com-parison involves structural effects which are all unfavour-able to Belgium, those effects do not exceed a maximum of 1.8 percentage points in the case of Germany. In other words, if Belgian innovators had the same size structure as in the neighbouring countries – more favourable to intramural R&D in view of the higher percentage of medium-sized and large firms – their overall propensity to intramural R&D would be hardly any greater. The sub-stantial gap in relation to France and the Netherlands is therefore due essentially to intrinsic effects unfavourable to Belgium.
4. Other elements of the innovation process
Following the description of innovation, the forms which it may take, and the investment expenditure on which it depends, this section will focus on illustrating certain stages in the ongoing process : the sources of innovation, the cooperation developed in order to achieve it, the main obstacles encountered and the effects as perceived by the enterprise.
4.1 Sources of information and cooperation with other players
An enterprise does not develop an innovation in a vacuum. It is influenced by other players and, what is more, it often interacts with some of them. Other play-ers may perform a role at the start of the process, as an information source or encouragement for the innovation, but also during development, via cooperation. In this regard, the behaviour of Belgian firms is compatible with their traditional position at the heart of the international production chain, as producers of intermediate goods. That position causes them to take account of their cus-tomers’ requirements, modifications by suppliers and the behaviour of competitors in their innovation process, but also gives them a natural opportunity to develop numer-ous international cooperative projects.
That said, the hierarchy of innovation sources is broadly similar between countries, especially for the three main sources, namely the enterprise itself or the group to which it belongs – a source considered very important by over half of innovators in Belgium and the three neighbouring countries –, customers and suppliers. Belgium tends to record prevalence rates which are higher than those of neighbouring countries and the EU ; in particular, among the EU countries it has the second highest score at 39 p.c., well behind the 50 p.c. recorded by Ireland – for the source “customers”.
In general, Belgian innovators seem more inclined to cooperate : 35.7 p.c. of them state that they have used one or other form of cooperation, against around 25 p.c. in the neighbouring countries and in the EU. This stronger propensity to cooperate applies particularly to cooperation with foreign countries – in Europe or elsewhere. Belgian innovators are also in 5th position (10.9 p.c. of innovative firms) in terms of cooperation with non-EU countries.
Sources of innovation and cooperation often go together. In both Belgium and the other countries considered, the same players hold the three leading positions, with sup-pliers being more involved in cooperation and customers being more important as a source of information. While Belgian innovators most often cite the internal source as very important, in response to the question concerning the preferred parties for cooperation – a question to which the CIS permits only one answer – they mention primarily the suppliers, then the enterprise itself or the group to which it belongs, and the customers. These are the same three for the EU and neighbouring countries, though cus-tomers are in that case preferred to the group.
74
0
10
20
30
40
50
BB
B
J
J
JH
HH
F
F FÑÑ
ÑÉ
ÉÉÇ
Ç ÇF FF
1 1 1[ [ [
B
B
BJ
J
JH
H
HF
F FÑ
Ñ
Ñ
É
É
ÉÇ
ÇÇ
F F F
11
1
35.7
24.0
30.9
10.9
10.3
9.7
8.3
13.2
24.5
9.3
23.0
5.1
5.6
4.2
4.7
9.3
25.6
10.6
22.7
4.5
7.8
4.5
5.3
8.9
19.3
18.8
14.8
13.6
11.2
21.9
15.1
13.4
13.0
12.2
B
J
H
F
F
1
Ñ
É
Ç
[
B
J
H
F F
1
Ñ
É
Ç
0
10
20
30
40
50
60
0
10
20
30
40
50
60
0
10
20
30
40
50
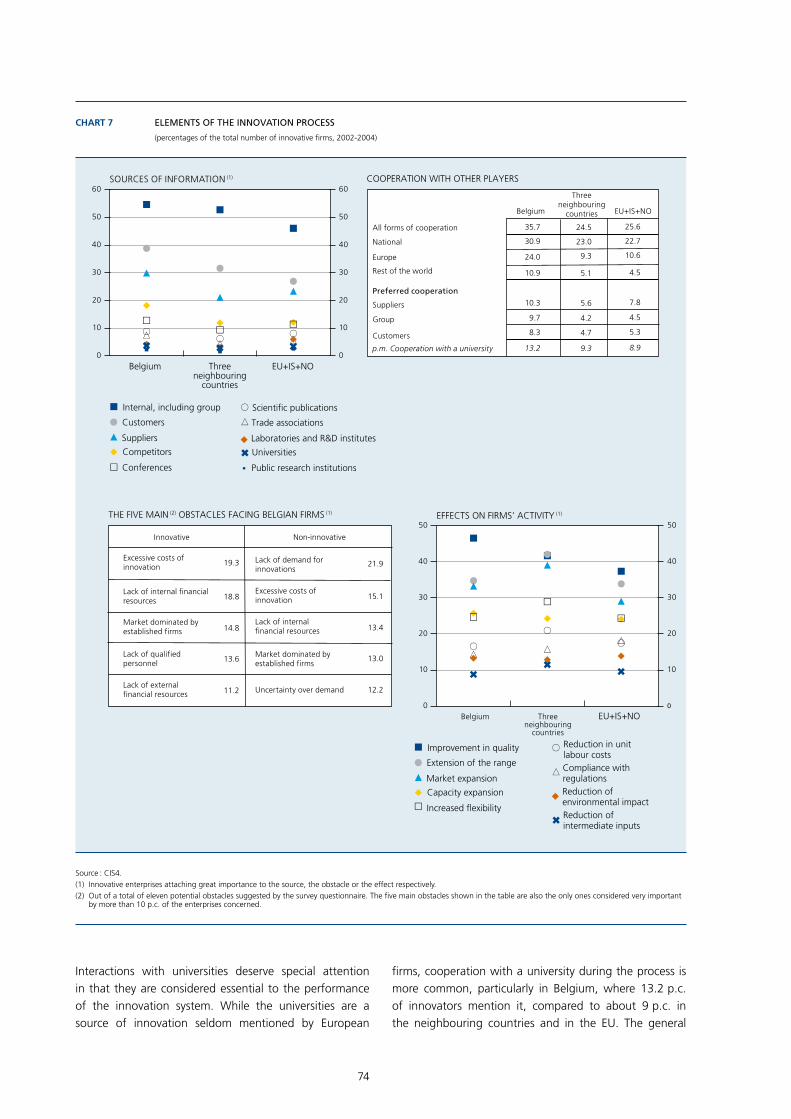
CHART 7 ELEMENTS OF THE INNOVATION PROCESS
(percentages of the total number of innovative firms, 2002-2004)
Source : CIS4.(1) Innovative enterprises attaching great importance to the source, the obstacle or the effect respectively.(2) Out of a total of eleven potential obstacles suggested by the survey questionnaire. The five main obstacles shown in the table are also the only ones considered very important
by more than 10 p.c. of the enterprises concerned.
Belgium Threeneighbouring
countries
EU+IS+NO
Belgium Threeneighbouring
countries
EU+IS+NO
SOURCES OF INFORMATION (1) COOPERATION WITH OTHER PLAYERS
THE FIVE MAIN (2) OBSTACLES FACING BELGIAN FIRMS (1) EFFECTS ON FIRMS’ ACTIVITY (1)
Belgium
Threeneighbouring
countries EU+IS+NO
Lack of internal financial resources
Non-innovative
Excessive costs of innovation
Market dominated by established firms
Lack of qualified personnel
Lack of external financial resources
Innovative
Excessive costs of innovation
Lack of demand for innovations
Lack of internal financial resources
Market dominated by established firms
Uncertainty over demand
Internal, including group
Customers
Suppliers
Competitors
Conferences
Scientific publications
Trade associations
Laboratories and R&D institutes
Universities
Public research institutions
Improvement in quality
Extension of the range
Market expansion
Capacity expansion
Increased flexibility
Reduction in unit labour costsCompliance with regulationsReduction of environmental impactReduction of intermediate inputs
All forms of cooperation
National
Europe
Rest of the world
Preferred cooperation
Suppliers
Group
Customers
p.m. Cooperation with a university
Interactions with universities deserve special attention in that they are considered essential to the performance of the innovation system. While the universities are a source of innovation seldom mentioned by European
firms, cooperation with a university during the process is more common, particularly in Belgium, where 13.2 p.c. of innovators mention it, compared to about 9 p.c. in the neighbouring countries and in the EU. The general
innovAtion And entrepreneurship : structurAl determinAnts of competitiveness
75
propensity to cooperate tends to increase in all countries with the size of the firm, but cooperation with a university seems to be the preserve of large enterprises ; in Belgium, it concerns 37.5 p.c. of the innovators with 250 employ-ees or more. In this area of industry-science links, Finland clearly stands out : 33.1 p.c. of innovators there state that they have cooperated with a university – namely 69.4 p.c. of large firms, but also 24.5 p.c. of small firms, compared to 10.3 p.c. of innovative firms with 10 to 49 employees in Belgium.
4.2 Obstacles encountered during the innovation process
The obstacles which may impede the route to innovation are potentially numerous and varied. They may originate within the enterprise itself (own resources, costs) or on the factor markets (financial, labour) or product markets (lack of competition, uncertain demand). They may oper-ate at an early stage, stifling any thought of innovation, or take effect during the process, perhaps causing serious delays or even the straightforward abandonment of a project. The obstacles facing firms which nevertheless suc-ceed in introducing an innovation and those which do not are different, as can be inferred from the CIS.
However, in assessing projects which are delayed or aban-doned, the survey only considers innovators, which makes it even more difficult to interpret the results. Thus, the lower rate of abandonment or delay among Belgian inno-vators than in the neighbouring countries or the EU, com-bined with a relatively high innovation rate, could mean that Belgian firms are more confident when embarking on an innovation process, but could equally mean that they are less ambitious, so that their innovations are less likely to fail. In most countries, projects are more often seriously delayed than abandoned, and abandonment tends to occur at the concept stage.
The main obstacle encountered by Belgian firms which have not innovated is found on the demand side, as – above all – the absence but also the uncertainty of demand is considered to be a very important hamper-ing factor by just over one-third of the firms concerned. Financial factors play an equally significant role, as the scale of the costs and the lack of internal funding are both mentioned by more than a quarter of non-innovators, each in comparable proportions. Domination of the market by established firms is a very important obstacle for 13 p.c. of non-innovators. In the neighbouring coun-tries, the same three obstacles head the list, although financial factors are slightly predominant in Germany and the Netherlands.
For Belgian innovators, the principal obstacles are clearly financial, and apply mainly to small firms : excessive costs and lack of internal funding, each applicable to around 19 p.c. of all innovative firms, plus in fifth place the lack of external funding (11.2 p.c.). Dominance of the market by established firms (14.8 p.c.) and the lack of qualified personnel (13.6 p.c.) complete the table. This last factor is mentioned more often than in the EU (11 p.c.) and in the three neighbouring countries (7.6 p.c.). As firms can identify any desired number of obstacles as being very important, the sum total for all the obstacles mentioned may be informative : it comes to 96.5 p.c. for the neigh-bouring countries, 107.3 p.c. for Belgium and 130.1 p.c. for the EU.
The impact of the degree of market competition at the level of innovation has formed the subject of many theoretical debates. It is generally accepted that the link takes the shape of an inverted U. Initially, strengthen-ing competition prompts firms to innovate in order to stand out from their competitors and to try to secure the temporary returns on innovation. This effect is more marked in economies or sectors close to the technological frontier, where growth may be harder to achieve owing to imitation (Aghion, 2006). Beyond a certain threshold, however, competition may reduce the returns which could be expected ex ante and therefore have the effect of dis-couraging potential innovators. Dominance of the market by established firms is an obstacle mentioned by a consid-erable percentage of firms, whether they have innovated or not, though it is not the decisive factor. However, this obstacle is more in evidence in certain industrial branches, both in firms which have innovated and in those which have not. That is the case in chemicals, textiles and the manufacture of other non-metallic mineral products, including glass. In the case of the first branch, in contrast to the other two, this finding is also true for many other European countries.
4.3 Effects of innovation on firms’ activities
Regardless of the country or the firm’s size, the positive effects of innovation on activity are mainly apparent at product level, which is logical in view of the preponder-ance of that type of innovation. In Belgium, firms seem to place greater emphasis on improving product quality, while in the neighbouring countries, expanding the range and conquering market share play an equally important role. This might be seen as a sign of modesty on the part of Belgian firms, wishing to offer quality goods and serv-ices in order to maintain their intermediate position in the international production chain, while firms in the neigh-bouring countries focus more on winning market share.
76
It is also notable that the neighbouring countries make more frequent mention than Belgium of increased flex-ibility and the reduction in labour costs as consequences of innovation.
Non-technological innovations have a greater impact in the case of technological innovators, indicating that a combination of the two is beneficial in a firm surrounded by a culture of innovation, although it is possible that the respondents cannot distinguish clearly between the effects of the two types of innovation. Once again, the improvement in product quality is the main effect, while the reduction in customer response time proves to be almost as important.
5. Framework conditions and innovation policies
Since innovation is a complex process involving players from various spheres and subject to the influence of many factors, the policies which may promote it are naturally just as varied. While there may be specific measures tar-geting R&D and innovation, many policies designed to improve the general framework for pursuing economic activity can also prove beneficial.
The EC (2007b) justifies the systemic approach by stipulating that the science-technology-industry trip-tych needs to be supplemented by a favourable framework in terms of education, labour market and financial markets, in order to enhance performance in regard to competitiveness and growth. Jaumotte and Pain (2005) also showed that an improve-ment in these framework conditions does more to boost the R&D effort than direct support for R&D, particularly in small open economies.
One of the chief general policies which could affect innovation, as indicated, for example, by the OECD in the 2006 issue of its report Going for Growth, is edu-cation policy. This puts the emphasis on the training of scientific personnel, necessary for R&D, but also on helping to develop the entrepreneurial spirit. In these same two areas, an efficient labour market facilitates the matching of demand and available resources, signalling any shortages. Since research and innovation activities take place over a long and uncertain horizon, they need suitable funding, both at the launch of the enterprise and in the initial growth stage ; the availability of ample and effective venture capital is therefore essential. Finally, the external openness of the economy is a vehicle for innovation via the transfers of technology encouraged by trade and direct investment, while competition policy and
bankruptcy legislation determine the degree of openness and dynamism of the market.
In the general framework of competition policy and the debate over the appropriate level of competition, intellectual property rights are a crucial question for innovation. While a limited period of protection encour-ages the potential innovator by guaranteeing that he will profit from his efforts, it may also curb the spread of existing innovations, and hence their use and their improvement by other firms. Van Looy et al. (2008) showed that specific legislation on intellectual property rights concerning publicly funded research by universi-ties could encourage the emergence of university entre-preneurship (spin-offs), the original inventor taking a more active share in the product’s commercial devel-opment. Such legislation, modelled on the American Bayh-Dole Act of 1980 or the law in force in Belgium since the mid 1990s, grants ownership of the invention to the university while providing for appropriate remu-neration for the researcher.
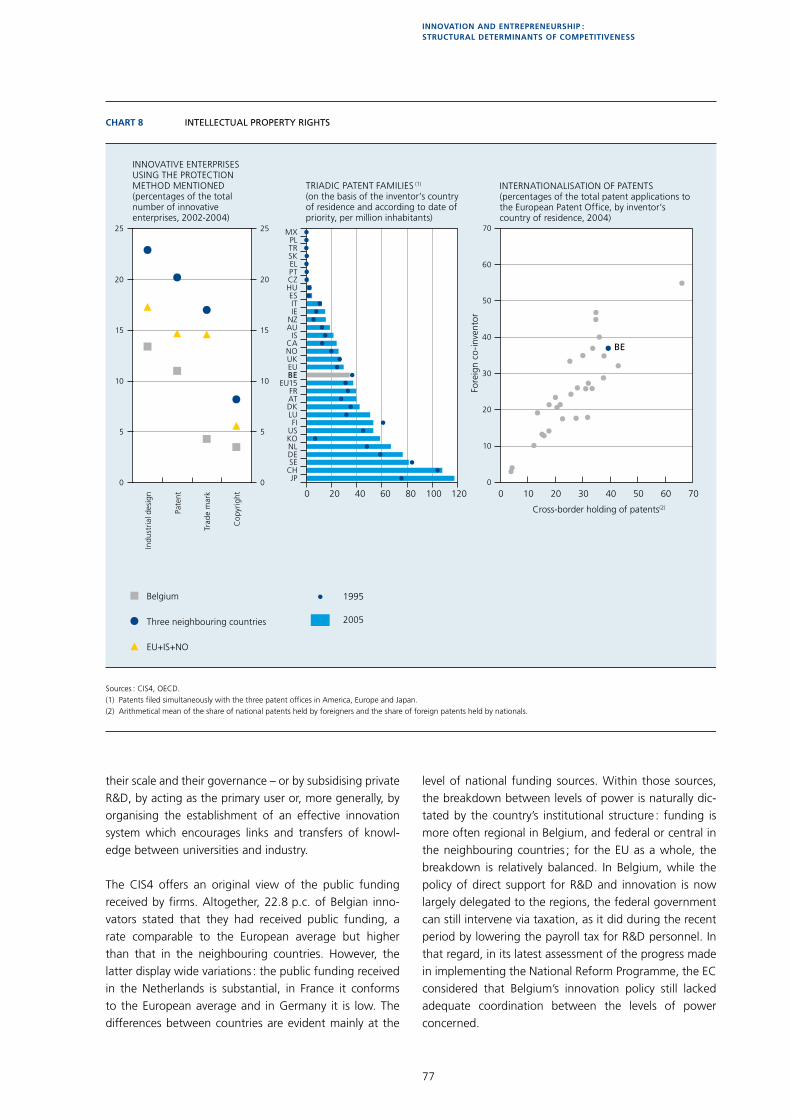
Generally speaking, Belgium lags behind in regard to the filing of applications for intellectual protection, which could imply that the innovations introduced are more directly practical. According to the CIS4 results, Belgian innovators make significantly less use of intellectual pro-tection methods of any kind than their counterparts in neighbouring countries and in the EU. The gap is particu-larly marked in the case of industrial design, the common-est form of protection ahead of patents.
In regard to triadic patents – patents filed simultane-ously with the American, European and Japanese patent offices – Belgium is in a relatively median position, close to that of the EU15 but well behind the Netherlands and Germany. Also, the rate of patent filing diminished slightly in Belgium between 1995 and 2005, whereas it increased in the great majority of countries. In this area, too, Belgium’s activity is highly international, so that the statistics should be viewed in that perspective. Thus, Belgium is among the countries with the highest level of cross-border ownership of patents and involvement of a foreign co-inventor : this concerns about 40 p.c. of the patents filed to the European Patent Office. On the other hand, in contrast to trade flows but more comparable to the situation in foreign direct investment, the United States is the leading partner country, although the EU is still predominant on account of cooperation with Germany and France.
Apart from general policies, governments may also exert a more direct influence on R&D and innovation, be it via their own R&D activities – from the point of view of both
innovAtion And entrepreneurship : structurAl determinAnts of competitiveness
77
H
H H
H
0
5
10
15
20
25
H
0 20 40 60 80 100 120
2005
1995
0 10 20 30 40 50 60 700
5
10
15
20
25
0
10
20
30
40
50
60
70
B
B
BB
B
J
JJ
J
J
J
J
J
J
J
JJ
J
JJ
J
J
J
J J
J
J
J
J
J
J
J
J
J
J
J
J
J
J
J
J
J
J
J
J
J
J
J
J
J
J
J
J
J
J
J
J
J
J
J
J
J
J
J
J
J
J
J
J
J
J
J
J
CHART 8 INTELLECTUAL PROPERTY RIGHTS
Sources : CIS4, OECD.(1) Patents filed simultaneously with the three patent offices in America, Europe and Japan.(2) Arithmetical mean of the share of national patents held by foreigners and the share of foreign patents held by nationals.
Indu
stri
al d
esig
n
Pate
nt
Trad
e m
ark
Cop
yrig
ht
Belgium
Three neighbouring countries
EU+IS+NO
Fore
ign
co-i
nven
tor
Cross-border holding of patents(2)
BE
INNOVATIVE ENTERPRISES USING THE PROTECTION METHOD MENTIONED(percentages of the total number of innovative enterprises, 2002-2004)
TRIADIC PATENT FAMILIES (1)
(on the basis of the inventor’s country of residence and according to date of priority, per million inhabitants)
INTERNATIONALISATION OF PATENTS(percentages of the total patent applications to the European Patent Office, by inventor’s country of residence, 2004)
JPCHSEDENLKOUSFI
LUDKATFR
EU15BEEUUKNOCA
ISAUNZIEITES
HUCZPTELSKTRPL
MX
their scale and their governance – or by subsidising private R&D, by acting as the primary user or, more generally, by organising the establishment of an effective innovation system which encourages links and transfers of knowl-edge between universities and industry.
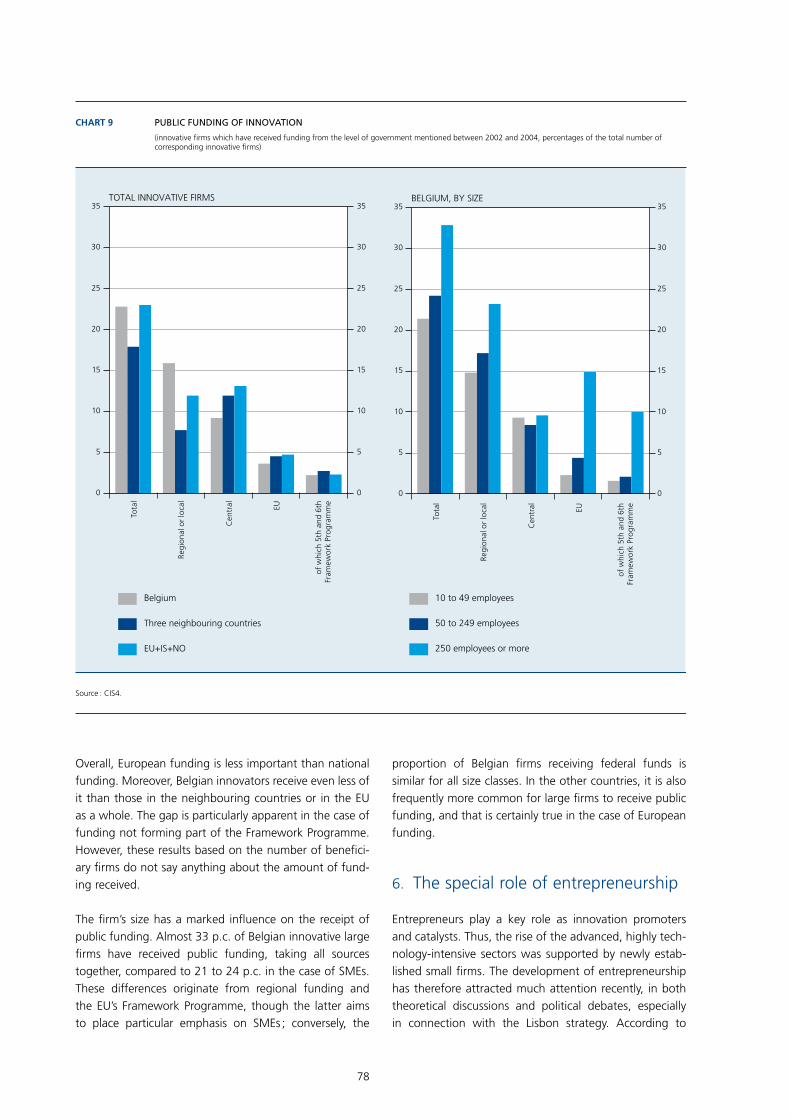
The CIS4 offers an original view of the public funding received by firms. Altogether, 22.8 p.c. of Belgian inno-vators stated that they had received public funding, a rate comparable to the European average but higher than that in the neighbouring countries. However, the latter display wide variations : the public funding received in the Netherlands is substantial, in France it conforms to the European average and in Germany it is low. The differences between countries are evident mainly at the
level of national funding sources. Within those sources, the breakdown between levels of power is naturally dic-tated by the country’s institutional structure : funding is more often regional in Belgium, and federal or central in the neighbouring countries ; for the EU as a whole, the breakdown is relatively balanced. In Belgium, while the policy of direct support for R&D and innovation is now largely delegated to the regions, the federal government can still intervene via taxation, as it did during the recent period by lowering the payroll tax for R&D personnel. In that regard, in its latest assessment of the progress made in implementing the National Reform Programme, the EC considered that Belgium’s innovation policy still lacked adequate coordination between the levels of power concerned.
78
0
5
10
15
20
25
30
35
0
5
10
15
20
25
30
35
0
5
10
15
20
25
30
35
0
5
10
15
20
25
30
35
CHART 9 PUBLIC FUNDING OF INNOVATION
(innovative firms which have received funding from the level of government mentioned between 2002 and 2004, percentages of the total number of corresponding innovative firms)
Source : CIS4.
Tota
l
Regi
onal
or
loca
l
Cen
tral EU
of w
hich
5th
and
6th
Fram
ewor
k Pr
ogra
mm
e
Belgium
Three neighbouring countries
EU+IS+NO
10 to 49 employees
50 to 249 employees
250 employees or more
TOTAL INNOVATIVE FIRMS BELGIUM, BY SIZE
Tota
l
Regi
onal
or
loca
l
Cen
tral EU
of w
hich
5th
and
6th
Fram
ewor
k Pr
ogra
mm
e
Overall, European funding is less important than national funding. Moreover, Belgian innovators receive even less of it than those in the neighbouring countries or in the EU as a whole. The gap is particularly apparent in the case of funding not forming part of the Framework Programme. However, these results based on the number of benefici-ary firms do not say anything about the amount of fund-ing received.
The firm’s size has a marked influence on the receipt of public funding. Almost 33 p.c. of Belgian innovative large firms have received public funding, taking all sources together, compared to 21 to 24 p.c. in the case of SMEs. These differences originate from regional funding and the EU’s Framework Programme, though the latter aims to place particular emphasis on SMEs ; conversely, the
proportion of Belgian firms receiving federal funds is similar for all size classes. In the other countries, it is also frequently more common for large firms to receive public funding, and that is certainly true in the case of European funding.
6. The special role of entrepreneurship
Entrepreneurs play a key role as innovation promoters and catalysts. Thus, the rise of the advanced, highly tech-nology-intensive sectors was supported by newly estab-lished small firms. The development of entrepreneurship has therefore attracted much attention recently, in both theoretical discussions and political debates, especially in connection with the Lisbon strategy. According to
innovAtion And entrepreneurship : structurAl determinAnts of competitiveness
79
Audretsch (2007), the establishment of a business makes it possible to eliminate the barriers relating, for instance, to divergences of individual perceptions which, in large firms, prevent new knowledge from being converted into commercial applications. The entrepreneurial capital which thus enters the production function has a large local dimension, as there is an evident tendency for innovation to be concentrated geographically, e.g. via clusters.
Like innovation, entrepreneurship is a complex phenom-enon to define and describe ; it may be viewed variously as the action of creating an activity, the inclination to do so, or a societal phenomenon. The main definitions put forward over the years indicate that the entrepreneur is an innovator, an industrial leader who creates new combina-tions of the means of production (Schumpeter), taking the risk relating to the uncertainty of the business (Knight). He thus displays an ability to be aware of the opportunities available on the market and to choose between them (Kirzner).
The entrepreneur is notable for the function which he per-forms, but has no specific status, be it as a self-employed person, shareholder or manager, so that various types of entrepreneur exist. Similarly, a policy aiming to encourage entrepreneurship is not equivalent to a policy targeting SMEs. The latter have their own needs connected with their size, justifying the provision of a level playing field, whereas entrepreneurship occurs in the preliminary phase, at the embryonic stage of the activity, or even when it is still just a project or idea.
While Audretsch et al. (2007) identify a fundamental ten-dency featuring the transition from a managerial economy to an entrepreneurial economy, a combination of small and large firms is of course necessary, as demonstrated by Keilbach and Sanders (2007), who distinguish between expanding the product range – which comes under explo-ration, and is therefore an entrepreneurial function – and improving the quality of existing products – which comes under operation, and is therefore an R&D function, more readily applied by large companies. This might explain
J
J
J
JJ
JJ
J
J
J
J
J
J
J
JJ
J
J
J
J
J
J
0 5 10 15 20 25 30
AU
DE
EL
IS
IE
IT
NZ
PT
NL
BE
0
3
6
9
12
15
0
0.5
1.0
1.5
2.0
2.5
0
2
4
6
8
10
12
14
16
18
SE
FI
FR
CHART 10 ENTREPRENEURSHIP
Sources : Compendia, Global Entrepreneurship Monitor, International Benchmark of Entrepreneurs.(1) Population in employment in the case of non-agricultural self-employment, population aged from 18 to 64 years in the case of nascent entrepreneurial activity.(2) 2004-2006 in the case of non-agricultural self-employment, the latest three years available over the period 2004-2007 in the case of nascent entrepreneurial activity.(3) Entrepreneurs at the preparatory stage or active for more than 3 months but less than 42 months.
IE UK DK US DE NL FI IT BE FR JP
Creations
Destructions
Jobs created by new activities (percentages of totalemployment in the economy, right-hand scale)
(left-hand scale)
Nas
cent
ent
repr
eneu
rial
act
ivit
y(3)
Non-agricultural self-employment
STATIC AND DYNAMIC MEASURES (percentages of the population concerned(1),average of the latest three years available(2))
CREATIONS AND DESTRUCTIONS OF FIRMS(percentages of the number of existing firms, unless otherwise stated, average 1995-2006)
US
80
the “European paradox” whereby the EU achieves good results in terms of patents – intermediate R&D results – but seems to have greater difficulty than the United States in converting them to marketable innovations owing to a lack of entrepreneurship.
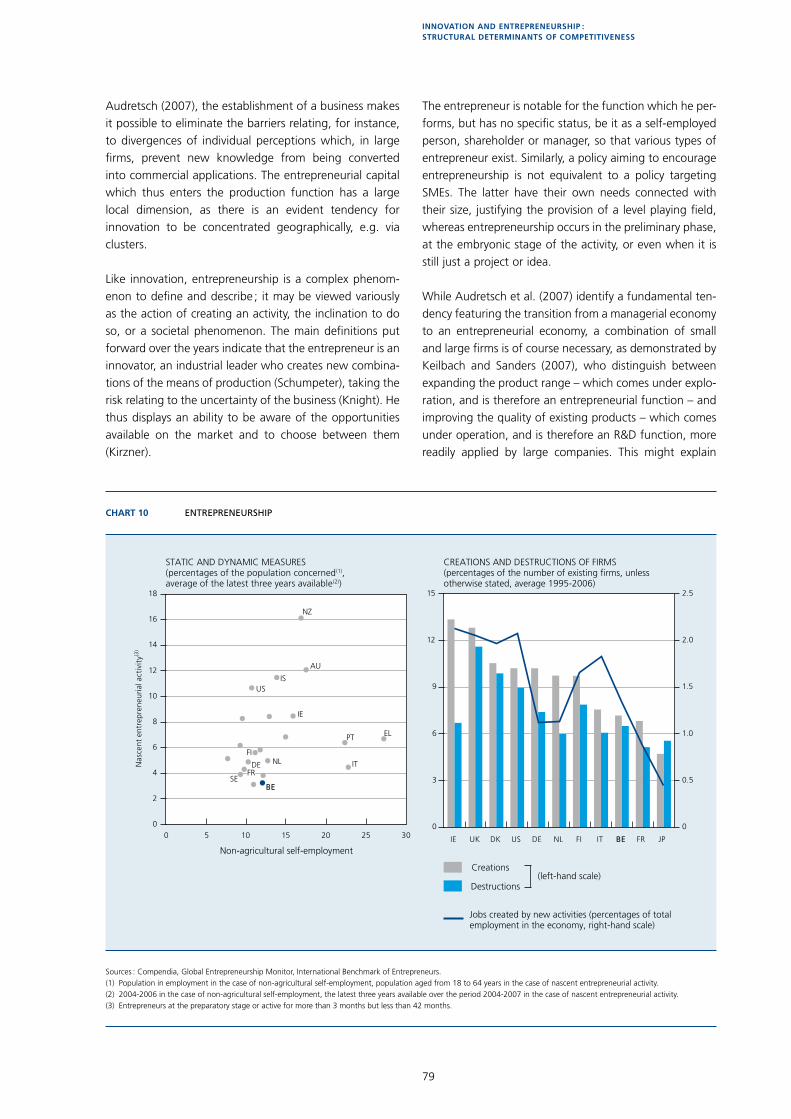
Given its multiple dimensions which are difficult to define, entrepreneurship is hard to measure, especially for the purpose of international comparison on the basis of harmonised indicators. It is traditional to use static approximations such as the number of self-employed persons, or dynamic ones such as the ratio of busi-ness formations or closures, or surveys assessing the behaviour of individuals or their inclination to set up a business.
It is clear from these various sources and indicators that Belgium is suffering from a serious deficit in entrepre-neurship. Although it holds a median position in terms of the proportion of non-agricultural self-employed workers (12 p.c. of employment), it has one of the lowest rates of nascent entrepreneurial activity, proof that self-employed status and entrepreneurial activity in the sense under-stood by this article represent two different realities. According to the GEM figures, in 2007 only 3.2 p.c. of the population aged 18 to 64 years had been pursuing an entrepreneurial activity for a short time (between 3 and 42 months) or had taken steps in that direction. However, the performance of France, Sweden and Germany is comparable or hardly any better, in contrast to Finland and the United States with scores of 6.9 and 9.6 p.c. respectively.
Observed over twelve years (1995-2006), the gap between the rates for the creation and disappearance of enterprises, known as turbulence, proves relatively small in Belgium. Attitudes towards starting a business, be it in terms of desire or feasibility, are in fact below the average for the three neighbouring countries and the EU25.
As in the case of innovation, the policies for boosting the level of entrepreneurship in an economy are many and varied, owing to the numerous individual, sectoral and macroeconomic factors which may exert an influ-ence. Moreover, action is needed primarily in the early stages, as the hardest obstacles to overcome apparently arise before the initial steps leading to the creation of a business, as shown by van der Zwan et al. (2006). That same study, which endeavours to explain the propensity to become an entrepreneur, reveals the inhibiting influ-ence of the perception of administrative charges, and sometimes the existence of a negative country effect, particularly in Belgium.
In broad terms, Audretsch et al. (2007) identify seven groups of determinants affecting supply and/or demand in the case of entrepreneurs, and hence seven routes for political intervention. These include general policies already mentioned in the determination of a favour-able framework for innovation (funding, training, market organisation, etc.), but also policies influencing individual choices between employee and self-employed status, and individual preferences (values and attitudes towards risk) which are much harder to influence.
Conclusion
Innovation and its catalyst entrepreneurship constitute the cornerstone underpinning the growth of economies which have reached an advanced stage of development. Innovation takes place according to a process involving numerous elements which may influence its chances of success. Political measures in favour of innovation there-fore potentially cover a broad field and are not confined to an indiscriminate increase in R&D budgets. In particular, the general framework in which an economy operates, its structural characteristics and its history are too important to ignore.
Thus, in the case of Belgium, the fact that it is a small open economy means that its innovation activity is largely determined by foreign enterprises. That is manifested in the percentage of R&D expenditure funded by other countries, and in the often international character of the patents resulting from its research. Similarly, the group – often foreign – to which an enterprise belongs plays a substantial role as an innovation source or cooperation partner. Finally, large Belgian enterprises, which are par-ticularly innovative compared to their European counter-parts, mostly belong to a foreign group.
It is therefore especially difficult in Belgium to isolate R&D activity from the international context, since the results of research conducted there benefit other countries, while at the same time the Belgian economy seems to benefit more from research conducted elsewhere. A European view is therefore necessary.
Moreover, the structural attention paid to public finances clearly has to do with the inadequate level of public R&D, which is a support and essential complement for private R&D. Furthermore, the allocation of competence in a federal State requires efficient coordination of policies conducted at the various levels of power, and that is not yet sufficiently the case in Belgium, as pointed out by the EC in its latest assessment of the progress made in implementing the National Reform Programme.
innovAtion And entrepreneurship : structurAl determinAnts of competitiveness
81
In addition, the structure of activity in the Belgian econ-omy, such as its specialisation in intermediate goods, does influence its innovative profile. The position of Belgian firms at the centre of the international production chain means that innovations take greater account than else-where of the needs of customers and suppliers, and tend towards improvements to existing products rather than the development of new products designed to conquer new markets. Similarly, Belgian enterprises make relatively less use of R&D, but compensate for that lack by the acquisition of external knowledge, something which is certainly favoured by their external openness and their membership of a group.
While these structural characteristics may in some respects weaken the innovation process, they can also be seen as strengths, above all via the high degree of adaptability
and absorption capacity of Belgian firms. The need now is to consolidate these advantages and work on the most glaring weaknesses in order to set up an efficient innovation system. Among the various general conditions necessary for encouraging innovation, training remains a priority, insofar as human capital forms an essential pillar of a knowledge-based economy. In addition to its general contribution to the improvement of the labour market, strengthening basic and further training can yield benefits at various stages in the innovation process : providing scientific personnel for R&D, developing entrepreneurial spirit, facilitating the spread of ICT in the economy, etc.
Efficient factor and product markets are also indispensa-ble. Examples here are the availability of suitable funding for new companies and the supply of network products such as gas, electricity and broadband connections.
82
Bibliography
Aghion P. (2006), A primer on innovation and growth, Bruegel Policy Brief, 2006/06.
Aghion P. and P. Howitt (1992), A model of growth through creative destruction, Econometrica, 60, 323-351.
Aghion P. and P. Howitt (2006), Joseph Schumpeter lecture – Appropriate growth policy : a unifying framework, Journal of the European Economic Association, Volume 4, 2-3, 269-314.
Audretsch D. (2007), Entrepreneurship capital and economic growth, Oxford Review of Economic Policy, Volume 23, 1, 63-78.
Audretsch D., I. Grilo and R. Thurik (2007), Explaining entrepreneurship and the role of policy : a framework, in Handbook of research on entrepreneurship policy, Edward Elgar, London.
Biatour B. and C. Kegels (2008), Determinants of innovation in a small open economy : the case of Belgium, Working Paper 11-08.
Crépon B., E. Duguet and J. Mairesse (1998), Research, innovation and productivity : an econometric analysis at the firm level, NBER Working Paper 6696.
EC (2007a), The EU’s R&D Deficit and Innovation Policy, 2nd report of the Expert group on knowledge for growth, http ://ec.europa.eu/invest-in-research/pdf/download_en/rdd_deficit_report0207.pdf.
EC (2007b), Key figures 2007, Towards a European Research Area – Science, Technology and Innovation.
Erken H. and F. van Es (2007), Disentangling the R&D shortfall of the EU vis-à-vis the US, Jena Economic Research Papers, 107.
Jaumotte F. and N. Pain (2005), Innovation in the business sector, OECD Economics Department Working Papers 459.
Johansson B., C. Karlsson and M. Backman (2007), Innovation policy instruments, CESIS Electronic Working Paper Series, 105.
Jones C. (1995), R&D based models of economic growth, Journal of Political Economy, 103, 759-784.
Keilbach M. and M. Sanders (2007), Exploration and exploitation – The role of entrepreneurship and R&D in the process of innovation, Jena Economic Research Papers 108.
Mathieu A. and B. van Pottelsberghe (2008), A note on the drivers of R&D intensity, CEB Working Paper, 08/002.
Nelson R. and S. Winter (1982), An evolutionary theory of economic change, Cambridge, Belkap Press.
OECD (2006), Encouraging innovation : an overview of performance and policies, Going for Growth, Chapter 3, 55-83.
Romer P. (1986), Increasing returns and long-run growth, Journal of Political Economy, 94, 1002-1037.
Romer P. (1990), Endogenous technological change, Journal of Political Economy, 98, S71-S102.
Schumpeter J. (1911), Theorie der wirtschaftlichen Entwicklung, Berlin, Duncker und Humblot.
Solow R. (1956), A contribution to the theory of economic growth, Quarterly Journal of Economics, 70, 65-94.

innovAtion And entrepreneurship : structurAl determinAnts of competitiveness
83
Srholec M. and B. Verspagen (2008), The voyage of the beagle in innovation systems land. Explorations on sectors, innovation, heterogeneity and selection, TIK working paper on innovation studies 20080220.
van der Zwan P., R. Thurik and I. Grilo (2006), The entrepreneurial ladder and its determinants, Tinbergen Institute Discussion Paper, 103/3.
Van Looy B., M. Du Plessis, M. Meyer and K. Debackere (2008), The impact of legislative framework conditions on the entrepreneurial activities of universities : an (empirical) assessment, in monthly socio-economic newsletter of the Central Economic Council, May, 12-15.
van Pottelsberghe B. (2008), Europe’s R&D : missing the wrong targets ?, Bruegel Policy Brief, 2008/03.