innovation and competition: the role of the product...
TRANSCRIPT
Innovation and Competition: The Role of the
Product Market*
Guillermo Marshall� Alvaro Parra�
July 24, 2018
Abstract
We study how competition impacts innovation (and welfare) when firms
compete both in the product market and in innovation development. This
relationship is complex and may lead to scenarios in which a lessening of com-
petition increases R&D and consumer welfare in the long run. We provide
conditions for when competition increases or decreases industry innovation
and welfare. These conditions are based on properties of the product market
payoffs. Implications for applied work are discussed.
JEL: D43, L40, L51, O31, O34, O38
Keywords: sequential innovation, product market competition
*We thank Dan Bernhardt, Ken Corts, Federico Etro, Richard Gilbert, Mitsuru Igami, AsadKhan, Jorge Lemus, Franco Mariuzzo, Travis Ng, Volker Nocke, Thomas Ross, Wilfried Sand-Zantman, and Ralph Winter for comments and suggestions. We also thank seminar and confer-ence participants at CEA, CRESSE, EARIE, FTC, IIOC, Miami, PUC-Chile, UBC, and Yalefor helpful comments. The usual disclaimer applies.
�Department of Economics, University of Illinois at Urbana-Champaign, 214 David KinleyHall, 1407 W Gregory St, Urbana, IL 61801. [email protected]
�Sauder School of Business, University of British Columbia, 2053 Main Mall, Vancouver, BC,V6T1Z2, Canada. [email protected]
1

I Introduction
Merger policy is based on the premise that a lessening of competition is likely to
hurt consumers. This view has guided the analysis of mergers in innovative indus-
tries on both sides of the Atlantic despite a lack of consensus on how competition
impacts innovation outcomes.1 For example, Aghion et al. (2005) empirically find
a non-monotonic relationship between competition and patenting, which raises
the possibility that a lessening of competition may benefit consumers through en-
hanced innovation. To inform this debate, we seek to provide applied researchers
with conditions for when to expect monotonic or non-monotonic relationships be-
tween competition and innovation.
We analyze how competition affects firms’ incentives to innovate and consumer
welfare, focusing on the role played by the product market. To this end, we
propose a dynamic model of an innovative industry that accommodates arbitrary
product market games (e.g., quantity competition with homogeneous goods, price
competition with differentiated products, etc.), and study how the product market
game being played by the firms shapes the relationship between competition and
innovation. The motivation behind examining the role played by the product
market stems from the observation that firms invest in R&D because they wish
to gain a product market advantage (e.g., a greater product quality or a lower
marginal cost). Because competition impacts product market payoffs, competition
impacts the incentives to invest in R&D through the product market.
In concrete terms, we develop a sequential extension to the classic patent-
race models (Loury 1979, Lee and Wilde 1980, and Reinganum 1982) by allowing
firms to compete both in developing a series of innovations and in the product
market. We allow for large firms that compete in developing innovations and
in the product market as well as research labs that only compete in developing
innovations. The distinction between large firms and labs captures the fact that
firms are asymmetric in both size and scope in many innovative industries (e.g.,
pharmaceutical industry). Through successful innovation, a large firm becomes
1See, for instance, the complaint filed by the Federal Trade Commission (FTC) concerningthe merger between Pfizer Corporation and Wyeth Corporation, as well as the complaints filedby the Department of Justice (DOJ) concerning the merger between Regal Beloit Corporationand A.O. Smith Corporation and the merger between The Manitowoc Company, Inc. and Enodisplc. A similar argument was provided by the European Commission (EC) in its investigationsof Qualcomm’s proposed acquisition of NXP, Bayer’s proposed acquisition of Monsanto, and theproposed merger between Dow and DuPont. In fact, the Dow and DuPont merger was clearedby the European Commission subject to a divestiture of DuPont’s R&D organization.
2

the market leader, replacing the previous leader. When a research lab successfully
innovates, it auctions the innovation to a large firm, which results in a new industry
leader. Being the leader provides a firm with an advantage in the product market—
for instance, due to a cost or quality advantage—which creates a positive profit
gap between the leader and the followers.
In the model, competition affects innovation through two channels. First, hold-
ing product market profits equal, a reduction in the number of firms performing
R&D reduces the pace of innovation in the industry (Reinganum, 1985). Most of
the patent race literature has focused on this first mechanism. Secondly, because
competition has a direct effect on the product market payoffs and, consequently,
the profit gap that exists between the leader and the followers, competition affects
the incentives to innovate through the product market. Depending on the specifics
of the product market game, a lessening of competition may increase or decrease
the profit gap between leaders and followers. This creates a potentially countervail-
ing effect on the incentives to innovate, which may generate a monotonic-increasing
or non-monotonic relationship (e.g., inverted-U or N shaped) between innovation
outcomes and the number of large firms.
Although the relationship between competition and innovation may in princi-
ple take various shapes, the product market game being played by the firms puts
restrictions on this relationship. Product market games can be categorized accord-
ing to the properties of an equilibrium object: the profit gap between the leader
and followers.
We show that when the profit gap between the leader and followers is weakly
increasing in the number of large firms, competition always increases the indus-
try’s innovation rate. Because competition also (weakly) decreases equilibrium
prices, competition unequivocally increases the discounted expected consumer sur-
plus in this case. Product market games that feature a weakly increasing profit
gap include some parameterizations of price and quantity competition games with
homogeneous goods.
We also show that a profit gap between the leader and followers that is decreas-
ing in the number of large firms is necessary but not sufficient for competition to
decrease the industry’s innovation rate. When the number of research labs is suf-
ficiently large, however, a profit gap that is decreasing in the number of large
firms is sufficient for competition to decrease the industry’s innovation rate. Some
parameterizations of quantity competition games with homogeneous goods and
3

price competition games with differentiated products are examples that feature a
decreasing profit gap.
Because competition decreases equilibrium prices, a negative relationship be-
tween competition and innovation is not one-to-one with a negative relationship
between competition and consumer welfare. However, we show that when the
number of research labs is sufficiently large, a profit gap that is decreasing in the
number of large firms suffices for competition to decrease the discounted expected
consumer surplus. That is, there are scenarios in which a lessening of competition
may increase consumer welfare in the long run. In these scenarios, the increased
arrival rate of innovations more than compensates for the welfare loss that results
from static price effects.
These results are constructive in that they isolate a specific property of the
product market payoffs that is key for understanding the relationship between
innovation and competition. As well, our analysis calls for the use of flexible
demand systems when conducting model-based competition analyses in innovative
industries. A lack of model flexibility may restrict the product market payoffs in
ways that prevent the data from showing the true relationship between competition
and innovation.
The rest of the paper is organized as follows. Section II introduces the model
and characterizes the equilibrium. Section III analyzes how market structure af-
fects innovation and welfare outcomes. Section IV provides numerical examples to
illustrate the results. Lastly, Section V concludes.
I(i) Literature Review
The question of how competition affects the incentives to innovate stems from
the work of Schumpeter (1942).2 The literature has taken two approaches to
modeling the relationship between R&D investments and its returns. The first
branch assumes that R&D investments deliver deterministic returns. The second
branch—the patent race literature—assumes a stochastic link in which greater
investments lead to greater innovation rates.
In a deterministic-R&D model, Dasgupta and Stiglitz (1980a) (henceforth, DS)
study the role of product market competition in a scenario in which symmetric
firms compete a la Cournot and in developing process innovations. Under an
isoelastic demand assumption, the authors show that an increase in the number
2See Gilbert (2006) and Cohen (2010) for surveys of the literature.
4
of firms decreases each firms’ investments, but increases aggregate investments.
More recently, Vives (2008) generalizes these findings by allowing for a broader
set of demand functions and price competition games. Ishida et al. (2011) shows
that the assumption of symmetric firms is critical for the results in DS: in quantity
competition models with high- and low-costs firms, an increase in the number of
high-cost firms only leads to DS’s result among high-cost firms, as low-cost firms
experience enhanced incentives to innovate. In price competition models, Motta
and Tarantino (2017) identify conditions under which DS’s result holds when the
reduction of competition is due to a merger. In contrast to these papers, we
show that once dynamics are incorporated, the relationship between competition
and innovation is richer than previously described. We illustrate this in Section
IV, where we present an example satisfying DS’s original assumptions about the
product market game—Cournot competition with isoelastic demand—in which a
lessening of competition may lead to enhanced or reduced innovation incentives
both at the individual and aggregate level.
Early work in the patent race literature often omitted the role of product market
competition and dynamic considerations (Loury 1979, Lee and Wilde 1980, and
Reinganum 1982).3 In a single-innovation model, Dasgupta and Stiglitz (1980b)
modeled payoffs as the result of product market competition, but did not study
how competition affects innovation outcomes. Reinganum (1985) incorporated
dynamics by studying a sequence of patent races where firms compete through
a ladder of innovations. She finds results analogous to DS in a context where
product market payoffs are unaffected by the number of competitors. Aghion et al.
(2001), Aghion et al. (2005), and other follow-up papers have examined the impact
of product market competition on innovation decisions in duopolistic markets. In
these models, the duopolists compete in prices, and competition is captured by the
degree of substitution between the products sold by the firms. A key observation
in these papers is that innovation is driven by the “escape competition” effect,
i.e., the difference between the payoffs before and after the introduction of an
innovation. We build upon these ideas by extending the model to an arbitrary
number of firms and allowing for general product market games. We directly link
3Although the patent race literature has a dynamic dimension—the expected arrival timeof innovations—we use the term dynamic to incorporate the intertemporal tradeoffs that arisewhen firms compete in developing a sequence of innovations and in the product market. Forexample, the tradeoff that arises when a lessening of competition increases prices in the shortrun but enhances the rate at which innovations reach the market is an intertemporal tradeoffthat is absent in the early patent race literature.
5

the escape of competition effect (and, thus, R&D outcomes) with product market
outcomes. A key finding in our paper is that the relation between competition
and innovation is determined by a combination of how firms compete (quantity or
prices) and the shape of the demand function. This finding has consequences for
empirical work, as some parametric choices may lead to empirical models that are
not flexible enough to capture the effects of competition on innovation.
Our analysis is built upon a standard dynamic model of innovation. Versions
of the model have been used by Aghion and Howitt (1992) to study endogenous
growth; Segal and Whinston (2007) to study the impact of antitrust regulation on
innovation outcomes; Acemoglu and Akcigit (2012) to study an IP policy contin-
gent on the technology gap among firms; Denicolo and Zanchettin (2012) to study
leadership cycles; Acemoglu et al. (2013) to study productivity growth and firm re-
allocation; and by Parra (2018) to study the dynamics of the Arrow’s Replacement
Effect and its impact on patent design.
Our paper also relates to the horizontal merger literature.4 Several authors have
discussed at a conceptual level how innovation considerations should be incorpo-
rated into merger analysis (see, for instance, Gilbert and Sunshine 1995, Evans and
Schmalansee 2002, Katz and Shelanski 2005, 2007), and a number of recent papers
have explored this issue empirically or using computational methods.5 Although
we do not model merger decisions (or merger-specific synergies), we contribute to
this literature by providing analytic results that clarify the role played by market
concentration on firms’ investment decisions.
II A Model of Sequential Innovations with Prod-
uct Market Competition
Consider a continuous-time infinitely lived industry where n+m+1 firms compete
in developing new innovations (or products). Among these, n+1 firms are large in
4See, for example, Williamson (1968), Farrell and Shapiro (1990), Gowrisankaran (1999),Nocke and Whinston (2010, 2013), Federico et al. (2017).
5Ornaghi (2009) studies mergers in the pharmaceutical industry and their impact in R&D.Igami and Uetake (2015) studies the relation between mergers and innovation in the hard-driveindustry and Entezarkheir and Moshiri (2015) performs a cross-industry analysis. Mermelsteinet al. (2015) and Hollenbeck (2015) use computational methods to study optimal merger policy ina dynamic oligopoly model with endogenous capital and R&D investments, while Federico et al.(2018) simulate the impact of a horizontal merger on consumer welfare and innovation using astatic model.
6
the sense that they also compete in the product market selling final products. The
remaining m firms auction their innovations to the large firms; we call the latter
set of firms research labs.
Competition in the product market is characterized by one technology leader
and n > 0 symmetric followers (or competitors). For tractability purposes, we
assume that the market leader is always one step ahead of the followers in terms of
the technology to which they have access.6 We relax this assumption in the Online
Appendix, where we allow the leader to invest in increasing its technological lead
relative to the followers.
The market leader obtains a profit flow πln > 0, whereas each follower obtains
a profit flow πfn ∈ [0, πln). Both πln and πfn are weakly decreasing in the number of
product market competitors in the industry (i.e., large firms), n, capturing that
more intense product market competition decreases firm profits. For the purpose of
reducing the dimensionality of the state space and making analytic results feasible,
we assume that the profit flows are stationary in the number of innovations. We
emphasize that our results do not depend on this stationarity assumption.
Our framework allows for general forms of product market competition. For
instance, firms can compete through prices, quantities, or qualities. It also allows
for competition in various types of innovations. Firms may compete in developing
process innovations, quality improvements, or products that leave previous vintages
obsolete.7
Research labs do not compete in the product market and their only source of
profits is the revenue they derive from selling their innovations to large firms. We
assume that research labs sell their innovations using a second-price auction. In
case of a tie, we assume that the innovation is randomly assigned to one of the
tying followers.8 All firms discount their future payoffs at a rate of r > 0.
At each instant in time, every follower and research lab invests in R&D in order
to achieve an innovation. Firm i chooses a Poisson innovation rate xi at a cost
of c(xi). We assume that c(xi) is strictly increasing, twice differentiable, strictly
convex (i.e., c′′(x) > 0 for all x ≥ 0), and satisfies c′(0) = 0. The assumption that
6More precisely, this common assumption in the literature can be distilled as the conjunctionof two independent assumptions about the nature of patent protection: a) a patent makes fulldisclosure of the patented technology, which allows followers to build upon the latest technology,leap-frogging the leader once they achieve an innovation; b) the legal cost of enforcing olderpatents more than exceeds the benefits of enforcing the patent.
7Sections III and IV provide examples where all the assumptions of the model are satisfied.8This assumption simplifies exposition and does not affect the results of the paper.
7
large firms and labs are equally productive along the R&D dimension is for nota-
tional ease. Introducing asymmetries does not impact our results in a significant
way. We also assume that the Poisson processes are independent among firms,
generating a stochastic process that is memoryless.
We focus on symmetric and stationary Markov perfect equilibria by using a
continuous-time dynamic programming approach. Our assumptions guarantee the
concavity of the value functions, implying equilibrium uniqueness.
Let Vn,m represent the value of being the market leader, Wn,m the value of being
a follower, and Ln,m the value of being a research lab when there are n followers
and m labs in the industry. At time t, we can write the value functions of the
different types of firms as follows:
rVn,m = πln − λn,m(Vn,m −Wn,m), (1)
rWn,m = maxxi
πfn + xi(Vn,m −Wn,m)− c(xi), (2)
rLn,m = maxyi
yi(Vn,m −Wn,m)− c(yi), (3)
where λn,m =∑n
i xi +∑m
j yj captures the rate at which innovations reach the
market (i.e., the industry-wide pace or speed of innovation).9 In words, the flow
value of being the market leader at any instant of time, rVn, is equal to the
profit flow obtained at that instant plus the expected loss if an innovation occurs,
λn,m(Wn,m−Vn,m), where λn,m is the rate at which some firm successfully innovates.
The instantaneous value of being a follower, rWn,m, is equal to the profit flow plus
the expected incremental value of becoming the leader, xi(Vn,m−Wn,m)—where xi
is the rate at which follower i successfully innovates—minus the flow cost of R&D,
c(xi). Finally, the flow value of being a research lab is equal to the expected payoff
of successfully innovating and selling an innovation, yi(Vn,m −Wn,m)—where yi is
the rate at which lab i successfully innovates—minus the flow cost of R&D, c(yi).
Note that since all large firms are symmetric, large firms value an innovation in
Vn,m−Wn,m. These valuations, in conjunction with the auction format, imply that
labs sell their innovations at price Vn,m −Wn,m in equilibrium.10
In the context of this model, the infinitely long patent protection and the
assumption that a new innovation completely replaces the old technology implies
9See the Appendix for a full derivation of the value functions.10Since the winning bidder of an auction held by a lab earns zero surplus, we do not include
auction payoffs in the value functions of the leader and followers.
8
that the incumbent has no incentives to perform R&D. That is, the leader’s lack
of R&D is an implication of our modeling choices rather than an assumption; see
Parra (2018) for a formal proof. In the Online Appendix, we extend the model
to allow for the leader to increase the quality of its innovation, attenuating the
leader’s replacement effect, inducing the leader to invest in R&D.
Maximizing value functions (2) and (3), and imposing symmetry among fol-
lowers and research labs, we obtain xi = yi = x∗n,m, where
c′(x∗n,m) = Vn,m −Wn,m (4)
or x∗n,m = 0 if c(0) > Vn,m −Wn,m; with the subindices n and m capturing how
market structure affects R&D decisions. Equation (4) tells us that, at every instant
of time, the followers and research labs invest until the marginal cost of increasing
their arrival rate is equal to the incremental rent of achieving an innovation. The
incremental rent of achieving an innovation relates to the “escape competition”
effect in Aghion et al. (2001), as Vn,m −Wn,m represents the benefits of escaping
competition through an innovation.
Strict convexity implies that condition (4) can be inverted so that x∗n,m =
f(Vn,m −Wn,m), where f(z) is a strictly increasing function of z.11 By replacing
x∗n,m into equations (2) and (3), we can solve the game and prove the following
proposition.
Proposition 1 (Market equilibrium). There is a unique symmetric equilibrium,
which is determined by the solution of the system of equations (1–4).
It can be easily verified that the payoffs in this model possess the expected
comparative statics for given values of n and m. For instance, the value functions
increase with larger profit flows or a lower interest rate (all else equal).
III Market Structure and Performance
We next study how market structure affects R&D outcomes and, more generally,
consumer welfare. Market structure affects dynamic incentives to invest in R&D
through two channels: product market competition and innovation competition.
We explore how these two forms of competition interact and determine market
outcomes.
11This function is further characterized in Lemma 1 in the Appendix.
9

III(i) Pace of Innovation
We begin our analysis by considering how an isolated change in innovation com-
petition or product market competition affects innovation outcomes. Although a
change in the number of large firms—i.e., firms competing in innovation develop-
ment and in the product market—affects both forms of competition simultaneously,
this exercise gives us a first approach to understanding how each form of competi-
tion affects R&D outcomes. A key object in our analysis is the profit gap between
the leader and a follower, ∆πn ≡ πln − πfn, which measures the (static) product
market benefit of being the market leader. While most models of product market
competition predict that both πln and πfn are weakly decreasing in n; the profit
gap can either increase or decrease with n even when both πln and πfn are weakly
decreasing in n (see examples in Table I).
Proposition 2 (Product market and innovation competition). Competition affects
innovation outcomes through two channels:
i) Product market competition: Fixing the number of firms, an increase in the
profit gap between the leader and a follower, ∆πn, increases each firm’s R&D
investment, x∗n,m, and the pace of innovation in the industry, λn,m.
ii) Innovation competition: A decrease in the number of research labs, m, de-
creases the overall pace of innovation in the industry, λn,m, but increases
each firm’s R&D investment, x∗n,m.
Firms’ incentives to invest in R&D are driven by the incremental rent obtained
from an innovation (see equation (4)). Proposition 2 tells us that the incremental
rent is increasing in the profit gap between the leader and the followers, and a
greater profit gap increases the pace of innovation. This result implies that because
product market concentration changes product market payoffs—and, consequently,
the profit gap—product market concentration has an impact on the incentives
to invest in R&D.12 As we shall see later, a specific property of the profit gap
determines the shape of the relationship between competition and the pace of
innovation.
12It is through this channel that our analysis differs from the growth through innovation lit-erature (e.g., Aghion et al. 2001), which has examined how the intensity of product marketcompetition—captured by the degree of substitution among a fixed number of firms or the de-gree of collusion between firms—affects innovation. In our analysis, we explicitly study how achange in the number of competitors affects innovation through changes in product market pay-offs. Our analysis encompasses substitution effects as well as various forms of competition andtypes of innovations.
10

From Proposition 2 we also learn that innovation competition affects the pace
of innovation in two ways. To understand these effects, suppose we decrease the
number of research labs by one. Varying the number of labs is convenient because
it allows us to abstract away from product market effects, as labs do not compete in
the product market. First, the reduction in the number of firms performing R&D
has a direct negative effect on the pace of innovation in the industry, λn,m (i.e.,
fewer firms performing R&D). Second, this reduction in λn,m increases the expected
time between innovations, extending the lifespan of a leader and raising the value
of being a market leader, Vn,m. This causes an increase in the incremental rent of
an innovation, incentivizing the remaining firms to invest more in R&D. Although
each remaining firm increases its R&D investment, the first effect dominates, and
the lessening of innovation competition leads to a decrease in the industry’s pace
of innovation.13 A similar result is discussed in Reinganum (1985).
Proposition 2 illustrates how product market competition and innovation com-
petition affect the incentives to innovate in isolation. A change in the number
of large firms, however, affects both forms of competition simultaneously. The
interaction between these forms of competition is complex, as these effects may
either reinforce or collide with each other. Because of the interaction of these ef-
fects, the relationship between competition and innovation may be monotonic or
non-monotonic. Figure 1 shows some examples based on parameterizations of the
model that we discuss in Section IV.
Although the relationship between competition and innovation may in princi-
ple take various shapes, the product market game being played by the firms puts
restrictions on this relationship. Product market games can be categorized ac-
cording to an equilibrium object: the profit gap between the leader and followers.
We say that the product market payoffs have a decreasing profit gap between the
leader and a follower when an increase in the number of large firms, n, decreases
the profit gap, ∆πn. Likewise, we say that the product market payoffs have an
increasing profit gap between the leader and a follower when an increase in the
number of large firms, n, increases the profit gap, ∆πn. Table I shows examples of
product market games, and provides information about the shape of the profit gap
in each example. For instance, a constant-elasticity demand in a quantity compe-
tition game can deliver a profit gap that is increasing or decreasing in the number
13The net effect of a decrease in the number of research labs on λn,m must be negative, as itwas the initial decrease in the pace of innovation that triggered the increase in the incrementalrent of an innovation in the first place.
11
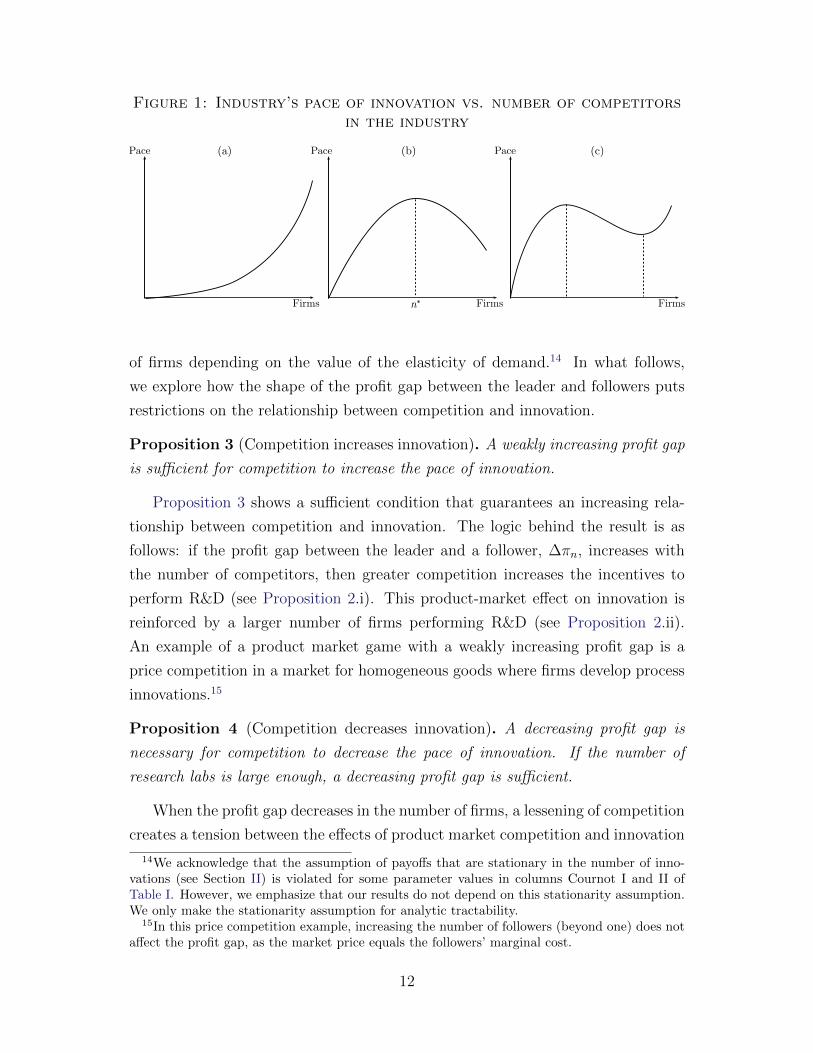
Figure 1: Industry’s pace of innovation vs. number of competitorsin the industry
Pace
Firmsn*
Pace
Firms
Pace
Firms
(b)(a) (c)
of firms depending on the value of the elasticity of demand.14 In what follows,
we explore how the shape of the profit gap between the leader and followers puts
restrictions on the relationship between competition and innovation.
Proposition 3 (Competition increases innovation). A weakly increasing profit gap
is sufficient for competition to increase the pace of innovation.
Proposition 3 shows a sufficient condition that guarantees an increasing rela-
tionship between competition and innovation. The logic behind the result is as
follows: if the profit gap between the leader and a follower, ∆πn, increases with
the number of competitors, then greater competition increases the incentives to
perform R&D (see Proposition 2.i). This product-market effect on innovation is
reinforced by a larger number of firms performing R&D (see Proposition 2.ii).
An example of a product market game with a weakly increasing profit gap is a
price competition in a market for homogeneous goods where firms develop process
innovations.15
Proposition 4 (Competition decreases innovation). A decreasing profit gap is
necessary for competition to decrease the pace of innovation. If the number of
research labs is large enough, a decreasing profit gap is sufficient.
When the profit gap decreases in the number of firms, a lessening of competition
creates a tension between the effects of product market competition and innovation
14We acknowledge that the assumption of payoffs that are stationary in the number of inno-vations (see Section II) is violated for some parameter values in columns Cournot I and II ofTable I. However, we emphasize that our results do not depend on this stationarity assumption.We only make the stationarity assumption for analytic tractability.
15In this price competition example, increasing the number of followers (beyond one) does notaffect the profit gap, as the market price equals the followers’ marginal cost.
12

Table I: Product market competition and the slope of the profitgap: examples
Bertrand Cournot I Cournot II Logit
Differentiation No No No Yes
Innovation type Process Process Process Quality ladder
Leader advantageMarginal cost advantage:mcl = βmcf , β ∈ (0, 1)
Quality gap: κ > 0
Demand Q = Q(P ) Q = a/P 1/σ Q = a/P 1/σsl = exp{κ−pl}
exp{κ−pl}+n exp{−pf}
sf =exp{−pf}
exp{κ−pl}+n exp{−pf}
Restrictions None (1+β)(1−β)
σ(n−σ)(n−1)
< 1 (1+β)(1−β)
σ(n−σ)(n−1)
> 1Firm-level horizontal
differentiation
Profit gap Weakly increasing Increasing Decreasing Decreasing
Notes: Subscripts l and f denote leader and follower, respectively. For simplicity, we assumethat the horizontal differentiation in the logit model (i.e., the idiosyncratic taste shocks) is at thefirm rather than the product level. See Marshall (2015) for an application with a closely relatedmodel.
competition. On the one hand, the decrease in product market competition in-
creases the profit gap and, consequently, increases the incentives to perform R&D
(see Proposition 2.i). On the other hand, a lessening of innovation competition has
a negative effect on the pace of innovation (see Proposition 2.ii). Although this
tension may result in an increased pace of innovation (see Section IV for examples),
Proposition 4 shows that in industries in which research labs play an important
role in total R&D, a decreasing profit gap between the leader and a follower is
sufficient for a lessening of competition to increase the pace of innovation.16
The intuition for the sufficiency result in Proposition 4 follows from observing
that the R&D incentives of research labs and large firms are aligned (see equation
(4)). When market concentration increases R&D incentives, research labs magnify
this effect, as more firms are affected by the enhanced incentives to perform R&D.
As shown in Section IV, however, competition may decrease the pace of innovation
even in the absence of research labs (m = 0). As well, we note here that the auction
mechanism used by labs simplifies the analysis, but it is not necessary for these
16The proof that a decreasing profit gap is sufficient for competition to decrease the pace ofinnovation for a sufficiently large m uses strict convexity of the cost function (i.e., c′′(x) > 0 forall x ≥ 0). We note, however, that the result applies for a broader set of cost functions. Forinstance, the result also applies for all cost functions satisfying c(x) = xγ/γ with γ > 1.
13
results to go through. As long as the labs’ incentives are aligned with those of large
firms, it follows that labs will magnify the impact of product market competition
on R&D outcomes.
In summary, our results show that the product market game played by the firms
determines the relationship between competition and innovation. Our results are
constructive in that they isolate a specific property of the product market payoffs
that is key for understanding this relationship. These findings suggest that model-
based research on the impact of competition on innovation should specify product
market games that do not ex-ante restrict the relationship between competition and
innovation. This is particularly relevant for empirical work, as restrictive empirical
models may prevent the analysis from showing the true empirical relationship
between competition and innovation.
III(ii) Welfare Analysis
We have already provided sufficient conditions for instances when competition
increases or decreases the pace of innovation. Evaluating whether an increase in
competition is welfare enhancing, however, requires understanding how it affects
both the path of prices faced by consumers and the pace of innovation. To this
end, we incorporate price effects into the analysis and study the trade-off between
the price and innovation effects caused by a change in competition.
To make statements about the relationship between competition and consumer
welfare, we impose further structure to the model.
Assumption 1. Each innovation increases the consumer-surplus flow by δn > 0.
The term δn represents the increment in consumer surplus due to an innovation.
If, for instance, firms compete in developing process innovations (i.e., cost-saving
technologies), δn represents the decrease in cost that is passed on to consumers
through lower prices and, consequently, higher consumer surplus. Table II provides
examples of different demand functions with their respective expressions for the
consumer surplus. In all of these examples, a stronger version of Assumption 1 is
satisfied: the increment in consumer-surplus flow δn is independent of the number
of firms competing in the product market, n.
Given Assumption 1, the discounted expected consumer surplus, CSn, which
incorporates the dynamic benefits of future innovations, is given by
rCSn = csn + λn,mδn/r, (5)
14

Table II: Product market competition and consumer surplus:examples
Bertrand Cournot Logit
Differentiation No No Yes
Innovation type Process Process Quality ladder
Leader advantageMarginal cost advantage:mcl = βmcf , β ∈ (0, 1)
Quality gap: κ > 0
Demand Q = a/P if P < Psl = exp{κ−pl}
exp{κ−pl}+n exp{−pf}
sf =exp{−pf}
exp{κ−pl}+n exp{−pf}
Consumer-surplus flow (csn) a log P − a log pn log (exp{κ− pl}+ n exp{−pf}) + γ
Innovation effect on CS (δn) −a log β κ
Restrictions None NoneFirm-level horizontal
differentiation
Notes: Subscripts l and f denote leader and follower, respectively. The γ parameter in thelogit-model consumer surplus is Euler’s constant.
where csn is the consumer-surplus flow when there are n product market competi-
tors.17 Observe that the discounted expected consumer surplus is greater than csn
and that it is increasing in both the pace of innovation and the magnitude with
which each innovation enhances consumer surplus, δn. The discounted expected
consumer surplus also decreases with the interest rate, as future breakthroughs are
discounted at a higher rate.
From equation (5), we can note that competition affects the discounted ex-
pected consumer surplus through three mechanisms. First, market concentration
has a direct effect on spot prices, affecting the consumer-surplus flow csn. Market
concentration also affects the discounted expected consumer surplus by potentially
changing the pass-through of innovations on consumer welfare, δn. Finally, as dis-
cussed in the previous subsection, market concentration has an effect on the pace
of innovation, λn,m. Because a lessening of competition may increase the pace
of innovation at the same time that it increases prices, the relationship between
competition and innovation is not one-to-one with the relationship between com-
petition and consumer welfare.
17See Lemma 2 for the derivation of equation (5).
15
Equation (5) shows that when a lessening of competition increases the market
price (i.e., dcsn/dn > 0) and decreases the innovation pass-through on consumer
surplus (i.e., dδn/dn ≥ 0), an increase in the speed of innovation is necessary for
a lessening of competition to increase welfare. Based on these observations and
our propositions on the relationship between competition and innovation, we can
establish the following results on the impact of competition on consumer welfare.
Proposition 5 (Competition and consumer welfare).
i) Suppose competition decreases the market price (i.e., dcsn/dn > 0) and in-
creases the innovation pass-through on consumer surplus (i.e., dδn/dn ≥ 0).
An increasing profit gap between the leader and a follower is sufficient for
competition to increase the discounted expected consumer surplus.
ii) Suppose competition decreases the market price (i.e., dcsn/dn > 0) and keeps
the innovation pass-through on consumer surplus constant (i.e., dδn/dn = 0).
A decreasing profit gap between the leader and a follower is sufficient for a
lessening of competition to increase the expected discounted consumer surplus
if the number of research labs is large enough.
Proposition 5 first shows that a profit gap that is increasing the number of
firms is sufficient for competition to increase consumer welfare. This implication
is straightforward since, in this case, competition increases the pace of innova-
tion (Proposition 3) at the same that it decreases prices in the short run. The
proposition also shows that for a sufficiently large number of labs, and under a re-
striction on how competition impacts the pass-through of innovations on consumer
welfare (i.e., dδn/dn), a decreasing profit gap becomes sufficient for a lessening of
competition to increase consumer welfare. The driver of the result is that when
market concentration increases R&D incentives, research labs magnify the effect of
competition on the pace of innovation, as more firms are affected by the enhanced
incentives. It is noteworthy that these sufficient conditions only depend on the
number of firms and on properties of the product market payoffs.
IV An Illustrative Example
In this section we parameterize the model and simulate the effect of competition
on market outcomes. The purpose of this exercise is to illustrate our results by
providing examples that show, first, that the relationship between market structure
16
and the pace of innovation is complex; and second, that a lessening of competition
can enhance consumer surplus despite short-run price effects. We consider the case
without labs, m = 0, unless otherwise noted. Henceforth, we drop the m subscript
for ease of notation.
IV(i) Parameters
We consider a market for a homogeneous good, where firms compete in quantity
(Cournot competition), and market demand is given by Q = a/P , with a > 0 and
P ≤ P . Firms also compete developing a sequence of cost-saving innovations. Each
innovation provides the innovating firm with a marginal cost advantage, reducing
the leader’s marginal cost by a factor of β ∈ (0, 1). The R&D cost function is
given by c(xi) = γ0 +γ−11 xγ1i , where γ0 ≥ 0 represents the fixed costs of performing
R&D and γ1 > 1.
We denote, at any instant of time, the marginal cost of the followers by mc
and the marginal cost of the leader by β · mc. The equilibrium market price is
pn = mc(β + n)/n, which depends on the follower’s marginal cost of production,
the size of the leader’s cost advantage, and the number of followers in the market.
As expected, the equilibrium market price is decreasing in n and increasing in both
β and mc. Similarly, equilibrium profits are given by
πln = a(n(1− β) + β)2
(β + n)2, πfn = a
β2
(β + n)2,
which do not depend on the current marginal cost, nor the number of innovations
that have taken place. Profits do depend, however, on the number of followers
and the size of the leader’s cost advantage, β. These equilibrium profits imply
that the profit gap is positive, ∆πn ≡ πln − πfn > 0; decreasing in the number
of followers, d∆πn/dn < 0; and increasing in the cost advantage of the leader,
d∆πn/dβ < 0. As discussed above, a decreasing profit gap may lead to scenarios
in which a lessening of competition increases consumer surplus (see Proposition 5).
Finally, to capture the role of the pace of innovation on the path of prices faced
by consumers, we make use of the expected discounted consumer surplus defined in
equation (5). The flow of consumer surplus when the market price is pn is given by
csn = a log P − a log pn, and an innovation increases the flow of consumer surplus
by δ ≡ −a log β > 0.
17
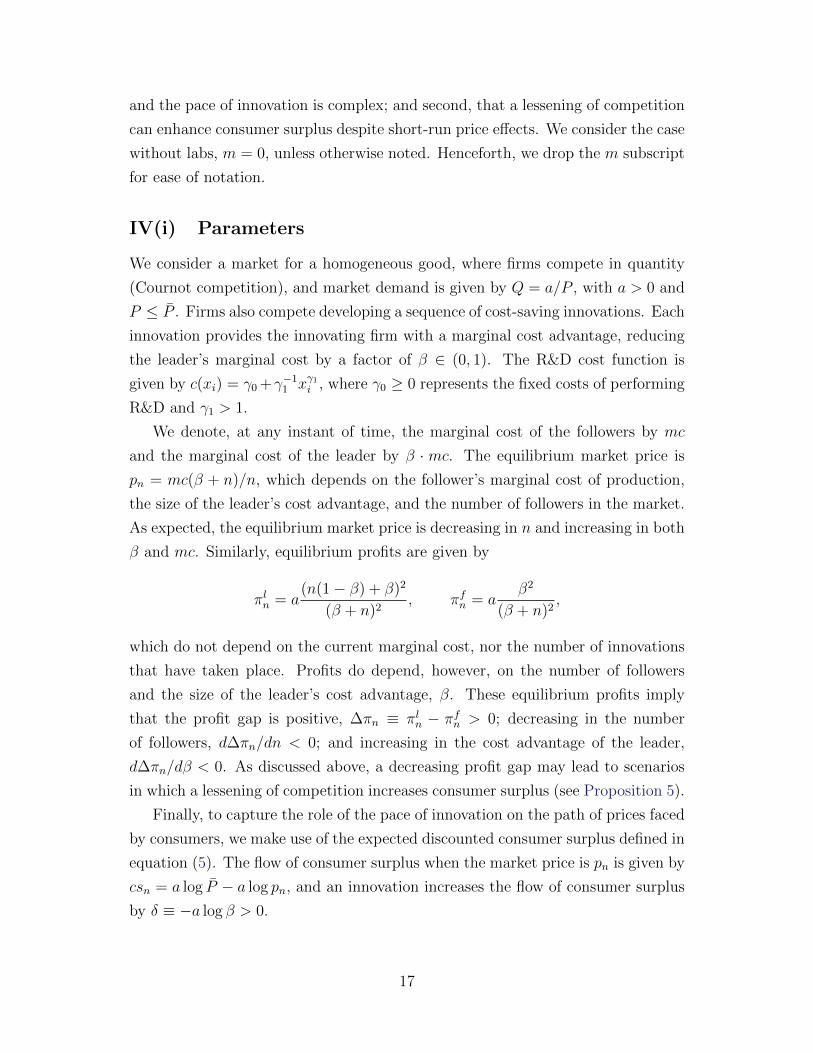
Figure 2: Market-outcome comparison for different numbers offollowers and parameter values
a) β = 0.85, γ0 = 0.55, γ1 = 1.07, m = 0Pace
n
Consumer Surplus45
38.3
31.7
25
5
4.33
3.67
31 2 3 4 5 6 7 8
n1 2 3 4 5 6 7 8
b) β = 0.85, γ0 = 0.55, γ1 = 1.37, m = 0
c) β = 0.21, γ0 = 0.095, γ1 = 1.0125, m = 0Pace
n
Consumer Surplus3490
3480
3470
3460
37.3
37.2
37.1
371 2 3 4 5 6 7 8
n1 2 3 4 5 6 7 8
d) β = 0.85, γ0 = 0.55, γ1 = 1.37, m = 2Pace
n
Consumer Surplus39
38
37
36
4.5
4.4
4.3
4.21 2 3 4 5 6 7 8
n1 2 3 4 5 6 7 8
Notes: Fixed parameter values are r = 0.03, a = 60, and mc = 10. “n” is the number of largefirms, “Pace” is the pace of innovation (λn), and “Consumer Surplus” is the discounted expectedconsumer surplus (CSn).
18

Table III: Market-outcome comparison for different numbers offollowers and parameter values
a) β = 0.85, γ0 = 0.55, γ1 = 1.07, m = 0 b) β = 0.85, γ0 = 0.55, γ1 = 1.37, m = 0n λn CSn Vn Wn
1 4.543 39.050 415.999 414.8872 4.527 39.363 165.853 164.7943 4.237 36.725 83.333 82.3094 3.977 34.285 46.264 45.2645 3.768 32.312 26.482 25.5016 3.602 30.738 14.690 13.7257 3.468 29.470 7.097 6.1458 3.360 28.435 1.919 0.978
n λn CSn Vn Wn
1 2.865 22.682 443.416 441.9402 3.531 29.645 180.412 179.1783 3.747 31.939 92.445 91.3604 3.842 32.971 52.601 51.6165 3.896 33.562 31.198 30.2866 3.934 33.977 18.366 17.5117 3.965 34.314 10.059 9.2488 3.994 34.617 4.365 3.591
c) β = 0.21, γ0 = 0.095, γ1 = 1.0125, m = 0 d) β = 0.85, γ0 = 0.55, γ1 = 1.37, m = 2n λn CSn Vn Wn
1 37.048 3464.601 74.071 73.0252 37.258 3484.460 23.881 22.8443 37.219 3480.852 11.694 10.6624 37.191 3478.311 6.772 5.7445 37.181 3477.375 4.246 3.2216 37.182 3477.487 2.753 1.7297 37.190 3478.233 1.784 0.7628 37.202 3479.359 1.112 0.093
n λn CSn Vn Wn
1 4.315 36.824 419.829 418.6852 4.456 38.670 171.046 170.0053 4.410 38.412 87.689 86.7344 4.356 37.984 49.791 48.9035 4.315 37.645 29.366 28.5306 4.287 37.421 17.086 16.2927 4.271 37.295 9.117 8.3588 4.263 37.246 3.645 2.916
Notes: Fixed parameter values are r = 0.03, a = 60, and mc = 10. n is the number of followers,λn is the pace of innovation, CSn is the expected discounted consumer surplus, Vn is the valueof being the leader, and Wn is the value of being a follower.
IV(ii) Results
Using this setup, we provide four numerical examples to illustrate our results.
In Table III.a (see Figure 2.a) we show market outcomes for a set of parameters
that create an inverted-U relationship between the pace of innovation and the
number of followers. A similar inverted-U relationship is found for the expected
discounted consumer surplus. This example shows that a lessening of competition
may enhance consumer surplus by increasing the pace of innovation—for instance,
when going from n = 3 to n = 2—even though market concentration increases
prices in the short run. The gains in consumer surplus arise from consumers
enjoying more frequent price reductions—caused by a greater pace of innovation—
that more than compensate for the short-run price effects.
Result 1. A lessening of competition may enhance consumer surplus even if it
increases prices in the short run.
In Tables III.b and III.c (see Figures 2.b and 2.c, respectively), we show ex-
amples in which the pace of innovation varies monotonically (Table III.b) or non-
monotonically (N-shaped in Table III.c) with respect to the number of followers.
19

These examples illustrate the complex relationship that exists between the num-
ber of firms and the pace of innovation. As discussed in Section III, the shape of
this relationship is given by the relative importance of two separate effects created
by a change in competition. On the one hand, a lessening of competition may
increase the profit gap between the leader and followers—increasing the incentives
to innovate; on the other hand, it reduces the number of firms performing R&D.
Result 2. The relationship between the pace of innovation and the number of firms
can be monotonic or non-monotonic (e.g., inverted-U or N shaped).
Lastly, in Proposition 4, we argue that a decreasing profit gap becomes sufficient
for competition to decrease the pace of innovation when the number of research
labs, m, is sufficiently large. In these examples, however, we find that the number of
research labs needed to generate a decreasing relationship between competition and
the pace of innovation can be as small as zero (e.g., Table III.a and Table III.c). In
some cases, however, we do find that a a profit gap that decreases in the number
of firms is insufficient for competition to decrease the pace of innovation (e.g.,
Table III.b). To illustrate how the presence of research labs can impact market
outcomes, Table III.d (see Figure 2.d) uses the same parameters as Table III.b,
but adds two research labs to the analysis (m = 2). The table shows that it may
only take a small number of labs (m = 2 in this case) to transform the relationship
between the number of firms and the pace of innovation.
Result 3. A profit gap that decreases in the number of firms in conjunction with
a small number of labs may generate a decreasing relationship between competition
and innovation.
V Concluding Remarks
We studied the impact of competition on market outcomes in innovative industries.
A lessening of competition affects R&D outcomes both directly by reducing the
number of firms performing R&D and indirectly by changing the product market
profits. The relationship among these effects is complex and may lead to scenarios
in which a lessening of competition increases an industry’s pace of innovation and
consumer surplus in the long run.
Although the relationship between competition and innovation may take vari-
ous shapes, the product market game being played by firms puts shape restrictions
20

on this relationship. We provided conditions for when competition increases or de-
creases the pace of innovation as well as consumer welfare. These conditions are
based on product market payoffs, and highlight the importance of the product
market for analyzing the impact of competition on R&D outcomes.
Our results have three broader implications. First, the results are constructive
in that they isolate a specific property of the product market payoffs that is key for
understanding the relationship between innovation and competition. Second, the
results show how product market payoffs restrict the relationship between compe-
tition and innovation, calling for flexible demand systems in model-based empirical
studies. That is, product market games that ex-ante restrict the relationship be-
tween competition and innovation should be avoided by researchers conducting
empirical work. Lastly, while this is not a paper about mergers in innovative
industries—e.g., we do not explicitly model the asymmetries caused by mergers—
these results show the various mechanisms by which a change in competition caused
by a merger would impact market outcomes.
References
Acemoglu, D. and Akcigit, U. (2012). Intellectual property rights policy, com-petition and innovation. Journal of the European Economic Association, 10 (1),1–42.
—, —, Bloom, N. and Kerr, W. R. (2013). Innovation, reallocation and growth.Tech. rep., National Bureau of Economic Research.
Aghion, P., Bloom, N., Blundell, R., Griffith, R. and Howitt, P.(2005). Competition and innovation: An inverted-U relationship. The QuarterlyJournal of Economics, 120 (2), pp. 701–728.
—, Blundell, R., Griffith, R., Howitt, P. and Prantl, S. (2009). Theeffects of entry on incumbent innovation and productivity. The Review of Eco-nomics and Statistics, 91 (1), 20–32.
—, Harris, C., Howitt, P. and Vickers, J. (2001). Competition, imita-tion and growth with step-by-step innovation. The Review of Economic Studies,68 (3), pp. 467–492.
— and Howitt, P. (1992). A model of growth through creative destruction.Econometrica, 60 (2), pp. 323–351.
Blundell, R., Griffith, R. and Reenen, J. V. (1999). Market share, marketvalue and innovation in a panel of british manufacturing firms. The Review ofEconomic Studies, 66 (3), 529–554.
21

Cohen, W. M. (2010). Chapter 4 - fifty years of empirical studies of innovativeactivity and performance. In B. H. Hall and N. Rosenberg (eds.), Handbook ofThe Economics of Innovation, Vol. 1, Handbook of the Economics of Innovation,vol. 1, North-Holland, pp. 129 – 213.
Dasgupta, P. and Stiglitz, J. (1980a). Industrial structure and the nature ofinnovative activity. The Economic Journal, 90 (358), 266–293.
— and — (1980b). Uncertainty, industrial structure, and the speed of R&D. TheBell Journal of Economics, 11 (1), 1–28.
Denicolo, V. and Zanchettin, P. (2012). Leadership cycles in a quality-laddermodel of endogenous growth*. The Economic Journal, 122 (561), 618–650.
Entezarkheir, M. and Moshiri, S. (2015). Merger induced changes of innova-tion: Evidence from a panel of u.s. firms, working Paper.
Evans, D. S. and Schmalansee, R. (2002). Some economic aspects of antitrustanalysis in dynamically competitive industries. In A. Jaffe, J. Lerner and S. Stern(eds.), Innovation Policy and the Economy, Vol. 2, Cambridge: MIT Press.
Farrell, J. and Shapiro, C. (1990). Horizontal mergers: An equilibrium anal-ysis. American Economic Review, 80 (1), 107–126.
Federico, G., Langus, G. and Valletti, T. (2017). A simple model of mergersand innovation. Economics Letters, 157, 136 – 140.
—, — and — (2018). Horizontal mergers and product innovation. InternationalJournal of Industrial Organization, 59, 1–23.
Gilbert, R. (2006). Looking for mr. schumpeter: Where are we in thecompetition-innovation debate? In Innovation Policy and the Economy, Volume6, NBER Chapters, National Bureau of Economic Research, Inc, pp. 159–215.
Gilbert, R. J. and Sunshine, S. C. (1995). Incorporating dynamic efficiencyconcerns in merger analysis: The use of innovation markets. Antitrust Law Jour-nal, 63 (2), 569–601.
Gowrisankaran, G. (1999). A dynamic model of endogenous horizontal merg-ers. Rand Journal of Economics, 30 (1), 56–83.
Hollenbeck, B. (2015). Horizontal mergers and innovation in concentrated in-dustries. Available at SSRN 2621842.
Igami, M. and Uetake, K. (2015). Mergers, innovation, and entry-exit dynamics:The consolidation of the hard disk drive industry (1976-2014), unpublished.
22
Ishida, J., Matsumura, T. and Matsushima, N. (2011). Market competi-tion, r&d and firm profits in asymmetric oligopoly. The Journal of IndustrialEconomics, 59 (3), 484–505.
Katz, M. L. and Shelanski, H. A. (2005). Merger policy and innovation: Mustenforcement change to account for technological change? In A. Jaffe, J. Lernerand S. Stern (eds.), Innovation Policy and the Economy, Vol. 5, Cambridge:MIT Press.
— and — (2007). Mergers and innovation. Antitrust Law Journal, 74(1), 1–85.
Lee, T. and Wilde, L. L. (1980). Market structure and innovation: A reformu-lation. The Quarterly Journal of Economics, 94 (2), pp. 429–436.
Loury, G. C. (1979). Market structure and innovation. The Quarterly Journalof Economics, 93 (3), pp. 395–410.
Marshall, G. (2015). Hassle costs and price discrimination: An empirical welfareanalysis. American Economic Journal: Applied Economics, 7 (3), 123–146.
Mermelstein, B., Nocke, V., Satterthwaite, M. A. and Whinston,M. D. (2015). Internal versus external growth in industries with scale economies:A computational model of optimal merger policy, unpublished Manuscript, MIT.
Motta, M. and Tarantino, E. (2017). The effect of a merger on investments,Manustcript, Mannheim University.
Nocke, V. and Whinston, M. D. (2010). Dynamic merger review. Journal ofPolitical Economy, 118 (6), 1200–1251.
— and — (2013). Merger policy with merger choice. American Economic Review,103 (2), 1006–1033.
Ornaghi, C. (2009). Mergers and innovation in big pharma. International Journalof Industrial Organization, 27, 70–79.
Parra, A. (2018). Sequential innovation, patent policy and the dynamics of thereplacement effect, Manustcript, University of British Columbia.
Reinganum, J. F. (1982). A dynamic game of R and D: Patent protection andcompetitive behavior. Econometrica, 50 (3), pp. 671–688.
— (1985). Innovation and industry evolution. The Quarterly Journal of Economics,100 (1), pp. 81–99.
Schumpeter, J. A. (1942). Capitalism, socialism and democracy. George Allen& Unwin, London, 4th edn.
Segal, I. and Whinston, M. D. (2007). Antitrust in innovative industries.American Economic Review, 97 (5), 1703–1730.
23

U.S. Department of Justice and the FederalTrade Commission (2010). Horizontal merger guidelines,http://www.justice.gov/atr/public/guidelines/hmg-2010.pdf.
Vives, X. (2008). Innovation and competitive pressure*. The Journal of IndustrialEconomics, 56 (3), 419–469.
Williamson, O. E. (1968). Economies as an antitrust defense: The welfare trade-offs. The American Economic Review, pp. 18–36.
24

Appendix
A Value Functions
Let Vn,m represent the value of being the market leader, Wn,m the value of being afollower, and Ln,m the value of being a research lab when there are n followers andm labs in the industry. At time t, we can write the payoffs of the different typesof firms as follows:
Vn,m =
∫ ∞t
(πln + λn,mWn,m)e−(r+λn,m)(s−t)ds,
Wn,m = maxxi
∫ ∞t
(πfn + xiVn,m + x−iWn,m − c(xi))e−(r+λn,m)(s−t)ds,
Ln,m = maxyi
∫ ∞t
(yi(Vn,m −Wn,m + Ln,m) + y−iLn,m − c(yi))e−(r+λn,m)(s−t)ds,
where λn,m =∑n
i xi +∑m
j yj is the industry-wide pace or speed of innovation,x−i = λn,m − xi, and y−i = λn,m − yi. To understand the firms’ payoffs, fix anyinstant of time s > t. With probability exp(−λn,m(s − t)), no innovation hasarrived between t and s. At that instant, the leader receives the flow payoff πln andthe expected value of becoming a follower, λn,mWn,m. Each follower receives theflow payoff πfn; innovates at rate xi; earns an expected payoff of xiVn,m; pays theflow cost of its R&D, c(xi); and faces innovation by other firms at rate x−i. Notethat since all large firms are symmetric, they value an innovation in Vn,m −Wn,m.These valuations, in conjunction with the auction format, imply that labs sell theirinnovations at price Vn,m −Wn,m in equilibrium. Labs obtain this revenue at rateyi; pay the flow cost of their R&D, c(yi); and face innovation by other firms at ratey−i. All of these payoffs are discounted by exp(−r(s− t)).
B Preliminary Results
Lemma 1. The function f(z) implicitly defined by c′(f(z)) = z satisfies:1. f(z) > 0 for all z > 0 and f(0) = 0.2. f ′(z) > 0 for all z ≥ 0. Also, if c′′′(x) ≥ 0, f ′′(z) ≤ 0, i.e. f is concave.3. Let h(z) = (n + 1)zf(z) − c(f(z)) for z ≥ 0. Then h′(z) = (n + 1)f(z) +
nzf ′(z) > 0 for all z ≥ 0.
Proof. 1. c(x) being strictly increasing and differentiable implies c′(x) > 0 for allx > 0. c(x) being strictly convex implies c′′(x) > 0 for all x ≥ 0. Thus, c′(x) isunbounded above and for each z there exists a unique value of x = f(z) > 0 suchthat c′(x) = z. Moreover, because c′(0) = 0, then f(0) = 0.2. The first result follows from the derivative of the inverse function being equalto f ′(z) = 1/c′′(f(z)) in conjunction with the strict convexity of c(x). The secondfrom f ′′(z) = −c′′′(f(z))/(c′′(f(z))3) and the assumption c′′′(x) ≥ 0.
25
3. Differentiating h and using c′(f(z)) = z delivers h′(z) = (n+ 1)f(z) + nzf ′(z),which is positive by claims 1 and 2. �
Lemma 2. The discounted expected consumer surplus is given by equation (5).
Proof. Consider an asset that pays the consumer surplus flow at every instant oftime. Starting from a consumer surplus csn, the value of this asset is given by
rA(csn) = csn + λn,m(A(cs′n)− A(csn)) (6)
where cs′n is the consumer surplus after an innovation arrives. Using the conditionthat cs′n = csn + δn, we guess and verify that equation (5) solves equation (6), i.e.,A(csn) = CSn, proving the result. �
C Proofs
Proof of Proposition 1. Using the first order condition (see equation (4)), wefind that the equilibrium values for the leader and followers are given by
rVn,m = πln − (n+m)(Vn,m −Wn,m)f(Vn,m −Wn,m)
rWn,m = πfn + (Vn,m −Wn,m)f(Vn,m −Wn,m)− c(f(Vn,m −Wn,m)).
Subtracting these equations and defining Zn,m ≡ Vn,m −Wn,m we obtain
rZn,m = ∆πn − (n+m+ 1)Zn,mf(Zn,m) + c(f(Zn,m)). (7)
To prove existence and uniqueness of an equilibrium with Zn,m > 0, note that theleft-hand side of equation (7) is strictly increasing in Zn,m and ranges from 0 to∞.Lemma 1.1 implies that the right-hand side of equation (7) is strictly decreasing inZn,m, taking the value of ∆πn + c(0) > 0 when Zn,m = 0. Thus, the two functionsintersect once at a positive value of Zn,m, proving the result. �
Proof of Proposition 2. Using implicit differentiation in equation (7), we reachthe following results:
i) The derivative of Zn,m with respect to ∆πn is given by
dZn,md∆πn
=1
r + (n+m+ 1)f(Zn,m) + (n+m)Zn,mf ′(Zn,m)> 0.
Since x∗n,m = f(Zn,m) and λn,m = (n + m)f(Zn,m), Lemma 1.2 implies that bothare increasing in ∆πn.
ii) The derivative of Zn,m with respect to m is given by
dZn,mdm
=−Zn,mf(Zn,m)
r + (n+m+ 1)f(Zn,m) + (n+m)Zn,mf ′(Zn,m)< 0.
26
Thus, an increase in m decreases a firm’s R&D investment. The derivative of thepace of innovation with respect to m is
dλn,mdm
= f(Zn,m) + (n+m)f ′(Zn,m)dZn,mdm
=rf(Zn,m) + (n+m+ 1)f(Zn,m)2
r + (n+m+ 1)f(Zn,m) + (n+m)Zn,mf ′(Zn,m)> 0.
proving that the pace of innovation increases with m. �
Proof of Proposition 3. Using implicit differentiation in equation (7) we obtaindZn,m/dn. By replacing it in
dλn,mdn
= f(Zn,m) + (n+m)f ′(Zn,m)dZn,mdn
, (8)
we find
dλn,mdn
=rf(Zn,m) + (n+m+ 1)f(Zn,m)2 + (n+m)f ′(Zn,m)d∆n
dn
r + (n+m+ 1)f(Zn,m) + (n+m)Zn,mf ′(Zn,m). (9)
If ∆n satisfies d∆n/dn > 0 (i.e., if ∆n has an increasing profit gap), then thederivative is positive. Hence, a reduction in the number of large firms leads to areduction in the pace of innovation. �
Proof of Proposition 4. A necessary condition for equation (9) to be negativeis d∆n/dn < 0. For sufficiency, we need to show that there exists an m suchthat m > m implies dλn,m/dn < 0. Since the denominator of (9) is positive,dλn,m/dn < 0 is equivalent to
r
n+m
f(Zn,m)
f ′(Zn,m)+n+m+ 1
n+m
f(Zn,m)2
f ′(Zn,m)< −d∆πn
dn.
d∆πn/dn < 0 guarantees that right-hand side of the inequality is always positive.Given that f(0) = 0 and f ′(0) > 0 (see Lemma 1), and dZn,m/dm < 0, it issufficient to show that limm→∞ Zn,m = 0 for the inequality to hold.
For any small ε > 0, pick Zε ∈ (0, ε). By Proposition 1, equation (7) has aunique solution. Using (7), define mε to be
mε =∆πn + c(f(Zε))− (r + (n+ 1)f(Zε))Zε
f(Zε)Zε,
which is always well defined (but possibly negative). Thus, take any decreasingsequence of Zε converging to zero. For each element of the sequence, there exists anincreasing sequence mε that delivers Zε as an equilibrium. Thus, limm→∞ Zn,m = 0and the result follows. �
Proof of Proposition 5. i) See text.
27

ii) Using the definition λn,m = (n + m)x∗n,m and the assumption that dδn/dn = 0,
we re-write dCSn
dn< 0 as:
dcsndn
< −δnr
((n+m)
dx∗n,mdn
+ x∗n,m
).
We show that when m is sufficiently large, a profit gap that is decreasing in thenumber of firms is sufficient to guarantee that the parenthesis in the expressionabove goes to −∞, which ensures that the condition holds, as dcsn/dn is finite.From Proposition 2, we know that x∗n,m decreases with m. Now, observe
(n+m)dx∗n,mdn
=d∆n
dn− Zn,mf(Zn,m)
rn+m
+ n+m+1n+m
f(Zn,m) + Zn,mf ′(Zn,m).
From the proof of Proposition 4 we know that limm→∞ Zn,m = 0. From Lemma 1,we also know that that f(0) = 0 and f ′(0) > 0. Therefore, when the profit gap isdecreasing in the number of firms (i.e., d∆n/dn < 0) we have
limm→∞
(n+m)dx∗n,mdn
= −∞,
and the result follows. �
28

Online Appendix: Not For Publication
D Leader Innovation
Our baseline model abstracted away from the possibility that the leader invests inR&D by assuming that old patents were not enforceable—enabling followers to im-itate them—and thus keeping the leader only one step ahead of all followers. Thisextension shows that the profit gap remains important when market leaders caninvest in R&D to increase their technological lead. In particular, a weakly increas-ing profit gap is still sufficient for competition to increase the pace of innovation,and a decreasing profit gap is still necessary but not sufficient for competition tolead to lower levels of R&D
Following Acemoglu and Akcigit (2012), we modify the baseline model by as-suming that followers make radical innovations, making the replaced leader’s prod-uct obsolete and available to unsuccessful followers; and, that market leaders investin R&D to increase the quality of their product, which increases their profit flow.In concrete terms, we assume that the leader may be k steps ahead of the followers,receiving a profit flow of πkn. We assume πk+1
n > πkn, so that a larger technologicalgap leads to a higher profit flow. As before, each follower innovates at a rate xfn ata flow cost of c(xfn). Similarly, the leader can now achieve an innovation at a ratexlf at a flow cost c(xln). For this extension, we also assume c′′′(x) ≥ 0.
Although our results will apply to environments in which the leader may im-prove the quality of its product multiple times, for illustration purposes, we ex-amine a situation in which the leader can increase the quality of its product onlyonce (i.e., k ∈ {1, 2}). In the model, we also assume that the followers’ profit flowremains constant independently of how many steps ahead the leader is. Then, thefollowers value function is still represented by equation (2). Let V k
n be the value ofbeing a leader that has innovated k ∈ {1, 2} times. The leader’s value equationsare represented by
rV 1n = max
xln
π1n + xln
(V 2n − V 1
n
)− c(xln) + nxfn(Wn − V 1
n ) (10)
rV2 = π2n + nxfn(Wn − V 2
n ), (11)
The first equation describes the value of a being a leader that has innovated onlyonce and that is investing in R&D to increase the quality of its product. Thesecond equation describes the value of a leader that has already increased thequality of its innovation, enjoying a profit flow π2
n. Note that because we assumeit is infeasible for the leader to increase the product quality a second time andbecause developing a radical innovation replaces the current technology that theleader possess, the leader chooses not to invest in R&D when it is two steps ahead(replacement effect).
The first order condition for the followers is given by equation (4), whereas the
i

first order condition for the leader that is one step ahead is given by
cx(xln)
= V 2n − V 1
n . (12)
Similar to the followers in the baseline model, the leader will invest in R&D whenthe marginal cost of R&D equals the incremental rent of achieving an innovation,V 2n − V 1
n .Define ∆f
n = π1n−πfn and ∆l
n = π2n−π1
n to be the profit gap that exists betweena one-step ahead leader and its followers, and the profit gap that exists betweenbeing a two-step ahead leader and a one-step ahead leader. Let λ2
n = nxfn andλ1n = nxfn + xln be the pace of innovation when the leader is two and one step
ahead, respectively. We start by showing that the profit gap has a similar role tothat in the baseline model.
Proposition 6 (Innovating leader). There exists a unique symmetric equilibrium,which is characterized by the solution of equations (2), (4), (10), (11), and (12). Anincrease in the profit gap of the leader ∆l
n increases R&D investments of the leaderand followers; consequently, it increases the pace of innovation in the economy.An increase in the profit gap of the followers ∆f
n increases the followers’ R&D, butdecreases the R&D of the leader. The pace of innovation, however, increases with∆fn regardless of whether the leader is one or two-steps ahead.
An increase of the profit gap of any firm that is ahead in the quality ladderincreases the reward to innovate for all the firms that lag behind. This increase inreward, thus, increases the R&D incentives of every firm aiming to reach that state.For instance, an increase in the profit gap of a one-step ahead leader increases notonly its R&D incentives but also the incentives of followers aiming to become aone-step ahead leader.
In contrast, an increase in the profit gap of firms that are behind in the qualityladder does not lead to higher rewards for innovation for the firm ahead. Onthe contrary, the increase in profit gap of laggard firms induces them to performmore R&D, increasing the competition of the firm ahead. In turn, the increasedcompetition faced by the firm ahead, decreases its incremental rent and incentivesto perform R&D. This countervailing effect is, however, of second order as the paceof innovation increases with a larger profit gap of the followers.
Proposition 7 (Innovating leader II). Profit gaps ∆fn and ∆l
n that are weaklyincreasing in n are sufficient to guarantee that market concentration leads to aslower pace of innovation. Similarly, decreasing profits gaps are necessary but notsufficient for market concentration to lead to higher innovation pace.
Although this formulation abstracts away from research labs, it is not hard tosee that the sufficiency result presented in Proposition 4 can be extended to thisframework. Research labs mimic the incentives of the followers, magnifying theirresponse in R&D investments due to changes in market concentration. Because aprofit gap ∆f
n that is decreasing in n tends to increase the followers’ R&D when the
ii
product market concentrates, competition can lead to decreased R&D outcomeswhen there is a sufficiently large number of research labs and there are decreasingprofit gaps.
Omitted Proofs
Proof of Proposition 6. Define the incremental rent of the leader to beHn = V 2
n − V 1n and the incremental rent of followers Zn = V 1
n −Wn. Using theinversion defined in Lemma 1 we write xln = f(Hn) and xfn = f(Zn). Subtracting(10) from (11) delivers:
rHn = ∆ln − f (Hn)Hn + c (f (Hn))− nf (Zn)Hn.
Similarly, subtracting (10) and (2) delivers:
rZn = ∆fn + f (Hn)Hn − c (f (Hn))− (n+ 1) f (Zn)Zn + c (f (Zn))
We need to show that there exists unique positive values of Hn and Zn that simul-taneously solve the equations above. Rewrite the first equation as:
f (Zn) =∆ln − (f (Hn) + r)Hn + c (f (Hn))
nHn
Using Lemma 1 we can show that this expression defines a negative, monotonicand continuous relation between Zn and Hn. In particular, observe that if Hn → 0,then Zn →∞. Also, if Hn →∞, then Zn < 0. Rewrite the expression for rZn as:
rZn + (n+ 1) f (Zn)Zn − c (f (Zn)) = ∆fn + f (Hn)Hn − c (f (Hn))
Lemma 1 implies a increasing, monotonic and continuous relation between Zn andHn. Observe that Hn = 0 implies Zn > 0. Also, Hn →∞ implies Zn →∞. There-fore, the relation described by both equations must intercept and, because bothexpressions are monotonic, there is a unique intersection. Thus, an equilibriumexists and is unique.
To study the relation between the profit gaps and firms investments and paceof innovation we need to understand the impact of the gaps in the incrementalrent, i.e., dHn
d∆kn
and dZn
d∆kn
for k{l, f}. For this we make use of the implicit function
theorem. Define g : R2 → R2 where
g1 (Hn, Zn) = ∆ln − (f (Hn) + r)Hn + c (f (Hn))− nf (Zn)Hn
g2 (Hn, Zn) = ∆fn + f (Hn)Hn − c (f (Hn))− ((n+ 1) f (Zn) + r)Zn + c (f (Zn)) .
Then, an equilibrium is defined by g(Hn, Zn) = 0 and the implicit function theorem
iii

implies (in matrix notation):[dHn
d∆fn
,dHn
d∆ln
;dZn
d∆fn
,dZnd∆l
n
]= −
(A−1
)B (13)
where
A =
[ ∂g1∂Hn
∂g1∂Zn
∂g2∂Hn
∂g2∂Zn
]and B =
[∂g1∂∆f
n
∂g1∂∆l
n∂g2∂∆f
n
∂g2∂∆l
n
]. (14)
Using Lemma 1, we find that
A = −[r + nf (Zn) + f (Hn) nf ′ (Zn)Hn
−f (Hn) r + (n+ 1) f (Zn) + nf ′ (Zn)Zn
]and B =
[0 11 0
].
The inverse of A is given by
A−1 = − 1
|A|
[r + (n+ 1) f (Zn) + nf ′ (Zn)Zn −nf ′ (Zn)Hn
f (Hn) r + nf (Zn) + f (Hn)
]where |A| is equal to
(r + nf (Zn) + f (Hn)) (r + (n+ 1) f (Zn) + nf ′ (Zn)Zn) + nf ′ (Zn) f (Hn)Hn,
which is positive. Then, using equation (13), we compute the derivatives:[dHn
d∆fn
dHn
d∆ln
dZn
d∆fn
dZn
d∆ln
]=
1
|A|
[−nf ′ (Zn)Hn r + (n+ 1) f (Zn) + nf ′ (Zn)Zn
r + nf (Zn) + f (Hn) f (Hn)
],
proving the statements with respect to firms’ R&D investments and that an in-crease of ∆l
n leads to a higher innovation pace. To show the relation between theprofit gap of the followers and λ2
n observe
dλ2n
d∆fn
= nf ′ (Zn)dZn
d∆fn
+ f ′ (Hn)dHn
d∆fn
= nf ′ (Zn)r + nf (Zn) + f (Hn)− f ′ (Hn)Hn
|A|.
By Lemma 1 the function f(z) is concave and f(0) = 0. Together they implyf(z) ≥ f ′(z)z; thus, the derivative is positive, and the result follows. �
Proof of Proposition 7. As in the previous proof, we make use of the im-plicit function theorem. Let g(Hn, Zn) be the function defined in the proof ofProposition 6. Then, the implicit function theorem implies (in matrix notation)[
dHn
dn;dZndn
]= −
(A−1
)B (15)
iv
where A is the matrix defined in (14) and
B =
[∂g1
∂n;∂g2
∂n
]=
[d∆l
n
dn− f (Zn)Hn;
d∆fn
dn− f (Zn)Zn
].
Using equation (15) we compute the derivatives
dHn
dn=ψn+1
(d∆l
n
dn− f (Zn)Hn
)+ nf ′ (Zn)
(Zn
d∆ln
dn−Hn
d∆fn
dn
)|A|
dZndn
=f (Hn)
(d∆l
n
dn+ d∆f
n
dn− f (Zn) (Zn +Hn)
)+ ψn
(d∆f
n
dn− f (Zn)Zn
)|A|
,
where ψx = r + xf (Zn) > 0 for all x > 0. With these computations we can nowprove that the pace of innovation increases in n under increasing profit gaps. Let’sstart studying the situation in which the leader is two steps ahead, the derivativeof λ2
n with respect n is given by
dλ2n
dn= f (Zn) + nf ′ (Zn)
dZndn
=(ψn + f (Hn))
(f (Zn)ψn+1 + nf ′ (Zn) d∆f
n
dn
)+ nf ′ (Zn) f (Hn) d∆l
n
dn
|A|.
which is positive whenever d∆ln
dn, d∆f
n
dn≥ 0. Also, we can see that d∆l
n
dn, d∆f
n
dn< 0 are
necessary but not sufficient for dλ2ndn
to be negative.When the leader performs R&D, i.e., the leader is one step ahead of the fol-
lowers, the derivative of the pace of innovation is given by:
dλ1n
dn=dλ2
n
dn+ f ′ (Hn)
dHn
dn
=f (Zn)ψnψn+1
|A|+nf ′ (Zn) (f (Hn) + f ′ (Hn)Zn) + f ′ (Hn)ψn+1
|A|d∆l
n
dn
+nf ′ (Zn)ψn|A|
d∆fn
dn+ (f (Hn)− f ′ (Hn)Hn)
nf ′ (Zn) d∆fn
dn+ f (Zn)ψn+1
|A|.
By Lemma 1 the function f(z) is concave and f(0) = 0; these two conditions
imply f(z) ≥ f ′(z)z. Then the derivatives are positive whenever d∆ln
dn, d∆f
n
dn≥ 0,
and d∆ln
dn, d∆f
n
dn< 0 are necessary but not sufficient for dλ1n
dnto be negative. �
v