inlet and outlet transitions for canals and culverts p · in early designs of canal systems using...
TRANSCRIPT

FAD 17 9 f
HYDRAULICS BRANCH OFFICIAL FILE COPY
Ci- Q CL
INLET AND OUTLET
TRANSITIONS
FOR CANALS AND CULVERTS
by
W. P. Simmons Office of Chief Engineer Bureau of Reclamation
Department of the Interior Denver, Colorado
A paper to be presented at the
Twelfth Annual Hydraulics Division Conference of the American Society of Civil' Engineers,l University Park, Pennsylvania, August 6-9, 1963
P
.M.

INLET AND OUTLET TRANSITIONS FOR CANALS AND CULVERTS
By W. P. Simmons,* M. ASCE
SYNOPSIS
This paper presents results of model studies of variations
in open-type inlet and outlet transitions for small canals and cul-
verts. The studies indicated that lower losses and better perform-
ance resulted when closed-conduit sections were added between the
pipelines and transitions. Best results were obtained with a
6-diameter-long closed-conduit transition that terminated in a head-
wall normal to the canal centerline.
INTRODUCTION
Large numbers of transition structures are needed in
irrigation distribution systems, drains, and other water conveyances
to direct canal flows into pipelines and siphon barrels, and back
into canal sections again. When these transitions are small, as for
example with 36-inch or smaller pipes, the special forming required
to construct conventional warped transitions is usually not justified.
In these cases, the less expensive and easier to construct broken-
back-type transitions made entirely of plane surfaces are used
(Figure 1A).
*Hydraulic Research Engineer, Division of Research, Bureau of Reclamation, Denver, Colorado.

In early designs of canal systems using broken-back tran-
sitions as outlets from pipelines to canals, a loss value of
0.3 (
VZ - V2 ~2g ) was frequently used. In this expression V is
flow velocity in the pipeline and V. is velocity in the canal.
This 0.3 loss factor was derived intuitively and is apparently not
supported by direct experimental data. A similarly derived loss of
0.1 Ahv (difference in velocity head in pipeline and canal) was
used when the transitions served as inlets from canals to pipelines.
In recent years there has been concern about the actual
loss factors being greater than 0.3 and 0.1. If the losses were
appreciably greater, the structures could be restrictions in dis-
tribution systems where head is limited and reduce the carrying
capacity to less than the design values.
This would have serious effect upon operation of the
irrigation system when the lands were fully developed. Therefore,
it was important to determine the actual losses and to make any
necessary changes in the design values. Such tests were made in
the Denver laboratories of the Bureau of Reclamation, and the inves-
tigation was later extended to studies of other designs to obtain
equal or better performance with lower losses.
The amount of scour or erosion produced in the canal
immediately downstream from transitions was important due to main-
tenance cost and/or the need for riprap or other armor protection
in the canal. The effect on canal bank erosion of changes in the
upward slope of the transition invert, in the entering pipeline,
2 '' E

and in the rate of divergence of the transition sidewalls were not
]mown. Evaluation of these variables was necessary before design
decisions could be made as to optimum outlet shape and canal bank
protection requirements.
The many different operating conditions and design modi-
fications involved in the testing program dictated that the studies
be conducted in a laboratory where such changes could be made easily
and quickly. To fill this need, studies were inaugurated and are
continuing on an intermittent basis in the Bureau's laboratories.
This paper discusses the equipment and procedures used in the tests
and the results obtained to date.
TEST EQUIPMT
Water Mbdel
Most of the studies were made using a canal section sup-
ported about 5 feet above the laboratory floor (Figures 1B and 2).
The canal was formed of loose plastering sand that eroded easily and
showed scour effects within a short time. Canal invert widths of
12 and 18 inches were used, and the canal sides were on 1-1/2:1
slopes, The canal invert was level in the direction of flow. A
template that rode on the top rails of the box was used as a guide
for reshaping the canal bed between runs, assuring that a constant
starting geometry would be obtained in the canal.
At first the transitions were tested only as outlet struc-
tures with the flow passing from the pipeline, through the transition,
3

and into the canal. The 12-inch-diameter pipe that supplied water
to the transition was placed level in part of the tests, and on a
2:1 upslope to the transition for other tests. The depth of flow
in the canal was regulated by an adjustable tailgate at the down-
stream end of the model.
In later studies the transitions were studied both as
inlets and outlets. The piping was modified so that in addition to
the flow described above, water could be introduced into the canal
from the tailgate end of the box to produce inlet flows into the
transition and pipeline (Figure 2).
When a transition was used as an outlet, the pressure head
in the 12-inch-diameter pipeline was measured at a station 1 foot
(one-conduit diameter) upstream from the transition. When the tran-
sition was used as an inlet, the pipeline head was measured at a
station 15 feet (15D) downstream from the junction of the transition
with the pipeline. The pressures were obtained by two piezometers,
one on each side of the pipe. The pressure leads were connected to
1-1/2-inch-diameter stilling wells, and point gage measurements were
made of the free water surfaces within the wells. The water surface
elevations in the canal were measured by point gages 15 feet down-
stream from the junction of the transition with the canal for outlet
flows, and 4 feet upstream from this junction for inlet flows.
Air Model
Studies of closed-conduit expanding outlet transitions
were also made with a test facility using air as the flowing fluid

(Figure 3). Air was drawn from the atmosphere through a 12-inch-
diameter pipe into the centrifugal blower. It then passed through
a 10.1+-inch-diameter pipeline into the expanding transition being
tested, and back into the atmosphere. The 10.14-inch-diameter pipe-
line was 63 inches long (6.2D) for most of the tests, and was
lengthened to 207 inches (20.4D) for the remaining tests. A piezo-
meter located 4-1/2 inches from the outlet was used with the 6.2D
pipe, and two diametrically opposed wall taps located 1 diameter
from the outlet were used with the 20.4D pipe.
INVESTIGATION
0-ogn-channel TXnsitions
A number of open, broken-back transitions were tested to
determine the effect of upward slope of the invert, rate of sidewall
divergence, degree of submergence over the outlet pipe crown, and
slope of the incoming pipeline on energy losses and scour in the canal
channel (Figures 4 through 13). In addition, the effect of placing
humps on the transition invert to aid in spreading the flow, and the
effects of other modifications such as changing the sidewalls to mod-
ified warped walls were tested. For convenience these designs,
operating conditions, and test results are briefly summarized in
Table 1. Loss factors for all the broken-back transitions, including
the ones modified with warped surfaces, were about 0.5 to 0.7 ©hV
for outlet flows. The term Ahv equals the velocity head in the
pipeline 1 diameter upstream from the transition, minus the velocity
head in the canal 15 feet downstream from the transition.

The flow patterns through all the open transitions were
generally similar. If the inlet pipe entered the transition hori-
zontally, the stream issuing from it tended to move straight through
the transition into the canal, and large eddies moved upstream well
up into the transition along either side of the jet (Figure 5A).
Scour on the canal bottom and on the side slopes was appreciable in
the loose sand and a sandbar was built up across the canal 6 to
12 feet downstream from the canal entrance (Figure 5B).
If the inlet pipeline was sloped, the issuing stream rose
in the transition to the water surface to cause higher surface veloc-
ities and waves that scoured the canal slopes (Figure 6A). Flow was
nearly stagnant at the bottom of the transition and, in some cases,
sand was deposited in the transition. A wide sandbar built up
several feet downstream from the canal entrance (Figure 6B).
Changes in the slope of the transition invert from a mini-
mum of 1:13.1 to a maximum of 1;5.5 had no apparent effect on the
losses encountered or on the scour produced (Table 1 and Figures 5
through 13). Likewise, changes in divergence angles of the outer
walls of the transitions from the minimum of 16° per side to a maxi-
mum of 300 per side had no appreciable effect, although limited data
show a slightly lower loss for a 25° angle. Even altering the outer
walls by constructing warped surfaces within the confines of the
broken back walls was not significantly effective.
Different submergences above the crown of the pipe at its
juncture with the transition showed little effect in early tests.
1
More detailed investigations with the 20', 25°, and 30° broken-back
transitions showed lowest losses with small submergences, and pro-
gressively higher losses with submergences exceeding about 0.1 pipe
diameter (Figure 33A).
Several "humps" were placed on the transition invert a
short distance downstream from the pipe exit to help spread the flow
and obtain smoother conditions with more uniform velocities at the
canal entrance (Figures 4, 5C). Improvements in flow conditions and
reductions in scour occurred, but the losses were either unaffected
or increased. The usefulness of humps in these transitions appeared
to be restricted to reducing scour in the canal.
A qualitative measurement of riprap needed for controlling
scour in the canal was obtained by placing a 4-inch-thick layer of
1-1/2-inch gravel in the first 6 feet of the model canal. Tests
were made with the 1:8 slope,6-inch rise transition with warped
walls and a horizontal inlet pipeline (Figure 13). A flow velocity
of 3 feet per second in the pipeline failed to move any gravel or
any appreciable amount of sand in the bed downstream. A velocity of
4 feet per second also failed to move the rock and moved only a very
small amount of sand. At a 6-foot-per-second pipeline flow veloc-
ity, the rock remained stable but considerable erosion occurred in
the sand farther downstream (Figure 13C). It was apparent that this
1-1/2-inch rock was capable of protecting the model canal from
scouring tendencies. By geometric scaling this rock is equivalent
to 0.125 times the pipe diameter. No tests were made with other
7

sized rocks, but information on required prototype riprap sizes is
available from other sources.f
Noticeable reductions in head loss, improvements in flow
distribution, and reduction in scour were achieved when closed-
conduit expanding sections were used in conjunction with the open
transitions. A short submerged shelf projecting downstream from the
transition headwall just above the pipeline crown in a l:g sloping
transition cut the loss factor from about 0.6 to less than 0.5
(Table 1). A longer hood that created a 4D-long closed-conduit
within a 1:8 transition and had a maximum divergence rate of 8-1/20
per side reduced the loss factor to 0.21 (Figure 7C). A short
closed-conduit transition from the 12-inch circular pipe to a
12-inch square section, inserted in the pipeline just ahead of the
rectangular 1:8 broken back transition, reduced the 0.6 loss factor
to less than 0.4. It was apparent that the best opportunities for
improving transition performance lay in closed-conduit, gradually
expanding sections.
Closed-conduit Transitions--Air Model Tests
To determine the performance of a series of expanding
closed-conduit transitions, air model tests were made (Figures 3
and 4). The shapes of the transitions were selected after consid-
ering design problems involved in coupling them with open-type, but
shortened, transitions. To avoid excavations deeper than for present
1 "Stilling Basin Performance Studies as an Aid in Determining Riprap Sizes," USBR Hydraulic Laboratory Report No. HYD-409, by A. J. Peterka, February 23, 1956.
8 -1

structures, no downward divergence relative to the centerline was
used. Similarly, to avoid lowering the structure to maintain sub-
mergence over the crown of the conduit, no upward divergence rela-
tive to the centerline was used. Thus, the height of the transition
at the outlet was the same as at the inlet and equal to the diameter
of the pipeline. All divergence in the closed-conduit transitions
occurred through divergence of the sidewalls and through the
change in section from circular inlets to square or rectangular
outlets.
Each transition was first tested on the 6.2-diameter-long
approach pipe, and velocity traverses were taken horizontally and
vertically at the inlet and outlet (Figure 15). There was a slight
distortion in the inlet velocity profile with the round-to-square
transition, and the distortion became progressively greater as tran-
sition expansion increased. The outlet profiles showed that the
flow expanded well and followed the diverging walls in the 0°,
2-1/20, and 50 transitions and to a lesser extent in the 7-1/2°
transition. The 100 diverging section was too abrupt, and flow
broke away from the right side and the upper and lower right corners
so that reverse flow occurred.
It was believed that the somewhat distorted velocity dis-
tribution at the transition inlets had appreciable effect upon the
ability of the flow to follow the expanding boundaries. A 12-foot
extension was added to the approach pipe to produce a section
20.4 diameters long and obtain a mare fully developed and uniform
9

distribution. Tests with the 0 0 divergence transition showed nearly
symmetrical velocity distributions at both the inlet and outlet
(Figure 16A). However, tests with the 100 transition showed notice-
able velocity distortion in the horizontal traverse at the inlet,
apparently due to the severe separation along the right side of the
outlet. This separation was greater than the separation that
occurred with the short approach pipe. It was concluded that
regardless of the uniformity of approach conditions, the 100 transi-
tion was too abrupt to control the discharging flow.
Pressures were subatmospheric at the approach pipe wall
taps just upstream from the transitions. This was expected and is
due to recovery of head wherein velocity head of the entering stream
is converted into pressure head as the flow expands and slows. The
pressure level into which the transitions discharge is atmospheric,
and hence the pressures in the approach conduit and upstream parts
of the transitions where the flow is fast will be less than atmos-
pheric. The extent of the subatmospheric pressure level is a direct
measure of the amount of head recovery or effectiveness of the
expanding transition. The pressure head at the inlet, divided by
the inlet velocity head, produced dimensionless parameters which
were plotted against degrees of sidewall divergence (Figure 17A).
The greatest head recovery occurred in a transition with a diver-
gene of 70 to $° and was 55 percent of the inlet velocity head.
The loss in total head from the transition inlet to the
atmosphere, divided by inlet velocity head, was similarly plotted
10 -

against sidewall divergence (Figure 17B). This loss factor, K, was
lowest for a divergence of 7.50 to g° and was 44 percent of the inlet
velocity head. The pressures on the transition walls were negative
with respect to the outlet head (atmospheric) in all cases except
near the outlet of the 0° transition (Figure 18). The pressures at
a given station became generally more negative as the rate of tran-
sition divergence increased, until the 10° transition was approached
and the trend reversed. Flow separation occurred in this transition,
and the effectiveness and efficiency dropped below that of the 7-1/20
transition. In all cases, the lowest pressures were obtained on the
transition element leading from a 45° point on the circular inlet
to an outlet corner. These elements diverge more rapidly than any
others in the transitions.
For comparative purposes, plots of cross-sectional areas
versus distance along the transition are presented for the transi-
tions tested and for conic transitions (Figure 19).
Loss coefficients, K, for conic expanding transitions of
2-1/20 and 7-1/20 relative to the centerline, and discharging
directly into the atmosphere, were found in previous tests to be
0.273 and 0.499,respectively, based on the inlet velocity heads.2/
These values show a trend of greater loss with greater divergence to
7-1/2`, instead of the decreasing loss shown by the round-to-
rectangular transitions. This difference is explained by a comparison
2/"Hydraulic Model Studies of the San Jacinto-San Vicente Turnout and Metering Structure, San Diego Aqueduct Project, California," USBR Hydraulic Laboratory Report No. HYD-365 by W. P. Simmons, January 1953.
11 ~

of the area curves (Figure 19) that show that conic sections enlarge
much more rapidly than the round-to-rectangular transitions of the
present study, and indicates that considerable separation, and
hence loss, occurred in the 7-1/20 cone. This separation was found
to exist in the turnout structure conic transition.
Combination Closed-conduit and Oren-channel Transitions
The relatively high efficiency of the closed-conduit
expanding transitions was partially exploited by placing 2D-long,
round-to-rectangular transitions between the end of the circular
pipeline and a shortened and modified broken-back transition
(Figure 20). The height of the closed transition was kept the same
as the diameter of the pipe and the sides diverged 7-1/20 relative
to the centerline. The length was 2D and the outlet measured
12 inches high by 18-3/$ inches wide with an area 2.8 times greater
than at the inlet. A 5.5D-long, upwardly sloping open-channel tran-
sition adapted the rectangular section to the trapezoidal section of
the canal. .
The loss coefficient for outlet flows was about 0.4 with
the inlet pipe horizontal, and about 0.2 with it rising on a 2:1
slope (Table 1). With the pipe horizontal, waves were smaller and
less powerful than in previous transitions, but scour remained
appreciable (Figure 21). This was apparently due to flow from the
closed pipeline continuing straight through the open transition
along the floor without appreciable spreading or slowing. Large
back eddies were present at the sides in the open transition.
12

Several humps were placed on the floor to "lift" this flow stream
and help spread it. Scour was decreased when a 6-3/8-inch-high
wedge-shaped hump was used, but remained almost unchanged with a
3-3/8-inch one (Figures 20 and 22). Better flow conditions occurred
when the inlet pipe was placed on a 2:1 upslope (Figure 23). Wave
action persisted, but flow was distributed more uniformly across
the section upon reaching the canal. Considerable flow was present
along the broken-back transition invert, although the greater part
of the flow was near the surface. The scour was moderate and the
energy loss coefficient decreased to 0.21.
Additional tests were made with an open transition having
a horizontal invert (Figures 20B and 24). The submergence over the
crown of the closed-conduit outlet for a 15-inch (1.3D) flow depth
in the canal was 0.3D, as compared with 1.3D for the sloped, open
transition. The tests were made with a 2:1 sloping pipeline. The
water surface was somewhat choppy and waves carried into the canal
to produce moderate bank erosion. The flow moving downstream
extended completely across the water prism at the canal entrance,
and from the water surface downward to 4 or 5 inches above the canal
invert. The lowest layers of water were not in significant motion
and bottom scour was not apparent. The loss coefficient decreased
to 0.15, possibly due to the greatly decreased submergence at the
outlet of the closed conduit.
13 r
Closed-conduit Transitions--Hydraulic Tests
The losses of the combined closed-conduit and open-channel
transitions were significantly lower than for the usual open ones,
and scouring was reduced. Consequently, longer round-to-rectangular
closed-conduit transitions that terminated in a headwall normal to
the canal were studied (Figure 25). The water discharged directly
through the headwall into the canal section for outlet flow tests,
and through the headwall into the transition for inlet flow tests.
No further transitioning was used. The closed-conduit transitions
exploited the fact that more orderly and complete expansion, and
hence slowing of the flow, can be obtained in closed conduits than
can be obtained in the usual open-type transitions. Ideally, based
on the areas of the inlet and outlet, a two-thirds velocity reduc-
tion can be achieved and about 90 percent of the velocity head can
be recovered in a closed-conduit transition 6 diameters long and
with a moderate rate of divergence.
12- by 28-inch Transition. A closed-conduit transition
with a 12-inch-diameter inlet, a 12-inch-high by 28-inch-wide
rectangular outlet, and a length of 72 inches (6D) was constructed
and tested (Figures 2 and 25A). The transition sloped upward
4 inches and the top of the exit was level with or slightly
beneath the normal canal water surface. The transition terminated
in a vertical headwall placed normal to the canal and the 12-inch-
diameter inlet pipeline was placed horizontal.
14

Relatively good flow conditions occurred near the head-
wall and in the canal. Conditions were similar to those shown
in Figure 28. The least desirable conditions were present at a
15-inch flow depth (1.25D) where significant return eddies
occurred along the banks at the water surface near the headwall.
These eddies eroded the canal bank slopes noticeably (Figures 26B
and 26C). At a 12-inch depth (1.COD) these eddies were small
enough to be of little consequence and erosion was minor (Figure 26A).
At a 10-inch depth (0.82D) the eddies were not significant, but
flow velocities along the canal banks and invert were higher than
desired and erosion increased. The scours at the 0.83, 1.00, and
1.25D depths compared favorably with those of the open, and the
combination open-closed transitions.
Loss coefficients for the 12- by 28-inch transition,
when used as an outlet, were quite low and equal to 0.11, 0.09,
and 0.11 for canal depths of 0.$3,1 00, and 1.25D, respectively
(Table 1 and Figures 27E and 33). Loss coefficients when the
transition was used for inlet service were 0.34, 0.37, and 0.1.0,
respectively. It was apparent that very low energy losses were
obtained for outlet service, and that no penalty was incurred in
erosion in the canal, or in losses for inlet service.
Detailed studies of the flow conditions were made by
velocity traverses across the inlet pipeline and the outlet portal
(Figure 27). The measurements showed undesirable flow separation
along the left side and the corners of the transitions when it
15
was used in outlet service. This indicated excessive divergence
of the flow passage and a design unnecessarily expensive due to
greater than required width.
12- by 24-inch Transition. A 6D-long transition with
a 12-inch-diameter inlet and a lesser divergence rate to a rec-
tangular outlet 12 inches high by 24 inches wide was constructed
(Figure 25B). When used as an outlet it produced flow in the
canal generally similar to that obtained with the previous closed
transition (Figure 28). Scour in the canal was relatively small
at all flow velocities and water depths and comparable with the
best of the other designs (Figures 29 and 30). The loss coef-
ficients decreased to 0.09, 0.07, and 0.11 for the 0.£33, 1.00,
and 1.25D flow depths (Figures 31 and 33). The reduced scour and
lower losses attested to the excellent performance of the transi-
tion in expanding the flow, and velocity measurements at the out-
let confirmed the conclusion (Figure 31).
The transition performed quite satisfactorily when used
as an inlet. Good flow distribution was present in the pipeline,
and loss coefficients of 0.35 were determined for canal depths
of 1.00 and 1.25D (Figures 31 and 33C). These losses compared
very favorably with those of all other designs.
It was recognized that field installations might require
transitions so large that the flat tops near the headwall would
pose structural problems. This would be less complicated if the
span were cut in half by using a center supporting wall or pier.
16

To determine the effects of such a pier on the flow and losses,
tests were made with an 18-inch-long pier in the transition
(Figures 25B, 32, and 33). The pier was 0.2D thick and had a
rounded upstream end and a blunt face at the downstream end. Its
presence increased the outlet loss coefficients to 0.10, 0.12,
and 0.17, and the inlet loss coefficients to 0.39 and 0.40. A
part of this increased loss is undoubtedly due to the more dis-
torted velocity distribution that occurred in the tests with the
pier present (Figure 32). When this increased distortion was
first noted the pier was suspected of being out of alinement. A
check of the alinement showed it to be satisfactory.
Square Inlet on 12- by 24-inch Transition. Considera-
tion of the cost of forms to make round-to-rectangular transi-
tions led to questioning whether or not simpler square-to-
rectangular designs would perform satisfactorily. Therefore, a
6D-long transition with a 12-inch-square inlet instead of a round
one, and a 12- by 24-inch rectangular outlet was tested (Figure 25C).
The loss coefficients for outlet flows were 0.20, 0.20, and 0.23
for depths of 0.83D, 1.00D, and 1,250. These values represent
about a 100 percent increase over those obtained with the circu-
lar entrance design. For inlet-type flows, the loss coefficients
were 0.50, 0.50, and 0.51 (Figure 33C). These values are about
25 percent higher than for the circular inlet transition.
In terms of actual head loss in a prototype structure
at flow velocities of 8 feet per second, the outlet losses for
17
the square-to-rectangular transition are about 0.10 feet of
water more than for the round-to-rectangular design. In many
instances this sma11 additional loss may be insignificant, and
the lesser construction cost of the square-to-rectangular tran-
sition will dictate its use.
CONCLUSIONS
1. The energy losses for conventional, broken-back, open-
channel transitions discharging from pipes into small canals is 0.6
to 0.7 times the difference in velocity heads in the pipe and in
t
he canal (Table 1 and Figure 35). This velocity head difference,
-:.a c 2 - 2 is termed Ghv . g g'
2. Reasonable changes in angle of divergence of the side-
and/or of the slope of the invert of the open transitions,
or of the attitude of the inlet pipeline, had little effect upon
energy losses (Figure 4 and Table 1).
3. Outlet losses were reduced to 0.4 A by and less,
when short, closed conduit,expanding transitions were placed between
the pipeline and modified, broken-back transitions (Figures 20 and
35).
4. Outlet losses were reduced to 0.1 A by with 6D-long,
closed-conduit transitions having circular inlets and rectangular
outlets, and which discharged directly into the canal through a
vertical headwall placed normal to the canal axis (Figures 3A and
35) .
18 f
5. The addition of a dividing pier to decrease the
structural span of the roof near the outlet of the round-to-
rectangular transition increased the losses to about 0.13 Ahv . .
6. Changing the 6D-long transition to provide a square
instead of the more difficult to form circular inlet increased the
outlet losses to 0.20 AhV, and the inlet losses to 0.50 A hv .
7. Outlet losses of existing broken-back transitions
can be materially reduced by installing properly designed hoods
within the structures to form controlled, closed-conduit expanding
sections (Figure 7C and Table 1).
g. Losses for inlet flows were about 0.4 to 0.5 ©hv
for all transitions tested (Table 1).
9. Scour or erosion in the loose sand of the canal bed
was extensive with conventional, broken back transitions (Figures 5
through 13).
10. Selected humps or flow spreaders on the inverts
within open transitions significantly reduced scour (Figures 5
through 13). The humps tested created a slight increase in head
loss.
11. Scour was not appreciably affected by changes in the
sidewall divergence or invert slopes of the open transitions.
12. Scour with the combination closed-conduit and open-
channel transitions was less than for the conventional transitions
(Figures 21 through 24).
19

13. Scour was reduced, in most cases, when the pipeline
to the transition was on a 2:1 slope instead of horizontal.
14. Scour with the 6D-long, closed-conduit transitions
was about the same as with the combination transitions, and less
than for the conventional transitions (Figures 261 29, and 30).
15. In general, scour was nominal with flow velocities
of 4 fps in the 12-inch-diameter pipe, and severe with velocities
of 6 fps. By scaling to larger structure sizes, according to
Froude laws, these velocities are equivalent to 5.7 and 8.5 fps for
24-inch pipe, and 8 and 12 fps for 48-inch pipe.
16. A 4-inch-thick layer of 1-1/2-inch gravel extending
.feet downstream from the transition of the 12-inch test installa-
tion provided excellent scour protection at the transition outlet
(Figure 13). Erosion occurred beyond this blanket when the veloc-
ities were high and/or if waves were appreciable.
17. The optimum divergence of the sides of short, circular-
to-rectangular, constant height, closed-conduit transitions is 7-1/2°
relative to the centerline (Figures 14, 15, 18, and 19). For longer
transitions the divergence should be decreased to about 5° per side.
18. For both inlet and outlet flows submergences up to
0.25D over the crown of the pipeline at its junction with the head-
wall had only moderate effects upon head losses in the broken back
and the 6D-long closed-conduit transitions (Figure 33). Higher
submergences tested in the broken back transitions further increased
20 =Y
1~

the losses. Negative submergences down to -0.17D, which is tanta-
mount to not having the transition full at the headwall, indicated
only minor head loss increases for outlet flows.
21 '
x
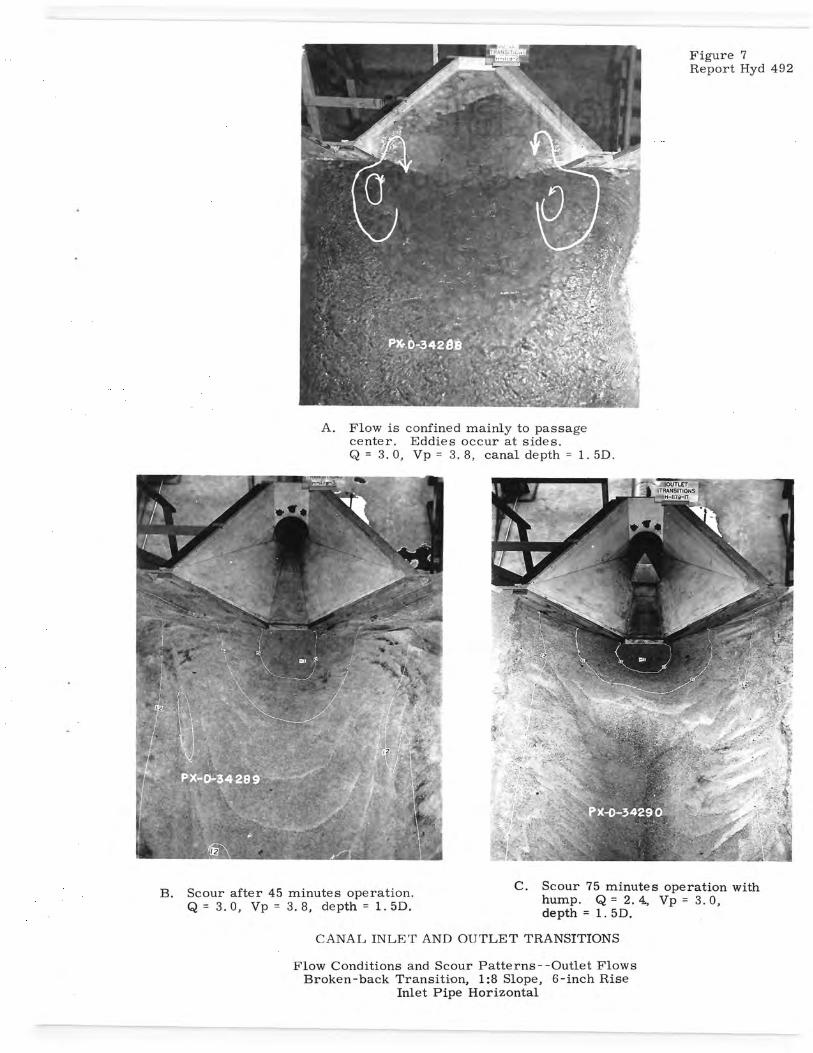
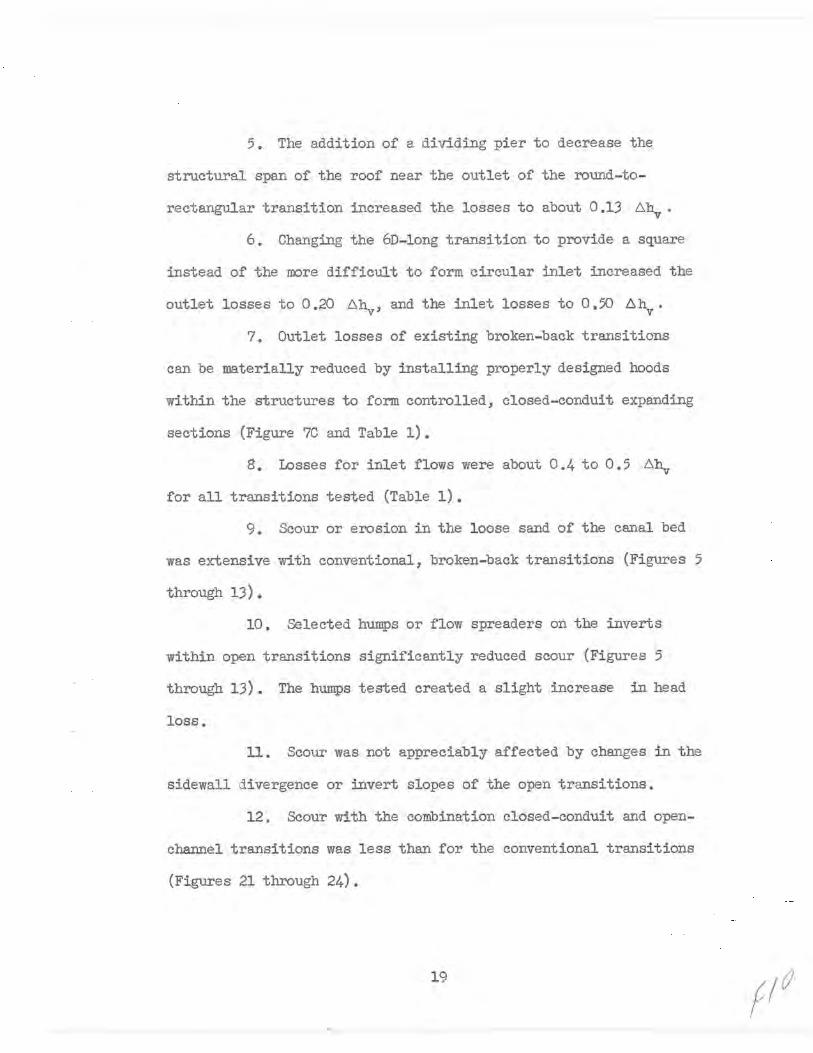
Figure 7 Report Hyd 492
A. Flow is confined mainly to passage center. Eddies occur at sides. Q = 3. 0, Vp = 3. 8, canal depth = 1. 5D.
Scour 75 minutes operation with B. Scour after 45 minutes operation. C. hump. Q = 2. 4, Vp = 3. 0, Q = 3. 0, Vp = 3. 8, depth = 1. 5D, depth = 1. 51).
CANAL INLET AND OUTLET TRANSITIONS
Flow Conditions and Scour Patterns--Outlet Flows Broken-back Transition, 1:8 Slope, 6-inch Rise
Inlet Pipe Horizontal

Figure 8 Report Hyd 492
A. The surface is turbulent with Q = 3. 1 cfs, Vp = 4.0 f/s, depth = 1. 3D. A boil occurs near the headwall.
B. Scour after 1 hour operation. Q = 2. 4 cfs, Vp = 3. 0 f / s, depth = 1. 3D. Sand was deposited in the transition.
CANAL INLET AND OUTLET TRANSITIONS
Flow Conditions and Scour--Outlet Flows Broken-back Transition Modified with Warped Surfaces
1:8 Slope, 6-inch Rise. Inlet Pipe on 2:1 Slope

1
Figure 9 Report Hyd 492
A. The water surface is mildly turbulent. Q= 4.7 cfs, Vp = 6.0 f/s, depth= 1.31).
B. Scour after 1 hour operation. Q = 4. C. Scour after 45 minutes operation with Vp = 6. 0, depth = 1. 3D. hood installed in transition. Q = 4. 7,
Vp = 6. 0, depth = 1. 3D.
CANAL INLET AND OUTLET TRANSITIONS
Flow Conditions and Scour Patterns--Outlet Flows Broken-back Transition, 1:8 Slope, 12-inch Rise
Inlet Pipe Horizontal

Figure 10 Report Hyd 492
A. The water surface is somewhat rough. Q = 4. 7, Vp = 6. 0, depth = 1. 3D.
%Q,
~ 1 f
- n
B. Scour after 1 hour operation. Q = 4. 7, Vp = 6. 0, depth = 1. 3D.
CANAL INLET AND OUTLET TRANSITIONS
Flow Conditions and Scour Pattern--Outlet Flows Broken-back Transition, 1:8 Slope, 12-inch Rise
Inlet Pipe on 2:1 Slope

Figure 11 Report Hyd 492
A. Mildly turbulent water surface. Q = 2. 4, Vp = 3. 0, depth = 0. 8D.
B. Scour after 25 minutes operation each, with flow velocities in pipeline of 2, 2. 5, and 3 f/s. Depth = 0. 8D.
CANAL INLET AND OUTLET TRANSITIONS
Flow Conditions and Scour Pattern--Outlet Flows 30° Broken-back Transition, 4-inch Rise
Inlet Pipe Horizontal

Figure 12 Report Hyd 492
A. Mildly turbulent water surface. Q = 2. 4, Vp = 3. 0, depth = 0. 8D.
B. Scour after 30 minutes operation each at flow velocities in pipeline of 2, 2. 5, and 3 f/s. Depth = 0. 8D.
CANAL INLET AND OUTLET TRANSITIONS
Flow Conditions and Scour Pattern--Outlet Flows 25° Broken-back Transition, 4-inch Rise
Inlet Pipe Horizontal
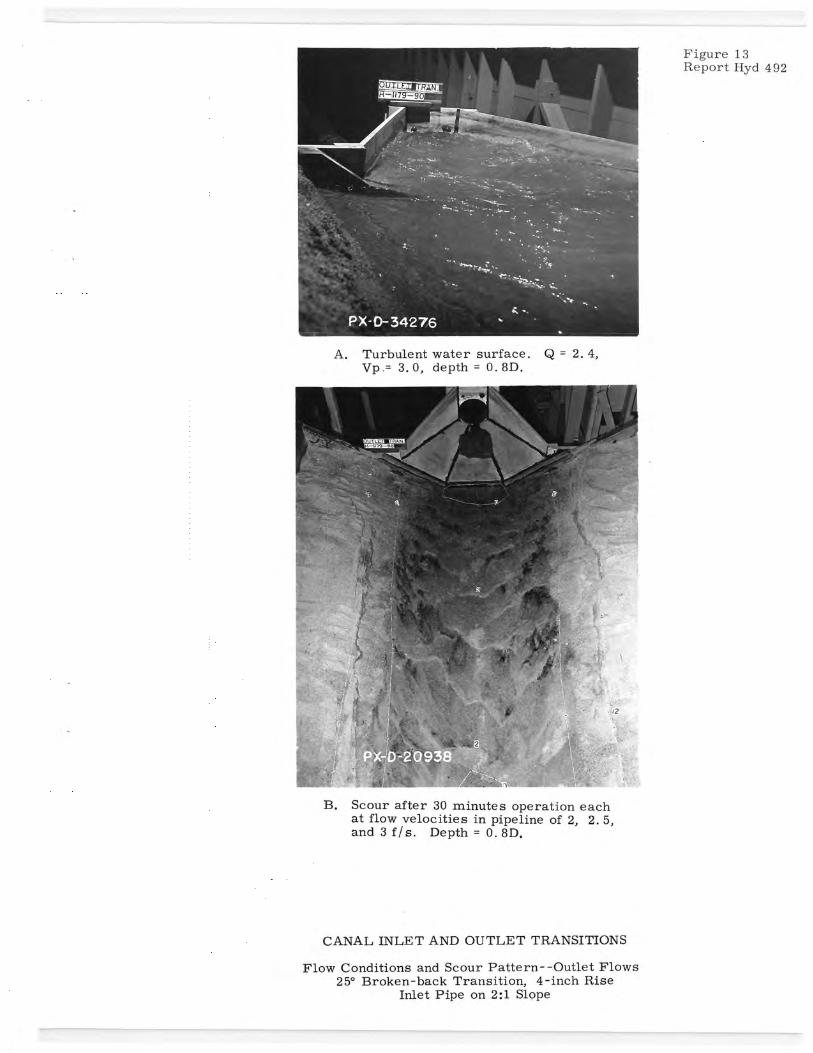
Figure 13 Report Hyd 492
A. Turbulent water surface. Q = 2. 4, Vp.= 3. 0, depth = 0. 8D.
B. Scour after 30 minutes operation each at flow velocities in pipeline of 2, 2. 5, and 3f/s. Depth= 0.81).
CANAL INLET AND OUTLET TRANSITIONS
Flow Conditions and Scour Pattern--Outlet Flows 25° Broken-back Transition, 4-inch Rise
Inlet Pipe on 2:1 Slope

Figure 14 Report Hyd 492
A. Scour after 2-1 / 2 hours, Vp = 2~ 2. 5, and 3 f Is; canal depths of 8, 10, and 12 inches. Pipeline horizontal.
b.
B. Scour after 2-1 / 2 hours, Vp = 2, 2. 5, and 3 f Is; canal depths of 8, 10, and 12 inches. Pipeline on 2:1 slope, depth = 0. 8D.
CANAL INLET AND OUTLET TRANSITIONS Scour Patterns--Outlet Flows
20° Broken-back Transition, 4-inch Rise 20-inch Canal Invert

Figure 15 Report Hyd 492
A. Flow conditions. Q = 2. 4, Vp = 3 f/s. Scour was negligible.
B. Flow conditions. Q = 4. 7, Vp = 6 f/s. Scour occurs at end of riprap.
C. Scour after 1 hour at Q = 3. 1 cfs, Vp = 4 f/s and 1 hour at Q = 4.7 cfs, Vp = 6 f /s, canal depth = 1. 3D.
CANAL INLET AND OUTLET TRANSITIONS
Flow and Scour in Canal Protected by 4-inch Layer of 1-1/2-inch Gravel. 1:8 Slope, 6-inch Rise Transition with Warped Walls and Horizontal Pipeline--Outlet Flows
Figure 22 Report Hyd 492
A, Water surface is mildly turbulent in transition, but smooth in canal. Q = 4. 7, Vp = 6. 0, canal depth = 1. 3D.
B. Scour after 1 hour operation. Q = 4. 7, Vp = 6. 0, canal depth = 1. 3D.,
CANAL INLET AND OUTLET TRANSITIONS
Flow Conditions and Scour Pattern--Outlet Flows Combination Closed-conduit and Broken-back Transition
1:5. 5 Slope, 12-inch Rise. Inlet Pipe Horizontal

0
t, w .r
C. Scour after 1 hour operation 3-3/8-inch-high deflector. Q = 4. 7, Vp = 6. 0 cfs.
Scour after 1 hour operation 6-3/8-inch-high deflector. Q = 4. 7, Vp = 6.0 f/s.
Figure 23 Report Hyd 492
A. A hump occurs in the water surface above the Design 2, hump-like deflector on the floor. Q = 4. 7, Vp = 6. 0, canal depth = 1. 3D,
CANAL INLET AND OUTLET TRANSITIONS
Flow Conditions and Scour Patterns--Outlet Flows Combination Closed-conduit and Broken-back Transition
With Floor Deflector 1:5. 5 Slope, 12-inch Rise. Inlet Pipe Horizontal
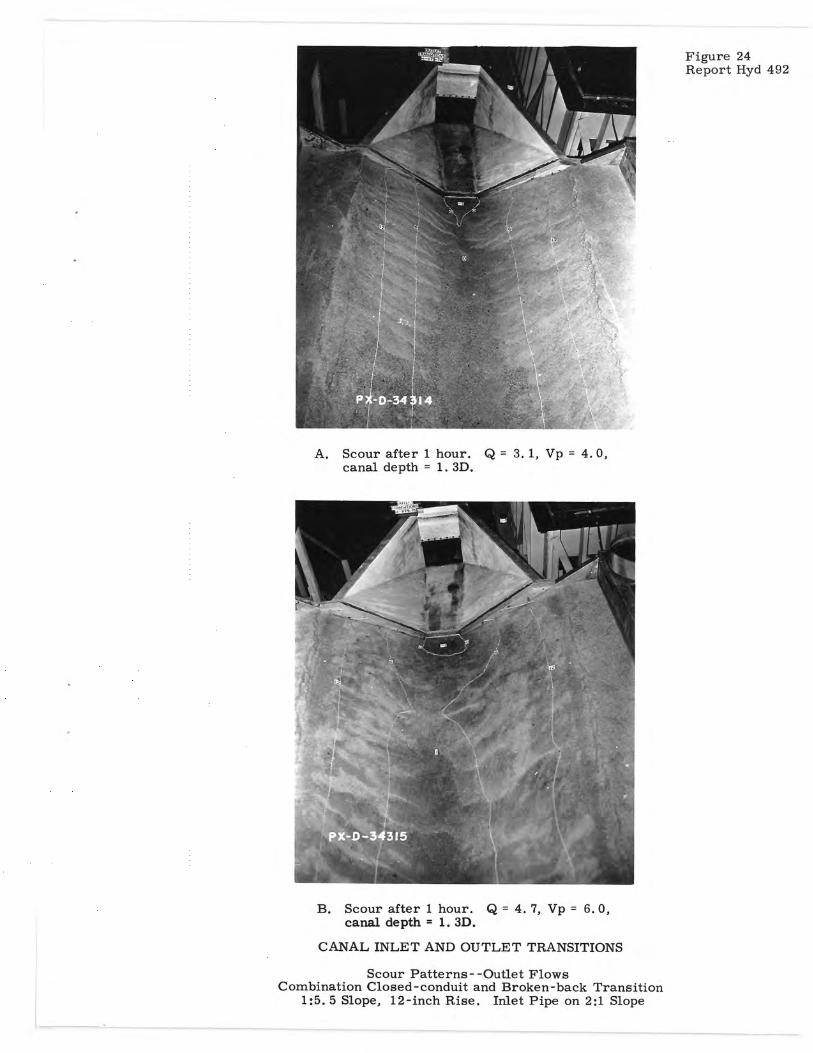
Figure 24 Report Hyd 492
A. Scour after 1 hour. Q = 3. 1, Vp = 4. 0, canal depth = 1. 3D.
B. Scour after 1 hour. Q = 4. 7, Vp = 6. 0, canal depth = 1. 3D.
CANAL INLET AND OUTLET TRANSITIONS
Scour Patterns--Outlet Flows Combination Closed-conduit and Broken-back Transition
1:5. 5 Slope, 12-inch Rise. Inlet Pipe on 2:1 Slope

Figure 25 Report Hyd 492
A. Somewhat turbulent water surfaces occur in the transition and canal. Q = 4. 7, Vp = 6. 0, canal depth = 1. 3D.
B. Scour after 1 hour operation. Q = 4. 7, Vp = 6. 0, canal depth = 1. 3D.
CANAL INLET AND OUTLET TRANSITIONS
Flow Conditions and Scour Pattern--Outlet Flows Combination Closed-conduit and Broken-back
Transition--Level Invert--Inlet Pipe on 2:1 Slope
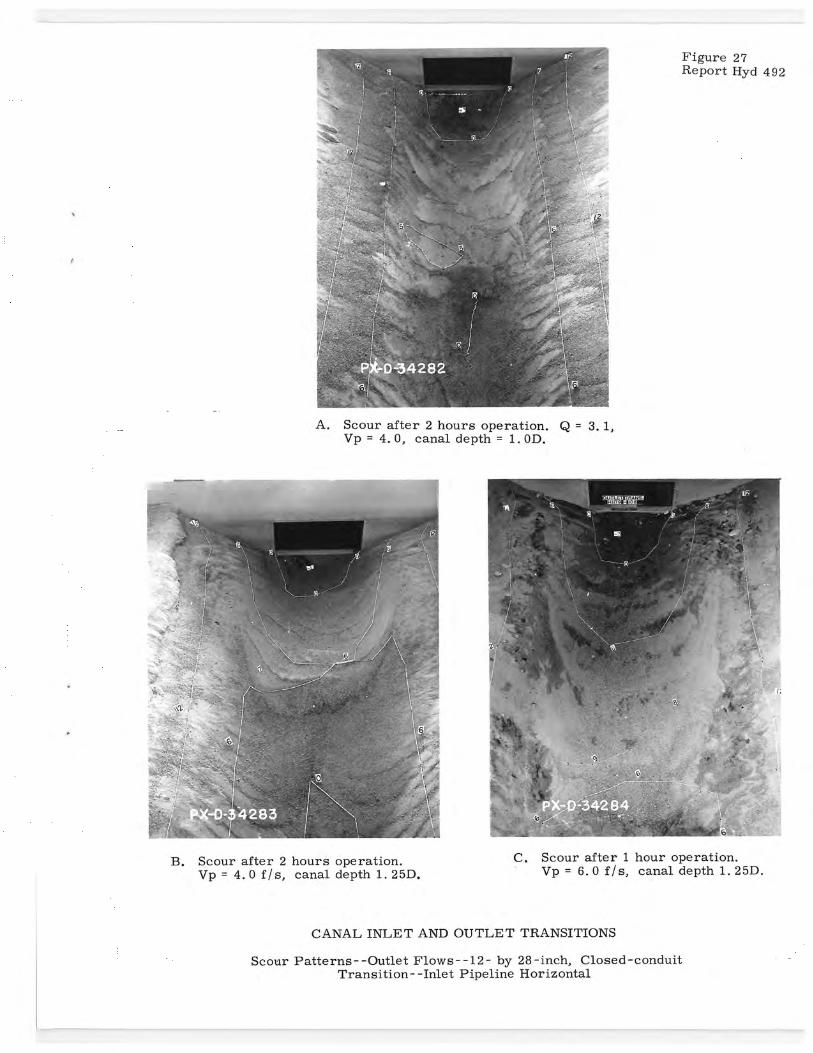
Figure 27 Report Hyd 492
A. Scour after 2 hours operation. Q = 3. 1, Vp = 4. 0, canal depth = 1. OD.
B. Scour after 2 hours operation. Vp = 4. 0 f / s, canal depth 1. 25D.
C. Scour after 1 hour operation. Vp = 6.0 f/s, canal depth 1. 25D.
CANAL INLET AND OUTLET TRANSITIONS
Scour Patterns--Outlet Flows--12- by 28-inch, Closed-conduit Transition--Inlet Pipeline Horizontal

Figure 29 Report Hyd 492
A. 0. 83D canal depth.
B. 1. OOD canal depth.
C. 1. 25D canal depth.
CANAL INLET AND OUTLET TRANSITION
Flow From Outlet Transition--12- by 24-inch Closed-conduit Transition 4 f /s Velocity in Pipeline, Inlet Pipe Horizontal

H, t.
A
r
C. Scour after 1 hour operation. Canal depth = 1. 25D.
B. Scour after 1 hour operation. Canal depth = 1. OOD.
Figure 30 Report Hyd 492
A. Scour after 1 hour operation. Canal depth = 0. 83D.
CANAL INLET AND OUTLET TRANSITIONS
Scour Patterns--Outlet Flows--12- by 24-inch, Closed-conduit Transition 4 f /s Velocity in Pipeline, Inlet Pipe Horizontal

A. 1.00D canal depth.
B. 1. 25D canal depth.
C. Erosion after 1 hour, 1. 25D depth.
Figure 31 Report Hyd 492
e,
A
CANAL INLET AND OUTLET TRANSITIONS
Flow Conditions and Scour Patterns--Outlet Flows--12- by 24-inch Transition 6 f/s Velocity, Inlet Pipe Horizontal