inland waterways and port modernization project...
TRANSCRIPT

E- /ApVio. 3
VIETNAM INLAND WATERWAY INTERNATIONAL BANK FORDEPARTMENT / PMU-SW RECONSTRUCTION
AND DEVELOPMENT
INLAND WATERWAYS ANDPORT MODERNIZATION PROJECT
REHABILITATION AND MODERNIZATION OFTHE PORT OF CAN THO
FINAL REPORT
JUNE 1996
INEDECOQNetherlands Engineering Consultants
Pub
lic D
iscl
osur
e A
utho
rized
Pub
lic D
iscl
osur
e A
utho
rized
Pub
lic D
iscl
osur
e A
utho
rized
Pub
lic D
iscl
osur
e A
utho
rized

LIST OF REPORTS
VOLUME I : EXECUTIVE SUMMARY
VOLUME II : INLAND WATERWAYS IMPROVEMENT PROJECT(Main Report)
Annex II - 1 Design ReportAnnex II - 2: Navigation AidsAnnex il - 3: Soil Report
VOLUME III RESETTLEMENT ACTION PLAN
VOLUME IV : ENVIRONMENTAL IMPACT ASSESSMENT &ENVIRONMENTAL MANAGEMENT PLAN
VOLUME V : TOPOGRAPHIC MAPS (scale 1:5000)
Book 1: Ho Chi Minh City - Cho Gao (PI/O to PI/l 3)Cho Gao - Sa Dec (PIl/OtoPIV/21)
Book 2: Sa Dec - Lap Vo (PIIl/Oto PIIl/14)Rach Gia - Ha Tien (PIV/O to PIV/1 9)Rach Soi - Ha Giang (PIV/20 to PIV32)
Book 3: Cho Lach - Mang Thit (PV/O to PV/20)Can Tho - Ca Mau (PVI/O to VI/38)

CONTENTS
1. INTRODUCTION 1A. Study Organisation 1B. The Terms of Reference 2
2. THE EXISTING PORT 3A. Fixed Facilities 3B. Equipment 7C. Management 9D. Manning 10E. Access to the Port 12
3. PORT TRAFFIC 14A. Historical Traffic 14B. Port Traffic in the South of Vietnam 18C. Present Cargo Trends 25D. Forecast of future cargo volumes 29
4. CARGO HANDLING 42A. Present Practice 42B. Improvements 44C. Equipment Requirements 45
5. BERTH OCCUPANCY 48A. The Main Berth 48B. The Mooring Buoys 48
6. FUTURE DEVELOPMENT 49A. Fixed Facilities 49B. Equipment 49C. Environmental Impacts 49
7. ECONOMIC ANALYSIS 53A. Background 53B. The With the Project Case 53C. The Without the Project Case 54D. Calculation of Economic Return 55E. Sensitivity Analysis 56
8. THE FINANCIAL FUTURE OF THE PORT 59
9. CONCLUSIONS 61
June 1996/5K9012.C1875.21/R005/SPE/tb
LIST OF TABLES
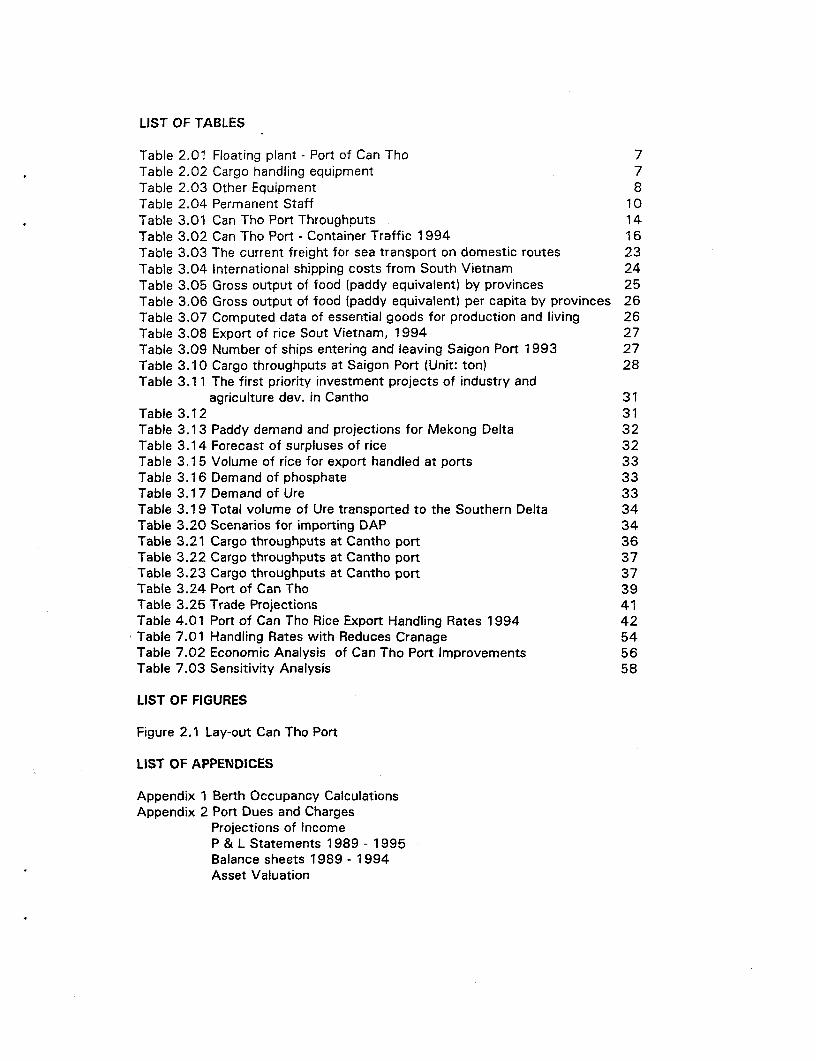
Table 2.01 Floating plant - Port of Can Tho 7Table 2.02 Cargo handling equipment 7Table 2.03 Other Equipment 8Table 2.04 Permanent Staff 10Table 3.01 Can Tho Port ThroughDuts 14Table 3.02 Can Tho Port - Container Traffic 1994 16Table 3.03 The current freight for sea transport on domestic routes 23Table 3.04 International shipping costs from South Vietnam 24Table 3.05 Gross output of food (paddy equivalent) by provinces 25Table 3.06 Gross output of food (paddy equivalent) per capita by provinces 26Table 3.07 Computed data of essential goods for production and living 26Table 3.08 Export of rice Sout Vietnam, 1994 27Table 3.09 Number of ships entering and leaving Saigon Port 1993 27Table 3.10 Cargo throughputs at Saigon Port (Unit: ton) 28Table 3.11 The first priority investment projects of industry and
agriculture dev. in Cantho 31Table 3.12 31Table 3.13 Paddy demand and projections for Mekong Delta 32Table 3.14 Forecast of surpluses of rice 32Table 3.15 Volume of rice for export handled at ports 33Table 3.16 Demand of phosphate 33Table 3.17 Demand of Ure 33Table 3.19 Total volume of Ure transported to the Southern Delta 34Table 3.20 Scenarios for importing DAP 34Table 3.21 Cargo throughputs at Cantho port 36Table 3.22 Cargo throughputs at Cantho port 37Table 3.23 Cargo throughputs at Cantho port 37Table 3.24 Port of Can Tho 39Table 3.25 Trade Projections 41Table 4.01 Port of Can Tho Rice Export Handling Rates 1994 42Table 7.01 Handling Rates with Reduces Cranage 54Table 7.02 Economic Analysis of Can Tho Port Improvements 56Table 7.03 Sensitivity Analysis 58
LIST OF FIGURES
Figure 2.1 Lay-out Can Tho Port
LIST OF APPENDICES
Appendix 1 Berth Occupancy CalculationsAppendix 2 Port Dues and Charges
Projections of IncomeP & L Statements 1989 - 1995Balance sheets 1989 - 1994Asset Valuation

EXECUTIVE SUMMARY
The Nature of the Study
This study was commissioned to produce a set of cargo forecasts and toassess whether the throughput of the Port of Can Tho could be increased tohandle the predicted cargo over a reasonable time span. The parameters of thestudy were set so as to exclude the effect of any future deepening of the DinhAn Channel at the mouth of the Bassac River and to not include the option ofbuilding extensive new fixed facilities.
The study was carried out by staff from NEDECO and the PMU assisted bysome input from TESI South.
The Present Situation
The Port of Can Tho is at present a port which is performing at a fraction of itscapacity. This appears to be mainly because the port has not managed to breakthe shipping community's long established practice of servicing the MekongDelta through the ports of Ho Chi Minh City. This is partly because manyshippers have established facilities in HCMC but also it is because the true levelof service and facilities at Can Tho have never really been brought to theshippers' attention. The apparent state of dilapidation of parts of the port doesnot help its marketing effort.
The Findings of the Study
The study concluded that the traffic through the Port of Can Tho was likely togrow very quickly to reach approximately 500,000 Tonnes per year by the year2000. The port at present handles only one quarter of this trade but itsthroughput has doubled in the last year.
In reality, the port can handle almost 4 times its 1994 throughput (or twice its1995 traffic) with its present equipment and some adjustments to the shiftpatterns. With the addition of a US$ 1.8 million investment split betweenremedial works to the existing structures, some handling equipment and sometraining, the port should be able to handle its likely cargo throughput up to theyear 2000 or 2001. At that point a further investment of US$ 0.8 million inhandling equipment will be needed. This expenditure leaves the port financiallyviable and it shows economic rates of return in excess of 30%.
Shortly after the year 2000, the port will need additional quay space if it isattracting cargo in line with the projections. At present there are plans to buildtwo other separate international ports within an 8 km radius of the Port of CanTho. If this happens it is extremely unlikely that any of them will be successfulso it is important that a single site is selected for development.

1
1. INTRODUCTION TO THE STUDY
A. Study Organisation
1 .01 The Mekong Delta Master Plan Study, completed in 1993,identified the possibility of developing the Port of Can Tho to become aninternational port carrying a substantial part of the cargo exported from theDelta to other parts of Vietnam and to foreign destinations. The benefits of thiswere seen to be reduction in transport costs, greater wealth generation withinthe Delta and a reduction of pressure on the infrastructure of Ho Chi Minh Cityand its surroundings.
1.02 The study forms part of the Inland Waterways and PortModernisation Project which is funded by a grant from the JapaneseGovernment and administered by the World Bank. The study started inSeptember 1995 and is to be completed in March 1996. The object of thestudy is to define the expenditure which is required to help the Port of Can Thoboost its traffic from the present low levels to a substantial proportion of thegoods entering and leaving the Delta. The planned expenditure will form phase1 of the project with phase 2 being undertaken once the proposed study of theBassac river entrance (the Dinh An channel) has been completed.
1.03 The original Terms of Reference for the appointment ofConsultants for this project were written in terms of the work being carried outby the Project Management Unit of the Southern Waterways (PMU) and theTransport Economic Science Centre in the South (TESI) with the Consultantsproviding technical assistance and advice.
1.04 Following the World Bank visit to Ho Chi Minh City in lateSeptember 1995, the structure of the project was changed such that theproject is to be carried out by the Project Management Unit working with theteam from NEDECO. TESI are to be contracted by the Project Management Unitto carry out specific tasks on the project.
1.05 The main work for the study was under taken by the followingstaff .-
Richard Clarke - Port planner, engineer and operations specialist, NEDECO.Alexander Mueller - Financial and economic analyst, NEDECO.Tran Doan Phi An - Transport Economist, Transport and Economic ScienceCentre in the South (TESI).
Richard Clarke and Alexander Mueller each made two visits to Vietnam underthe project, the first being in September/October 1995 and the second inJanuary/February 1996. The majority of TESI's work was done between thesetwo visits.
1.06 An Inception Report for the study was written in October 1995and it was published as part of the Inland Waterways and Port ModernizationProject Phase 1 Report.

2
B. The Terms of Reference
1.07 The full Terms of Reference (TOR) for the study are set out inAppendix I. Below are summarised the major points from the TOR:-
- Assume that the Dinh An channel remains as at present;- No Major Expansion of Existing Wharves;- Produce traffic Forecasts for years 2000 and 2015;- Survey existing facilities and equipment;- Examine port operations, management practices, accountancy procedures;- Propose improvements to facilities, equipment, operations, management
and training;- Evaluate environmental impact of proposed measures;- Economic evaluation of the proposed measures;- Financial evaluation of the proposed measures.
1.08 Although the Terms of reference were written very much in termsof an engineering study, the situation on the ground turned out to be a portwhich was basically in sound condition but which was under performingbecause it failed to attract cargo. Part of the study resources were thereforeused to investigate why cargo was not using the port and what mechanismdecided the distribution of cargo between the various ports of the southern partof Vietnam.

3
2. THE EXISTING PORT
A. Fixed Facilities
a) General Description
2.01 The port is located approximately 8 km north of the city of CanTho and approximately 3 km south of the Can Tho Export Processing Zone(EPZ). Immediately to the south of the port the land is occupied by a militaryinstallation whilst to the north is an open area used by a local constructioncompany.
2.02 The site is approximately rectangular with an average width parallel tothe road of 200 m and an average depth back from the waterfront of 135 m. Itis basically level with an elevation of approximately 2.8 m above survey datum.(see figure 2.1)
2.03 During his visit, the Port Planner carried out an inspection of theport's fixed facilities and equipment.
2.04 For the fixed facilities, the inspection took the form of a visualinspection recorded as notes and photographs. It included an inspection of theunderside of the jetty from a boat. No materials testing was undertaken.
2.05 The plant and equipment survey took the form of an externalinspection, watching most of the plant in operation and a discussion withmanagement about the problems encountered with each item. The two lorrieshave been rented out to another enterprise and were away from the port onboth visits. The two barges were also away from the port having been rentedout.
2.06 These surveys are sufficient to assess the likely load capacity andlife of the port structures but they would have been much more effective haddrawings of the structures been available. For the plant, they are adequate toassess the useful life and availability of the individual items. On both counts,the port management seemed to take a realistic and practical view.
b) The Main Jetty
2.07 The main quay is a piled platform with a 144 m berthing face anda width of 18 m. It is connected to the shore by four access bridges each 6 mwide. Its surface is at an elevation of 3.0 m above datum. The publishedminimum depth of water alongside is 10.0 m.
2.08 The southern section of the quay, with a frontage of 61 m (200')was built by the US military before liberation. It consists of H section steel pilessupporting in situ cast concrete beams. These in turn support precast concretepanels with in situ infills. At the front of this section of berth there is afendering grillage on the berthing face. This structure consists of a steel grillageof the same section as the bearing piles but it is damaged and has no timberingattached. It is not evident whether the grillage originally had fender rubbersbetween it and the jetty. Apart from this damage and a small area of soffit

fZ71~~
U-)~ ~~
LU.
4 4~~~~~~~~~~~~~~~~~~~~~~~~~~~~~~~~~~~~~~~~~~~~~~~~~~~~~~~~~~~~~~~1
Fiur,.J Lyou CnTh Pr

4
spalling, this area of the quay is in excellent condition and appears to havebeen well built. The port has no drawings or loading data for this part of thequay and they report that no data exists in Vietnam. The study team isattempted to obtain copies of the drawings and loading data from the USmilitary without success. In the absence of any loading criteria, the port takesthe sensible view that this section is stronger than the newer section. Certainlythe construction appears more substantial than the newer part and shows nosign of distress from overloading.
2.09 The northern 83 m of the quay was built in 1980. It uses 350 mmsquare precast concrete piles supporting cast in situ beams. These in turnsupport precast slabs with an in situ topping and infills. There are no fendersapart from irregular bundles of vehicle tyres hung over the berthing edge. Atthe inshore edge of the slab there is a plate which shows a design loading of3.0 T/m. This section of the deck is constructed to very poor standards withconsiderable honeycombing of the concrete and some crude in situ makinggood around the top of the piles. Despite this the structure has suffered littlevisible deterioration. No copies of the construction drawings are held in the portand, at the time of writing, copies had not been located in the Ministry ofTransport. Since the design criteria have not been established, no absoluteview can be taken on the actual strength of the structure. It is understood thatlow concrete strengths have been assumed for the design and it is likely thatthe quay achieves the design strengths.
2.10 In September 1995 a project was started to infill the gaps betweenthe bridges at the back of the quay. These sections are similar in design to thenorthern quay area. The port planner watched the piles being cast and some ofthe early piles being driven. The standards of workmanship were reasonableeven if the cosmetic finish was rather poor. The piles were being driven to aset at a length of approximately 36 m below the finished deck level. The portstaff stated that the thinking behind filling in these gaps was that the narrowdeck and bridges made manoeuvring trucks difficult when loading large ships.They also wanted the ability to stuff and unstuff containers on the back edgeof the jetty. The infill sections have been designed for the same loading as thenorthern section of the jetty. This work is scheduled to be completed in May1996.
2.11 The jetty has a small water supply (75 mm) surface run along thejoint between the two sections. Behind the berth edge upstand this pipe has atee fitting to feed two hose connectors. This arrangement is used to supplywater to the ships although the port did not seem to know the rate at whichwater could be supplied. Otherwise the jetty has no services.
2.12 On the shore, some 23 m back from the jetty there are five lightpoles approximately 10 m high. Each pole carries two or three fittings severalof which have no bulb. It is understood that for night working the port relies onthe ship providing lighting.

5
c) Onshore Facilities
2.13 The two main cargo handling facilities on shore are a bitumensurfaced open storage area approximately 95 m x 60 m and a shed with anarea of 4,500 m2 . There are other areas available in the port but they are notsurfaced or drained.
2.14 The construction of the surfaced open storage area is not knownbut it was used for container handling for a year and appeared to have sufferedlittle damage. The area is drained by shallow perimeter ditches which againappears to work reasonably well. The entry and exit points across these ditchesis not well defined and this aspect needs further investigation and upgrading.
2.1 5 The cargo shed was built in 1982 but it is apparently never used.The metal roof has perforated over some of its area but otherwise the structureappears sound. The floor of the shed is concrete paved but the strength of thepaving is unknown. For modern port use, the doors on the shed are rather smalland would have to be widened if the shed were to be used for the handling ofbulky cargoes.
2.16 There is general area lighting for the perimeter road around theopen storage area. This is just about adequate for security purposes but not forsafe working.
d) Offices
2.17 At the road edge of the port there is a row of buildings which areoffices, workshops, rest rooms and a workers' hostel.
2.18 The largest of the office buildings houses the Port Director's officeand the main meeting room. This is in good condition with good qualityfurnishings and effective air conditioning.
2.19 The other three office buildings are of prefabricated constructionand need new roof sheeting. At present they are kept weather tight by acollection of odd sheets and tarpaulins. This gives this area of the port a ratherrun down appearance. These offices are not air conditioned but they aredesigned with a verandah and hence provide a comfortable workingenvironment.
2.20 Departments housed in these offices are
- Planning and Stevedoring;- Finance and Accounting;- Dock Office;- Material and Technical;- Transportation and General Dockers;- Medical Services.

7
B. Equipment
a) Port Equipment
2.28 Investment in equipment for the port is minimal and appears tohave occurred in a series of discrete packages rather than as a plannedprogramme. The newest items of plant on the port are the forklift trucks whichare 1 0 years old. Despite this, and a general lack of spare parts, most of theequipment is in serviceable condition.
2.29 The port does not appear to keep a definitive list of the equipment itowns but the lists given below are as discussed with the port management.This differs in some respects from the list giving the assets of the port and,since not all the equipment was present in the port during the study team'svisit, it has not been possible to verify which is correct.
b) Floating Craft
2.30 The port owns the following floating plant
Table 2.01 Floating plant - Port of Can Tho
Item Size Condition:Tug 1400 HP American built,scuttled in 1975. Refloated and in
sound but basic condition. A single screw tractor tug.Tug 135 H P Built 1982. Poor condition.
Barge 300 T Built 1982. Not inspected.
Barge 500T Built 1990. Not Inspected.
Floating Crane 15 T approx Age unknown. Reasonable condition.
This list corresponds closely with the port assets list.
c) Cargo HandlinQ Equipment
2.31 The Port owns the following cargo handling equipment
Table 2.02: Cargo handling equipment
Item Size Age . Co<mnents: :
Rubber Tyred Mobile Crane 25 T lift approx More than 20 years Moto-Crane Lorrain. Good Condition.
Rubber Tyred Mobile Crane ZOT lift approx More than 20 years Unknown make. Reasonable condition.
Rubber Tyred Mobile Crane Unknown Unknown Derelict.
2 No fork lift trucks 5 T 10 years Bulgarian made. Moderate condition. No______________ parts available. Substitute parts used.
2 Tractors 50 HP approx 10 years Czech manufacture. Moderate condition.
4 Trailers 20 T capacity Unknown 2 Usable but poor condition.2 Derelict
2 Lorries 30 T approx Unknown Russian Mars type.Not inspected.
The port asset list shows a further two lorries but these were not present atthe port during the study.

8
2.32 In addition to these items of equipment, the port owns a range ofcargo slings, nets and three grabs of approximately 1.5 m3 each. The conditionof the nets and slings is very variable. Two of the grabs are in moderatecondition and a third is in the process of being rebuilt.
d) Other Equipment
2.33 Besides the cargo handling equipment listed above, the port ownstwo cars, one van and one 12 seat minibus. All appear in good condition andare reported to cover quite small annual milages.
2.34 In addition to the usual tables, chairs and desks, the officeequipment consists of the following:-
Table 2.03: Other Equipment
tenm Age Comments
Various typewriters Unknown Used mostly by the traffic department and forcorrespondence.
Various Desk Calculators Less than 5 years
A3 size photocopier New Adequate for general office use
Intel 486 based desk top New Used mainly by the accounts departmentcomputer I_I
Laser printer New As above.
Fax machine New Frequently switched off and hence not available.
2.35 For the present level of operations this sis satisfactory but furtheroffice equipment will be needed to keep up with management functions if theport traffic increases.

9
C. Management
a) The Control of the Port
2.36 The port of Can Tho was until recently controlled by the provincialgovernment. Approximately two years ago the port was designated as aninternational port and control was passed to the Ministry of Transport. Thischange appears to have had little impact on the running of the port with thesame management team being retained.
b) The Management Structure
2.37 The port is managed by the Director assisted by two ViceDirectors. These staff have been in place for a number of years and they appearto have the present operations and manning arrangements. One consequenceof their period in office is that many of the present practices have evolved andare not fully documented. This makes any study such as this slightly difficult asmost information has to be derived from discussions rather than being availablein tabulated form. As an example, the team's requests for an organisation chartwere acknowledged politely but no chart was ever forthcoming. Evidently themanagement knew how responsibilities were divided and saw no need for suchdocumentation.
2.38 Below this upper layer of management, the port is split into thefollowing departments :-
- Planning and Stevedoring (Port Operations);- Finance and Accounting (Finance);- Dock Office (Services to ships);- Material and Technical (Maintenance);- Transportation and General Dockers (Personnel).
As described above, the exact split of responsibility between thesedepartments is poorly defined and any future management training must startwith a review of present roles and a documentation of responsibilities. Adiscussion with the managers indicated that these departments seem to covermost of a port's normal functions with some overlaps. There are however anumber of functions which are not covered :-
- There is no marketing department. At present the port's only promotion ofits capabilities are occasional advertisements in trade and local journals.This clearly shows the port's history as part of a planned economy. Thismust be addressed if the port is to take its share of the traffic in the Delta.
- There is very little financial planning in the port. This is shown by the porthaving the same planned trade in each of the last four years, in none ofwhich years has it achieved anything like the target. Similarly budgets forthe year are set in a purely nominal way with little regard for the definedneeds of the port. The tariffs for the port are set centrally and do notreflect the costs of the port.

10
- The technical department concerns itself purely with the equipment of theport, not even holding any drawings of the port's structures and buildings.If greater use is to be made of the port's facilities, the management musthave a better grasp of how they can be loaded and adapted to suitcustomers' requirements.
2.39 To cover these requirements will need some training of themanagement team and the addition of an experienced port engineer. The realneed is however for the management to be convinced that it is now operatingin a market environment and to be trained to handle the changes and pressureswhich this requires. The introduction of a genuinely performance basedincentive scheme would be very likely to provide most of the motivationneeded.
c) Customer Reactions to Management
2.40 A number of the port's customers were interviewed to find theirviews on the management of the port. All those interviewed commented thatthe port management was helpful, responsive and easy to deal with. Thecomment did however come out that the initiative for changes to operatingpatterns tended to come from the customers rather than the port staff.
D. Manning
a) Permanent Staff
2.41 In addition to the three directors and vice directors, the port isreported to have the following full time employees. No documents verifyingthese numbers have been found.
Table 2.04: Permanent Staff
Depermem Staff Numbers
Planning and Stevedoring 1 manager2 supervisors23 tally clerks
Finance and Accounting 1 manager6 clerks
Dock Office 1 supervisor3 clerks
Materials and Technical 1 manager2 supervisors3 clerks3 technicians6 part time technicians
Transportation 2 supervisors24 operators
At the present traffic levels, it would appear that these staff are generallyunder utilised and that they could deal with at least a doubling of throughput.
1 1
b) Casual Labour
2.42 The labourers working in the port are employed on a casual basisbeing drawn from a pool of about 300 registered workers. They are employedalmost entirely on a piece work basis with no guaranteed minimum payment.On this basis a man could report for work but if it rains all day, he will get nopayment. On average the labourers work in the port for approximately 1 2 daysper month, most being farmers for the rest of the time. The labourers areresponsible for their own transport to work and most seem to walk or travel bybicycle.
2.43 This system has of casual labour has many advantages for the portbut at present the labour pool is probably too small to handle a higherthroughput or true multi shift working. With the high population density in theDelta, there should be no problem increasing the labour pool so that anincreased throughput can be achieved without disrupting the workers' otheractivities.
c) Skill Levels
2.44 During a few days observation, the work of the port appeared tobe carried out with good personal skills and the loading gangs achieved goodthroughputs for the technology used.
2.45 The checking and monitoring procedures seemed to be wellorganised and worked in a smooth but very labour intensive manner.
2.46 The ability of the maintenance technicians to look after an elderly,if lightly used, collection of equipment is impressive. They are obviously wellpractised at repairing and rebuilding components with whatever materials cometo hand. With new plant, these technicians may well have to learn some newskills and the introduction of proper lighting and reefer power supplies willrequire the port to take on a full time electrician.
2.47 The finance department seemed to produce rather erratic figuresbut it is difficult to tell whether this was a function of the individuals or thesystems in use. The introduction of a new accounting system this year shouldaddress this issue.
2.48 As described above, the main skill deficiencies can be identified asbeing in the areas of marketing, operations planning and budgeting. These areall functions carried out at a senior level in the organisation and it is at managerlevel and above that the training effort should be concentrated.

12
E. Access to the Port
a) Access by Road
2.49 The port is situated adjacent to the main road north-west out ofCan Tho and this is able to handle considerable volumes of traffic. Like allmajor roads in the Delta it suffers from the many bridges having very poortransitions and not being able to carry trucks above 1 8 or 25 Tonnes. Thismakes it impossible to carry full 40' containers more than a few kilometresfrom the port. There is a programme of upgrading bridges but this will takemany years to complete.
2.50 The proposed bridge across the Bassac River just downstream ofthe port will make it much easier to bring cargo from the east and north butother trunk road improvements will also make it more attractive to take thiscargo to Ho Chi Minh City.
2.51 The immediate entrance into the port is rather sharp with very littlerun off area from the main road. This is readily corrected by small changes tothe layout and safety would be greatly improved.
b) Access by Barae
2.52 At present, more than half the port's cargo arrives by barge orcountry boat. This is a very efficient form of transport and is encouraged byCan Tho's position at the centre of the Delta waterways system. Inlandwaterways access to Can Tho will be improved by the upgrading of thewaterways proposed elsewhere in this study.
2.53 One problem with the present fleet of inland waterways craftwhich serve Can Tho is the layout of the typical wooden country boat. Thiscraft has developed around loading and discharge by manual labour andgenerally the hatches are.too small to allow the use of full sized cargo nets andslings when handling bagged cargo. As more of the rice mills developmechanised loading docks, the country boats will be adapted to have largerhatches. Also with time, it is likely that there will be more steel built barges inthe fleet and these are likely to have modern hatch arrangements.
c) Shivoina Access
2.54 The published information about Can Tho shows it to be accessibleto ships of 3,000 DWT at all states of tide and 5,000 DWT at high tide. Thesefigures have led to the perception that Can Tho is a small port only suitable forcoastal trades.
2.55 In fact these published figures are highly misleading since accessto the port is fixed by the water depths available in the Dinh An channel at themouth of the Bassac River. The charting of this channel is not good withinsufficient soundings being available to determine the true water depthsavailable at different seasons. There is a planned study of the regime of theBassac entrance and this is very important for the future of the port.

1 3
2.56 It would appear from the available information that there issufficient depth in the entrance to allow ships with a draft of 7.0 m to transitthe channel and it is known that vessels of up to 7.5 m have used the river.Given the tidal range of 3.0 - 3.5 m, this would equate to full tide access forvessels of up to 4.0 m draft. Appendix II gives details of typical general cargoand container ships in this size range.
2.57 These shipping lists clearly show that there are many vessels of upto 7,000 DWT able to access the Dinh Ahn channel and that careful choice ofship gives up to 1 2,000 DWT. These figures assume that the vessel is laden tofull draft but often cargo densities leave a ship at less than her maximum drafteven when fully laden. A recent example of this was the call at Can Tho by an11,000 DWT ship which left with 8,000 T of cargo at a draft of 7.2 m.
2.58 If the ability to take ships of up to 7.5 m draft were more widelypublicised, it would make the port much more attractive to shippers evenwithout the planned deepening of the Dinh An channel.
2.59 The Port of Can Tho has a minimum alongside depth of 10 m sothe capacity of the quay is not a constraint on ship size.

14
3. PORT TRAFFIC
A. Historical Traffic
a) Overall Traffic Handled
3.01 The traffic through the port of Can Tho has varied widely over thelast few years. Full historical cargo data for the years 1 990-94 and preliminarydata for 1995 were obtained from the port and have been analysed.
3.02 The statistics kept are reasonably comprehensive for the size ofport but they suffer somewhat from the headings changing year to year. It hastherefore been found necessary to modify the cargo groups in order to give aconsistent picture of the cargo passing through the port. Table 3.01 shows themodified version of the same table.
Table 3.01: Can Tho Port Cargo Throughputs (Tl
Year 1990 1991 1992 1993 1994 1995
Cargo Total 92,689 105.827 59,419 53,903 65,870 123,277
Exports 43,758 46,101 30,570 9,710 44,106 98.774
Rice, food, Agri products 33,253 20,683 10,889 9,107 26,081 98,774
Seafood 7,992
Wood 19,406 603 10.032
Miscellaneous 10,505 25,418 275
Imports 43,818 55,034 6,210 28,533 13,607 8.201
Construction Materials 7,937 3,261 6,300 8,685 2,756
Fertiliser 15,507 15,555 5,501 20,807
Flour, sugar 11,921 28.233 203
Miscellaneous 8.453 7,985 506 1,426 4,922 5,445
Domestic Cargo 5,113 4,692 22.639 15,660 8,158 16.302
Fertiliser 979 721 726 399
Cement 2,498 2,603 17,107 13,385 15,392
Food 1,080 1,412 693 1,513 5,527
Wood 298 589
Coal 163 450 910
Agricultural Products 1,193
Miscellaneous 556 216 4,118 36
Ship Calls 137 68 64 63 94 86
Foreign 50 42 22 21 59
Vietnamese 57 23 36 39 29 86
Barges 30 3 6 3 6
Working Days 257 203 217 181 169 ?
Weather Delays 16 12 18 8 18 ?
Holidays 10 10 10 12 12 7
No Ship 82 140 121 164 166 ?
3.03 Domestic cargo in the above tables is defined as being importcargo from within Vietnam. This may have arrived by sea from northernVietnam or it may have arrived by barge from a more local source.

1 5
These changes in throughput are demonstrated below.
Can Tho Port Cargo Throughputs
140,000123,27
120,000- 105, 827
10, 000- 92,89
s0,0000 9 65,870
60, 0001 . b4 303
40,00e 111 11
1.990 1991 ±992 1993 1394 1995
Yea
As can be seen, the total throughput of the port has almost doubled between1994 and 1995.
b) Changes in Traffic Patterns
3.04 The cargo traffic using the port has seen quite substantial changesover the last few years. This is not unusual in small ports but the presence ofthe competing Ho Chi Minh ports close by makes the trade through Can Thoparticularly volatile.
3.05 One example of the irregular pattern of trade is the container tradethrough the port. In November 1 993, Maersk started a container servicebetween Can Tho and Singapore. This service was operated by the small(1,210 DWT, 61 TEU) container vessel Marie Riis following a triangular routeSingapore - Vung Tau - Can Tho - Singapore. In the second half of 1994, thisroute was varied to be sometimes direct Singapore - Can Tho - Singapore andsome times calls in Thailand were included. In late November 1994, the largerMekong Harmony (3061 DWT) took over the route but the service wascancelled with one month's notice at the end of 1994. Despite its short periodof operation and slightly irregular scheduling, (intervals varied from 7 to 17days with a 9 day mean) this service attracted regular business from the frozenfood export market, a field which is otherwise not addressed by Can Tho Port.Table 3.02 shows the cargo types and tonnages carried by the service.

16
Table 3.02: Can Tho Port - Container Traffic 1994
Call Vessel Arrival DepartLsre Cargo in Torks Cargo Out Tons
Number Misc Agricultural Reefer Wood Rice
4 Marie Riis 31-Dec 01-Jan 13 11 136
6 Marie Riis 07-Jan 10-Jan 8 90
7 Marie Riis 17-Jan 17-Jan 7 32 402
9 Marie Riis 03-Febi 03-Feb 26 13 241
10 Marie Riis 14-Feb 14-Feb 183
11 Marie Riis 23-Feb 23-Feb 180 158
14 Marie Riis 03-Mar 04-Mar 9 251 310
18 Marie Riis 11-Mar 11-Mar 48 181 149
19 Marie Riis 19-Mar 19-Mar 29 96 159
20 Marie Riis 26-Mar 26-Mar 8 21 335
21 Marie Riis 11-Apr 11-Apr 20 49 343
22 Marie Riis 19-Apr 19-Apr 21 64 196
23 Marie Riis 03-Apr 03-Apr 16 98 101
25 Marie Riis 27-Apr 27-Apr 145 83 252
26 Marie Riis 03-May 03-May 103 59 252
28 Marie Riis 13-May 1 3-May 159 232
29 Marie Riis 20-May 20-May 44 30 162
33 Marie Riis 28-May 29-May 14 8 306
35 Marie Riis 05-Jun 05-Jun 4 25 284
37 Marie Riis 13-Jun 13-Jun 39 156 185
39 Marie RAis 21-Jun 22-Jun 85 242 27
41 Marie Ails 29-Jun 30-Jun 596 23 132
43 Marie Riis 08-Jul 08-Jul 30 1 31
47 Marie Riis 14-Jul 16-Jul 296 86 110
49 Marie Riis 21-Jul 22-Jul 370 126
52 Marie Riis 2 27-Jul 27-Jul 413 86
55 Marie Riis 05-Aug 05-Aug 121 16 93
59 Marie Riis 20-Aug 20-Aug 63 139 377
60 Marie Riis 26-Aug 27-Aug 66 116 67
65 Marie Riis 01-Sep 01-Sep 51 46 56
67 Marie Riis 07-Sep 08-Sep 464 19 17
69 Marie Riis 13-Sep 13-Sep 76 80 99
70 Marie Riis 19-Sep 19-Sep 37 28 116
74 Marie Aiis 25-Sep 25-Sep 13 100 113
75 Marie Riis 03-Oct 03-Oct 46 6 168
77 Marie Riis 11 -Oct 11 -Oct 102 193
78 Marie Riis 19-Oct 19-Oct 132 159 137
82 Marie Riis 27-Oct 27-O0t 73 68 155
83 Marie Riis 05-Nov 05-Nov 7 146 107
84 Marie Riis 14-Nov 1 5-Nov 36 267 265
86 M e k o n g 25-Nov 25-Nov 240 86 279Harmony _
88 Mekong 15-Dec 15-Dec 119 240 238Harmony
Totals 4154 3404 7282 0 101
Averages 106.51 92 182.05 101

1 7
Call Vessel j Arrival Departure Cargo In Tons Cargo Out Tons
Number Misc Agricultural Reefer Wood Rice
N o o f Imports ExportVoyages
full empty full empty
42 358 474E596 255
Average cargo weight per container Imports 11.60
l___________ __________ Exports 18.10
Average box exchange per call Full 22.71
(Total on and off) Empty 17.36 _
3.06 Without a container service from Can Tho it is going to be verydifficult for the port to diversify away from the shipment of bagged agriculturalproducts. The full reasons for the Maersk service closing have not yet beenestablished but the fact that a service has already been seen to fail will make itmuch more difficult for the port to attract a replacement service. It is mostlikely from the figures that the main reason for the closure was simple lack oftrade.
3.07 To establish a new service, a sustained marketing campaign will beneeded and it may be necessary for the port to provide additional facilities insupport of the operation. With the earlier service, virtually all the containerswere taken from the ship's side by trailer and put down in the container yard.there they were emptied and the cargo loaded onto lorries. Outgoing cargoesarrived by lorries and were stuffed in the port. This is a relatively inefficientway to use containers but it is dictated by very few of the end customershaving facilities to handle containers on their own premises. This could beaddressed by the *port operating a container delivery service using selfdischarging container lorries helping to boost traffic. Ideally the port shouldstick to its core business but it may be difficult to persuade an outside operatorto invest in the necessary plant.
3.08 In a similar way, there may be scope for the port to operate a coldstore facility to assist in the groupage of refrigerated cargoes. Alternatively, anexisting cold store operator may be able to provide this service, possibly inconjunction with the container delivery service described above.
3.09 One feature of the earlier service was the very high proportion ofempty containers (43% of imports, 30% of exports) carried. This is quitecommon with small container services and is a result of differing patterns oftrade inbound and outbound. In this case most of the inbound trade ismiscellaneous cargo shipped in plain containers whilst most exports arerefrigerated cargo in reefer containers. Unless there is an increase inconsumption of frozen food in the delta, which is unlikely, there seems no wayof correcting the imbalance for reefer containers. When Can Tho develops as aregional distribution centre, more goods should be shipped in direct bycontainer and hopefully this can be balanced by the development of newindustries exporting manufactured goods.

18
B. Port Traffic in the South of Vietnam
a) The Network of Ports
3.10 At present, together with the development of Saigon port complex,a system of sea and river /sea ports has been developed from the southern areaof the Middle Region to the South Region such as : Cat Lo port (Ba Ria - VungTau), Go Dau port (Dong Nai), My Tho (Tien Giang), Tran Quoc Toan (DongThap), Vinh Thai (Vinh Long), Can Tho port (Can Tho), My Thoi (An Giang),Hon Chong (Kien Giang), Nam Can (Minh Hai). These are small scale ports withthe accessibility for 1,000 - 5,000 DWT ships and the capability of 50 -250,000 T / year. The main reasons for these low trade levels are inability toattract cargo and shallow access channels.
3.11 As shown in National Transport Development Strategy, 3 MaritimeTrade Centers will be developed in the South in near future. They are: HCMCport complex, Thi Vai - Vung Tau port complex and Can Tho port.
1. HCMC port complex:
Though there will be many changes of the cargo flows from Mekong Delta tooutside provinces; a proportion of agricultural products, foodstuff, agriculturalmaterials and some other cargoes will not be trans-shipped to HCMC area.HCMC still takes the key role as the main gateway to the South. HCMC has andominant position of trade, service, industry and socio - economic advantages.It would take at least 20 years and the investment of about 2 billion dollars todevelop a port with equipment to match the HCMC port complex. Hence theHCMC port complex will continue to be upgraded, improved and developed inparallel with other ports.
2. Vung Tau - Thi Vai port complex:
At the end of the 20th c.entury, the international deep sea shipping market hasmade may changes, especially in transporting container, bulk cargo, liquidcargo and over-length, over -weight cargoes. With the tendency of using large-size vessels worldwide, there should be deep-water ports with modernequipment to facilitate the cargo handling. The HCMC port complex accesschannel along the Long Tau river has restrictions of width and depth. Therehabilitation of this access channel needs much of investment and effort. As aresult a deep-water port complex will be developed in Vung Tau - Thi Vai areafor large vessels in case as a more effective option.
Functions of Vung Tau - Thi Vai deep-water port complex:
- Handling bulk cargo : bauxite and alumina.- Specialized berth for oil exploitation in the South.- Specialized berth for paper materials from eucalyptus wood.- Specialized berth for Go Dau industrial park, Long Thanh phosphate
fertilizer factory.- Trans-shipment berth for cargo and raw materials from other provinces for
export.- Berth for International Maritime Services.

1 9
3. Can Tho port:
The Mekong Delta Master Plan indicated that Can Tho will become a majorcentre in the economy of Mekong Delta. Can Tho port will be a major port forhandling bulk, bagged cargoes and container in Mekong Delta. Once theimprovement ot the Dinh An access channel is completed and the Bassac riverbecomes the major navigation route, Can Tho port should be upgraded tobecome the trans-shipment port for Saigon, Vung Tau ports and internationalports such as Singapore and Hong Kong. It will also be the port for transferringcargo between the Mekong Delta and Cambodia. Can Tho port will be thegateway for cargo transport to the 5 provinces in the southern area of Bassacriver (An Giang, Can Tho, Soc Trang, Minh Hai, Kien Giang) and a part of theprovinces: Vinh Long, Tra Vinh, Dong Thap. At present, cargo from the Northand foreign countries transported to these provinces must be transferredthrough the ports in HCMC. The upgrading of Can Tho port will share the hugevolume of cargo at these ports, and concurrently push up the production, thusmaking an important contribution to the economy of the above provinces andchanging Can Tho into a trade center of domestic and internationalsignificance.
3.12 The access channels:
1. Saigon - Vung Tau access channel:
The present Saigon - Vung Tau access channel runs along Nga Bay river,reaches to Long Tau, Nha Be rivers and goes into Saigon river. The bed riverhas the width of 800 m at some widest places and about 200 m at thenarrowest place. The bed channel elevation is about 8.2 -9.6 m except somehard clay shallow places. There are several bending sections with small bendradii on the channel line that makes difficulties for vessel passage (especially atL'EST point). The 95 km long of the access channel is divided into 7 parts
Part 1: From the beginning to Bai Yen (Ganh Rai)+ Channel width : 200 m+ Smallest channel depth : 9.6 m / OTS
Part 2 : From Bai Yen to Bon Mat river ( Stand N°13)+ Channel width : 400 m+ Smallest channel depth : 10 m / OTS
Part 3: From Bon Mat river to An Thanh point (Stand N°1 5):+ Channel width : 200 m+ Smallest channel depth : 8.2 m /OTS
Part 4 : From an Thanh point to Dong Tranh river (Stand No1 6):+ Channel width : 150 m+ Smallest channel depth : 7.0 m/OTS
Part 5 : From Dong Tranh river to Pha Mi point (light stand No1 8):+ Channel width : 200 m+ Smallest channel depth : 9.6 m/OTS

20
Part 6: From Pha Mi point to Den Do point:-+ Channel width : 200 m+ Smallest channel depth : 8.5 m/OTS
Part 7 : From Den Do point to Saigon port:+ Channel width : 150 m+ Smallest channel depth : 8.5 m/OTS
3.13 To provide the accessibility for large vessels, the Maritime Bureauhas approved the channel improvement project. After being rehabilitated theshoals then have the depth of about - 8.4 m deep. With little dredging workand unchanged natural conditions the channel can provide the accessibility forfully - laden ships of 18,000 DWT at high tide (> + 1.30 m).
3.14 There are 5 segments that have the depth of under - 8.4 m onchannel alignment from Vung Tau to the port:
- Can Gio mouth : about 3.5 km- Dan Xay area : about 1.0 km- Keverlla point area : about 1.5 km- LEst point area : about 3.5 km- The area near red light : about 1.5 km.
3.15 The dredging volume at 11 km of shoals is 1,350,000 m3. Somesections with bending radius R = 1,000 m will be widened with B = 250 m,so that bending radius will be 5,000 m. From 2000 forward, according to thestudy on the changes of current, the L'Est point and bending sections will bestraightened for safe passage of vessels. The volume of dredging and bendingis about 2,000,000 m3 .
3.16 Beside, with urgent requirements to widen the field of action tomeet the demand of international shipping route, the People's Committee ofHCMC has decided to carry out the study on dredging of Soai Rap river toprovide surface for the urbanization and industrial development. Soai Rap riveris the second navigation channel for foreign vessels going in and out of theHCMC port complex. The present depth of Soai Rap river is less than that ofLong Tau river but it is short and straight with the width of 1,000 m.
3.17 The purposes of the dredging of Soai Rap river:
- Forming a new, safe and short navigation channel for foreign ships goinginto / out of the HCMC port complex;
- Taking sand from the shoals, transferring to the lowlands in the south ofHCMC to provide the surface for the construction of the new urban andindustrial areas such as the Hiep Phuoc Industrial Zone;
- Developing a new berth to meet the increasing demand of exporting inHCMC and the Southern region.

21
3.18 The natural resources and environmental condition at the mouth ofSoai Rap river have been surveyed by the Tan Thuan Industrial DevelopmentCompany belonging to the People's Committee of HCMC in association withexperts and specialized agencies such as Professor Tran Kim Thach - Doctor ofGeology, Southern Hydraulics Science Institute (Ministry of Hydraulics) to studythe possibility of developing the channel for large - size vessels. The studyconsists of
- Positioning the channel alignment and planning the dredging of the channelon Soai Rap river, study on the stability of the channel;
- Bending the Nha Be - Long Tau T-junction to improve the navigationcapacity at present natural condition;
- Evaluating the effect and influence of the dredging work on the meteo-hydraulics behaviour of the downstream river network of Dong Nai - Saigonrivers and changes of saline intrusion.
3.19 The feasibility study was due to be completed at the end of 1995.If the technical features and economical effects are feasible, the HCMC portcomplex new access channel will be at the same grade with Thi Vai - Vung Tauaccess channel and it's potential will be beyond the present predictions.
2. Thi Vai access channel:
3.20 The operating access channel of Thi Vai with the length of about40 km including 12 km from channel dividing buoy to the mouth of Cai Mepriver and 28 km from Cai Mep river to Go Dau port is divided as follows
Part 1: From channel dividing buoy to buoy N°5+ Channel width :150 m+ Smallest channel depth :10.5 m / OTS.
Part 2 : From buoy N°5 to buoy N1 5+ Channel width :150 m+ Smallest channel depth : 9.8 m / OTS
From buoy N° 5 to Go Dau port+ Channel width :80 m+ Smallest channel depth : 6.5 m / OTS
VEDAN access channel part : from buoy N020 to VEDAN berth+ Channel length :1,400 m+ Channel width :80 m+ Smallest channel depth : 6.2 m / OTS
3.21 The Thi Vai river system consists of Thi Vai river, Go Gia river andCai Mep river. Thi Vai - Cai Mep river, 40 km long, runs in South - Northdirection almost in parallel to the National road N051. The average depth is 15 -20 m, the deepest place (Thi Vai-Go Gia - Cai Mep junction) is 30 m deep. It'saverage width is 500 -600 m and on Cai Mep river there are some placeshaving a width of 1,000 m. With little volume of dredging the access channelof Thi Vai and Cai Mep river can accommodate 30,000 DWT vessels at hightide.

22
3.22 At present, there is a bending segment with bending radius R =300 m from Ganh Rai bay to Go Dau whose accessibility only for 3,000 DWTvessel; if using tug - boat, the 5,000 DWT vessel can go through. There shouldbe measures of dredging and bending at Go Dau access channel for 10,000DWT vessel passage.
3. Dinh An access channel
3.23 Dredging through the outer bar in 1 981 and again in 1983 failed tosustain improved depths of 4.2 m below chart datum (= Lowest Low Water)and the channel was lost after a few months. However, in July 1991 a channelwith a bottom width of 75 m was dredged to -4.5 m over a 75 km reach on adifferent more northerly alignment, again with the intention of permitting highwater access for ships of 5,000 DWT or more. This dredging was moresuccessful and the latest bathymetric survey in September 1993 shows a leastdepth of 3.5 m below chart datum along the channel and generally channellevels are in excess of 4.0 m. Since the last dredging it is reported that severalvessels with drafts up (equivalent in government tables to fully laden cargoships of 5,000 DWT) have made the passage to Can Tho and in someinstances to Phnom Penh. However, the pilots had to time the crossing of thebars to make entry to the Bassac river on the Higher High Water of SpringTides i.e when water levels were at least 3.0 m above chart datum.
3.24 The operating access channel to Can Tho port is 110 km long (59miles) including 31 km of Dinh An access channel (from buoy 0 to the stand13) with the channel width of 150 m and the average depth of 3.9 m / OTS.
b) Comparative Shiwoina Costs from Can Tho
3.25 In considering future trade from Can Tho, the most importantsingle factor is the competition between Ho Chi Minh City and Can Tho. Sincethe main Vietnamese shipping industry is based in HCMC, and has all itsstorage facilities there, the natural tendency is to ship through that port. Only ifCan Tho shows a significant voyage cost advantage will it gain a significantmarket share. Set out below are the significant shipping cost differencesbetween Can Tho and HCMC.
1. Current transport costs for different categories of cargo HCM City toCantho and vice-versa ( rice, fertilizer, container, general cargo, refrigeratedcargo).Transport costs:By waterways
Rice 3.60 USD/TFertilizer 4.10 USDITContainer 3.64 USD/T
By road:General cargo 7.60 USD/TRefrigerated cargo 29.10 USD/T
The above are the bare freight costs between the two centres. It isunderstood from shippers that there are other costs associated withshipping delays which push the total costs above US$ 6 per Tonne.

23
2. Storage charges for the above mentioned cargoes in Saigon and CanthoPorts are based on the same port dues issued by the State Committee ofPricing.
3. The differences between port charges in Cantho port and those in Saigonport are caused by the following reasons:
- The length of access channelAccess channel of Saigon port 51 miles.Access channel of Cantho port 59 miles.
- Pilotage dues:Saigon port: 0.003 USD / GRT. mile.Cantho port: 0.0038 USD / GRT. mile.
4. Table 3.03: The current freight for sea transport on domestic routes
Cargo/lSizeofship iSaigon-Maiphong Cantho4iaiphgng.
Rilce O100000
5000 115,000 125,000
10000
15000
Ger eral 3000
5000 135,000 145,000
10000
15000
Ge~neral 30~00~
5000 135,000 145,000
10000
15000
The Vietnamese government sets these internal transport rates such that thenormal economies of scale in shipping do not operate on this route. Theconsistent freight differential of VND 10,000 per Tonne (US$ 0.91/T) is easilyexceeded by the transport costs to get goods to HCMC. While this tariffpersists, there is a US$ 2.60 per Tonne saving by shipping goods for the Norththrough Can Tho.
5. International shipping costs.
The following are comparative to various representative internationaldestinations

24
Table 3.04 International shipping costs from South Vietnam
Destination Distance Ship Size Speed Alongside Time Shipping Cost per T
[Nautical Miles] IDWTI [Knots] [Days] [US$1
Manila 907 3,000 11 4 8.09
5,000 12 4 5.82
10,000 14 6 4.11
15,000 16 8 3.31
Jakarta 1,032 3,000 11 4 8.68
5,000 12 4 6.24
10,000 14 6 4.33
15,000 16 8 3.44
Dubai 4,076 3,000 11 4 23.29
5,000 12 4 16.39
10,000 14 6 9.68
15,000 16 8 6.66
Rotterdam 8,934 3,000 11 4 46.60
I ____________ ______________X 5,000 12 4 32.58
10,000 14 6 18.21
15,000 16 8 11.81
Los Angeles 7,190 3,000 11 4 38.23
5,000 12 4 26.77
10,000 14 6 15.15
15,000 16 8 9.96
Miami 11,061 3,000 11 4 56.80
5,000 12 4 39.67
10,000 14 6 21.94
.___ __ _ 15,000 16 8 14.06
From the above it can be seen that, even if Can Tho is restricted to 5,000 DWTships, there is a clear cost saving for all shipping to South East Asia. Shipmentsto the Arabian Gulf region only become viable if the extra costs through HCMCexceed US$ 6 per Tonne or if 10,000 DWT ships can be used.

25
C. Present Cargo Trends
3.26 Evaluation on production and consumption capacity of the majorcommodities in the attractive areas
The southern area of the Bassac river has an area of 23,51 2km2, i.e 54.42% ofthe total area of the Delta. In 1994, the Mekong Delta provided about 12million tons of paddy, i.e 50% of the total national output, in which 6 milliontons came from the southern area of the Bassac river. This is where 8.1 millionpeople settle, that is 51.12% of the whole Mekong Delta population. Theproducts by whom play an important role in export, especially rice andprocessed aquatic products export. This has been shown through the followingstatistical data:
Table 3.05: Gross output of food (paddy equivalent) by provinces (1,000 T)
ID11 i::0$070 0 i;Region 1.990 J 1991 11992 1993 1 994
WHOLE COUNTRY 21,488. 21,989.5 24,214.6 25,501.7 26,198.5
A NORTH 8,448.4 7,834.6 9,701.2 10,797.8 9,882.8
1 North mountain and midland 2,349.6 2,367.4 2,832.9 3,162.1 2,955.8
2 Red river delta 4,100.7 3,456.7 4,693.1 5,388.1 4,619.1
3 North central coast 1,998.1 2,010.5 2,175.2 2,247.6 2,307.9
B SOUTH 13,040. 14,154.9 14,513.4 14,703.9 16,315.7
1 South central coast 1,875.6 2,027.3 1,853.9 1,732.2 2,034.3
2 Central Highlands 581.0 606.9 618.6 634.2 664.4
3 North East South 975.7 1,056.7 974.3 1,135.6 1,327.7
4 Mekong river delta 9,607.8 10,464.0 11,066.6 11,201.9 12,289.3
5 Southern region of Bassac river 5,025.6 5,578.6 6,124.6 6,106.3 6,699.6
a An Giang - 1,498.4 1,539.4 1,760.7 1,848.9 1,898.8
b Can Tho 1,112.3 1,215.0 1,371.7 1,237.6 1,481.5
c Soc Trang 629.3 778.2 833.0 701.7 1,002.3
d Kien Giang 879.1 944.3 1,022.1 1,120.0 1,223.9
e Minh Hai 906.5 1,101.7 1,137.1 1,198.1 1,093.1
5/4 (5) 52.31 53.31 55.34 54.51 54.52
3.27 In 1994, the Mekong Delta exported nearly 1.8 million tons of rice,which means it has an enormous potential for agricultural production. Theagricultural products contribution of the southern area of the Bassac river isvery important because its surplus of food (paddy equivalent) is highest incomparison with that of the whole country. The food average output percapita in 1994 was 769.8 kg, i.e 2.14 times and 1.07 times as much as thoseof the whole country and the Mekong Delta respectively.
26
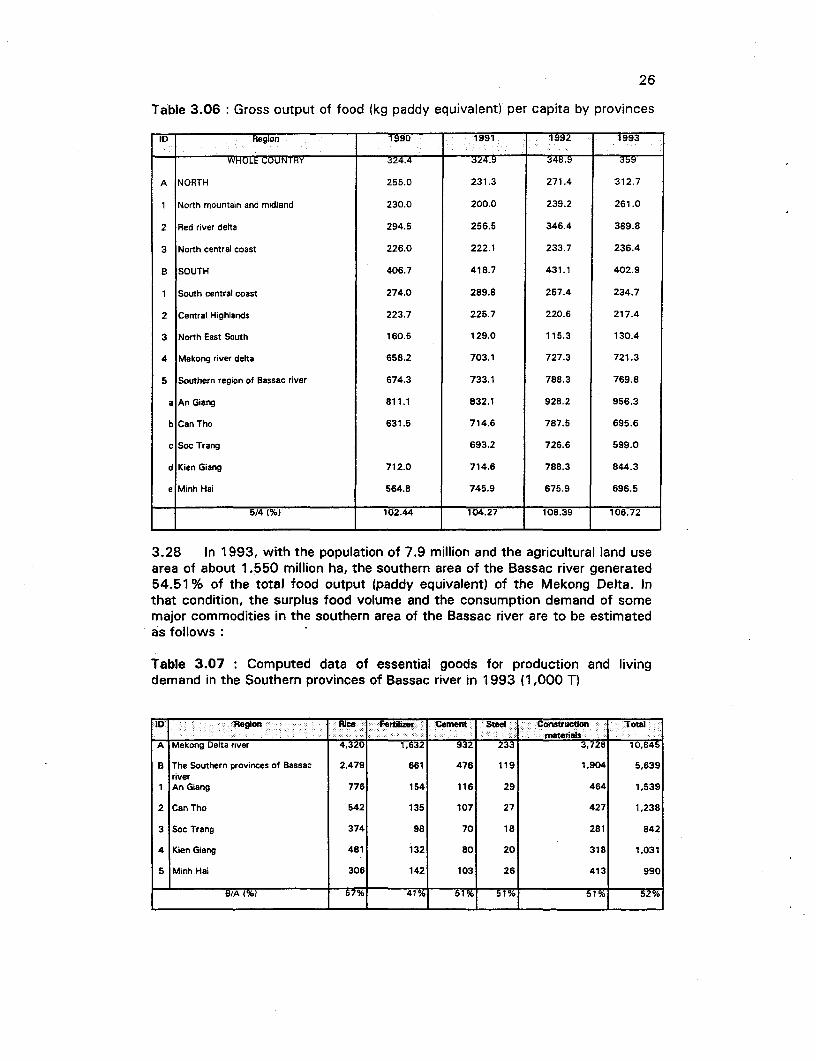
Table 3.06: Gross output of food (kg paddy equivalent) per capita by provinces
ID Region 1990 1991 1992 . 1993
WHOLE COUNTRY 324.4 *245 35
A NORTH 255.0 231.3 271.4 312.7
1 North mountain and midland 230.0 200.0 239.2 261.0
2 Red river detta 294.5 256.5 346.4 389.8
3 North central coast 226.0 222.1 233.7 236.4
B SOUTH 406.7 418.7 431.1 402.9
1 South central coast 274.0 289.8 257.4 234.7
2 Central Highlands 223.7 225.7 220.6 217.4
3 North East South 160.5 129.0 115.3 130.4
4 Mekong river delta 658.2 703.1 727.3 721.3
5 Southern region of Bassac river 674.3 733.1 788.3 769.8
a An Giang 811.1 832.1 928.2 956.3
b Can Tho 631.5 714.6 787.5 695.6
c Soc Trang 693.2 726.6 599.0
d Kien Giang 712.0 714.6 788.3 844.3
e Minh Hai 564.8 745.9 675.9 696.5
| 5/4 102.44 104.27 108.39 106.72
3.28 In 1993, with the population of 7.9 million and the agricultural land usearea of about 1.550 million ha, the southern area of the Bassac river generated54.51 % of the total food output (paddy equivalent) of the Mekong Delta. Inthat condition, the surplus food volume and the consumption demand of somemajor commodities in the southern area of the Bassac river are to be estimatedas follows
Table 3.07: Computed data of essential goods for production and livingdemand in the Southern provinces of Bassac river in 1993 (1,000 T)
ID , Region Uc Fertilizer .Ceivent Sted Constructin Totamateel-ms
A Mekong Delta nver ,632 932 23 ' 3172 5
B The Southern provinces of Bassac 2,479 661 476 119 1,904 5,639river
1 An Giang 776 154 116 29 464 1,539
2 Can Tho 542 135 107 27 427 1,238
3 Soc Trang 374 98 70 18 281 842
4 Kien Giang 481 132 80 20 318 1,031
5 Minh Hai 306 142 103 26 413 990
8/A (°h) 1 41% 5 i Yo 51% 5S2%

27
3.29 Along the southern bank of the Bassac river, there are 2 ports CanTho and My Thoi that can receive ocean ships. Cargo is still handled at theabove mentioned ports but these ports have not been able to attract the cargoflow to achieve their potential and the transport demand of the region. Thereare many reasons leading to such a situation. The main reason results from thesedimentation at the Dinh An mouth which creates obstacles to navigation oflarge sea-going vessels. In many cases this is more a perceived than actualproblem. In addition, the subjective reasons that cause the little attraction ofCantho port to the ship-owners and cargo-owners are:
- The port's infrastructure like quay, storage, warehouse, handling facilities,etc are perceived to be in poor condition.
- The operational management of the port has not caught the marketmechanism.
- The Government's policy has not encouraged the state cargo-owners toimport and export cargo through Cantho port to reduce costs.
- The other services for the importation and exportation at Cantho port arenot synchronous.
3.30 Perhaps because of the above said subjective causes, the exportrice from the Mekong Delta to the ports in South East Asia (accounting forabout 58.38%) is transported mainly through Saigon port. These maritimeroutes do not require large-size ships (up to 10,000 DWT). The following is theoutline statistical data of rice from the South of Vietnam exported to thevarious areas in the world in 1994.
Table 3.08: Export of rice from the South Vietnam, 1994
Totl ii: Africa APera 4Astlia[ i4Eupe SE-Asia NE-Asia Midde- Other
1,212,349.45 (T) 752.50 74,342 18,640 298,984.25 718,172.65 87,665 13,015.75 18,600.30
Density % 10.000611 0.06043 10.01515 0.24304 0.58380 0.07126 0.01058 0.01512
3.31 The consulting data of ships entering and going from Saigon port in1 993 shows that there are 1,788 ships up to 10,000 DWT in the total numberof 2,464; accounting for 72.56%. If almost of these ships transport import andexport cargo from the southern area of Bassac river through Cantho port, andthe Vietnamese importers and exporters endeavour to export and import cargothrough Cantho port, the cargo throughput at Cantho port in recent years willnot the fore-mentioned figures. The following is the number of ships enteringand leaving Saigon port in 1993.
Table 3.09: Number of ships entering and leaving Saigon Port 1993
Sizeofsip Qhuanty i Totalf.DWT .Total IofGRT Rateofshp :RateofDWT
DWT= < 10000 1.788 6,768,499 5,175,009 72.56% 34.31%
DWT> 10000 676 12,958,885 8,701.729 27.44% 65.69%
Total 2,464 19.727,384 13,876,738 100.00% 100.00%

28
3.32 Due to the present limitations of the ports in the Delta, especially CanTho port, the biggest sea port on the Southern bank of the Bassac river, thecirculation of goods between the Mekong Delta and its outside areas has beendone mainly through ports in Ho Chi Minh city.About 85-90% of the totalvolume of the Delta's export cargoes have been handled at the HCMC portcomplex, most of which at Saigon port. Rice produced in the Mekong Delta hasbeen transported to Ho Chi Minh city for export, and fertilizers, steel, machineshave been imported via Ho Chi Minh city for the Mekong Delta.
Table 3.10: Cargo throughputs at Saigon Port (T)
Year 1990 1991 1992 1993 1994
Total 47, f5,003,986 5 5 6,438,577
1. Export 2,085,582 1,625,781 2,495,953 2,359,659 2,551,758
Rubber 5 10707 X867 1,675
Rice 1,345,821 964,069 1,674,339 1,514,698 1,679,989
Agro-products 101.106 102,697 162,786 88,261 78,568
Fruits 38,271 12.624 3,106
Timber 274.127 261,863 143,532 16,967 5,250
Foodstuff 17,579 18.534 3,809
Frozen products 49,291 31,194 16,118 15,546 1,878
General cargoes 138,018 172,261 347,291 498,919 505,979
Others 67,976 51,832 142,105 223,593 280,094
2. Import 1,789,889 1,883,028 1,911,537 2,727,781 3,468,257
Foodstuff 1,77 15761 23T75 1 2,Cement 334.079 88,805 111,048 141,767 328,482
Clinker 34,419 267,196 438,954
Fertilizer 656.702 1,081,477 757.584 460,720 643,051
Machinery 82,435 74,575 16,510 93,818 107,313
Equipment 166,100 82,345 154,434 499,790 360,446
Chemicals 47,923 23,505 46,218 77,464 127,269
Asphalt 219 4,035 20,258 28,488
Cotton 16,174 10.603
Paper 13.450 7.184 8,212 24,314 20,887
General cargoes 215.201 237,401 453.308 723,467 866,506
Others 102,529 91,372 90,864 242,841 323,789
3. Domestic 471,684 650,810 596,496 421,185 418,562
Coal 67,2 47,75 78,17 6,023 3897Fice 244,029 322,439 170,550 86,240 158,415
Cement 59,049 65,063 203,020 125,557 19,431
Clinker 22,878 125.146 2,381
General cargoes 13,268 14,762 17,271 17,678
Fertilizer
Others 78.528 77,219 129.547 123,094 182,060
4. Container
Number of containers 29,101 7, 7874 137,662 7,- Export 13,669 17,376 34,407 68,638 77,305
(Empty) 1,679 4,320 6,548 18,192 19,304
- Import 15,432 20,060 44,338 69,024 80,378
(Empty) 1,438 1,625 4,767 5,404 7,067
In tons 291.619 321,400 863.671 1,426,091 1,628,318
- Export 122,235 143,496 396,253 621,502 687,752
- Import 169,384 177,904 467,418 804,589 940,566

29
D. Forecast of future cargo volumes
a) Socio - economic development orientation in attractive areas
1. General
3.33 The direct attractive area behind Can Tho port includes theWestern provinces such as: An Giang, Kien Giang, Can Tho, Soc Trang, MinhHai and part of the provinces : Vinh Long, Tra Vinh, Dong Thap. Theseprovinces are rich of natural resources and contribute large share of agricultural,forestry, aquaculture products for consuming needs and export to the MekongDelta. Moreover, this is a large consumption market.
3.34 In the coming years and in future, with the development of themarket economy and foreign trade, accordance with the 'open' investmentpolicy having the attraction of domestic and foreign investment, the tradingwith international market will help the regional economy develop.
3.35 The Vietnam socio - economic development strategy to the year of2000 has indicated that agriculture will still play an important role in thenational economy. The provinces in the southern area of Bassac river with thearea of 15,499 km2 of agricultural land(59% of the total agricultural land areain Mekong Delta), potential natural resources are favourable for developing anall-sided tropical agriculture, especially paddy.
3.36 Forest development orientation is protecting forest and growingthe upstream forest, making full use of acid sulphate soils in the South - Westregion to grow new-origin eucalyptus according to the program of exportingpaper material in co - operation with France, Japan and Taiwan.
3.37 The light industry will concentrate on consuming goods, accuratemechanics, electronic assembly, transport mechanics and export agriculturalproducts.
2. Potentiall/rosoect of socio-economic development in Canthocity
3.38 Cantho city has the natural geographical area of 14,100 ha and isdivided into 22 villages and wards. In which, the urban area is 5,530 haconsisting of 15 urban wards.
3.39 The population is now up to 300, 400 inhabitants (female takes52%) with the population density on average being 2,130 inhabitants/km2 . Theethnic groups : Vietnamese 95%, Chinese 4,25, the remainder is of otherraces. The-age-labour force takes 58% of population, working mainly in thestate economic fields : agriculture 33,000 persons.
3.40 Industry 21,400 persons, commerce 25,700 persons,transportation 7,400 persons. Among the remainder, approximately 30,000persons are unemployed.

30
3.41 The labour force quality is that over 5,200 persons are Universitygraduates and post graduates, 5,200 persons of Vocationals, 7,700 skilledmechanics.
3.42 The economic development strategy of the South West hasconfirmed"Cantho city will be enlarged, developed in many fields to becomethe Mekong Delta centre. Here will develop the science, technology researchcentres, the concentrated industrial Zone, the export -processing zone, airports,seaports concurrently with the development needs of the whole region.
3.43 To get ability to develop the Mekong Delta completely as intentionand to get the certain positions, Cantho needs to carry out the strategicfeasible study and urgently calls for investment to speed up the development ofdomestic totals products
- Feasible study of the Hau River Bridge;- Study the development for the Capital town and plan the infrastructure
consisting of: The export processing Tra Noc Airport scape Dinh Anchannel and enlarge Seaport.Have the Plan for Cantho's total surface.
3.44 Having got the decree by the Prime Minister for the approval ofCantho as being the second- type city, the leaders of all fields in Canthoprovince and Cantho city have prepared the developing projects basing on thenew planning. From now on, Cantho will be the centre for economy, culture,science and technology of the Mekong Delta and the projects such as :CanthoProcessing Zone, Tra Noc Airport rehabilitation for the civil transport, upgradingCantho International port to receive the 10,000 DWT container ships will haveconditions to be developed.
3.45 On 28 October 1995, the State Council of Investment ProjectApproval agreed to approve the Master Plan of Socio-Economic Development ofCantho in the period of 1996-2000. According to that 28 Economic Zones willbe established in CanthQ province and its economic structure will be transferredfrom agriculture-industry-service to industry-service-agriculture. To the year2000, the growth rate GNP is planned to reach to 10-11% per year. There are3 main socio-economic zones among 28 of that:
- Tra Noc Export Processing-industry Zone (500 ha) is invested toconcentrate on processed agricultural and aquatic products, garmentindustry, electronic products, and steel. Presently, there are several joint-venture and foreign companies operating and leasing land here;
- The Industrial Zone in southern area of Cantho city (860 ha) : After theconstruction of Cantho bridge is completed, the Cantho port will be builthere for large-size ships, a port industrial area and a system of warehousefor trans-ship cargo will also established. Besides, the construction materialproduction and agricultural and aquatic products processing industry areaalso developed;
- Vi Thanh Zone (150 ha) focuses mainly on agricultural and aquaticproducts processing.

31
Table 3.11: The first priority investment projects of industry and agriculturedevelopment in Cantho
Name of projects Description of projects1. AGRICULTURE TOGETHER WITH PROCESSING
INDUSTRY1. Product, preserve, process , export rice Processing capacity 5 tons /hour, export rice
volume 200,000-300,000 tons /year1. Process frozen-meat for export Building up the raw material section
processing capacity of 10,000 tons /year1. Upgrade the Hau Giang refreshment drink factory Capacity 5 million litres of soft drink, 10
million litres of beer per year1. Plant and process tropical fruit Reorganize the unplanned orchards, process
capacity 100 tons /day1. Process products from coconut Raw oil 100 tons /day1. Animal foodstuff process Capacity 10,000 tons per year1. Plant and process Eucalyptus Capacity of raw wood 300,000 tons /year,
paper powder 50,000 tons /year1. Process Children's nutritious flour Capacity 120 tons /year1. Plant sugar cane and process sugar Capacity 1,000 tons /yearII. MECHANIC INDUSTRY1. Manufacture spare parts for engines Capacity 100,000 products /yearIll. STANDARD CHEMICAL INDUSTRY1 Packing and manufacture inorganic fertilizer Capacity 200.000 tons /yearI. Manufacture veterinary medicine Capacity 100 tons medicine of all kinds1. Manufacture hard PVC hard water pipe Capacity 500 tons PVC hard water pipe per
year
Table 3.12:
IV. UGHT INDUSTRY14. Develop leather sewing for export Capacity 2.5-3 million products per year1, INFORMATIC, ELECTRONIC INDUSTRIES _15. Develop informatic, electronic industries Capacity 10.000 products per year1. SMALL-SCALE HANDICRAFT INDUSTRIES1. Develop small-scale handicraft industries On scale of 50,000 products per yearVIl. AGRICULTURE17. P ant and export banana Building-up every banana mono-cultivated
section, scale 500 ha18. Produce fresh water fish breeds MCapacity 100 million breeds per year
b) Forecasts on the volume of cargoes handled at Can Tho port:
1. Rice
3.46 The Mekong Delta with its rich natural resource base has a highagricultural potential. Today it accounts for 40% of the agricultural productionin the country and produces 50% of its rice. The Delta has the potentiality tokeep its role as surplus producer of rice and at the same time to diversify intohigher value non-rice crops. Recently, agricultural production in the MekongDelta has considerably developed. In the period of 1991-1995, the averagegrowth of food output has increased over 1 million tons annually. According tothe target mentioned in the forecast of Ministry of Agriculture and RuralDevelopment, in the next 5 years, the paddy output of 13 million tons in 1995will be increased to 15.5-16 million tons. Hence, with the average growth rate,in the year 2000 the output of the Mekong Delta will coincide with the outputof 1 6 million tons projected for the year 201 5.

32
3.47 Following FAO estimates, average rice consumption should be ofthe order of 1 58 kg per year on the medium to long-term. This assumes that ofa desirable intake of around 2,200 calories per capita per day, 70-75% is metby rice. The volumes projected for export would probably form sufficientcushion to compensate for drops in domestic supply in poor agricultural year.
Table 3.13: Paddy demand and projections for Mekong Delta.
Udtt 2000 201 !Population min 17.9 23.7Rice consumption per capita kg 1T61PaddV demand for mln t 15 16
- Domestic consumption min t 4.65 5.74- Export min t 4.65 4.98- Provision for other areas min t 3.45 3.68- On-farm losses' min t 1.50 0.80- Seed requirement mln t U.75 0.80
1 Conversion paddy to rice: + domestic consumption 65 %2 On-farm losses: 10% of production in 2000, dropping to 5% in 2010 and
thereafter3 Seed: 5% of production
3.48 The forecasted surpluses of food in the Delta which will betransported to the other regions in Vietnam and exported are given in Table3.14.
Table 3.14 : Forecast of surpluses of rice
Unit Year 2000 Year 2015To South-East areas 1.000 t 1,300 1,400To other regions 1,000 t 900 1,000Export 1,000 t 2,800 3,000Total ,&0i00 0 5,400
Note: Conversion paddy to rice: + domestic consumption 65 %;+ export 60 % -
3.49 There will be 3 proposed major ports for exporting rice in the SouthRegion: Saigon port, Can Tho port, and Thi Vai-Vung Tau port. The possibilityof using these ports for exporting rice depends on their transport line andthroughput capacity.
3.50 Because of the poor accessibility of the channel from the SouthChina Sea, Can Tho port has been accessible only for vessels between 5,000DWT - 10,000 DWT. Hence, Can Tho port has been reserved for cargotransport to the neighbouring countries like : Indonesia, The Philippines,Malaysia .... Cargo transport to Europe, Africa, America requires large - sizevessels. According to the source from Ministry of Trade, The PhilippinesGovernment has intended to import 300,000 T of rice from Vietnam. Thenegotiation procedure has just initiated but this volume of rice is expected to betransported to The Philippines by the beginning of 1996. The volume of rice forexport handled at the ports in the period of 2000 - 2015 is forecasted in Table3.1 5.
33
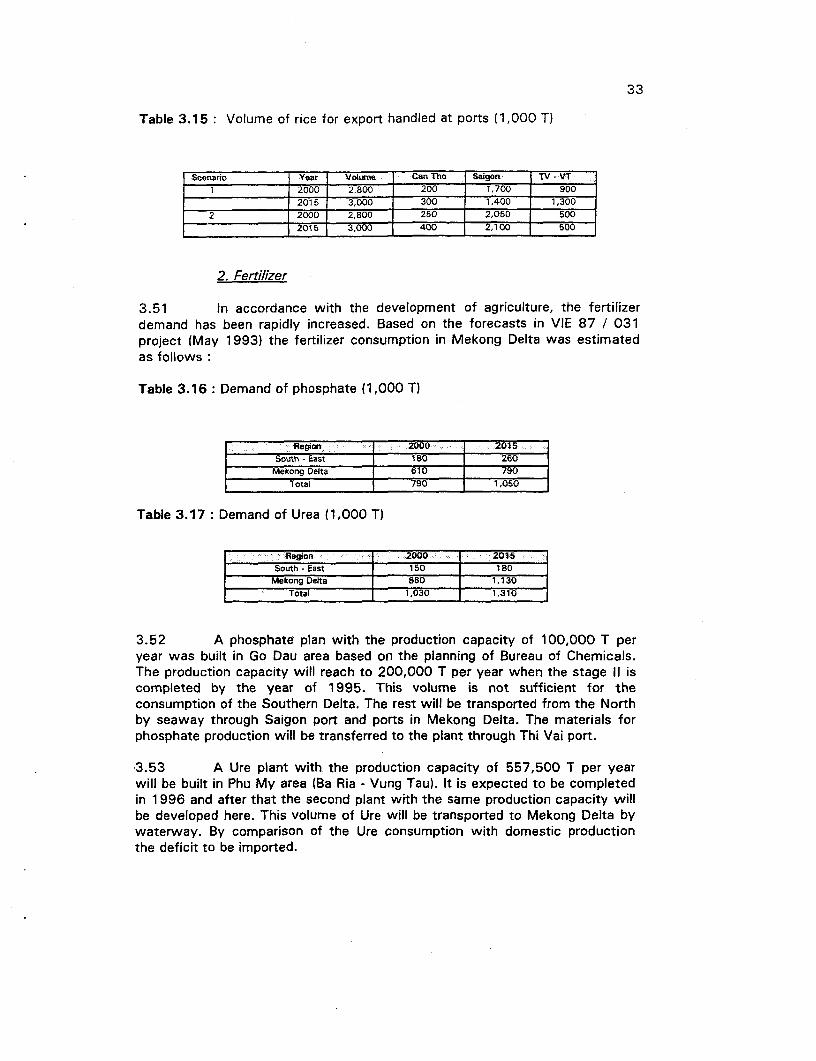
Table 3.15 : Volume of rice for export handled at ports (1,000 T)
Scenario Year Voi Vne: Can Tho Saigont TV - VT1 2000 2,800 200 1,700 900
2015 3,000 300 1,400 1,3002 2000 2,800 250 2,050 500
2015 3,000 400 2,100 500
2. Fertilizer
3.51 In accordance with the development of agriculture, the fertilizerdemand has been rapidly increased. Based on the forecasts in VIE 87 / 031project (May 1993) the fertilizer consumption in Mekong Delta was estimatedas follows:
Table 3.16: Demand of phosphate (1,000 T)
Region 2000 2015South - East 180 260 l
Mekong Delta 610 790Total 790 1,050
Table 3.17: Demand of Urea (1,000 T)
Region 2000 j 2015,South - East j 150 j 180 _
Mekong Delta 880 1,130Total 1,030 1,31
3.52 A phosphate plan with the production capacity of 100,000 T peryear was built in Go Dau area based on the planning of Bureau of Chemicals.The production capacity will reach to 200,000 T per year when the stage 11 iscompleted by the year of 1995. This volume is not sufficient for theconsumption of the Southern Delta. The rest will be transported from the Northby seaway through Saigon port and ports in Mekong Delta. The materials forphosphate production will be transferred to the plant through Thi Vai port.
3.53 A Ure plant with the production capacity of 557,500 T per yearwill be built in Phu My area (Ba Ria - Vung Tau). It is expected to be completedin 1 996 and after that the second plant with the same production capacity willbe developed here. This volume of Ure will be transported to Mekong Delta bywaterway. By comparison of the Ure consumption with domestic productionthe deficit to be imported.

34
3.54 The total volume of Ure that will be imported and transported fromthe North is shown in Table 3.19.
Table 3.19: Total volume of Ure transported to the Southern Delta (1,000 T)
Items 2000 2015Phosphate 590 850
Urea 502 186
DAP fertilizer will be imported in bulk and then bagged into bags of 50 kg eachand transported to Mekong Delta by waterway.
Table 3.20 Scenarios for importing DAP (1,000 T)
Scenrios i 2000 2015Scenario1 1 200 200Scenario 2 400 400
(Source :"Economic Data - Planning of Thi Vai - Vung Tau Deep - water PortComplex)
3. Coal
Coal transported to the South from the North is mainly used forconstruction materials production. In recent years, the amount of coal handledat Saigon port is about 100,OOOT. The volume of coal consumption in theSouth is estimated at 1 50,000 T in 2000 and 250,000 T in 2015.
4. Steel
3.56 Today, construction industry has developed rapidly. In addition tothe large - scale works like :Thac Mo Hydroelectric Plant, Yaly HydroelectricPlant...etc., other civil ones like: hotels, building of offices, residential housingare in need of enormous amount of steel. In the coming years, the steeldemand will be increased with higher speed because of more foreigninvestment.
3.57 The steel consumption in the period of 2000 - 201 5 in the area isestimated as below:
Year of 2000 : 830,000 TYear of 2015 : 1,790,000 T
3.58 According to the dispatch N01495 / VP sent to Ministry ofTransportation by Ministry of Heavy Industry, Vietnam General Company ofSteel will in association with Japan establish a joint - venture steel factory inPhu My area with the capacity of 240,000 T annually. It has received thelicense. The construction will start by the end of 1995 and it will be completedby the year of 2000.
- Imported steel materials (Steel billet): 250,000 - 300,000 T /year- Product (Steel bars) : 200,000 - 240,000 T /year

35
3.59 At present, VICASA Steel Company is capable of producing20,000 T annually. Therefore, in addition to the produced volume, a hugeamount of steel will be imported to the South annually to meet the increasingdemand of steel for construction industry. The estimated volume to beimported annually:
Year of 2000 : 570,000 TYear of 2015 : 1,530,000 T
5. Cement
3.60 Today, though having Ha Tien Cement Plant with the capacity of1,000,000 T /year, cement is still transported to the South from the North bywaterway, road as well as railway because of enormous volume ofconstruction. Due to the limited output of cement plant in the North, there havebeen "cement fever" annually which have badly influenced on the procedure ofexecution.
3.61 Cement consumption is estimated as below:
Year of 2000 : 4,022,000,000 TYear of 2015 : 8,683,040,000 T
3.62 To end the shortage of cement in order to catch with thedevelopment of construction industry in near future, the State Committee ofCo-operation and Investment has licensed Vietnam General Company ofCement in co-operation with Ching Fong Company (Taiwan) to build a cementplant in Trang Kenh (Hai Phong) and a Clinker crushing station in Phu My (BaRia - Vung Tau).
3.63 The Clinker crushing station with the capacity of 600,000 T peryear will import clinker from Trang Kenh and sub - materials from Mui RuaPoozland mine in Long D.at district (Ba Ria - Vung Tau), and export cement inbulk or in bags to the surrounding areas.The Ha Tien Cement Plant has beeninvested to double its capacity.Beside, the volume of cement produced byseveral small factories is considerable.The volume of cement produced in the South is estimated as follows
Year of 2000 : 3,000,000 TYear of 2015 : 4,420,000 T
3.64 Hence, the volume imported from the North and foreign countriesin the period of 2000-2015 will be
Year of 2000 : 1,022,000 TYear of 2015 : 4,263,000 T

36
6. Bitumen
3.65 According to the statistics of the experts from The United Nations,almost 100% of the road system in Vietnam need to be rehabilitated. Beside,the new roads should be established urgently for the new economic centers.Today, Vietnam has to import tar from foreign countries. About 50,000 T ofasphalt has been imported annually to the South particularly, but this volume ofasphalt is only sufficient for maintenance of some sections that was ruinedseverely.
3.66 The rehabilitation and improvement of roads in the South such asHCMC - Vung Tau highway, section from Nha Trang to Can Tho of NationalRoad N01 A, the northern part of Nha Be road ...etc, have been projected. Up tothe year of 1997, all the network of roads in the South must be restored. Tocomplete these projects, the following volume of bitumen will be required:
Year of 2000 :100,000 TYear of 2015 :200,000 T
c. The Historical Predictions of the Cargo Volume Through Cantho Port
3.67 The predictions in the "Technical-Economic Theme of Cantho PortRehabilitation and Extension" from the Company of Waterways Surveying andDesigning I on July 1 st, 1992.
Table 3.21: Cargo throughputs at Cantho port (1,000 T)
item 1995 20001. Export - 271. Rice 200 3002: Agricultural products 10 153. Foodstuff 10 204. Vegetable and fruit 30 505. Timber, paper materials 10 806. General cargo, others 10 20II. Import 205 3051. Fertilizer 150 2002. Cement - 103. Steel, equipment 10 204. Wheat flour 25 355. General cargo, others 20 40Ill. Domestic 105 1551. Rice paddy 50 802. Coal -3. Phosphate, Apatite 10 154. Timber 10 205. Cement 20 206. General cargo, others 15 20
Total 580 945

37
3.68 The predictions in the" Orientation of Planning the Seaports in theMekong Delta" by the Transport Economic Science Centre in the South in July,1995.
Table 3.22 Cargo throughputs at Cantho port (T)
hem 2000 :20101. Export 364,200 688,0001. Rice 217,200 435,8002. Agricultural products 23,000 77,700
+ Soya bean 2,000 11,800+ Duck's feather 400 10,500+ Pepper 200 10,300+ Coconut's pulp 400 10,700+ General cargo, others 20,000 34,400
3. Aqua-products 124,000 342,500+ Frozen shrimp 81,700 248,000+ Dried shrimp 800 1,500+ Fresh aqua-products 41,500 75,000
11. Import 304,000 667,2001. Steel 57,300 275,5002. Fertilizer 194,200 305,4003. General cargo, others 40,000 60,0004. Wheat fluor 9,500 21.0005. Seasoning 1,600 3,7006. Petroleum, oil 1,400 1,600Ill. Domestic 1.131,800 2,244.8001. Pice paddy 514,600 893,7002. Fertilizer 1 54.600 237,0003. Timber, paper materials 108,800 226,9004. Cement 150,000 202,0005. General cargo, others 20,000 40,000
Total 1,800,000 3,800,000
3.69 The prediction in 'The Planning of the sea port system in Vietnamto the year 2010" from the Maritime Projects Construction Consultancy (11-1995) is shown as follows
Table 3.23 Cargo throughputs at Cantho port (1,000 T)
ID ltem ;i : T20: 1 : § 2010 TI rXport so 1,2001 Fice 300 4002 Container 100 3503 Others 200 450I Import 400 1.0501 Fertilizer 150 3502 Container 100 3503 Others 150 350Ill Domestic 100 2501 Coal 7 a2 Food 10 273 Phosphate, Apatite 20 404 Others 63 175
Total 1,000 2,500
3.70 This prediction was considered under the condition where Can Thoport is a multi-purpose port in the Mekong Delta area. The port can handlegeneral cargo and receive container ships up to 10,000 DWT to serve theregional economy. The import and export cargoes transported by large-sizevessels are still trans-shipped in the ports in HCMC and Vung Tau.

38
- Period of 1996-2000: Cantho port will be rehabilitated and upgraded tohave 400 m long of berth for ships up to 10,000 DWT berthing. Then, the portwill have the area of 6.5 ha and the throughput capacity of 1,000,000 tonsannually.
- Period of 2000 - 2010: A new port is to be developed at Cai Sau(downstream to the Cantho bridge) with 400 m long of multi-purpose berth (general cargo and container mainly). This port will be able to accommodate theships of 10,000 DWT. It is proposed to have the area of about 22 ha, and thethroughput capacity of 1.5-1.6 million tons per year.
3.71 Therefore, to the year 2010 the size of Cantho and Cai Sau portarea will be:
+ The berth length 880 m+ The total area 28.5 ha+ Designed capacity 2.5 - 2.6 million tons/year
Comment on the Above Predictions
- The prediction in 3.4.7.1 was made in 1992, 3 years ago, but the volumesof cargo handled at Cantho port at present still do not reach to theprojected volume. However, if this proposed volume is considered andreadjusted to the period of 2000-2005 it will be feasible.
- The prediction 3.4.7.2 was made only in June, 1995, the projected volumeis far from the actual volume of cargo handled at Cantho port. Thedomestic cargo handled at port in this prediction makes up a high rateagainst the total volume. With the little cargo attraction and thedevelopment, it is difficult for Cantho port to handle such a large amount ofcargo. Because Cantho port can only become a commercial port in thesouthern area of the Bassac river, it cannot become a major inlandwaterways trans-shipment port for HCMC port complex.
- The prediction 3.4.7.3 was made in Nov.1995, the volume of cargo in theprediction relatively agrees with the present handling volume at Canthoport. This fact shows the development trend and attraction of Cantho port.Thus, the present space of Cantho port can only be rehabilitated andupgraded to the throughput capacity of about 1,000,000 tons per yearrespectively.
Predictions of the Volume of Cargo Transported Through Cantho Port
3.72 A particularly significant inter-relationship exists between theMekong Delta and Ho Chi Minh city. A considerable proportion of the Delta'sagricultural output is processed in Ho Chi Minh city and a significant part ofDelta related trade and transportation is run out of Ho Chi Minh city. Economicreasoning indicates that this will change in the future. Improved intra-Deltainfrastructural and industrial infrastructure will enable the processing industry tobe close to the production areas, and trade and transportation can be efficientlytaken care of by entrepreneurs located in the Delta.
3.73 The following cargo throughput is forecast under existingconditions of the Bassac river's mouth. The vessels with draft of 7.0-7.5 m(fully-laden) can access at high tide.

Table 3.24: Port of Can Tho - Assumptions for Trade Projections
Trade Loa Scenari Bas Scenario High Scenario
Export l
1. Milled Rice 40% of Tra Noc output through 80% of Tra Noc output through 90% of full Tra Noc output usesCan Tho. Second parboil unit not Can Tho. Full development Can Tho.built. programme is followed. Two new mills use the port.No other new mills use the port. One new mill uses the port. No new facilities built in HCMC.Small shippers do not use the Small shippers volume increasesport. 5% per year.
2. Timber products No timber products shipped 20% of Delta output shipped 500% of Delta output shippedthrough port. through port. through port.
3. Containers No container service from Can Container service carries:- Aquaculture recovers.Tho 95 TEU per week. Minimum viable 120 TEU per week. 65% fulls
service. Say 65% fulls @ 12 T per @ 14 T per TEU= 55,000 T inTEU = 37,000 T in 1998 increasing 1998 increasing to 220,000to 96,000 T in 2015 T in 2015
Imports _
1. Fertiliser Occasional random shipments of Regular planned shipments of Increased level of shipments.5,000 T each. 25,000 T in 2000, fertiliser as Ministry forecast. 175,000 T in 2000, 265,000 T in40,000 T in 2015 125,000 T in 2000, 190,000 T in 2015.
2015.
2. Cement No regular shipments of cement. Can Tho receives 5% of imports Port receives 10% of imports saysay 50,000 T. Increases 7.5% per 100,000 T. Increases toyear. 150,OOOT.
3. Construction No regular shipments. 5,O0OT 10,000 T per year in 2000 rising to 20,000 T per year in 2000 risingmaterials passing trade. 20,000 T in 2015. to 35,000 T in 2015.
I I~~~~~~~~~~~~~~~~~~~~~~~~~~~~~~~~~~~~~~~~~~~~'

Trade Low Scenario . - -Base Scenario: High Scenario
Export l
4. Containers No container service from Can Container service carries:- 120 TEU per week 65% fulls @Tho. 95 TEU per week. Say 65% fulls @ 1 2T per TEU =46,800 T in 1998
12 T per TEU = 37,000 T in 1998 and 187,000 T in 2015and 96,000 in 2015.
Domestic
1.Rice and Paddy 5% of shipments through Can 10% of shipments 20% of shipmentsTho
2. Coal 1,000 T per year 2,000 T per year Coal using industry set up.5,OOOT per year.
3. General Cargo No significant general cargo 5,000 T per year in 2000, 10,000 T per year in 2000,18,000 T in 2015 26,000 T in 2015
.~~~~~~~~~~~~~

41
These set of conditions give rise to the following cargo projections for the port.
Table 3.25 Trade Projections (1,000 T)
Trade Low Scenario Base Scenario HighScenario
2000 2015 2000 2015 2000 2015
Exports
1. Rice 88 88 206 330 233 393
2. Timber Products 10 10 75 25
3. Containers 37 96 55 220
Imports
1. Fertiliser 25 40 125 190 175 265
2. Cement 50 87 100 150
3. Construction Materials 5 5 10 20 20 35
4. Containers 37 96 47 187
Domestic
1. Rice and Paddy 45 50 90 100 180 200
2. Coal 1 1 2 2 5 5
3. General Cargo . 5 10 10 26
Total 164 184 572 936 850 1,506

42
4. CARGO HANDLING
A. Present Practice
a) Historical Measurements
4.01 The port has handled quite a variety of cargoes over the years butthe port cargo statistics are not kept in such a way as to readily allow theanalysis of cargo handling rates. The statistics show the arrival and departuredates of the vessels but they do not describe the numbers of gang hoursworked on the ship. For the 1994 shipments of bagged rice an attempt hasbeen made to tabulate the apparent handling rates and this is presented asTable 4.01.
Table 4.01: Port of can Tho Rice Export Handling Rates 1994 (Tons and Days)
Vess Nam eof Vessel Registration Destination Date of Date of Tons Apparent ModifiedNumber Start Finish Product. Product.
1 Bach Dang 01 Vietnam Vietnam 01-Jan 02-Jan 560 280 560
24 Thang Loi Vietnam Vietnam 22-Apr 25 Apr 2,571 643 857
45 511063 10-Jul 14-Jul 659 132 165
50 Mekong 04 Vietnam China 23-Jul 01 -Aug 1,085 109 121
53 Ha Tinh Vietnam Vietnam 25-Jul 01-Aug 462 58 66
57 Hon Dat Vietnam? Vietnam? 12-Aug 20-Aug 472 52 59
62 1 DongBang 04 Vietnam China 30-Aug 03-Sep 1,320 264 330
63 Bach Dang 01 Vietnam Vietnam 30-Aug 03-Sep 1,193 239 298
64 Universal 04 Paname(HKI Hong Kong 31-Aug 04-Sep 499 100 125
80 Seaprodex Vietnam Vietnam 01-Nov 01-Nov 803 803 803
91 Cuu Long Giang Vietnam Vietnam? 29-Dec 04-Jan 1,087 155 181
________________ ____________ ____________ Total 10,711 _
_______________ ___________ _______ Average 258 324
Overall 291
AverageI
4.02 As can be seen from the above, there is very little consistency inthe cargo handling rates. The management explanation for this, which iscorroborated by the comments of shipping agents, is that very often the cargohandling rate is dictated by the ability of the cargo owner to get the cargo to oraway from the ship's side. This is a direct result of the underdeveloped truckingindustry in the Delta and the slow delivery rates of some country boats.
4.03 Since historical cargo rates do not seem to give a reliable guide,the only other approach is personal observation.

43
b) Observed Handling Rates
4.04 During the period of the Port Planner's first visit, the only cargoactivity was the loading of the cargo ship Chuong Duong with bagged rice fromthe Tra Noc rice mill. This is a large ship with 4 holds. She was being workedwith two shore based mobile cranes addressing the centre holds which werealso being addressed by two ship's derricks loading cargo over the offshoreside from barges and country boats. There were therefore 6 crane hooks beingused to load the ship.
4.05 The two mobile cranes were using cargo nets which were loadedwith 2 tons of rice for each lift. The crane worked with 6 loaders onshore, 5 inthe hold, one checker, 2 banksmen and the crane driver. On average, includingsome truck delays, they achieved an average cycle time of 2.5 minutes giving ahandling rate of 48 tons per hour.
4.06 The ship's derricks were using cargo slings with an average load of1.5 tons. with 5 loaders onshore, 5 in the hold, one checker, 1 banksman andthe crane driver they were achieving a cycle time of 3 minutes. This gives aloading rate of 30 tons per hour. When asked why cargo nets were not usedwith the derricks, the loaders stated that they could not get a full net throughthe hatch of most country boats.
4.07 These handling rates are quite reasonable for this type of operationand would give an overall output of 1700 tons for a full 8 hour shift. This rateis higher than any of the rates calculated from the historical data but it has tobe remembered that this is an exceptionally large ship for Can Tho and normallyit would not be practical to use more than 3 or 4 hooks. The rates do appear toconfirm the port management's statement that they can load between 1000and 1500 tons of rice per day.
4.08 During the second visit, the port was loading a single smaller shipusing three hooks. Very similar rates per gang were being achieved as with thebigger ship indicating that these can be consistently achieved. Interestinglyduring that visit the upstream end of the berth was occupied by a ship waitingfor cargo thus confirming the comments about the supply of cargo to the port.
c) Shift Patterns
4.09 The normal working day in the port is 0700-1 100 and 1300-1700.Short breaks are taken by individual workers during these periods but the workpattern is not interrupted. The two hour break in the work is taken whateverthe conditions and there are reported cases of rain stopping at 1000, workstarting at 1 030 and then stopping again at 1 100 for lunch.
4.10 Although the port advertises that it works 24 hours when required,this is achieved by keeping the day shift at work for two further periods of1900-2300 and 0100-0600. Given the poor lighting and a full day shift behindthem, it is hardly surprising that night shift outputs are reported to be poor.

44
4.11 In order to achieve high productivities, the port must negotiatewith the labour force to do away with the long break at mid-day and to set upthree eight hour shifts each separately manned. This will require a considerableincrease in the present labour pool. The build up of trade will allow newworkers to be introduced steadily, thus avoiding problems of training.
d) Container Handling
4.1 2 It is understood that container handling in the port was achievedby the ships crane lowering the box onto a lorry which then took the box to theopen storage area where it was lifted onto the ground by the port's mobilecranes. Since the road transport industry around Can Tho is not equipped tohandle containers, almost all the containers were unpacked in the port and thecontents transported on by truck.
4.13 For export containers the reverse was done except that full 40'reefer containers had to be handled by both mobile cranes doing a double lift.This is cumbersome and very slow.
4.14 Before a new container service could be started, the wholemethodology of handling containers and the interface between the port and theroad transport industry will have to be reviewed.
4.15 Almost certainly the best handling system for the port is for theship's cranes to lower the boxes onto an increased fleet of lorries andtractor/trailer sets. These would then be handled onto the ground or onto roadtransport by the port's cranes. For speed and safety it is essential that the porthas at least one crane able to lift a full 40' container. This requires a crane ofapproximately 75 T rating. In the interests of speed it would be useful tohandle at least empty 20' containers without using a crane. This could be donewith a forklift tractor rated at about 12 T, this size also being useful forcontainer stuffing operations and work around the shed.
4.1 6 This system is relatively gentle on the port paving but none theless it is likely that much of the present paving will have to be replaced.
B. Improvements
a) General Carao Handlina
4.17 As detailed above, the ship side general cargo handling rates aregenerally good and can only really be improved by the use of pre slingingsystems. Safety could be improved by the provision of new slings and cargonets.
4.18 A significant improvement in overall throughput could be achievedby ensuring that there is a steady flow of cargo to the ships side. This could bepursued in two ways namely the introduction of penalties on the cargo owner ifloading is delayed, and encouraging the use of the port covered storage as abuffer store.

45
b) Container Handlina
4.19 Most of the improvements in container handling are describedabove except that for container stuffing operations, greater us could be madeof the shed as a holding store. It would be very easy to recommend thepurchase of a range of sophisticated equipment for handling containers but thelikely throughput does not justify any departure from the very simple systemdescribed above.
c) General Improvements
4.20 To achieve a reliable high productivity rate, it is essential that theport paving is kept in good repair and well drained. Also to extend the port'sworking day in safety, lighting must be provided on the berth and the stackingarea. The internationally recognised minimum level for port lighting is 20 Luxwhich is easily achieved on this sort of area by the use of sodium lighting onlattice towers. The more sophisticated forms of lighting can only be justifiedwhere space is at a premium and large handling equipment is used.
C. Equipment Requirements
a) Fixed Eauipment - Fenders
4.21 In order to make the port more attractive to shippers and to reducethe likelihood of serious damage to the berth, the quay edge should befendered. This need not be sophisticated as the ships are comparatively smalland in most cases the masters are well used to handling them at close quarterswithout assistance. It is likely that most of the larger vessels using the port willbe concerned with the rice trade and these will generally arrive either empty orpartly loaded. The combination of these factors, plus a wish to avoid movingthe ships too far from the quay edge, indicates the use of a very simplefendering system consisting of cylindrical rubber tubes mounted on chains.These are readily available from a range of manufacturers and competitionkeeps the prices down.
4.22 It has not been possible to determine the exact condition of thefender frame on the older section of berth but detailed engineering may showthat this can be reused with suitable new rubber units and a repaired facing.
It is estimated that this fendering would cost some US$ 44,000.
b) Fixed EauiDment - Lighting
4.23 As described above, the whole of the berth and the stacking arearequires proper lighting. The roads at present have some lighting but it does notappear serviceable.
4.24 The cost to light the whole working area to 20 Lux level isestimated at US$40,000.

46
c) Fixed Eguijoment - Paving and Drainage
4.25 The paving to the main stacking area dates from before 1 975 andis of unknown construction. If containers are to be handled regularly at CanTho, it will be necessary to repave the stacking area. This may well be done instages and it will also allow the provision of proper drainage with a trappingsystem for spilt oil or cargo.
4.26 The cost of a robust paving and drainage system designed to takecontainer loads is estimated at US$ 455,000. This cost includes the provisionfor an oil separator system for surface water drainage and ship wastes, and acontainment area for leaking containers.
d) Building Works
4.27 If it is to be used for cargo storage, the port shed will have to beresheeted and renovated. At the same time, the appearance of the port couldbe greatly enhanced by reroofing the smaller office buildings. This is estimatedto cost US$ 130,000
e) Cranes
4.28 To give reliable service under greater usage, the port will need anadditional mobile crane which should also have the capacity to lift a full 40'container by itself. The investment in new cranage would also be a strongstatement to the port's customers that the management are serious aboutattracting more trade to the port. The crane should be chosen as a fairly simplestandard road going mobile with a minimum of electronic equipment used. Thiswill allow it to be maintained within the skills available to the port. This singlecrane would be followed some two years later by a second unit if the tradegrows as predicted.
4.29 A suitable .75 T rated mobile crane with spare parts costsapproximately US$ 500,000.
f) Other Handling EouiDment
4.30 To keep up high average loading rates, there will have to be greateruse made of storage on the port. This will require the purchase of newtractor/trailer units together with an additional small to medium sized fork lifttractor. 3 No tractors with 4 No trailers will cost approximately US$ 175,000.A new 12 T lift forklift tractor is estimated to cost US$ 91,000.
g) Total Equipment/Upgradina Costs for the First Expansion Phase
4.31 The total cost of equipment and upgrading for the first phase ofthe port development is US$ 1,435,000.
4.32 In order to attract the increased cargo, the port management willrequire training and technical assistance to a total value of US$ 365,000,bringing the total first phase investment to US$ 1.8 million.
47
h) Maintenance costs
4.33 The existing equipment will need very heavy maintenance to keepit working even intermittently with the forecasted throughputs. It is likely thatthe introduction of new equipment will reduce overall maintenance cost.

48
5. BERTH OCCUPANCY
A. The Main Berth
5.01 Because of greater flexibility of working, there will be a tendencyto always use the main alongside berth for as many operations as possible.
5.02 The berth occupancy rates have been modelled using the MMABOpackage. This package uses the handling rates for each commodity and appliesErlang queuing theory to the near random arrival patterns of ships. The packageallows the operator to allocate particular types of ship to specific berths or togive an order of preference for ships using different berths.
5.03 In this case the berths have been labelled as 1 and 2 on thealongside berth and the two offshore buoys have been labelled 3 and 4. Thepackage is set up so that berth 2 can only be used by small ship when anothersmall ship is on berth 1. Container ships are given priority berthing on berth 1and all other cargoes are given preferences which run 1, 3, 4. This is a farmore rigorous analysis than could ever be done manually.
5.04 The package simulates the berth operating for 100 years in eachrun and it averages all these years to produce mean queuing times. Print outsof the results are given in Appendix Ill.
5.05 They analysis shows the waiting times escalating dramaticallywhen the occupancy of berth 1 exceeds approximately 55%. It is notable thatwith the predicted cargo throughput for the year 2000, occupancy of berth 1 isjust over 50%. This clearly shows that additional berth length will be neededvery shortly after that.
5.06 In practice, a good operations manager will be able to get ratherhigher throughputs than the model predicts since he has the flexibility to moveships, a feature which the model does not offer.
B. The Mooring Buoys
5.07 The port has two mid stream mooring buoys which can be used forthe loading of ships from barges or country boats. Since much of the cargoarrives by water anyway, these berths are very useful in this location.
5.08 Although the busiest of the two buoys is only used for some 35%of the time in the year 2000, without these alternative berths, the ultimatecapacity of the port is reduced by nearly 50%. It is therefore important that themoorings are carefully maintained.

49
6. FUTURE DEVELOPMENT
A. Fixed Facilities
6.01 If the cargo grows as predicted, the port will be running at itsmaximum practical throughput by the year 2000 or very shortly afterwards. Atthis stage the port will have no alternative but to invest in more quay. Theshore facilities are adequate for considerably greater volumes of cargo.
6.02 One disturbing factor found during the study was that the Can ThoEPZ has its own plans to build a port just 3 km upstream of the present porteven though the EPZ site was chosen to be close to the port. It was also foundthat the city authorities have plans to build another new port some 8 kmdownstream of the present site. At present Can Tho struggles to support oneport. To divide the port into three sections makes the whole much less efficientand hence less attractive to shipping. Can Tho must decide on a single site forits port before any more fixed facilities are built.
B. Equipment
6.03 Depending on the exact pattern of trade growth, the port is likely toneed further handling equipment just before the year 2000. The main item is afurther mobile crane at a present day cost of US$ 500,000. This will bebacked-up by a further fork lift truck and possibly some more tractors andtrailers. The total cost of this package is approximately US$ 800,000.
C. Environmental Impacts
a) The Imvacts of the Existing Port
6.04 With its present low levels of activity, the port has few impacts onits environment. The impacts can be summarised as follows :-
- Noise - The major source of noise is the ships derricks used for much of thecargo handling. With no centres of population close to the port, the noiselevels observed were not significant.
- Air pollution - The only two significant sources of air pollution in the portare from the exhaust fumes of the ships and handling equipment and fromdust generated during the cargo handling operations. All items of planthave been seen working and ran cleanly with no visible smoke or soot. Ofthe cargoes handled in the port, the great majority are food cargoes whichare generally bagged and generate little pollution. In some years the porthandles small quantities of fertiliser, coal, clinker and bagged cement. Thebulk cargoes are discharged by grab direct to lorries without the use of ahopper system. This will result in considerable dust and spillage. Whilst thespillage is recovered by hand, the dust is difficult to address for the limitedquantities involved. In 1995, two ships discharged a total of 910 T of coal.In 1994, the only bulk cargo was a single shipment of 450 T of coal. Thismeans that over the last 2 years, the port has spent a total of 3 days

50
discharging bulk materials. For this very limited usage, it is not possible toprovide special facilities. If such facilities were required, they wouldincrease the handling costs to the point where the trade would simply leavethe port and be conducted in mid stream or at some uncontrolled river banklocation.
Sewerage - The port's toilets are drained to septic tanks which appear towork since there are no noticeable odours or visible discharges to surfacewatercourses. The ships and barges at the port either use direct dischargeinto the river or some of the more modern craft will use holding tanks forlater discharge at sea. The Bassac River at the berth has a flow speedwhich varies between zero on a dry season flood tide to 1.2 m per secondon a rainy season ebb tide. The maximum likely ship board population atthe port is 40 on ships and the same number again on country boats andbarges. Considering the large water flows and the small waterbornepopulation, this cannot be considered significant, certainly when comparedwith the very large resident populations whose sewerage is frequentlydischarged direct to watercourses. This matter is addressed further in theenvironmental section of the Inland Waterways study.
Surface run off - In the course of port operations there will be somespillage of diesel fuel, lubricants and hydraulic fluid. In periods of rain thiswill find its way into the onshore drainage system. An oil interceptor shouldbe fitted to this system. With the present jetty layout, there is nothing thatcan be done to prevent any spills on the deck draining direct into the river.In all cases the way to prevent pollution is the regular maintenance andinspection of the port's equipment. In addition the management shouldinstitute a programme of inspection of road transport visiting the port witha view to banning vehicles which persistently drop oil diesel fuel. Since theport has full time checkers and supervisors on the quay, the cost of runningsuch inspections would be minimal.
Oily Wastes - At present the port offers no facilities for receiving oilywastes such as bilge or ballast water. Since no tankers use the port, it isunlikely that vessels will discharge oily ballast water. Presumably bilgewater is simply pumped into the river.
Solid Wastes - The port offers ships a solid wastes disposal service in theform of a lorry which will convey waste to the municipal waste dump. It isthe responsibility of the ship to store the waste and to tell the port whenthey want the lorry to come. The port provides labour to carry the wastefrom the ship to the waiting lorry.
Leaking cargo - At present the port has no procedures for dealing withpollution from damaged cargo such as drums of chemicals. Fortunately,very little drum cargo is discharged at the port as most materials such aspesticides and industrial chemicals are shipped through Ho Chi Minh City.
Cargo Storage - At present, no cargo is stored in the port so no hazardscan result.

51
6.05 The port health service function is provided by another governmentdepartment and is not the responsibility of the port. The health checks and anynecessary action, such as de-ratting, are carried out using personnel andequipment brought to the port for the purpose. There are therefore nohazardous chemicals stored in the port for these purposes.
b) Future Impacts of the Port and Mitigation Measures
6.06 The cargo projections for the port show the volumes increasingvery quickly to approximately 572,000 T in the year 2000. Of this volume,some 296,000 T will be bagged rice or paddy with 74,000 T of containerisedcargo. General cargo, timber and coal will continue at similar levels as atpresent but there will be a major new trade in the form of 125,000 T offertiliser. Some of this will be shipped ready bagged but the majority isexpected to be shipped in bulk and bagged at the dockside. The changes inimpacts of this increased cargo are described below along with the relevantmitigation measures:-
- Noise - The introduction of extensive night work will increase the potentialfor noise becoming a problem. This can only be addressed by the cityapplying strict planning controls to prevent any residential development inthe area of the port.
- Air Pollution - The use of more modern plant in the port will help to limitexhaust emissions and tightening international regulations will ensure thatships' engines are maintained properly for minimum emissions. The portwill have to play its part in enforcing these regulations and training for thiswill be included in the proposed package for the port management.
The increased shipment of bulk fertiliser has the potential for greater dustemissions if the material is shipped in a particularly dry state. Normally thematerial is slightly sticky and this limits dust emissions to occasional smalldischarges representing minute percentages of the cargo volumes handled.Fertiliser lost as dust will rapidly find its way into the river but watercontamination from this will be insignificant compared with the weights ofthe same chemicals which will reach the watercourses by wash off fromthe agricultural areas. A very messy discharge and bagging operation mightdeposit 0.2% of the fertiliser in the river. This compares with some 20-50% which will reach the watercourses from agricultural uses.
Sewerage - Although the cargo throughput of the port is set to increasedramatically in the time horizon of the study, the number of ships visitingthe port is still only some 220 per year with a maximum of 3 ships at anyone time. Many of these ships will load and discharge at the mid streambuoys at which it is impractical to do other than use holding tanks or todischarge direct into the river. For ships lying alongside the jetty, even adischarge to shore would have to be fed into a septic tank. In this caseeven a small contamination by oil or other chemicals would disrupt the portsystem. Many of the ships using the port at present do not have pump outfacilities and so would not be able to connect to such a facility. Until theport is connected to mains drainage, it would seem to be the leastdamaging option to allow the ships to continue to discharge their very

52
small sewerage output to the river.
Oily Wastes - As part of the port upgrading, a system should be introducedto allow ships alongside to pump oily bilge water and the like to a holdingtank on shore. From this tank the water can be run off through the port oilinterceptor. The port will have to make arrangements for oil residues to beremoved by road for proper disposal. Ships lying at the buoys will have toretain their oily wastes for disposal elsewhere. Most ships now carry theirown oil separators which greatly reduce the volume of contaminated water.
Cargo Storage - With the higher throughput, it is likely that greater use willbe made of the cargo storage facilities in the port. This will however beshort term storage mainly of bagged cereals. The storage will be either inthe open or in the port warehouse which is well ventilated. This type ofstorage produces a minimal dust risk which is normally addressed just bythe wearing of masks by the operatives. Such storage does not require aspecialist electrical installation. With increased cargo storage, the fire risksin the port will increase and it is important that regular fire drills with thecity fire service are held. Water supplies from the river will be used for firefighting.
Accidental Cargo Spillage - It is not recommended that a small port such asCan Tho handles any cargo which can be considered hazardous. It is notpractical to provide the facilities needed to deal with the broad spectrum ofsuch cargoes. If it is possible to restart the container service to the port itis likely that small quantities of chemicals and other materials will beshipped. The most practical emergency provision for the port to make is tohave a bunded area into which any container leaking liquids or powder canbe placed while the owners are summoned to deal with the problem. Sucha containment area can easily be built if the main hard-standing area is tobe repaved.
Road Traffic - The. increased trade through the port will produce aproportional increase in road traffic in and out of the port. This assumesthat the proportion of trade from the port addressed by water transportremains constant. The port is served by a wide trunk road which runs northof Can Tho to Long Xuyen. This road also serves the EPZ some 3 km fromthe port. Given some small improvements to the port entrance to handlelarger vehicles, this road is able to handle safely far more traffic than theport of Can Tho is ever likely to generate.
53
7. ECONOMIC ANALYSIS
A. Background
7.01 The port of Can Tho is in the interesting position that it competesdirectly with the very much bigger port of the Vung Tau - Ho Chi Minh Citycomplex. It also competes for domestic cargo with numerous small ports andriver side facilities scattered around the Mekong Delta. The only cargo forwhich it holds a unique advantage is transshipment cargo to Cambodia butresearch with shipping companies has shown that the case for this trade is notproven ( see trade forecast section ).
7.02 From an economic analysis point of view, this leaves a very simplecase since it can be shown from present practice that any cargo not handled atCan Tho will divert to Ho Chi Minh City.
B. The With the Project Case
7.03 The cargo projections for the port of Can Tho show a very rapidbuild up of trade to 572,000 Tonnes per year in 2000 (base scenario). At thisthroughput, the port is very busy as this is almost the maximum amount ofcargo which can practically be handled across 144 m of berth and on two midstream buoys. The berth occupancy calculations show that at this cargothroughput, the average vessel waiting time is theoretically 1.6 days. Inpractice the waiting times will be less than this as experience has shown thatan operations manager will always out perform the simple queuing theorymodel. The waiting time average of 1.6 days represents a waiting time toservice time ratio of 0.36. The normally acceptable ratios are in the region of0.2 to 0.4 for this type of port (see Appendix 1).
7.04 In this berth occupancy model, it is assumed that each ship will beaddressed by the maximum practical number of cranes for its hold layout. Thiscan generally be taken as one ship's crane per hold plus one or two additionalcranes either shore based or pontoon mounted. This gives approximately 80%of lifts being carried out by ship's gear, a common pattern in small ports suchas Can Tho.
7.05 The existing cranes are old and although they give good service atpresent they are unlikely to remain reliable under the increased traffic load. It isfor this reason that the main investment is directed towards new cranes. Theother investments in paving, lighting and fendering are also targeted atimproving the reliability of the port operations.
7.06 The investment in the port is phased in two stages being theupgrading of the infrastructure and provision of one crane in 1998 followed bythe provision of a second crane in the year 2000. Under this scenario it hasbeen assumed that the port will be able to handle the full throughput up to theyear 2001. At that stage ship waiting times increase again and it is assumedthat either cargo will divert to Ho Chi Minh City or further expansion of the portwill occur. For this reason the benefits to the port are held at the year 2000level through to the end of the benefit period. This period is taken as 10 years,this being the time to first major maintenance of the cranes.

54
C. The Without the Project Case
7.07 For this case it has been assumed that the existing cranes becomeunreliable in the year 1 998 and that the port is then able to offer one lessoperating crane for each ship. The reduced cargo handling rates for thisscenario are tabulated in table 7.01.
Table 7.01: Handling Rates with Reduced Cranage, base scenario 2000
Cargo Type Ship Type Handling Number of Percentage Annual Number of Number Tonnes Number of
Rate in T gangs per time lost throughput shifts per of hours per day berth daysper ship due to in Tonnes week per shft per yearGang/hour weather
General cargo (T)ExportsExport Rice small 30 1 20 2,000 12 7 288 6.94
Export Rice medium 30 3 20 76,000 12 7 864 87.96
Export Rice large 30 4 20 128,000 12 7 1,152 111.11
Timber, pulp medium 30 3 5 10,000 12 7 1,026 9.75
Agri Prods medium 24 3 5 12 7 821 0.00
ImportsFertilizer medium 30 3 15 125,000 12 7 918 136.17Cement medium 30 3 20 50,000 12 7 864 57.87Steel medium 40 3 5 10,000 12 7 1,368 7.31Wheat flour medium 30 3 20 12 7 864 0.00DomestcPaddy small 25 1 20 30,000 12 7 240 125.00Paddy medium 25 3 20 60,000 12 7 720 83.33
Coal medium 30 3 5 2,000 12 7 1,026 1.95Phosphate medium 30 3 5 12 7 1,026 0.00Timber small 30 3 5 12 7 1,026 0.00Cement medium 30 3 20 12 7 864 0.00
General medium 40 3 5 5,000 12 7 1,368 3.65
Total general cargo (T) 498,000 631.05Containefs (TEU)Export fulls medium 6 2 5 1,374 21 7 239 5.74
Export Reef medium 6 2 5 1,713 21 7 239 7.16
Export Emp medium 6 2 5 1,663 21 7 239 6.95
Import fulls medium 6 2 5 3,037 21 7 239 12.69
Import Reef medium 6 2 5 50 21 7 239 0.21
Import Emp medium 6 2 5 1,663 21 7 239 6.95
Total containers (TEU)/1 9,500 39.68Total containers (7) 74,000Grand total cargo (7M 572,0001/ Box numbers in/out - 7 day service: 95
Vessel capacity: 119
The assumption is made for this scenario that with unreliable shore cranes, thecranage available to the ship is only that which could normally be madeavailable with ship's gear. With reduced cranage, the berth occupancy in theyear 2000 rises to 670 days (see table 7.01) from the "with the project" totalof 460 days (see Appendix 1 first table). In order to keep ship queuing times tothe same as the "with the project" case, approximately 572,000 x (670-460)/670 = 179,000 Tonnes of cargo will be diverted to Ho Chi Minh City.This reduction in cargo will bring the reduced cranage berth occupancy backdown to approximately 460 days.

55
The handling rates are the applied to the berth occupancy model and then thethroughputs are adjusted to give the same waiting times as in the with theproject case.
D. Calculation of Economic Return and Sensitivity
7.08 The economic return calculation for the project expenditure isbased on the scenario that with reduced cranage the tonnage of cargo handledby the port will be that which gives the same waiting time as the projectedtonnages with full cranage. The cargo which is not handled is assumed todivert to Ho Chi Minh City at a cost to the Vietnam economy equal to the costof transporting the goods from Can Tho to HCMC. This cost is taken to be thebasic rice transport cost of US$ 3.60 per Tonne
7.09 In practice, the diverted cargo will be a number of types so thatthe actual average transport cost will be more than the basic rice rate. The useof the rice rate therefore gives a conservative rate of return.
7.10 The investment in the port has been taken in two phases, the firstbeing the infrastructure improvements and the provision of one mobile crane in1 998. The second phase is the provision of a further crane in the year 2000.
7.1 1 The benefits from the investment have been projected forward atthe year 2000 rate and then cut off when the cranes are 10 years old. Thebenefit level is capped at the year 2000 rate as the cargo projections show thatin that year the port reaches its maximum practical capacity in the with theproject case. At that stage the port would sensibly build further quay space,dramatically changing the whole investment pattern in the port. The benefitsare cut off in the year 2008 because at that point the first crane will be 10years old and is likely to be fully depreciated in the port's accounts. In practice,the crane is likely to give good service well beyond that date so cutting off thebenefits in that year is conservative.
7.1 2 The volume of diverted cargo and the resulting benefits are shownin Table 7.02. No additional running costs are included for the new cranessince, if the investment is not made, the port will try to keep the presentcranes running with high maintenance costs.
As described above, the calculated rate of return of 23% is conservative andcan be taken as a minimum under the scenario considered.

56
Table 7.02: Economic Analysis of Can Tho Port Improvements (Base case)
Year Divered Cargo Capital Expenditre Diverted cargo costEnet
[Tonnes] [US$] IUS$3 IUS$S
1998 28,600 1,800,000 102,960 -1,332,040
1999 103,800 373,680 373,680
2000 179,000 800,000 644,400 -155,600
2001 179,000 644,400 644,400
2002 179,000 644,400 644,400
2003 179,000 644,400 644,400
2004 179,000 644,400 644,400
2005 179,000 644,400 644,400
2006 179,000 644,400 644,400
2007 179,000 644,400 644,400
2008 179,000 644,400 644,400
EIRR 23%
E. Economic Analysis of Multiple Ports in Can Tho
7.13 The propsal to build two additional ports in Can Tho wouldcompletely change the framework within which the economic analysis is set.
7.14 Our understanding is that the EPZ port would take all the trafficfrom that area, presumably including the output from Tra Noc rice mill. Th eCityPlanning Committee stated that the new downstream port would be for largeships above 20,000 DWT, assuming that the Bassac mouth can be dredgedthat deep. Removing the EPZ trade would certainly much reduce the existingport traffic. The effect of the downstream port is unpredictable.
7.15 One logical development of having the three ports would be for theexisting port to handle just domestic traffic. This would give base case cargopredictions of 97,000 T in the year 2000 and 112,000 T in 2015. Thesefigures are lower than the present cargo handled and therefore cannot possiblygive an economic return on new investment.
7.16 As discussed, the real answer is that Can Tho must only have oneport. This could be on the present site, downstream or in the EPZ but thepresent patterns of origins and destinations indicates that the existing site isprobably the best of the three.
7.17 Table 7.03 below shows the sensitivity of the above economic rateof return under the World Bank criteria of costs + 20%, benefits less 20% and

57
both of these combined. An alternative approach would be to use the high andlow trade scenarios for the economic analysis. In the low trade scenario, thecargo could be handled with the existing equipment and it would be impossibleto handle the high scenario trade on the existing berths. Since the requiredengineering solutions are different, these scenarios cannot be used forsensitivity analysis.

Table 7.03: Sensitivity Analysis
This table clearly shows that this is a robust investment with a minimum rate of return of 11% under sensitivity analysis.
Cost Increased 20°b B--enefits Reduced 20% Both
Year Diverted Capital Expend Diverted Cargo Increased Capital Cargo Costs Reduced ReducedCargo Increased 20% Cost Costs Benefit Expenditure less 20% benefits Benefits
Tonnes US$ US$ USS US$ USS US$ USS
1998 28,600 2,160,000 102,960 -2,057.040 1,800.000 82,368 -1,717,632 -2,077,632
1999 103,800 373.680 373,680 298,944 298,944 298,944
2000 179,000 960,000 644,400 -315,600 800,000 515,520 -284,480 -444,480
2001 179,000 644,400 644,400 515,520 515,520 515,520
2002 179,000 644,400 644,400 515,520 515,520 515,520
2003 179,000 644,400 644,400 515,520 515,520 515,520
2004 179,000 644,400 644,400 515,520 515,520 515,520
2005 179,000 644_400 644.400 515.520 515.520 515.520
2006 179,000 644,400 644,400 515,520 515,520 515,520
2007 179,000 644,400 644,400 515,520 515,520 515,520
2008 179,000 644.400 644,400 515,520 515,520 515,520
. ______ ________ ___________ EIRR 17% 16% 11%
0t

59
8. THE FINANCIAL FUTURE OF THE PORT
8.01 A Report on the Financial Review of Can Tho Port has beenprepared by Ms Aida Dizon for the World Bank in November 1994, covering theperiod 1989-1993. For this report Profit and Loss (P&L) Statements andBalance Sheets were collected and translated. An attempt was made totabulate the statements and sheets and to analyze them. The providedinformation proved to be inconsistent in many ways. For example, the balanceat the end of some years was found not to be identical to the balance of thebeginning of the next year, balance sheets of some years appeared not to bebalanced, depreciation as shown in the P&L Statements did not reflect properlyin changes of the accumulated depreciation in the balance sheets, thedestination of profits/losses could not be traced, etc. The P&L Statements didnot specify the various sources of income.
8.02 As part of this study the P&L Statement and Balance Sheet for1994 has been collected, and the above mentioned inconsistencies have beendiscussed with the persons in charge. The differences between closing andopening balances were attributed to a revaluation of the fixed assets at the endof 1989 and 1992. A set of corrected Balance Sheets was obtained, solvingthe problem of imbalance. In the accounting system used until 1995 there is nodirect relation of the Balance Sheets and the P&L statements. Depreciations inthe P&L Statements, for example, are not shown as accumulated depreciationsin the Balance Sheets. The financial statements for 1995 where not available infull, but preliminary financial results could be collected, showing a small profitafter tax for that year. The balance sheets and P&L statements for 1989-1 994are presented in Annex 2, Tables 5 and 6.
8.03 Instructions have been received by the Port that from 1 996 a newaccounting system has to be used. The training material which accompaniedthe instructions shows that this new system is more in line with internationallyaccepted accounting principles.
8.04 Can Tho Port uses the same tariffs as Saigon Port for internationaland domestic traffic, promulgated under Decisions No-58 and 60/VGCP-CNTDDV dated 7 November 1994 by the Vietnam Governmental PricingCommittee. Based on these tariffs typical port dues have been calculated forsmall, medium and large general cargo vessels between 750 and 8,000 DWTand for 61, 120 and 260 TEU container vessels, specifying navigationalcharges and dues, berthage-wharfage dues, and charges for cargo handlingservices. The calculations have been made separately for historic and futurecases, since for the future higher loading rates have been assumed. Storagecharges have not been included, since little cargo is stored in the port'swarehouse. The result of these calculations are presented in Appendix 2 Tables1-3.

60
8.05 These tables shows that the historic Port's charges range fromUSD 2.06/DWT for medium size international general cargo vessels to USD2.61/DWT for small international vessels. Future charges range from USD3.42/DWT to USD 3.87/DWT for the same classes of vessels.The historiccharges for container vessels are USD 0.97/DWT, future charges are USD2.02-2.12/DWT. For domestic vessels the historic charges are much lower,with only USD 0.70/DWT, and USD 1.08/DWT for the future. Some of thesecharges are collected by the port on behalf of other organizations like thepilotage Company, the Port Authority and the Tallying Company.
8.06 The present assets of the Port have been listed in Appendix 2,Table 7, along with the age of each asset and the Government Valuation. Thisvaluation has been received and an alternative project valuation has beenproposed, writing off most of the very old equipment and fixed assets, butvalueing the warehouse at a considerably higher rate. For the proposed newinvestments depreciations have been worked out. The project depreciationshave been used in the projection of the Port's income (Appendix 2, Table 4).
8.07 Based on the above mentioned charges for various categories ofvessels and on the historic and projected cargo flows, and the proposedinvestments, an attempt has been made to forecast the Port's income andexpenditure for the period 1995-2005 in 1996 US$. As it is has not yet beendecided on what terms the improvements to the Port will be financed and whatinterest payments by the Port would have to be paid, and as the taxationsystem my change, the forecasted profit is presented 'Before interest and tax',see appendix 2, Table 4. The analysis clearly shows that Can Tho Port couldbecome a financially viable organization, provided the proposed investmentscan be made and the projected cargo can be attracted to the Port.
8.08 An attempt has also been made to prepare projected balance sheets forthe period 31/12/1995-31/12/2005 (see appendix 2 Table 8). The fixed assetsdevelopment follows the project valuation and the proposed investments andassumes a linear depreciation for the remaining lifetime of the assets. Currentassets, short term bank loans and creditors are expected to increaseproportional to the Port's throughput. Long term liabilities consist of theenvisaged World Bank loan. This loan has been converted into constant pricesby assuming a 3% p.a. US $ inflation. The resulting debt to equity ratio willincrease due to the World Bank loan to 2.9 in 2005, the debt ratio will increaseto 0.74 during the same period. The value if these ratios indicate that the Portcan manage these investments without getting into financial difficulties.

61
9. CONCLUSIONS
9.01 The Port of Can Tho is at present a port which is performing at afraction of its capacity. This appears to be mainly because th port has notmanaged to break the shipping community's long established practice ofservicing the Mekong Delta through the ports of Ho Chi Minh City. This ispartly because many shippers have established facilities in HCMC but also it isbecause the true level of service and facilities at Can Tho have never reallybeen brought to the shippers' attention. The apparent state of dilapidation ofparts of the port does not help its marketing effort.
9.02 In reality, the port can handle almost 4 times its 1994 throughput(or twice its 1 995 traffic) with its present equipment and some adjustments tothe shift patterns. With the addition of a US$ 1.8 million investment splitbetween remedial works to the existing structures, some handling equipmentand some training, the port should be able to handle its likely cargo throughputup to the year 2000 or 2001.

APPENDICES

APPENDIX 1
Berth Occupancy calculations

APPENDIX I Introduction
This appendix contains the berth occupancy calculations which form the basis forassessing the capacity of the port of Can Tho and which are used in the economicanalysis.
The calculations use the MMAB0 package developed by Posford Duvivier. This packagetakes the calculated handling rates for the various cargoes in different sizes of ships,applies a user selectable Erlang number to the arrivals pattern of these ships, and allocatesthem to different berths with varying priorities. These scenarios are then run for theequivalent of 100 years simulation of the port to give statistically supportable averages forthe various parameters.
The calculations for the following scenarios are presented although a number of extrascenarios were used in the overall calculations -
* Low Scenario Year 2000 with 1 shift. This reflects the port continuing muchas it is with no real improvements.
* Base Scenario Year 2000 with 2 shifts (3 for containers). This is the centralforecast used in the report.
* High Scenario Tear 2000 with 3 shifts for all cargo. This really shows theultimate throughput of the present port. 3 shift working for all cargoes isgenerally considered to be impractical.
* Base Scenario with Reduced Cranage. This is taken as the scenario if noinvestment in new cranes is made. It forms the basis for the without theproject case in the economic analysis.
Each set of calculations starts with a spreadsheet showing the number of shifts andproductivity for each cargo..For 3 shift working 21 shifts per week are taken whilst for2 shift working only 12 shifts a week are considered. This reflects no routine Sundayworking for general cargo. The occasional Sunday shifts will approximately balance PublicHolidays.
The second table is the input to the simulation. It gives Erlang numbers (K-values) andberth preferences for different cargoes. Berth 1 is the main berth and is the only one whichcan handle containers. Small ships have the option of berth 2 which is part of the mainberth. Berths 3 and 4 are the mid-stream buoys.
The third table gives the full output from the simulation. Most is only of academic interestbut the following are particularly significant for this project
* In the Results table the last block of figures give s the queue lengths,waiting times and occupancy rates for each berth.
* The maximum wait times should be disregarded as these may only happenonce in 100 years.
* The mean waiting times are in days.
* The mean berth occupancy rates (RESOURCE Berth X USE Mean) areexpressed as a proportion of unity (ie 0.51 is 51 % occupancy).

Sheetl
General Cargo Handling Rates at Can ThoBase Scenario Year 2000 12 ShiftsRef ICargoType ShipType Handling |Number of Percentage |Annual jNumber of Number of iTonnes Number of
Rate in T per gangs per time lost throughput shifts per hours per per day berth daysGang/hour ship due to in Tonnes week shift peryear
_ _ I .weather L-
Exports IiI1 IExport Rice ismall 30 2 201 20001 12 71 576F 3.472222221Export Rice Imedium 1 30 4 20 76000 12 71 1152i 65.9722223jExport Rice large 30 6 20 128000 12 7 1728 74.0740744 Timber, pulp medium 30 4 5 10000 12 7 1368 7.30994155 Agn Prods medium 24 4 5 12 7 1094.4 0
Imports I6 Fertilizer Imedium 30 4 15 125000 12 7 1224 102.124187 Cement |medium 30 4 20 50000 12 7 1152 43.4027788ISteel Imedium 40 4 5 10000 12 7, 1824 5.4824561
Wheat flour medium 30 4 20 121_7 1112 7 524
=Local=10 Paddy small 25 2 20 30000 121 71 480 62.511 Paddy I medium 25 4 20 60000 12 71 960 62.512 Coal medium 30 4 5 2000 12 71 1368 1.461988313 Phosphate medium 30 4 5! 12 71 1368 014 Timber small 30 4 51 12 7 13681 015 Cement medium 30 4 201 12 7 1152 016 General medium 40 4 51 5000 12 7 18241 2.7412281
________ ________ 498000 _ 431.04109
IContainers _ _______i__
17 Exportfulls Imedium 1 8 2 5 1374 21 71 319.21 4.304511318 Export Reef medium 8 2. 5 1713 21 7 319.2 5.366541419 Export Emp medium 8 2 5 1663 21 7 319.2 5.209899720 Importfulls medium 8 2 5 3037 21 7 319.2 9.51441121 Import Reef medium 8 2 5 50 21i 7 319.2 0.156641622 Import Emp medium 81 2 5 1663 211 7 319.2 5.2098997
______ ____ 9500 29.761 905Box numbers in/out - 7 day service 95Vessel capacity 118.75 _
Page 1

Page: 1ARGO HROUGHPUT ARCEL SIZE ANDLING RATE K-VALUEBERTH.xport Rice small 2000 500 576 23,4.xport Rice medium 76000 2500 1152 21,3,4xport Rice large 128000 6000 1728 2:1,3,4imber prods 10000 2500 1368 111,3,4.gri products 3000 1095 11,3,4ertilizer 125000 5000: 1224 11,3,4*ement 50000 2000 1152 1i1,3,4teel 10000 3000 1824: 1'1,3,4Iheatflour 4000d 1152 1'1,3,4addy small 30000 1000' 480 1i1,2,3,4addy medium 60000 30001 9601 1,1,3,4oal 2000 1500 1368 111,3,4hosphate 2000: 13681 1|1,3,4imber 1 2000j 1368 111,3,4;ement 2000 1152 1l1,3,4ieneral 5000 4000 1824 111,3,4.ontainers 95001 190 319 2|1

5-02-96 10:25
C:\MMABO3\CANTO4.modiscrete empirical distribution "Cargo Type":
1 1.85%2 14.1093 9.89%4 1.85%5 0.00%6 11.59%7 11.59%8 1.55%9 0.00%
10 13.91%11 9.27%12 0.62%13 0.00%14 0.00%15 0.00%16 0.58%17 23.19%
3PORT after 100 replicationsseed: 4268696
ISTRIBUTIONSitle Type P1 P2 Obs Min Max Mean
cport Rice small Servi GAMMA 2 1 388 0.078 3.993 1.0362cport Rice small Load NORMAL 500 50 389 306.0 628.9 493.82scport Rice medium Serv GAMMA 2 1 3042 0.018 5.677 1.0013(port Rice medium Load NORMAL 2500 250 3043 1484 3351 2498.7,port Rice large Servi GAMMA 2 1 2192 0.017 5.545 1.0074<port Rice large Load NORMAL 6000 600 2194 4034 7920 5961.8imber prods Service Ti GAMMA 1 1 405 0.001 5.769 1.0380imber prods Load NORMAL 2500 250 405 1682 3173 2489.9;ri products Service T GAMMA 1 1 03ri products Load NORMAL 3000 300 02rtilizer Service Time GAMMA 1 1 2483 0.000 7.429 0.9895~rtilizer Load NORMAL 5000 500 2487 3315 6689 5008.6ament Service Time GAMMA 1 1 2569 0.001 8.887 1.01643ment Load NORMAL 2000 200 2570 1306 2677 1998.4:eel Service Time GAMMA' 1 1 333 0.002 9.583 1.0710-eel Load NORMAL 3000 300 332 2237 3925 3026.1ieat flour Service Tim GAMMA 1 1 0ieat flour Load NORMAL 4000 400 0Lddy small Service Tim GAMMA 1 1 2960 0.000 6.989 1.0273iddy small Load NORMAL 1000 100 2960 668.7 1359 1001.1.ddy medium Service Ti GAMMA 1 1 2035 0.000 8.592 1.0106Lddy medium Load NORMAL 3000 300 2035 2013 4115 3006.5,al Service Time GAMMA 1 1 118 0.022 6.531 0.9802al Load NORMAL 1500 150 119 1038 1883 1475.6tosphate Service Time GAMMA 1 1 0losphate Load NORMAL 2000 200 0.mber Service Time GAMMA 1 1 0mber Load NORMAL 2000 200 0ment Service Time GAMMA 1 1 0ment Load NORMAL 2000 200 0neral Service Time GAMMA 1 1 131 0.007 6.661 0.9987.neral Load NORMAL 4000 400 131 3066 5250 3975.9,ntainers Service Time GAMMA 2 1 5037 0.007 5.642 0.9955ntainers Load NORMAL 190 19 5044 120.4 273.4 189.72rivals NEGEXP 0.5990 21709 0.000 14.65 1.6576.rgo Type EMPIRICAL discrete 21709 1 17 8.8213
;SULTStle Obs Min Max Mean +/- Sum
.OCESS Export Rice smal LIFES 388 0.0673 11.223 1.26656 0.125 4.91426OCESS Expor.. t R ce smial ACTIV 877 0 2 0.01368 0.002.OCESS Export Rice medi LIFES 3044 0.0377 37.788 2.66971 0.113 81.2659.OCESS Export Rice medi ACTIV 6187 0 5 0.22602 0.014.OCESS Export Rice larg LIFES 2182 0.0673 34.462 4.10602 0.176 89.5933OCESS Export Rice larg ACTIV 4476 0 5 0.25074 0.016

tOCESS Timber prods LIFESPAN 408 0.0024 21.844 2.39368 0.290 9.76622ZOCESS Timber prods ACTIVE 913 0 2 0.02688 0.004tOCESS Fertilizer LIFESPAN 2487 0.0003 34.967 4.57452 0.214 113.768ZOCESS Fertilizer ACTIVE 5074 0 5 0.31676 0.019'OCESS Cement LIFESPAN 2563 0.0012 34.606 2.32387 0.148 59.5608ZOCESS Cement ACTIVE 5233 0 5 0.16575 0.013.OCESS Steel LIFESPAN 331 0.0039 23.586 2.48133 0.528 8.213201OCESS Steel ACTIVE 763 0 2 0.02286 0.004OCESS Paddy small LIFESPAN 2959 0.0008 24.398 2.22699 0.107 65.8966:OCESS Paddy small ACTIVE 6019 0 4 0.18331 0.010.OCESS Paddy medium LIFESPAN 2030 0.0017 35.998 3.70735 0.223 75.2591'OCESS Paddy medium ACTIVE 4165 0 5 0.20957 0.015.OCESS Coal LIFESPAN 118 0.0234 20.472 1.53202 0.649 1.80778:OCESS Coal ACTIVE 337 0 1 0.00503 0.002OCESS General LIFESPAN 131 0.0177 23.978 2.89335 0.785 3.79029'OCESS General ACTIVE 362 0 2 0.01071 0.003'OCESS Containers LIFESPAN 5037 0.0040 35.018 3.03945 0.196 153.097:OCESS Containers ACTIVE 10181 0 10 0.42741 0.032TEUE Berth 1 LENGTH 17221 0 13 0.55808 0.064JEUE Berth 1 WAITTIME 12428 0 35.521 1.60724 0.175 199.748'SOURCE Berth 1 USE 20273 0 1 0.63567 0.010'SOURCE Berth 2 USE 3453 0 1 0.09844 0.006JEUE Berth 3 LENGTH 5216 0 2 0.00414 0.002JEUE Berth 3 WAITTIME 5059 0 10.963 0.02927 0.011 1.48056'SOURCE Berth 3 USE 10152 0 1 0.37070 0.009'SOURCE Berth 4 USE 5157 0 1 0.19168 0.010
.STRIBUTION OF RESULTStle 5% 10% 25% 50% 75% 90% 95%
…-----------------------------------------------------------------------__----OCESS Export Rice smal LIFES 0.202 0.276 0.491 0.874 1.542 2.489 3.507OCESS Export Rice smal ACTIV 0 0 0 0 0 0 0.OCESS Export Rice medi LIFES 0.257 0.515 1.105 2 3.358 5.257 6.893.OCESS Export Rice medi ACTIV 0 0 0 0 0 1 1OCESS Export Rice larg LIFES 0.516 0.933 1.786 3.192 5.344 7.904 10.62.OCESS Export Rice larg ACTIV 0 0 0 0 0 1 1OCESS Timber prods LIFESPAN 0.132 0.263 0.681 1.458 3.158 5.52 7.813OCESS Timber prods ACTIVE 0 0 0 0 0 0 0OCESS Fertilizer LIFESPAN 0.232 0.464 1.304 3.181 6.293 10.86 13.95OCESS Fertilizer ACTIVE 0 0 0 0 1 1 1OCESS Cement LIFESPAN 0.121 0.243 0.607 1.418 2.970 5.34 7.373OCESS Cement ACTIVE 0 0 0 0 0 1 1OCESS Steel LIFESPAN 0.110 0.221 0.647 1.48 3.108 5.963 8.552OCESS Steel ACTIVE 0 0 0 0 0 0 0OCESS Paddy small LIFESPAN 0.122 0.245 0.651 1.516 3.047 5.043 6.708OCESS Paddy small ACTIVE 0 0 0 0 0 1 1OCESS Paddy medium LIFESPAN 0.190 0.379 0.985 2.375 4.977 8.886 11.8DCESS Paddy medium ACTIVE 0. 0 0 0 0 1 1DCESS Coal LIFESPAN 0.082 0.163 0.408 0.853 1.475 3.174 5.478DCESS Coal ACTIVE 0 0 0 0 0 0 0DCESS General LIFESPAN 0.131 0.262 0.661 1.485 3.563 5.983 10.22DCESS General ACTIVE 0 0 0 0 0 0 0DCESS Containers LIFESPAN 0.121 0.242 0.621 1.512 3.807 7.720 11.42DCESS Containers ACTIVE 0 0 0 0 1 1 2
UE Berth 1 LENGTH 0 0 0 0 1 2 3SUE Berth 1 WAITTIME 0 0 0 0 1.503 5.388 9.0543OURCE Berth 1 USE 0 0 0 1 1 1 13OURCE Berth 2 USE 0 0 0 0 0 0 13 UEBerth3LENGTH 0 0 0 0 0 0 0E Berth 3 WAITTIME 0 0 0 0 0 0 0
,OURCE Berth 3 USE 0 0 0 0 1 1 1,OURCE Berth 4 USE 0 0 0 0 0 1 1

Sheetl
General Cargo Handling Rates at Can Tho I i iHigh Scenario Year 2000 j 2 Shifts ______I
Ref !Cargo Type iShip Type Handling Number of Percentage Annual Number of j Number of ITonnes I Number ofRate in T per gangs per time lost throughput ishifts per hours per per day berth daysGang/hour ship due to in Tonnes week shift peryear
jshiP weather II Exports _ _ _ _
I __ __ ._ _
1 Export Rice Ismall 30. 2 20[ 2000 12 7 576i 3 472222221Export Rice medium 301 4 20' 91000 12 7 11521 78.9930563I Export Rice large 301 6 20 140000 12 7 1728' 81.0185194 Timber, pulp medium 301 4 5 25000 12 7 1368 18.2748545 Agri Prods medium 241 4 5 12 7 1094.4 0
i i~~~~~~~~~~~~~~~~~~~~~~~~~~~~~~~~~~~~~~~~~~~~~~~~~~~~~~~~~~~~~~~~~~~~~~~~~~~~~~~~~~~~~~~~~~~~~~~~~~~~1Imports |
6 Fertilizer imedium 30 4 15 175000 12 7| 1224 142.973867 Cement imedium 30 4 20 100000 12' 7j 1152 86.8055568 Steel Imedium 401 4 5 20000 121 71 1824 10.9649129 Wheat flour medium 30 4 20 121 71 1152 0
ILocal iI
0lPaddy small 251 2 20 60000 12 7j 480 12511 jPaddy medium 251 4 20 120000 12 7j 960 12512 Coal medium 30 4 5 5000j 12 71 1368 3.654970813 Phosphate medium 301 4 5 | 12 7] 1368 014iTimber Ismall 301 4 5 i 12 71 1368 015|Cement |medium 301 4 20 12 7 1 152 016 General medium 401 4 5 10000 12 7 1824 5.4824561
I_______ I 1 T748000 1_1 _1_681.6404
Containers _ ! i ! L1
17 Export fulls mediumr 8] 2 5 1750 21 7 319.2j 5.482456118 Export Reef Imedium I 8i 2 5 2150 21 7 319.2 6.73558919 Export Emp medium t 81 2 5 2100 21 7 319.2 6.578947420 Importfulls medium F 8i 2 5 3850 21 7 319.2 12.06140421 Import Reef medium 8 2 51 50 21 7 319.2 0.156641622 Import Emp medium 8 2 5 2100 21 7 319.2 6.5789474
_________ I }Vessel a aci Y . 12000 37 593985_________ _________ Box numbers in/out - 7 day service 120 _ _ _
t I IVessel capacity - I iP150e
Page 1

Page: 1
ARGO HROUGHPUT ARCEL SIZE ANDLING RATE K-VALUEBERTH
xport Rice small 2000 500 576 23,4
xport Rice medium 91000 2500 1152 21,3,4
xport Rice large 140000 6000 1728 2'1,3,4
mber prods 25000: 2500 1368 11,3,4
gri products 3000 1095i 111,3,4
ertilizer 175000; 5000 1224 11,3,4
ement 100000j 2000 11521 11,3,4
teel 20000 3000 1824 111,3,4
Iheat flour 40001 11521 11,3,4
addy small 600001 1000! 4801 1!1,2,3,4
addy medium 120000 3000. 960' 11,3,4
oal 5000 1500 13681 11,3,4
hosphate 2000 13681 1 1,3,4
imber I 2000 1368 1 1,3,4
ement 2000 1152 1 1,3,4
;eneral 1 00001 4000j 1824i 11,3,4
ontainers 12000 240 319! 21
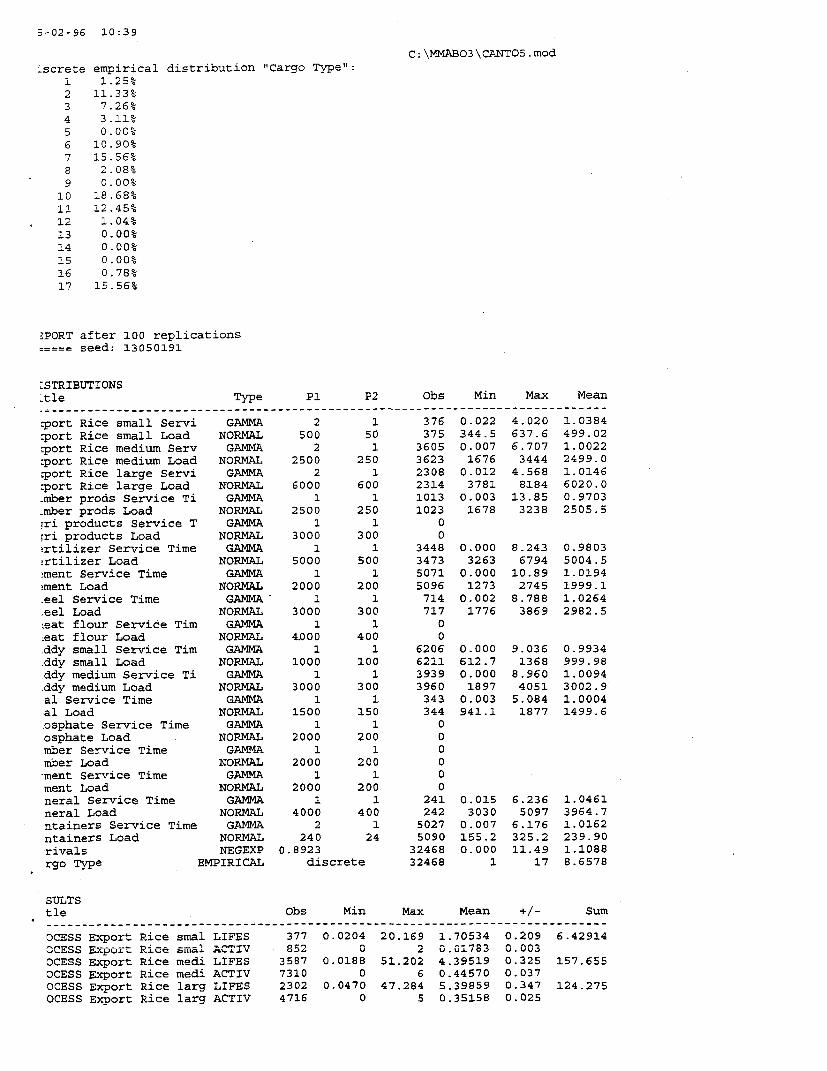
5-02-96 10:39
C:\MMiAI03\CANTO5.modLscrete empirical distribution "Cargo Type":
1 1.25%2 11.33%3 7.26%4 3.11%5 0.00k6 10.90t7 15.56t8 2.08%9 0.00%
10 18.68%11 12.45%12 1.04%13 0.00%14 0.00%15 0.00%16 0.78%17 15.56%
EPORT after 100 replications===== seed: 13050191
;STRIBUTIONS.tle Type P1 P2 Obs Min Max Mean
…----__-__--------------------_----_----__--_-----------------------__-------_
,port Rice small Servi GAMMA 2 1 376 0.022 4.020 1.0384,port Rice small Load NORMAL 500 50 375 344.5 637.6 499.02,port Rice medium Serv GAMMA 2 1 3605 0.007 6.707 1.0022,port Rice medium Load NORMAL 2500 250 3623 1676 3444 2499.0port Rice large Servi GAMMA 2 1 2308 0.012 4.568 1.0146,port Rice large Load NORMAL 6000 600 2314 3781 8184 6020.0-mber prods Service Ti GAMMA 1 1 1013 0.003 13.85 0.9703mber prods Load NORMAL 2500 250 1023 1678 3238 2505.5fri products Service T GAMMA 1 1 0Tri products Load NORMAL 3000 300 0.rtilizer Service Time GAMMA 1 1 3448 0.000 8.243 0.9803!rtilizer Load NORMAL 5000 500 3473 3263 6794 5004.5~ment Service Time GAMMA 1 1 5071 0.000 10.89 1.0194!ment Load NORMAL 2000 200 5096 1273 2745 1999.1.eel Service Time GAMMA 1 1 714 0.002 8.788 1.0264.eel Load NORMAL 3000 300 717 1776 3869 2982.5,eat flour Service Tim GAMMA 1 1 0.eat flour Load NORMAL 4D00 400 0ddy small Service Tim GAMMA 1 1 6206 0.000 9.036 0.9934ddy small Load NORMAL 1000 100 6211 612.7 1368 999.98ddy medium Service Ti GAMMA 1 1 3939 0.000 8.960 1.0094ddy medium Load NORMAL 3000 300 3960 1897 4051 3002.9al Service Time GAMMA 1 1 343 0.003 5.084 1.0004al Load NORMAL 1500 150 344 941.1 1877 1499.6osphate Service Time GAMMA 1 1 0osphate Load NORMAL 2000 200 0mber Service Time GAMMA 1 1 0mber Load NORMAL 2000 200 0-ment Service Time GAMMA 1 1 0ment Load NORMAL 2000 200 0neral Service Time GAMMA 1 1 241 0.015 6.236 1.0461neral Load NORMAL 4000 400 242 3030 5097 3964.7ntainers Service Time GAMMA 2 1 5027 0.007 6.176 1.0162ntainers Load NORMAL 240 24 5090 155.2 325.2 239.90rivals NEGEXP 0.8923 32468 0.000 11.49 1.1088rgo Type EMPIRICAL discrete 32468 1 17 8.6578
SULTStle Obs Min Max Mean +1- Sum----------------------------------------------------------------------- __----
OCESS Export Rice smal LIFES 377 0.0204 20.169 1.70534 0.209 6.42914OCSS Dc-or t sl ACTI' 8S2 0 2 0.01783 0.003OCESS Export Rice medi LIFES 3587 0.0188 51.202 4.39519 0.325 157.655OCESS Export Rice medi ACTIV 7310 0 6 0.44570 0.037OCESS Export Rice larg LIFES 2302 0.0470 47.284 5.39859 0.347 124.275OCESS Export Rice larg ACTIV 4716 0 5 0.35158 0.025

.OCESS Timber prods LIFESPAN 1009 0.0047 38.022 4.12035 0.489 41.5743'OCESS Timber prods ACTIVE 2132 0 3 0.11819 0.016'OCESS Fertilizer LIFESPAN 3445 0.0006 48.674 6.03405 0.342 207.873sOCESS Fertilizer ACTIVE 7018 0 7 0.58910 0.043~OCESS Cement LIFESPAN 5064 0.0008 46.662 3.98431 0.283 201.766.OCESS Cement ACTIVE 10260 0 6 0.57011 0.046OCESS Steel LIFESPAN 715 0.0040 44.515 4.04569 0.600 28.9267.OCESS Steel ACTIVE 1532 0 3 0.08139 0.013OCESS Paddy small LIFESPAN 6206 0.0006 42.117 2.70489 0.130 167.865OCESS Paddy small ACTIVE 12S17 0 6 0.46843 0.025.OCESS Paddy medium LIFESPAN 3927 0.0004 48.310 5.50331 0.328 216.115.OCESS Paddy medium ACTIVE 7987 0 8 0.61158 0.044.OCESS Coal LIFESPAN 343 0.0028 43.389 2.91947 0.684 10.0138OCESS Coal ACTIVE 787 0 3 0.02801 0.005.OCESS General LIFESPAN 242 0.0319 44.916 4.67784 0.679 11.3204.OCESS General ACTIVE 584 0 2 0.03170 0.007.OCESS Containers LIFESPAN 5032 0.0264 47.681 6.95935 0.579 350.194.OCESS Containers ACTIVE 10222 0 12 0.99522 0.094EUE Berth 1 LENGTH 25351 0 22 2.29866 0.250rEUE Berth 1 WAITTIME 15258 0 47.581 5.28751 0.551 806.769:SOURCE Berth 1 USE 20789 0 1 0.83229 0.011.SOURCE Berth 2 USE 7831 0 1 0.22379 0.008TEUE Berth 3 LENGTH 7970 0 2 0.00837 0.003EUB Berth 3 WAITTIME 7767 0 19.268 0.03889 0.012 3.02058:SOURCE Berth 3 USE 15511 0 1 0.56050 0.010'SOURCE Berth 4 USE 10886 0 1 0.38524 0.011
STRIBUTION OF RESULTStle 5% 10% 25% 50t 75% 90% 95%
…-- - - - - - - - - - - - - - - - - - - - - - - - - - - - - - - - - - - - - - - - - - - - - - - - - - - - - - - - - - - - - - - - _ _ - - - - - - - - -
.OCESS Export Rice smal LIFES 0.140 0.281 0.533 1.031 2.051 3.854 5.563
.OCESS Export Rice smal ACTIV 0 0 0 0 0 0 0
.OCESS Export Rice medi LIFES 0.248 0.496 1.241 2.388 4.644 10.82 16.43
.OCESS Export Rice medi ACTIV 0 0 0 0 1 1 2
.OCESS Export Rice larg LIFES 0.749 1.103 2.043 3.673 6.436 11.46 15.99
.OCESS Export Rice larg ACTIV 0 0 0 0 1 1 2OCESS Timber prods LIFESPAN 0.139 0.278 0.710 1.794 4.723 11.53 18.12OCESS Timber prods ACTIVE 0 0 0 0 0 1 1OCESS Fertilizer LIFESPAN 0.303 0.605 1.598 3.859 8.013 14.12 19.49OCESS Fertilizer ACTIVE 0 0 0 0 1 2 2OCESS Cement LIFESPAN 0.140 0.279 0.698 1.830 4.416 10.46 16.18OCESS Cement ACTIVE 0 0 0 0 1 2 2OCESS Steel LIFESPAN 0.119 0.238 0.596 1.793 4.201 10.56 16.8OCESS Steel ACTIVE 0 0 0 0 0 0 1OCESS Paddy small LIFESPAN 0.127 0.254 0.635 1.599 3.346 5.991 9.039OCESS Paddy small ACTIVE 0 0 0 0 1 1 2OCESS Paddy medium LIFESPAN 0.239 0.479 1.272 3.205 7.070 13.57 18.68OCESS Paddy medium ACTIVE 0. 0 0 0 1 2 2OCESS Coal LIFESPAN 0.089 0.178 0.446 1.149 2.824 7.632 13.41DCESS Coal ACTIVE 0 0 0 0 0 0 0DCESS General LIFESPAN 0.179 0.359 0.93 2.607 5.4 12.75 15.97OCESS General ACTIVE 0 0 0 0 0 0 0DCESS Containers LIFESPAN 0.293 0.587 1.465 4.049 9.749 17.28 23.92OCESS Containers ACTIVE 0 0 0 0 1 3 4EUE Berth 1 LENGTH 0 0 0 1 3 7 10-UE Berth 1 WAITTIME 0 0 0 1.867 7.827 15.62 22.16SOURCE Berth I USE 0 0 1 1 1 1 1SOURCE Berth 2 USE 0 0 0 0 0 1 1RUE Berth 3 LENGTH 0 0 0 0 0 0 05UE Berth 3 WAITTIME 0 0 0 0 0 0 0SOURCE Berth 3 USE 0 0 0 1 1 1 1SOURCE Berth 4 USE 0 0 0 0 1 1 1

Sheetl
General Cargo Handling Rates at Can ThoLow Scenario Year 2000 1 Shift i
Ref ICargo Type IShip Type IHandling |Number of Percentage lAnnual iNumber of Number ofITonnes INumber ofi Rate in T per 'gangs per time lost throughput Ishifts per hours per per day Iberth days
Gang/hour |ship due to in Tonnes week shift per yearweather
* Exports i , '__ __
1 lExport Rice Ismall j 30 2 20, 2000i 7 71 336 5.95238121Export Rice imedium 30j 4 20 76000' 7 7j 672 113.095243Export Rice large 30i 6T 20 10000 7 71 100B 9.92063494 Timber, pulp medium 30i 4 5' 7 71 798 05 Agri Prods Imedium 241 4 5. 71 71 638.4 0
IImports 76 I Fertilizer medium 30 4 15! 250001 7 71 714 35.0140067 Cement medium 30 4 201 7 71 672 08 Steel medium 40 41 5 ! 50001 7 71 1064 4.69924819 IWheat flour medium 30 4j 201 71 71 672 0
10 Paddy small 25 2 20 15000 71 7 280 53.57142911 Paddy medium 25 4 20 30000 7 7 560 53.57142912 Coal medium 301 4 5 1000 7 7i 798 1.253132813 Phosphate medium 301 4i 5 | 71 71 798 014 Timber small 301 4 5 t: 7i 7 798 015 Cement medium 30j 4j 20 j 71 7i 672i 016 General -medium 401 4i 5i | 7! 7, 10641 0
________ I _______ I _________ I _______ I 1_____ 1640001 1______ _______ I ___14 0 277.0775
IContainers I I I I I I_I_I _ I
17lExportfulls Imedium 8 2 5 21 7 319.2i 018 Export Reef Imedium 1 8 21 5 1 21 7 319.2 019 Export Emp medium i 8 2j 5 j 21 7 319.2 020 Import fulls jmedium 8 2j 5 | 21 7 319.2i 021 Import Reef medium 8_ 2! 5 21 7 319.2 022 Import Emp medium 8 21 5 0 21 7 319.2 0
j | j j~~~~Box numbers in/out - 7 day service 0 O____ j____ i I I_I ' I jVessel capacPty 1
Pagel1

Page: 1;ARGO HROUGHPUT ARCEL SIZE ANDLING RATE K-VALUEBERTH.xport Rice small 2000, 500 336 23,4.xport Rice medium 76000 2500 672 21,3,4xport Rice large 10000 6000 1008 21,3,4imber prods 2500 798: 11,3,4gri products 3000 638 1'1,3,4ertilizer 25000 5000 714 111,3,4ement 2000 672 11,3,4teel 5000: 3000, 1064 1 1,3,4lheat flour 4000 672 1 1,3,4addy small 15000: 1000 2801 1 1,2,3,4addy medium 300001 3000 5601 11,3,4*oal 1000 1500 798: 11,3,4hosphate 2000 798 11,3,4imber 2000 798 11,3,4:ement 2000 672i 111,3,4eneral 4000, 1064, 111,3,4:ontainers 190: 319 2:1
I ~~ I

,-02-96 10:45
C:\MKABO3\CANTO6.mod-screte empirical distribution "Cargo Type":
1 5.85%2 44.44%3 2.44%4 0.00%5 0.00%6 7.31%7 0.00%8 2.44%9 0.00%
10 21.93%11 14.62%12 0.97%13 0.00%14 0.00%15 0.00%16 0.00%17 0.00%
.PORT after 100 replications-==== seed: 63010458
:STRIBUTIONStle Type P1 P2 Obs Min Max Mean
._____________________________________________________________________________
port Rice small Servi GAMMA *2 1 422 0.018 4.591 O.9828port Rice small Load NORMAL 500 50 424 358.1 644.1 502.45-port Rice medium Serv GAMMA 2 1 3049 0.014 4.790 1.0259-port Rice medium Load NORMAL 2500 250 3049 1616 3295 2495.5port Rice large Servi GAMMA 2 1 168 0.013 3.603 0.9374.port Rice large Load NORMAL 6000 600 168 4478 7485 5973.6-mber prods Service Ti GAMMA 1 1 0.mber prods Load NORMAL 2500 250 0ri products Service T GAMMA 1 1 0-ri products Load NORMAL 3000 300 0.rtilizer Service Time GAMMA 1 1 463 0.003 6.551 1.0080.rtilizer Load NORMAL 5000 500 463 3194 6714 4954.5ment Service Time GAMMA 1 1 0ment Load NORMAL 2000 200 0eel Service Time GAMMA 1 1 170 0.021 6.453 1.0182eel Load NORMAL 3000 300 170 2382 3804 2972.3eat flour Service Tim GAMMA 1 1 0eat flour Load NORMAL 4000 400 0ddy small Service Tim GAMMA 1 1 1496 0.002 6.160 0.9508ddy small Load NORMAL 1000 100 1496 677.8 1355 998.71ddy medium Service Ti GAMMA 1 1 978 0.000 6.554 0.9649ddy medium Load NORMAL 3000 300 978 1950 3963 2997.2al Service Time GAMMA 1 1 51 0.034 4.111 0.9564al Load NORMAL 1500 150 51 1181 1891 1533.7osphate Service Time GAMMA 1 1 0osphate Load NORMAL 2000 200 0mber Service Time GAMMA 1 1 0mber Load NORMAL 2000 200 0ment Service Time GAMMA 1 1 0ment Load NORMAL 2000. 200 0neral Service Time GAMMA 1 1 0neral Load NORMAL 4000 400 0ntainers Service Time GAMMA 2 1 0ntainers Load NORMAL 190 19 0rivals NEGEXP 0.19 6799 0.002 53.43 5.2889rgo Type EMPIRICAL discrete 6799 1 12 5.5146
SULTStle Obs Min Max Mean +/- Sum
OCESS Export Rice smal LIFES 420 0.0262 7.6996 1.53269 0.121 6.43728DCESS E --ort Rice sma........ .. l ACTIV. 944 .. ... 2 00.018313 0.002DCESS Export Rice medi LIFES 3043 0.0632 42.161 3.97859 0.136 121.068OCESS Export Rice medi ACTIV 6192 0 5 0.33758 0.018OCESS Export Rice larg LIFES 168 0.0737 23.223 5.67972 0.673 9.54193OCESS Export Rice larg ACTIV 436 0 2 0.02662 0.005

ROCESS Fertilizer LIFESPAN 465 0.0216 48.560 7.03250 0.869 32.7011ROCESS Fertilizer ACTIVE 1028 0 2 0.09165 0.012ROCESS Steel LIFESPAN 170 o.0654 18.540 2.91121 0.504 4.94906ROCESS Steel ACTIVE 440 0 1 0.01379 0.003ROCESS Paddy small LIFESPAN 2489 0.0081 23.086 3.38425 0.175 50.3914ROCESS Paddy small ACTIVE 3084 0 4 0.14086 0.010ROCESS Paddy medium LIFESPAN 976 0.0060 39.335 5.17227 0.347 50.4814ROCESS Paddy medium ACTIVE 2054 0 4 0.14208 0.013ROCESS Coal LIFESPAN 52 0.0623 8.8789 1.96786 0.664 1.02329ROCESS Coal ACTIVE 203 0 2 0.00274 0.001JEUE Berth 1 LENGTH 3927 0 3 0.02165 0.007'JEUE Berth 1 WAITTIME 3702 0 31.537 0.21050 0.073 7.79258ESOURCE Berth 1 USE 7376 0 1 0.42573 0.011ESOURCE Berth 2 USE 1258 0 1 0.05354 0.006JEUE Berth 3 LENGTH 2016 0 1 0.00091 0.001JEUE Berth 3 WAITTIME 1903 0 6.9450 0.01340 0.008 0.25499ESOURCE Berth 3 USE 3885 0 1 0.20749 0.010ESOURCE Berth 4 USE 1323 0 1 0.06413 0.007
ISTRIBUTION OF RESULTSitle 5% 10% 25% 50% 75t 90% 95S
ROCESS Export Rice smal LIFES 0.255 0.411 0.767 1.232 1.969 3.067 3.6ROCESS Export Rice smal ACTIV 0 0 0 0 0 0 0ROCESS Export Rice medi LIFES 0.546 0.956 1.811 3.212 5.268 7.851 9.917ROCESS Export Rice medi ACTIV 0 0 0 0 1 1 2ROCESS Export Rice larg LIFES 1.014 1.314 2.727 4.7 7.9 11.37 13.2ROCESS Export Rice larg ACTIV 0 0 0 0 0 0 0ROCESS Fertilizer LIFESPAN 0.369 0.738 2.024 4.776 9.596 17.06 21.62ROCESS Fertilizer ACTIVE 0 0 0 0 0 0 1ROCESS Steel LIFESPAN 0.163 0.327 0.844 1.825 4.139 7 9.083ROCESS Steel ACTIVE 0 0 0 0 0 0 0ROCESS Paddy small LIFESPAN 0.175 0.350 1.019 2.402 4.682 7.782 9.782ROCESS Paddy small ACTIVE 0 0 0 0 0 1 1ROCESS Paddy medium LIFESPAN 0.290 0.581 1.603 3.745 6.910 11.88 15.13ROCESS Paddy medium ACTIVE 0 0 0 0 0 1 1ROCESS Coal ACTIVE 0 0 0 0 0 0 0JEUE Berth I LENGTH 0 0 0 0 0 0 0JEUE Berth 1 WAITTIME 0 0 0 0 0 0 03SOURCE Berth 1 USE 0 0 0 0 1 1 13SOURCE Berth 2 USE 0 0 0 0 0 0 1JEUE Berth 3 LENGTH 0 0 0 0 0 0 0JEUE Berth 3 WAITTIME 0 0 0 0 0 0 03SOURCE Berth 3 USE 0 0 0 0 0 1 1'SOURCE Berth 4 USE 0 0 0 0 0 0 1

Sheetl
General Cargo Handling Rates at Can ThoBase Scenario Year 2000 Reduced Crainage ___Ref i Cargo Type Ship Type Handling Number of Percentage Annual Number of I Number of lTonnes Number of
.F Rate in T per gangs per time lost throughput shifts per hours per per day berth daysGang/hour ship due to in Tonnes week shift per year
I | ! ~~~~~~ ~ ~~weather.Exports |
1_Export Rice small 301 1 20! 20001 12 7 288 6.94444442Export Rice medium 30 3j 201 76000j 12 7 864 87.9629633 Export Rice large 30! 4' 201 128000 12 7 1152 111.111114 Timber, pulp medium 301 3 5 10000 12 7 1026 9.74658875 Agr Prods medium 24 3 5 12 71 820.8 0
Imports6 Fertilizer medium 30 3 15 125000 12 7 918 136.165587 Cement medium 30 3 20 50000 12 71 864 57.870378 Steel medium 40 3 5 10000 12 71 1368 7.30994159 Wheat flour medium 30 3 20 12 7 864 0
Local .. . _10 Paddy small 25 1 20 30000 12 7 240 12511 Paddy medium 25 3 20 60000 12 7 720 83.33333312 Coal medium 30 3 5 2000 12 7 1026 1.949317713 Phosphate medium 30 3 5 _ 12 7 1026 014 Timber small 30 3 5 | 12 7 1026 015ICement medium 30 3 201 _ _ 12 7 864 016IGeneral medium 40 3r 51 5000_ 12 7 1368 3.6549708
I_______ I I I I_ 498000 _ 631.04862
Containers17 Export fulls medium 6 2 5 1374 21 7 239.4 5.7393484|18Export Reef medium 6 2 5 1713 21 7 239.4 7.155388519Export Empimedium 6 2 5 1663 21 7 239.4 6.94653320|1mportfulls |medium 6 2 5 3037 21 7 239.4 12.68588121 Import Reef medium 6 21 5 50 21 7 239.4 0.208855522 Import Emp medium 6 21 5 1663 21 7 239.41 6.946533
___ _ 9500 _ _ 39.68254I ________ I_______ Box numbers in/out - 7 day service 95 L _ _
I __ ______- ____I _____ Vessel capacity 118.75 1 ! _ i
Page. 1

Page: 1,ARGO HROUGHPUT ARCEL SIZE ANDLING RATE K-VALUEBERTHxport Rice small 2000 500 288 2:3,4xport Rice medium 76000 2500 864, 21,3,4xport Rice large 128000 60001 1152 2'1,3,4imber prods 10000 2500 1026. 111,3,4gri products 3000 821, 11,3,4ertilizer 125000! 5000 918, 111,3,4ement 50000 2000, 864 11,3,4teel 10000 3000 1368 11,3,4Iheat flour 4000 8641 11,3,4addy small 30000 1000 240 1i1,2,3,4'addy medium 60000i 30001 720 11,3,4-oaf 2000 1500 1026 111,3,4hosphate 20001 1026 111,3,4imber I 2000, 1026 111,3,4;ement 2000 864 111,3,4;eneral 5000 4000 1368 11,3,4:ontainers 9500 1901 239 21
I I~~~~~~~~~~~~~~~~~~~~~~~~~~~~~~~~~~~~~~~~~~~~~~~~~~~~~~~~~~~~~~~~~~~~~~~~~~~~~~~~~~~~~~I
I~~~~~~~~~~

,-02-96 10:51
C:\MMAB03\CANTO7.mod-screte empirical distribution "Cargo Type":
1 1.85%2 14.10%3 9.89%4 1.85%5 0.00%6 11.59%7 11.59%8 1.55%9 0.00%
10 13.91%11 9.27%12 0.62%13 0.00%14 0.00%15 0.00%16 0.58%17 23.19%
PORT after 100 replicationsseed: 23301964
STRIBUTIONStle Type P1 P2 Obs Min Max Mean
-port Rice small Servi GAMMA 2 1 416 0.008 5.225 0.9946-port Rice small Load NORMAL 500 50 416 350.4 629.7 495.00port Rice medium Serv GAMMA 2 1 3013 0.010 6.303 1.0159port Rice medium Load NORMAL 2500 250 3023 1642 3366 2499.9port Rice large Servi GAMMA 2 1 2109 0.035 4.820 0.9879port Rice large Load NORMAL 6000 600 2117 4155 8852 6007.2mber prods Service Ti GAMMA 1 1 426 0.002 6.561 0.9722mber prods Load NORMAL 2500 250 429 1915 3211 2506.2ri products Service T GAMMA 1 1 0ri products Load NORMAL 3000 300 0rtilizer Service Time GAMMA 1 1 2477 0.000 11.08 0.9967rtilizer Load NORMAL 5000 500 2489 3318 6651 5007.7ment Service Time GAMMA 1 1 2441 0.000 7.115 1.0011ment Load NORMAL 2000 200 2450 1329 2671 2002.1eel Service Time GAMMA 1 1 328 0.006 7.791 0.9430eel Load NORMAL 3000 300 332 2075 3986 2989.6eat flour Service Tim GAMMA 1 1 0eat flour Load NORMAL 4Q00 400 0idy small Service Tim GAMMA 1 1 2961 0.000 7.404 1.0161idy small Load NORMAL 1000 100 2966 674.3 1419 1001.7idy medium Service Ti GAMMA 1 1 1928 0.000 7.968 1.0232idy medium Load NORMAL 3000 300 1944 1979 3930 3003.6al Service Time GAMMA 1 1 151 0.001 3.989 0.9404il Load NORMAL 1500 150 152 1006 1843 1485.8Dsphate Service Time GAMMA 1 1 0Jsphate Load NORMAL 2000 200 0nber Service Time GAMMA 1 1 0nber Load NORMAL 2000 200 0nent Service Time GAMMA 1 1 0nent Load NORMAL 2000 200 0ieral Service Time GAMMA 1 1 138 0.008 4.536 0.8096ieral Load NORMAL 4000 400 138 3125 4884 3966.4itainers Service Time GAMMA 2 1 4949 0.017 6.177 1.0037itainers Load NORMAL 190 19 5012 118.4 283.2 190.13:ivals NEGEXP 0.5990 21468 0.000 19.22 1.6771-go Type EMPIRICAL discrete 21468 1 17 8.8294
,ULTS:le Obs Min Max Mean +/- Sum
)CESS Export Rice smal LIFES 416 0.0137 28.366 2.67228 0.359 11.1167)CESS Rxnort RinA smAl ACTITV 932 0 3 0.03087 0.004)CESS Export Rice medi LIFES 3016 0.0370 65.118 4.99062 0.394 150.517)CESS Export Rice medi ACTIV 6139 0 7 0.42219 0.041)CESS Export Rice larg LIFES 2095 0.1872 65.556 7.09039 0.451 148.544)CESS Export Rice larg ACTIV 4312 0 6 0.41832 0.033

.OCESS Timber prods LIFESPAN 428 0.0107 40.428 4.49060 0.737 19.2198OCESS Timber prods ACTIVE 957 0 3 0.05386 0.009OCESS Fertilizer LIFESPAN 2460 0.0005 63.852 7.50814 0.497 184.700OCESS Fertilizer ACTIVE 5048 0 6 0.52280 0.041OCESS Cement LIFESPAN 2436 0.0033 60.738 4.38442 0.363 106.804OCESS Cement ACTIVE 4986 0 6 0.30027 0.031OCESS Steel LIFESPAN 329 0.0121 34.560 3.91843 0.946 12.8916OCESS Steel ACTIVE 761 0 2 0.03692 0.007OCESS Paddy small LIFESPAN 2940 0.0007 63.179 4.82807 0.225 141.945OCESS Paddy small ACTIVE 6006 0 6 0.39925 0.024OCESS Paddy medium LIFESPAN 1923 0.0014 65.995 6.37834 0.455 122.656OCESS Paddy medium ACTIVE 3967 0 6 0.34563 0.036OCESS Coal LIFESPAN 152 0.0055 38.687 2.53999 1.152 3.86078DCESS Coal ACTIVE 404 0 2 0.01078 0.003DCESS General LIFESPAN 139 0.0241 35.194 4.41615 1.086 6.13844OCESS General ACTIVE 377 0 1 0.01698 0.006OCESS Containers LIFESPAN 4942 0.0308 63.331 7.15514 0.726 353.607OCESS Containers ACTIVE 10052 0 15 1.00563 0.103EUE Berth 1 LENGTH 18268 0 31 1.71310 0.221EUE Berth 1 WAITTIME 11318 0 65.083 5.33006 0.679 603.256SOURCE Berth 1 USE 15993 0 1 0.78152 0.012SOURCE Berth 2 USE 3619 0 1 0.20720 0.010EUE Berth 3 LENGTH 5185 0 2 0.01126 0.003EUE Berth 3 WAITTIME 4988 0 26.828 0.08129 0.027 4.05481SOURCE Berth 3 USE 9963 0 1 0.51770 0.013SOURCE Berth 4 USE 6615 0 1 0.33270 0.012
STRIBUTION OF RESULTStle 5% 10% 251 50% 759 90% 95%
…____________________________________________________________________________
OCESS Export Rice smal LIFES 0.287 0.501 0.979 1.786 3.105 5.44 7.36OCESS Export Rice smal ACTIV 0 0 0 0 0 0 0OCESS Export Rice medi LIFES 0.333 0.666 1.653 3.037 5.581 10.41 17.06OCESS Export Rice medi ACTIV 0 0 0 0 1 1 2OCESS Export Rice larg LIFES 0.726 1.451 2.672 5.020 8.888 14.74 20.29OCESS Export Rice larg ACTIV 0 0 0 0 1 1 2OCESS Timber prods LIFESPAN 0.192 0.385 0.997 2.504 5.467 10.99 16.26OCESS Timber prods ACTIVE 0 0 0 0 0 0 1DCESS Fertilizer LIFESPAN 0.390 0.781 2.078 4.994 9.899 17.58 23.75OCESS Fertilizer ACTIVE 0 0 0 0 1 2 2DCESS Cement LIFESPAN 0.203 0.406 1.014 2.380 5.227 10.57 17.02DCESS Cement ACTIVE 0 0 0 0 0 1 1DCESS Steel LIFESPAN 0.162 0.324 0.818 1.912 4.025 10.89 17.53DCESS Steel ACTIVE 0 0 0 0 0 0 0-CESS Paddy small LIFESPAN 0.247 0.495 1.296 3.153 6.482 11.30 15.120CESS Paddy small ACTIVE 0 0 0 0 1 1 2DCESS Paddy medium LIFESPAN 0.319 0.638 1.596 4.055 7.982 15.39 20.33)CESS Paddy medium ACTIVE 0 0 0 0 1 1 2)CESS Coal LIFESPAN 0.088 0.177 0.442 1.12 3.072 5.632 8.619OCESS Coal ACTIVE 0 0 0 0 0 0 0)CESS General LIFESPAN 0.198 0.395 0.830 2.076 4.896 12.31 19.99)CESS General ACTIVE, 0 0 0 0 0 0 0)CESS Containers LIFESPAN 0.253 0.505 1.263 3.711 9.607 18.76 26.02)CESS Containers ACTIVE 0 0 0 0 1 3 43UE Berth I LENGTH 0 0 0 0 2 5 83UE Berth 1 WAITTIME 0 0 0 1.534 7.210 16.40 23.38,OURCE Berth 1 USE 0 0 1 1 1 1 1,OURCE Berth 2 USE 0 0 0 0 0 1 13UE Berth 3 LENGTH 0 0 0 0. 0 0 0
UE Berth 3 WAITTIME 0 0 0 0 0 0 0,OURCE Berth 3 USE 0 0 0 1 1 1 1
3 OURCE Berth 4 USE 0 0 0 0 1 1 1

Sheetl
General Cargo Handling Rates at Can Tho i
High Scenario Year 2000 3 Shifts _
Ref ICargo Type Ship Type Handling Number of Percentage Annual Number of Number of ITonnes I Number ofType 1Ship Rate in T per gangs per time lost throughput shifts per hours per per day berth days
Gang/hour ship due to in Tonnes week shift per yearweather
_Exports w _1 IExport Rice tsmall 30 2 20 2000 18, 7 864 2.31481482lExport Rice medium 30 4 20 91000 18 7 1728 52.6620373 Export Rice large 30 6 20 140000 18 7 2592 54.0123464 Timber, puip medium 30 4 5 25000 18 7_ 2052 12.1832365 Agr Prods medium 24 4 5 18 7 1641.6 0
_~~~~~~~~~~~~~~~~~~~~~~~~~~~~~~~~~~~ __
l Imports _
61 Fertilizer medium 30 4 15 175000 1 7 1836 95.3159047iCement medium 30T 4 20 100000 18 71 1728 57.87037BtSteel medium 40 4 5 20000 18 71 2736 7.30994159lWheat flour medium 30 4 20 181 71 1728 0
Local _ _ __
10 Paddy |small 25 2 20 60000 18 7 720 83.33333311 Paddy Imedium 25 4 20 120000 18 7 1440 83.33333312 Coal medium 30 4 5 5000 18 7 2052 2.436647213jPhosphate medium 30 4 5 18| 7 20521 014 Timber small 30 4 5 _ 181 71 20521 015 Cement medium 30 4 20 _ 18 71 1728 016 General medium 401 4 5 10000 18 71 2736 3.6549708
Containers _______ _ l748000 1 1 1 454.42693
IContainers I
17 Exportfulls medium | 8' 2 5 1750 21 7 319.21 5.482456118 Export Reef medium e 2 5 2150 21 7 319.2 6.73558919 Export Emp medium 8] 2 5 2100 21 7 319.2 6.578947420_Importfulls medium 8j 2 5 3850 21 7 319.2 12.06140421 Import Reef medium | 8] 2 5 50 21 7 319.2 0.156641622 Import Emp medium 8 2 5 2100 21 7 7 319.2| 6.5789474
I________ 1 I_______ I I I ___ 12000 1 _ _ 37.5939851 Box numbers in/out - 7 day service 1201jVessel capacity I i 150| j j
Page 1

Page: 1ARGO HROUGHPUT ARCEL SIZE ANDLING RATE K-VALUEBERTH(port Rice small 2000! 500 864 23,4(port Rice medium 91000 2500 1728 21,3,4sport Rice large 140000. 6000 2592 21,3,4mnber prods 25000 2500 2052 11,3,4Iri products 3000 1642, 111,3,4~rtilizer 175000' 5000; 1836 111,3,4ament 100000 2000 1728 111,3,4eel 20000 3000 2736 111,3,4heat flour : 4000 1728 111,3,43ddy small 600001 1000 720 1i1,2,3,43ddy medium 120000| 3000j 1440 11,3,4)al 5000 1500| 2052 111,3,4iosphate 2000: 2052 111,3,4nber 2000' 2052 111,3,4ament 2000 1728 111,3,4aneral 100001 40001 2736 111,3,4)ntainers 12000 240 319 211

,-02-96 10:56
C:\MMAB03\CANTO8.modscrete empirical distribution "Cargo Type":
1 1.25%-2 11.33%3 7.2694 3.11%5 0.00%6 10.90%7 15.56%8 2.08%9 0.00%
10 18.68%11 12.45%12 1.04%13 0.00%14 0.00%15 0.00%16 0.78%17 15.56%
]PORT after 100 replications-==== seed: 19381795
STRIBUTIONStle Type P1 P2 Obs Min Max Mean
…-- - - - - - - - - - - - - - - - - - - - - - - - - - - - - - - - - - - - - - - - - - - - - - - - - - - - - - - - - - - - - - - - - - _ _ - - - - - _ -
port Rice small Servi GAMMA 2 1 400 0.031 3.635 0.9395port Rice small Load NORMAL 500 50 400 375.0 652.9 495.39-port Rice medium Serv GAMMA 2 1 3573 0.007 6.178 1.0199port Rice medium Load NORMAL 2500 250 3570 1631 3325 2498.7-port Rice large Servi GAMMA 2 1 2353 0.011 5.372 0.9743port Rice large Load NORMAL 6000 600 2354 4059 7968 5996.3mber prods Service Ti GAMMA 1 1 945 0.000 6.031 0.9960mber prods Load NORMAL 2500 250 945 1727 3509 2504.3ri products Service T GAMMA 1 1 0ri products Load NORMAL 3000 300 0rtilizer Service Time GAMMA 1 1 3456 0.000 7.913 1.0397rtilizer Load NORMAL 5000 500 3457 3416 6944 5002.8ment Service Time GAMMA 1 1 5033 0.000 8.167 1.0129ment Load NORMAL 2000 200 5033 1313 2861 1998.2eel Service Time GAMMA 1 1 707 0.001 8.144 0.9621eel Load NORMAL 3000 300 707 1884 4133 2981.3eat flour Service Tim GAMMA 1 1 0eat flour Load NORMAL 4000 400 0ddy small Service Tim GAMMA 1 1 5918 0.000 10.51 0.9766ddy small Load NORMAL 1000 100 5918 640.0 1352 999.31ddy medium Service Ti GAMMA 1 1 3920 0.000 9.024 0.9973ddy medium Load NORMAL 3000 300 3921 1920 4295 3003.9al Service Time GAMMA 1 1 325 0.004 5.085 0.9847al Load NORMAL 1500 150 325 1098 1931 1506.8osphate Service Time GAMMA 1 1 0osphate Load NORMAL 2000 200 0iber Service Time GAMMA 1 1 0nber Load NORMAL 2000 200 0•nent Service Time GAMMA 1 1 0ment Load NORMAL 2000 200 0aeral Service Time GAMMA 1 1 237 0.019 7.746 1.1933aeral Load NORMAL 4000 400 237 3089 4987 4039.9atainers Service Time GAMMA 2 1 4975 0.021 7.624 1.0170atainers Load NORMAL 240 24 4973 154.9 319.4 239.62rivals NEGEXP 0.8923 31840 0.000 11.40 1.1304rgo Type EMPIRICAL discrete 31840 1 17 8.6230
SULTStle Obs Min Max Mean +/- Sum
DCESS Export Rice smal LIFES 401 0.0160 12.663 0.86480 0.266 3.46786JCESS Exoort Rice smal ACTIV 901 0 2 Q. nn9g n n0n2DCESS Export Rice medi LIFES 3577 0.0088 19.064 1.80518 0.072 64.57139CESS Export Rice medi ACTIV 7247 0 4 0.17937 0.0099CESS Export Rice larg LIFES 2350 0.0260 27.206 2.61381 0.102 61.4246DCESS Export Rice larg ACTIV 4804 0 4 0.17077 0.009

OCESS Timber prods LIFESPAN 948 0.0003 25.409 1.57420 0.150 14. biOCESS Timber prods ACTIVE 1993 0 3 0.04139 0.005
-OCESS Fertilizer LIFESPAN 3473 0.0000 23.168 3.18669 0.124 110.674OCESS Fertilizer ACTIVE 7029 0 5 0.30716 0.016OCESS Cement LIFESPAN 5031 0.0001 20.901 1.53409 0.074 77.1799OCESS Cement ACTIVE 10162 0 6 0.21466 0.011DCESS Steel LIFESPAN 709 0.0012 19.162 1.41618 0.138 10.0407DCESS Steel ACTIVE 1516 0 2 0.02783 0.003DCESS Paddy small LIFESPAN 5923 0.0002 20.306 1.42101 0.050 84.1664DCESS Paddy small ACTIVE 11940 0 4 0.23420 0.010DCESS Paddy medium LIFESPAN 3928 0.0006 20.989 2.43839 0.100 95.7800DCESS Paddy medium ACTIVE 7949 0 5 0.26539 0.015DCESS Coal LIFESPAN 324 0.0031 14.055 0.99247 0.142 3.21559DCESS Coal ACTIVE 749 0 2 0.00895 0.002DCESS General LIFESPAN 234 0.0324 15.274 2.17898 0.345 5.09881DCESS General ACTIVE 571 0 2 0.01429 0.003OCESS Containers LIFESPAN 4978 0.0156 24.886 2.31898 0.125 115.439DCESS Containers ACTIVE 10049 0 10 0.32099 0.021EUE Berth 1 LENGTH 22316 0 12 0.42761 0.043EUE Berth 1 WAITTIME 16608 0 25.003 0.92533 0.091 153.679SOURCE Berth 1 USE 27714 0 1 0.65470 0.008SOURCE Berth 2 USE 6693 0 1 0.12438 0.005EUE Berth 3 LENGTH 8034 0 1 0.00364 0.001EUE Berth 3 WAITTIME 7882 0 11.157 0.01664 0.006 1.31177SOURCE Berth 3 USE 15818 0 1 0.38429 0.008SOURCE Berth 4 USE 8218 0 1 0.20000 0.007
STRIBUTION OF RESULTStle 5% 10% 25% 50% 75% 90% 95%
DCESS Export Rice smal LIFES 0.061 0.122 0.275 0.509 0.941 1.598 2.93DCESS Export Rice smal ACTIV 0 0 0 0 0 0 0DCESS Export Rice medi LIFES 0.233 0.402 0.765 1.359 2.298 3.461 4.518-CESS Export Rice medi ACTIV 0 0 0 0 0 1 10CESS Export Rice larg LIFES 0.432 0.627 1.159 2.065 3.431 5.085 6.413:CESS Export Rice larg ACTIV 0 0 0 0 0 1 1)CESS Timber prods LIFESPAN 0.079 0.157 0.393 0.981 1.975 3.412 4.784JCESS Timber prods ACTIVE 0 0 0 0 0 0 0DCESS Fertilizer LIFESPAN 0.172 0.343 0.947 2.216 4.378 7.447 9.634DCESS Fertilizer ACTIVE 0 0 0 0 1 1 1DCESS Cement LIFESPAN 0.074 0.149 0.386 0.953 1.933 3.520 4.964DCESS Cement ACTIVE 0 0 0 0 0 1 1)CESS Steel LIFESPAN 0.069 0.137 0.343 0.837 1.822 3.182 4.524DCESS Steel ACTIVE 0 0 0 0 0 0 0)CESS Paddy small LIFESPAN 0:078 0.155 0.388 0.965 1.962 3.281 4.318)CESS Paddy small ACTIVE 0 0 0 0 0 1. 1)CESS Paddy medium LIFESPAN 0.122 0.245 0.666 1.664 3.338 5.667 7.575)CESS Paddy medium ACTIVE 0. 0 0 0 0 1 1)CESS Coal LIFESPAN 0.046 0.093 0.236 0.563 1.275 2.265 2.987)CESS Coal ACTIVE 0 0 0 0 0 0 0)CESS General LIFESPAN 0.107 0.214 0.548 1.422 2.769 5.216 7.136)CESS General ACTIVE 0 0 0 0 0 0 0)CESS Containers LIFESPAN 0.186 0.372 0.735 1.460 2.847 5.319 7.439)CESS Containers ACTIVE 0 0 0 0 0 1 2BE Berth 1 LENGTH 0 0 0 0 0 1 3ME Berth 1 WAITTIME 0 0 0 0 0.710 3.081 5.290;OURCE Berth 1 USE 0 0 0 1 1 1 1;OURCE Berth 2 USE 0 0 0 0 0 1 1UE Berth 3 LENGTH 0 0 0 0 0 0 0UE Berth 3 WAITTIME 0 0 0 0 0 0 0;OURCE Berth 3 USE 0 0 0 0 1 1 1;OURCE Berth 4 USE 0 0 0 0 0 1 1

APPENDIX 2
Port Dues and ChargesProjections of income
P & L Statements 1989 - 1995Balance sheets 1 989 - 1 994
Asset Valuation

APPENDIX 2 Table I Port dues and charges for domestic general cargo vessels (VND 1000) /1Historic Future
Vessel /2 Small Medium Small MediumDead Weight Ton (DWT) 750 4,000 750 4,000Gross Register Ton (GRT) /3 500 2,667 500 2,667
Navigational charges and duesTonnage dues entering & departure 200 1,067 200 1,067Maritime safety dues 200 2,133 200 2,133Pilotage due entering & departure /4 1,475 7,867 1,475 7,867Tug assistance charges /5Mooring & unmooring dues /6 75 230 75 230
Berthage-wharfage duesBerthage dues on vessel /7 300 1,600 300 1,600Charges on cargo handling /8 2,937 15,664 5,874 31,328Dumping service /6 100 100 100 100Fresh water supply /6 32 144 32 144
Charges for cargo handling servicesLoading/discharging /9 375 2,000 600 3,200
Formalities charges 50 100 50 100Total Port's charges per call 5,744 30,905 8,906 47,769Total Port's charges per ton DWT 7.66 7.73 11.87 11.94Total Port's charges per call (USD) 522 2,810 810 4,343Total Port's charges per ton DWT (USD) 0.70 0.70 1.08 1.09Storage in warehouse /10 0 0 0 0Total Port's income per call /11 3,869 19,838 7,031 36,702Total Port's income per ton cargo 10.32 9.92 11.72 11.47Total Port's income per call (USD) 352 1,803 639 3,337Total Port's income per ton cargo (USD) 0.94 0.90 1.07 1.04
/1 Based on "Port due & Charge tariff' of GOVN Priving Committee 1994/2 Small: up to 1000 DWT, Medium: 1000-4000 DWT, Large: above 4000 Dwr/3 Estimated on the basis of 1.5 DWT = I GRT/4 59 nautical miles (109 km) from access channel to Can Tho Port/5 1 hour 1400 HP tug per call when used/6 At quayn7 At quay, assuming an average berthage time of 2 days/8 Assuming cargo to be 40% of DWT historically, 80% of DWT in future
using ships crane to/from quay, cargo in bags/9 For cargoes in bags from truck or barge to ship's hold/10 The warehouse is not used since cargo is loaded directly to the ships/11 Tonnage dues, Maritime safety dues and Pilotage dues are
are not retained by the Port

APPENDIX 2 Table 2. Port dues and charges for international general cargo vessels (USD) /IHistoric Future
Vessel /2 Small Medium Large Small Medium LargeDead Weight Ton (DWT) 750 4,000 8,000 750 4,000 8,000Gross Register Ton (GRT) /3 500 2,667 5,333 500 2,667 5,333
Navigational charges and duesTonnage dues entering & departure 100 533 1,067 100 533 1,067Navigational maintenace dues 28 150 301 28 150 301Pilotage due entering & departure /4 600 1,196 2,391 600 1,196 2,391Tug assistance charges /5 360 360Mooring & unmooring dues /6 17 33 50 17 33 50
Berthage-wharfage duesBerthage dues on vessel /7 84 672 2,240 84 672 2,240Berthage-wharfage dues on cargo /8 90 480 960 180 960 1,920Closing/opening hatches /9 26 26 46 26 26 46Cleaning cargo holds 66 132 164 66 132 164Sweeping deck 20 50 20 50Dumping service 10 20 30 10 20 30Fresh water supply 10 20 30 10 20 30Tallying, delivering/receiving cargoes /8 105 560 1,120 210 1,120 2,240
Charges for cargo handling servicesLoading/discharging /11 825 4,400 8,800 1,650 8,800 17,600
Otherfees 50 100 100 50 100 100Total Port's charges per call 1,961 8,242 17,609 2,981 13,682 28,489Total Port's charges per ton DWT 2.61 2.06 2.20 3.97 3.42 3.56Storage in warehouse /12 0 0 0 0 0 0Total Port's income per call /13 1,078 5,703 12,630 1,993 10,583 22,390Total Port's income per ton cargo 2.87 2.85 3.16 3.32 3.31 3.50
/1 Based on "Port due & Charge tahff' of GOVN Pricing Committee 1994/2 Small: up to 1000 DWT, Medium: 1000-4000 DWT, Large: above 4000 DWT/3 Estimated on the basis of 1.5 DWT = 1 GRT/4 59 nautical miles (109 km) from access channel to Can Tho Port/5 1 hour 1400 HP tug per call when used./6 At quay/7 Assuming an average berthage time of 3 days/8 Cargo is measured to be 40% of DWT historically and 80% in future/9 Using ship's crane, 2 times opening and closing, covers only/10 For cargoes in bags, cargo 50% of DWT/11 For cargoes in bags from truck or barge to ship's hold, cargo 50% of DWT/12 The warehouse is not used since cargo is loaded directly to the ships/13 Tonnage dues, Navigational mainteence dues, Pilotage dues, Tallying and Other fees/13 Tonnage dues, Navigational mainteence dues, Pilotage dues, Tallying and
Other fees are not retained by the Port
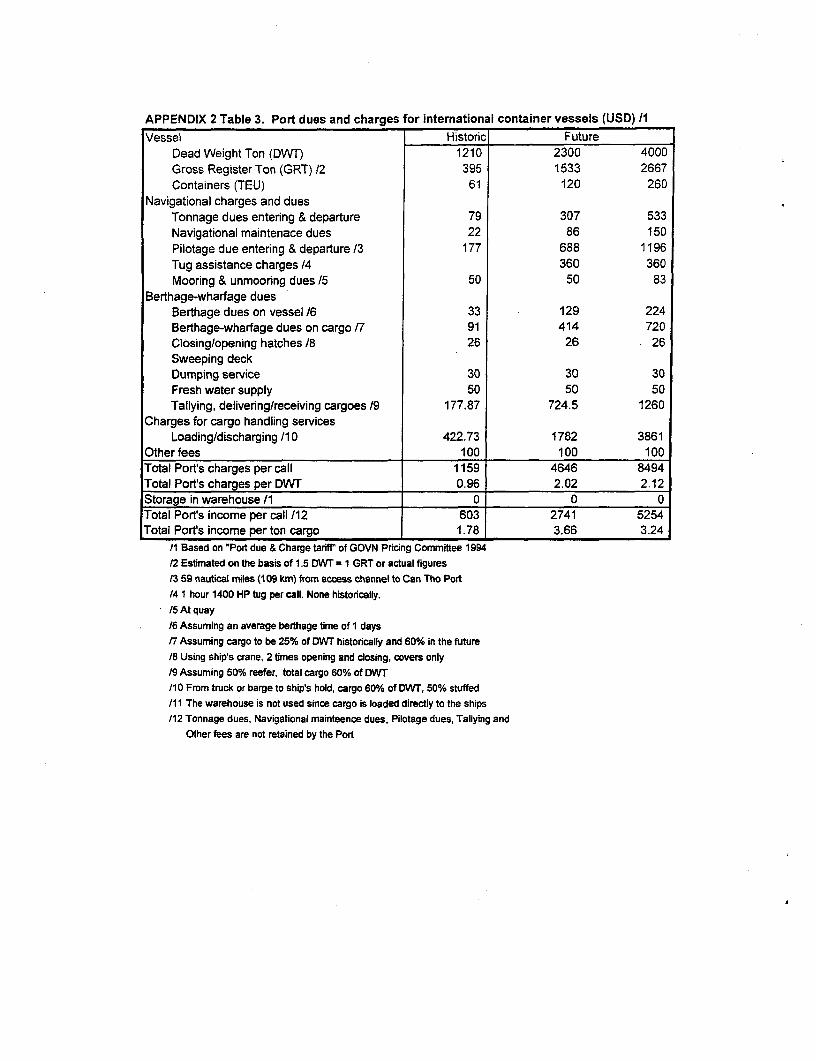
APPENDIX 2 Table 3. Port dues and charges for international container vessels (USD) /1
Vessel Historic FutureDead Weight Ton (DWT) 1210 2300 4000Gross Register Ton (GRT) 12 395 1533 2667Containers (TEU) 61 120 260
Navigational charges and duesTonnage dues entering & departure 79 307 533Navigational maintenace dues 22 86 150Pilotage due entering & departure /3 177 688 1196Tug assistance charges /4 360 360Mooring & unmooring dues /5 50 50 83
Berthage-wharfage duesBerthage dues on vessel /6 33 129 224Berthage-wharfage dues on cargo /7 91 414 720Closing/opening hatches /8 26 26 26Sweeping deckDumping service 30 30 30Fresh water supply 50 50 50Tallying, delivering/receiving cargoes /9 177.87 724.5 1260
Charges for cargo handling servicesLoading/discharging /10 422.73 1782 3861
Other fees 100 100 100Total Port's charges per call 1159 4646 8494Total Port's charges per DWT 0.96 2.02 2.12Storage in warehouse /1 0 0 0Total Port's income per call /12 603 2741 5254Total Port's income per ton cargo 1.78 3.66 3.24
M1 Based on 'Port due & Charge tarff' of GOVN Pricing Committee 1994/2 Estimated on the basis of 1.5 DWr = I GRT or actual figures/3 59 nautical miles (109 kim) from access channel to Can Tho Port/4 1 hour 1400 HP tug per call. None historically./5 At quay/6 Assuming an average berthage time of 1 daysr7 Assuming cargo to be 25% of DWT historically and 60% in the future/8 Using ships crane, 2 times opening and closing, covers only/9 Assuming 50% reefer, total cargo 60% of DWT/10 From truck or barge to ship's hold, cargo 60% of DVvT, 50% stuffed/11 The warehouse is not used since cargo is loaded directly to the ships/12 Tonnage dues, Navigational mainteence dues, Pilotage dues, Tallying and
Other fees are not retained by the Port

APPENDIX 2 Table 4. Projection of Port throughput and income, base scenario (1995-2005)1995 1996 1997 1998 1999 2000 2001 2002 2003 2004 2005
Cargo throughput (t)International general cargo 106.975 164.317. 221.658 279.000 340.000 401.000 416.400 431.800 447.200 462.600 478.000Intemational containers 74.000 80.941 87.882 94.824 101.765 108.706 115.647 122.588Domestic general cargo 16.302 33.868 51.434 69.000 83.000 97.000 98.000 99.000 100.000 101 .000 102.000Total cargo 123.277 198.185 273.092 422.000 503.941 585.882 609.224 632.565 655.906 679.247 702.588Financial projections (1996 USS 1000)IncomePort income 1 272 518 704 1.021 1.227 1.711 1.836 1.913 1.990 2.067 2.144World Bank loan /7 1.393 711Total income 272 518 2.097 1.021 1.227 2.422 1.836 1.913 1.990 2.067 2.144ExpenditureOverhead /2 3 4. 5 7 8 9 9 9 9 10 10Permanent labour/3 80 104 129 177 204 230 238 245 253 260 268Temporary labour/4 80 129 177 274 327 380 395 410 426 441 456O&M /5 13 21 29 45 53 62 64 67 69 72 74Investments 1.393 711Loan repayment /6 91 88 86Interest /7 93 91 137 133 123 113 103 95Other/8 2 3 4 7 8 10 10 10 11 11 11Total expenditure 178 261 1.737 602 690 1.538 849 865 971 985 1.000ProfIt before dep. and tax 94 257 360 419 537 884 987 1.048 1.018 1.082 1.144Depreciation /9 79 104 102 201 200 200 276 276 276 276 276Tax/10 2 1S 26 13 25 55 58 65 63 70 77Profit after dep. and tax 14 137 232 206 312 629 653 707 679 735 790/1 For intemational general cargo the average historic charges between small, medium and large vessels is used till 1999, the future charges are used thereafter (see Table 2).
For intemnational containers the average future charges between 120 and 260 TEU vessels Is used (see Table 3)For domestic general cargo the average historic charges between small and medium vessels is used till 1999, the future charges are used thereafter (see Table 1).
n2 Overhead costs are considered to be made up of two components: one component remains the same, the other increased proportional to total cargo handled13 A similar assumption has been made for permanent labour as for overheads/4 Temporary labour is assumed to Increase proportional to cargo handling/5 O&M is assumed to increase proportional to cargo handling/6 5 years grace and 20 years repayment In equal installments, converted to constant 1996 prices assuming a 3% p.a. inflation of the USD17 Converted to constant 1996 prices assuming a 3% p.a. Inflation of the US$18 Other costs are assumed to Increase proportional to cargo handled/9 Depreciation follows the proposed investments, see Appendix 2 Table 7/10 Assumed at 10%, Interest is assumed to be deductible from taxable income

APPENDIX 2 Table 5 P&L STATEMENTS CAN THO PORT 1989-1994(1,000 VND)1989 1990 1991 1992 1993 1994 1995/1
INCOMECargo handling 407,630Transpotation 24,323Warehousing/forewarding 23,619Port Authority/Pilotage 118,401
Total income 573,973 1,477,186 1,933,922 2,083,053 1,394,864 2,081,398 2,963,939
EXPENSESSalary direct labour 50,058 92,009 101,904 274,176 257,930 558,136Social insurance 7,166 15,534 16,691 23,771 37,166 82,715Manual stevadoring 212,853 158,628- Casual labour 88,464 124,440 195,304 988,787- Fixed labour 6,487 3,045 356,006- Other expenses 3,027 102,684 80,581Fuel 15,490 67,095 94,365 154,825 99,191 164,667Repair of fixed assets- Warehouse 16,610 8,857 11,551 3,959- Machinery 141,660- Materials 3,057 971 7,830- Spare parts 26,158 112,558-Other expenses 3,415 6,049Maintenence facilities 240,657Tools 4,114 5,990 736 8,653 9,231Depreciation of fixed assets 61,200 195,676 160,882 201,296 177,975 96,223Lunch expenses 5,932 20,575 3,762 5,256Electricity/water supply 13,133 18,774 21,452 33,489 35,651Channel/pilotage 58,691 144,037 57,768 50,361Port Authority/Pilots 30,854- Hirage incl. bonus 11,637- Travel expenses 7,680 10,889Police and customs 5,461 38,400Circulation and insurance- Fees for vehicles 5,310 11,817 8,985 6,532Transport renting charge 10,410 16,221Indirect expenses 98,272 355,525 679,460Facilities renting charge 26,902 3,700Administration 688,004Damage compensation 4,158Other expenses 1,126 538,469 6,106 7,058 1,240
Total expenses 492,488 1,045,040 1,401,702 1,858,930 1,788,766 2,394,674 2,800,197
Income before tax 81,485 432,146 532,220 224,123 -393,902 -313,276 163,742Taxes 162,956 216,290 139,189 316,001 118,558Income after tax 81,485 432,146 369,264 7,833 -533,091 -629,277 45,184
/1 Unaudited
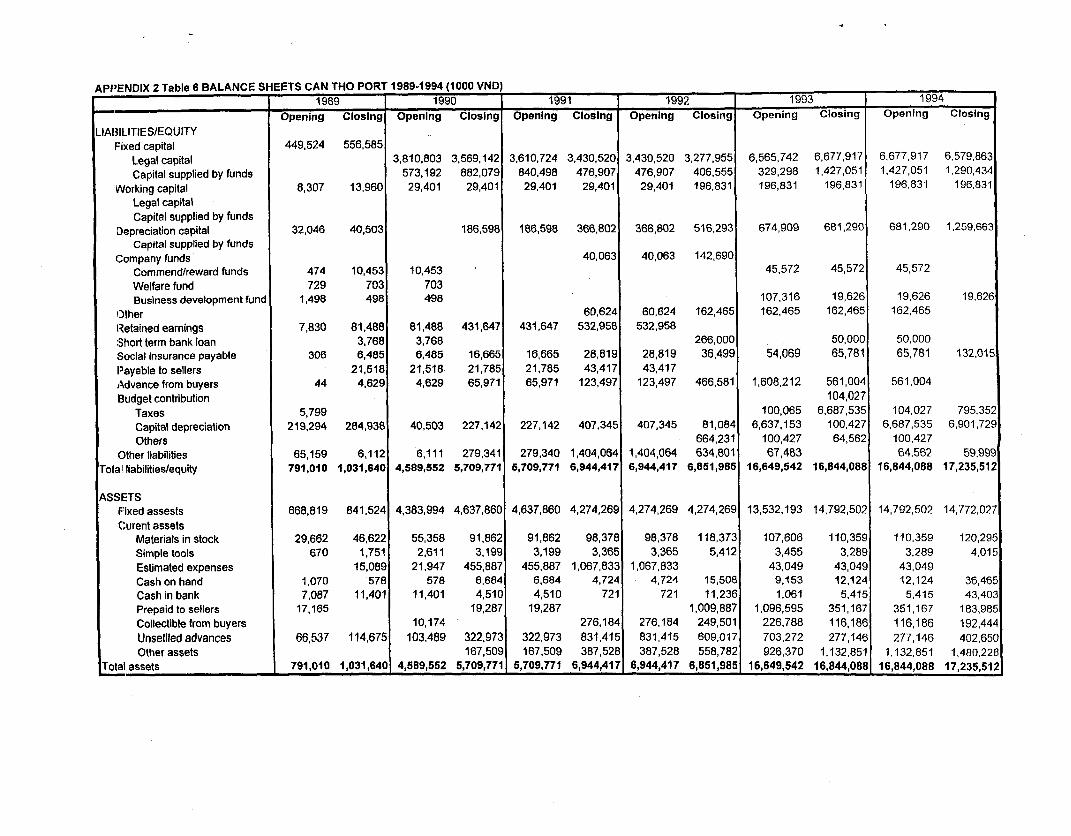
APPENDIX 2 Table 6 BALANCE SHEETS CAN THO PORT 1989-1994 (1000 VND)1989 1990 1991 1992 1993 1994
_ Opening Closing Opening Closing Opening Closing Opening Closing Opening Closing Opening ClosingLIABILITIES/EQUITY
Fixed capital 449,524 556,585Legal capital 3,810,803 3,569,142 3,610,724 3,430,520 3,430,520 3,277,955 6,565,742 6,677,917 6,677,917 6,579,863Capital supplied by funds 573,192 882,079 840,498 476,907 476,907 406,555 329,298 1,427,051 1,427,051 1,290,434
Working capital 8,307 13,960 29,401 29,401 29,401 29,401 29,401 196,831 196,831 196,831 196,831 196,831Legal capitalCapital supplied by funds
Depreciation capital 32,046 40,503 186,598 186,598 366,802 366,B02 516,293 674,909 681,290 681,290 1,259,663Capital supplied by funds
Company funds 40,063 40,063 142,690Commend/reward funds 474 10,453 10,453 45,572 45,572 45,572Welfare fund 729 703 703Business development fund 1,498 498 498 107,316 19,626 19,626 19,626
ODther 60,624 60,624 162,465 162,465 162,465 162,465Retained earnings 7,830 81,488 81,488 431,647 431,647 532,958 532,958Short term bank loan 3,768 3,768 266,000 50,000 50,000Social insurance payable 306 6,485 6,485 16,665 16,665 28,819 28,819 36,499 54,069 65,781 65,781 132,015Payable to sellers 21,518 21,518 21,785 21,785 43,417 43,417Advance from buyers 44 4,629 4,629 65,971 65,971 123,497 123,497 466,581 1,608,212 561,004 561,00413udget contribution 104,027
Taxes 5,799 100,065 6,687,535 104,027 795,352Capital depreciation 219,294 284,938 40,503 227,142 227,142 407,345 407,345 81,084 6,637,153 100,427 6,687,535 6,901,729Others 664,231 100,427 64,562 100,427
Other liabilities 65,159 6,112 6,111 279,341 279,340 1,404,064 1,404,064 634,801 67,483 64,562 59,999Totall liabilities/equity 791,010 1,031,640 4,589,552 5,709,771 5,709,771 6,944,417 6,944,417 6,851,985 16,649,542 16,844,088 16,844,088 17,235,512
ASSIETSFixed assests 668,819 841,524 4,383,994 4,637,860 4,637,860 4,274,269 4,274,269 4,274,269 13,532,193 14,792,502 14,792,502 14,772,027Curent assets
Materials in stock 29,662 46,622 55,358 91,862 91,862 98,378 98,378 118,373 107,606 110,359 110,359 120,295Simple tools 670 1,751 2,611 3,199 3,199 3,365 3,365 5,412 3,455 3,289 3,289 4,015Estimated expenses 15,089 21,947 455,887 455,887 1,067,833 1,067,833 43,049 43,049 43,049Cash on hand 1,070 578 578 6,684 6,684 4,724 4,724 15,508 9,153 12,124 12,124 36,465Cash in bank 7,087 11,401 11,401 4,510 4,510 721 721 11,236 1,061 5,415 5,415 43,403Prepaid to sellers 17,165 19,287 19,287 1,009,887 1,096,595 351,167 351,167 183,985Collectible from buyers 10,174 276,184 276,184 249,501 226,788 116,186 116,186 192,444Unsetlled advances 66,537 114,675 103,489 322,973 322,973 831,415 831,415 609,017 703,272 277,146 277,146 402,650Other assets 167,509 167,509 387,528 387,528 558,782 926,370 1,132,851 1,132,851 1,480,228
Total assets 791,010 1,031,640 4,589,552 5,709,771 5,709,771 6,944,417 6,944,417 6,851,985 16,649,542 16,844,088 16,844,088 17,235,512

APPENDIX 2 Table 7 Can Thm Port asset valuation and depreciation (USS 11)Ref hem Govemrnent vaIuation Project valuation
Unit Quantfty Age value at Deprec. Annual Repl val Replacement (Remain.) Present Annua1
_ - t21/3194 Years deprec per unit value dep years Value deprec.
Present assetsAl Main Oftiee rn; 100 20 3.117 25 397 300 30.000 0 0 0
A2 Other Offices m2 300 20 9.604 25 1.248 300 90.000 0 0 0A3 Guest House m2 100 20 1.228 25 91 300 30.000 0 0 0
A4 Stores m2 50 20 924 25 84 300 1S.000 0 0 0
A5 Canteen m2 120 5 4.300 10 564 300 36.000 5 18.000 3.600
A6 Club 1 m2 50 10 3.079 25 158 300 15.000 0 0 0A7 Club2 m2 50 10 833 25 58 300 15.000 0 0 0
AB Fax No 10 1.3S5 13 108 500 500 3 S00 167A9 Computer No 1 0 1.407 17 8S 1.000 1.000 3 1.000 333
AIO Printer No 1 0 729 10 73 750 750 3 750 250All Toyota Car No 1 3 3.400 11 364 15.000 15.000 2 6.000 3.000A12 Toyota Car No 1 3 1.658 11 177 15.000 15.000 2 6.000 3.000A13 12 Seat Bus No 1 3 5.596 11 1.114 20.000 20.000 2 8.000 4.000A14 Refrigerator No I1 128 10 14 300 300 1 150 150AS Video No 12 175 10 29 450 450 0 0 0A16 Telv,ion No 1 2 176 10 29 350 350 0 0 0A17 Television No 1 2 174 10 29 300 300 0 0 0
BI Trailer No 2 8 1.152 8 977 8.000 16.000 1 1.778 1.77882 Lorry No 17 2.256 7 1.421 50.000 50.000 0 0 0B3 Lony NO 17 2.256 7 1.421 S0.000 S0.000 0 0 0B4 Lony No 17 2.256 7 1.421 50.000 50.000 0 0 0BS 2SOTBarge No 1 8 7.110 8 3.055 60.000 60.000 0 0 056 13S HP Tug No 1. 17 7.733 17 1.370 250.000 250.000 0 0 0B7 Lorry No 17 2.614 7 1.421 50.000 50.000 0 0 088 ZetorTractor No 2 10 2.237 10 1.105 12.000 24.000 0 0 0Cl Fork LilfTnTuck No 2 10 4.101 10 1.024 25.000 50.000 0 0 0C2 Smal Equipment No 1 5 108 10 38 10.000 10.000 0 0 0C3 45T Mobile Crane No 1 20 14.861 10 1.769 400.000 400.000 0 0 0C4 75T Moble Crane No 1 25 36.245 10 5.095 600.000 600.000 0 0 0CS 25T Tracked Crane No 1 15 24.697 10 2.470 350.000 350.000 0 0 006 20000 L Fuel Tank No 1 10 101 10 40 1.500 1.500 0 0 0C7 3600 L Fuel Tank No 1 1 22 10 13 300 300 0 0 0CS Fuel Pump No 101 196 10 32 500 500 0 0 0CS Jetty m2 2.800 15 462.464 20 42.305 1.000 2.800.000 0 0 0C10 Lathe No 1 10 445 13 87 10.000 10.000 0 0 0C1l Piar DriD No 1 70 13 21 400 400 0 0 0Di Fencing m 550 1 1.334 20 127 15 8.250 0 0 0D2 Roads m2 72200 25 11.348 20 1.612 30 216.000 0 0 0D3 Warehouse m2 3.200 13 36.753 25 3.963 250 800.000 12 384.000 32.000El Barge No 1 1 1.519 13 465 100.000 100.000 0 0 0E2 Large Tug No 1 30 55.480 17 3.709 1.000.000 1.000.000 0 0 0E3 Compressor No 1 10 289 13 42 7.000 7.000 0 0 0Fl Quay Inils m2 1.400 0 1.000 1.400.000 25 1.400.000 56.000
Total _ _ 715.526 _ 79.627 8.588.600 1.826.178 104.278New investments 1998 -
Crane I No 1 1 500.000 500.000 10 50.000Tractors No 3 10 37.000 111.000 10 11.100Fendering No 1 1 44.000 44.000 10 4.400Lighting No 1 1 40.000 40.000 15 2.667Traiers No 4 10 16.000 64.000 10 6.40012 T fotkdft truck No 1 10 91.000 91.000 10 9.10Paving No 1 25 455.000 455.000 25 18.200Building vxtca No 1 20 130.000 130.000 20 6.500Total _ -_ - 1.435.000 108.367
New investments 2000Crane 2 No 1 10 500.000 500.000 10 50.000Tractors No 2 10 37.000 74.000 10 7.400Trailers No 3 10 45.000 135.000 10 13.50012 T forkit ttuck No 1 10 91.000 91.000 10 9.100Total 800.000 80.000
n COnverSos made at Uss 1 VND 1 1.000

Appendix 2 Table 8 Projected balance sheets 1995-2005 (1996 US$ 1000)31/12/95 31/12/96 31112/97 31/12/98 31/12/99 31/12/00 31/12/01 31/12/02 31/12/03 31/12/04 31/12/05
ASSETSFixed assetsFixed assets 8.589 8.589 10.024 10.024 10.024 10.824 10.824 10.824 10 824 10.824 10.824Less depreciation to date 6.762 6.867 6.969 7.170 7.370 7.570 7.846 8.122 8.399 8.675 8.952Total fixed assets 1.826 1.722 3.055 2.854 2.654 3.254 2.978 2.701 2.425 2.148 1.872Current assetsStores and materials /1 10 16 22 34 41 48 49 51 53 55 57Debtors and prepayments /1 5 8 11 17 20 24 25 26 27 28 28Cash and bank /1 10 16 22 34 41 48 49 51 53 55 57Totalcurrentassets 25 40 55 86 102 119 124 128 133 138 142Other assets /I 15 24 33 51 61 71 74 77 80 83 85Total assets 1.866 1.786 3.143 2.991 2.817 3.444 3.175 2.906 2.638 2.369 2.100LIABILITIESLong term liabilitiesWorld Bank loan /2 1.393 1.353 1.313 1.986 1.928 1.778 1.636 1.500 1.370Current liabilitiesShort term bank loans /1 10 16 22 34 41 48 49 51 53 55 57Taxation payable 2 15 26 13 25 55 58 65 63 70 77Creditors 11 10 16 22 34 41 48 49 51 53 55 57Total current liabilities 22 47 70 81 106 150 157 168 169 180 191Total liabilities 22 47 1.463 1.434 1.420 2.136 2.085 1.946 1.805 1.680 1.562.............. ........................................................ ............................................................................................................................................ ...................................................................CAPITALEquity /3 1.845 1.739 1.680 1.557 1.398 1.308 1.091 961 833 689 538Total liabilities and capital 1.866 1.786 3.143 2.991 2.817 3.444 3.175 2.906 2.638 2.369 2.100Debt to equity ratio 0,01 0,03 0,87 0,92 1,02 1,63 1,91 2,03 2,17 2,44 2,90Debt ratio 0,01 0,03 0,47 0,48 0,50 0,62 0,66 0,67 0,68 0,71 0,74/1 Increase assumed proportional to cargo throughput/2 Converted to constant 1996 prices assuming a 3% p.a. Inflation of the US$/3 Including retained eamings