ink film splitting acoustics
TRANSCRIPT

INK FILM SPLITTING ACOUSTICS
IN OFFSET PRINTING
Joakim Voltaire
Doctoral thesis at the Royal Institute of Technology Stockholm 2006

Akademisk avhandling som med tillstånd av Kungliga Tekniska Högskolan framlägges till offentlig granskning för avläggande av teknologie doktorsexamen måndagen den 17 mars 2006 klockan 10.00 i sal E2, KTH, Lindstedtsvägen 3 Entréplan, Stockholm. Joakim Voltaire, Ink film splitting acoustics in offset printing TRITA-YTK-0604 ISSN: 1650-0490 ISBN: 91-7178-261-3 Denna avhandling är skyddad enligt upphovsrättslagen. Alla rättigheter förbehålles. Copyright © 2006 by F. Joakim Voltaire. All rights reserved. No parts of this thesis may be reproduced without permission from the author. Printed in Sweden 2006 US-AB, Drottning Kristinas väg 53B, Stockholm

Att låta trycka förhåller sig till att tänka som ett förlossningsrum till den första kyssen. Friedrich Schlegel (1797)
This thesis is not printed with offset… Voltaire

ABSTRACT
This thesis claims a relationship between the film splitting sound emission from the printing press nip and the dynamic interaction occurring there between ink, fountain solution and substrate in offset lithography. The film splitting sound derives from the cavitation formed by the pressure drop in the second half of the print nip flow passage. As the ink film is strained, the cavities expand and eventually implode into breaking filaments at the nip exit, while emitting a partly audible, broadband, high frequency, noisy sound. A free-field microphone, A/D-converter and laptop computer were used to record pressure signals in the frequency range of 10 Hz to 50 kHz emitted by a variety of printing instruments and presses for a range of offset ink and paper types. After signal acquisition and filtering two signal averages of power and frequency were estimated. This average power increased with increasing loads of sheet-fed offset ink on an ink distributor, in accordance with a mass-conservation model developed. The behaviour of average frequency and power over different ink load ranges indicated transitions between different flow regimes. A glossy fine-coated paper gave higher average power than a corresponding matte paper during printing with such inks on a laboratory device, possibly due to an air sealing effect. The sound from tack measurements with the Deltack instrument during setting of heat-set offset inks printed on MWC papers showed a relation between the measured tack rise and average power, reflecting changes in splitting mechanism during the course of setting. With the Hydroscope instrument the interaction between these heat-set inks and fountain solution was studied, with the measured tack and sound emission displaying a clear, but non-linear, correlation. A heat-set offset pilot trial showed that the acoustic response from the printing nip sensitively and systematically detected changes in (LWC) paper type, optical density, ink-fount balance, and press stability. Pilot trials of cold-set offset inks on newsprint by sheet-fed presses indicated a strong correlation between evolution in average power, optical density and fountain solution consumption during the first thousand sheets normally needed for stabilisation. Acoustic measurements of ink film splitting have, aside from the laboratory studies performed by one Japanese group, previously received little attention, with the current study showing that a great deal of information useful to the printer can be accessed from this sound emission. Although the detailed mechanisms for ink film splitting have to be further studied and supported by mathematical simulation, the sensitivity of the acoustic method recommends its implementation for monitoring and control of offset printing.
i

SAMMANFATTNING
Avhandlingen visar att dynamisk samverkan mellan färg, papper och fuktvatten i litografisk offsettryckning kan analyseras med hjälp av det brusliknande kavitationsljud som uppkommer när färgfilmen splittras mellan valsarna (trycknypen) i tryckpressen. Olika trycknyp från laboratorie- till pilotskala spelades in med hjälp av en mikrofon, avsedd för breda frekvensintervall och höga ljudnivåer, tillsammans med en A/D-omvandlare och Laptop PC. Efter filtrering av den brusliknande inspelade signalen användes i huvudsak två mått, ljudvolym och medelfrekvens, för att undersöka känsligheten mot olika tryckparametrar. En masskonserverande kavitationsmodell föreslogs vilken överensstämde väl med hur ljudvolymen från en färgfördelare (IGT) ökade med färgpålägget inom området 1-7 g/m2. Avvikelser från modellen vid lägre och högre färgmängder kunde förklaras av andra flödesbetingelser. Två finpapper, ett matt och ett glansigt där enbart graden av kalandrering skiljde sig, gav under tryckning (IGT/ISIT) med arkoffsetfärg en högre ljudvolym för det glansiga papperet, i detta fall sannolikt orsakat av en ökad förslutning mellan färgen och papperet. Med Deltack mättes tryckklibbet av heatsetfärg på MVC-papper där färgsättningens inverkan gav en olinjär korrelation mellan klibb och ljud. Klibbet och ljudet från Hydroscope korrelerade också olinjärt i samband med fuktvattensemulgering i coldset- och heatsetfärg. I pilotskaleförsök på en Heatsetpress förändrades ljudet med valet av papperstyp (LWC), emulgeringsförmåga, optisk densitet, färg-fuktbalans och tryckstabilitet. I en- och tvåfärgsarkpressar där coldsetfärg trycktes på tidningspapper, fanns en korrelation mellan ljudet och färgens kända klibbvärde samt med hur den optiska densiteten och fuktvattenskonsumtionen förändrades med tiden. Metoden användes i ett par reologiska studier utförda av en Japansk forskargrupp under början av 90-talet, men därefter verkar inget mer ha publicerats. Resultaten här framhäver dock på nytt teknikens fördelar och möjligheten att använda den som ett verktyg för att studera filmsplittring och kanske som ett komplement till dagens övervakningssystem i tryckpressar.
ii

LIST OF PAPERS
This thesis consists of an introductory summary and the papers at the end. Papers will be referred to in the text as assigned in the list below. I am the sole contributor to all experiments and their recordings (with exceptions below), signal processing, software development and modelling work. I am the major or an equal contributor to all writing, with great help from Andrew Fogden (YKI) and Warren Batchelor (APPI). The IGT and ISIT recordings in (I) were partially performed by Daniel Jansson (Högskolan Dalarna), ISIT tack experiments were carried out by Mikael Sundin (YKI), and profilometry by Niclas Jacobsson (KTH). The Deltack and Hydroscope measurements in (II) were performed with assistance from Chamundi Gujjari (APPI). Heat-set printing trials in (III) were carried out in collaboration with KCL: Ulla Mattila, Susanna Nieminen and Heidi Reinius. Miroslav Hoc and Per-Åke Nygren (STFI-Packforsk) ran the sheet-fed printing press in (IV). Afriana Sudarno (APPI) performed the density and lint tests and Grant Brennan (Norske Skog) operated the sheet-fed press in (V). I Acoustic investigation of cavitation noise from offset ink film splitting.
Joakim Voltaire, Andrew Fogden, Daniel Jansson, Niclas Jacobsson, Submitted to Nordic Pulp. Paper Res. J., 2005.
II Acoustic emission and tack of heat-set inks during setting on MWC-
papers and fountain solution emulsification. Joakim Voltaire, Chamundi Gujjari, Warren Batchelor, Andrew Fogden, Submitted to J. Pulp. Paper Sci., 2006.
III Acoustic characterisation of film splitting in a HSWO printing nip. Joakim Voltaire, Ulla Mattila, Andrew Fogden, Susanna Nieminen, Heidi Reinius, Submitted to J. Pulp. Paper Sci., 2006.
IV Use of an on-press acoustic sensor to monitor coldset offset printing of
newspaper. Joakim Voltaire, Miroslav Hoc, Andrew Fogden, Submitted to Nordic Pulp. Paper Res. J., 2005.
V New technique for monitoring ink-water balance on an offset press. Joakim Voltaire, Warren Batchelor, Andrew Fogden, Afriana Sudarno, Paul Banham, Submitted to Appita J., 2006.
iii

Papers not included
Effect of Ink-Fountain Balance on Ink Tack Development. Johan Fröberg, Mikael Sundin, Fredrik Tiberg, Joakim Voltaire, International Printing & Graphic Arts Conf. Proc., Savannah, GA, 2000 Modelling Setting and Tack of a Sheet-fed Offset Ink Printed on a Coated Paper. Joakim Voltaire, Andrew Fogden, International Printing & Graphic Arts Conf. Proc., Bordeaux, 2002 Acoustic characterisation of film splitting in a HSWO printing nip. Joakim Voltaire, Ulla Mattila, Andrew Fogden, Susanna Nieminen, Heidi Reinius, International Printing & Graphic Arts Conf. Proc., Vancouver, BC, 2004
iv
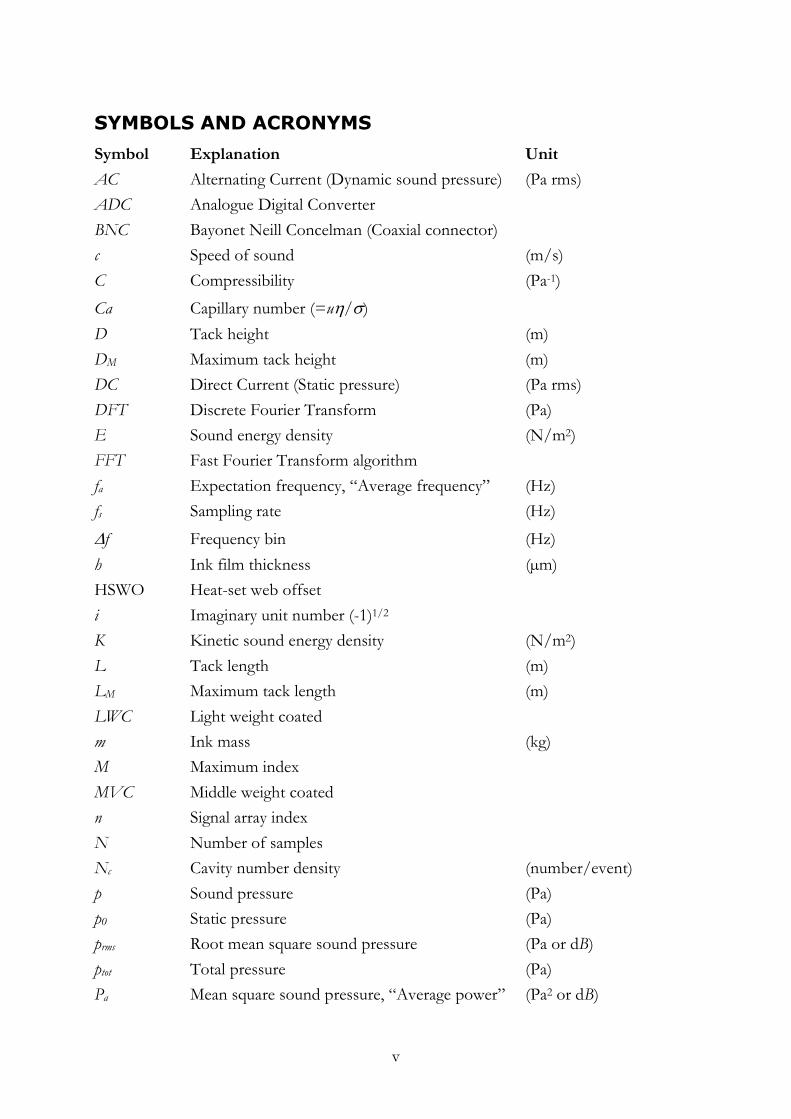
SYMBOLS AND ACRONYMS
Symbol Explanation Unit
AC Alternating Current (Dynamic sound pressure) (Pa rms) ADC Analogue Digital Converter BNC Bayonet Neill Concelman (Coaxial connector) c Speed of sound (m/s) C Compressibility (Pa-1) Ca Capillary number (=uη/σ) D Tack height (m) DM Maximum tack height (m) DC Direct Current (Static pressure) (Pa rms) DFT Discrete Fourier Transform (Pa) E Sound energy density (N/m2) FFT Fast Fourier Transform algorithm fa Expectation frequency, “Average frequency” (Hz) fs Sampling rate (Hz)
∆f Frequency bin (Hz) h Ink film thickness (µm) HSWO Heat-set web offset i Imaginary unit number (-1)1/2 K Kinetic sound energy density (N/m2) L Tack length (m) LM Maximum tack length (m) LWC Light weight coated m Ink mass (kg) M Maximum index MVC Middle weight coated n Signal array index N Number of samples Nc Cavity number density (number/event) p Sound pressure (Pa) p0 Static pressure (Pa) prms Root mean square sound pressure (Pa or dB) ptot Total pressure (Pa) Pa Mean square sound pressure, “Average power” (Pa2 or dB)
v

PSD Power spectral density (Pa2/Hz or dB) q Bubble number index r Bubble radius (µm) rM Maximum bubble radius (µm) R Roller radius + film thickness (m) s Radial dummy variable (m) Sn One sided power spectrum (Pa2) SPL Sound pressure level (dB) t Time (s) tM Splitting time (s) u Roller speed (m/s) U Potential sound energy density (N/m2) v Bubble shell radial velocity (m/s) w Particle velocity (m/s) V0 Volume element (m3)
δV Volume increment (m3) x, y, z Cylinder directions in space (m) Xn Two sided Fourier transform (Pa)
ε Cavity-ink volume ratio
φ Tack angle (rad)
φM Maximum tack angle (rad)
η Ink viscosity (Ns/m2)
ρ Ink density (kg/m3)
ρ0 Equilibrium air density (kg/m3)
σ Ink-air interfacial tension (N/m)
vi
CONTENTS
ABSTRACT ............................................................................................................. i SAMMANFATTNING ................................................................................................ ii LIST OF PAPERS ....................................................................................................iii SYMBOLS AND ACRONYMS ..................................................................................... v 1 INTRODUCTION..................................................................................1 1.1 Offset lithography ...................................................................................... 1 1.2 Concept of tack .......................................................................................... 2 1.3 Film splitting cavitation noise .................................................................... 3 1.4 Aim of the study......................................................................................... 4 1.5 Literature review ....................................................................................... 5 1.5.1 Fluid film lubrication and cavitation ............................................................... 5 1.5.2 Filamentation and cavitation of ink films ........................................................ 6 1.5.3 Ink-water interaction................................................................................... 8 1.5.4 Acoustic emission ....................................................................................... 9 2 METHODS AND MATERIALS ..............................................................10 2.1 Acoustic recording ................................................................................... 10 2.2 Signal processing ..................................................................................... 10 2.2.1 Average power ..........................................................................................10 2.2.2 Power spectral density................................................................................11 2.2.3 Average frequency .....................................................................................12 2.2.4 Filtration and time matching........................................................................12 2.2.5 Aliasing errors ...........................................................................................13 2.3 Laboratory methods and materials........................................................... 14 2.3.1 Ink roller distribution and printing on test strips ............................................14 2.3.2 Tack on paper and ink-water interaction .......................................................15 2.4 Pilot methods and materials..................................................................... 17 2.4.1 Heat-set web offset printing ........................................................................17 2.4.2 Sheet-fed offset printing.............................................................................18 3 MODELLING......................................................................................20 4 RESULTS AND DISCUSSION..............................................................28 4.1 Laboratory results.................................................................................... 28 4.1.1 Ink roller distribution..................................................................................28 4.1.2 Printing on test strips .................................................................................31 4.1.3 Ink tack on paper ......................................................................................34 4.1.4 Ink-water balance......................................................................................37 4.2 Pilot scale results..................................................................................... 40 4.2.1 Heat-set web offset printing ........................................................................40 4.2.2 Sheet-fed offset printing.............................................................................45 5 CONCLUDING REMARKS ...................................................................50 ACKNOWLEDGEMENTS..........................................................................................51 LITTERTURE.........................................................................................................52
vii

viii
INTRODUCTION
1 INTRODUCTION
1.1 Offset lithography
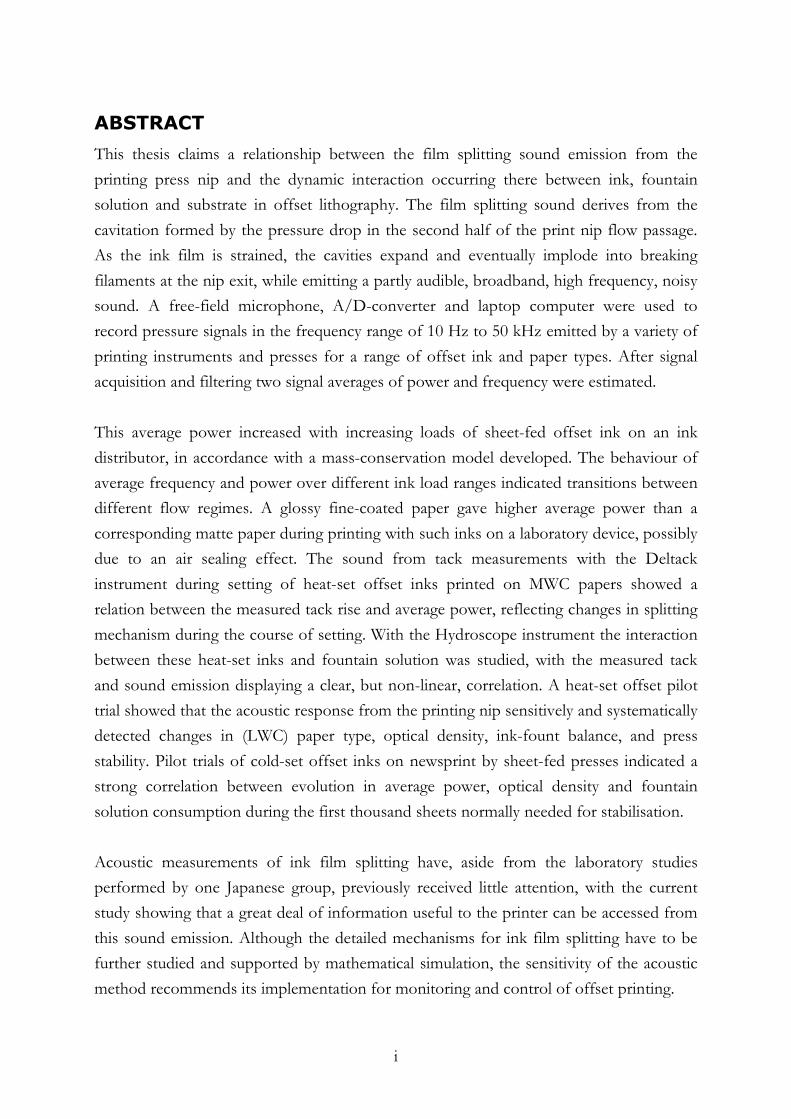
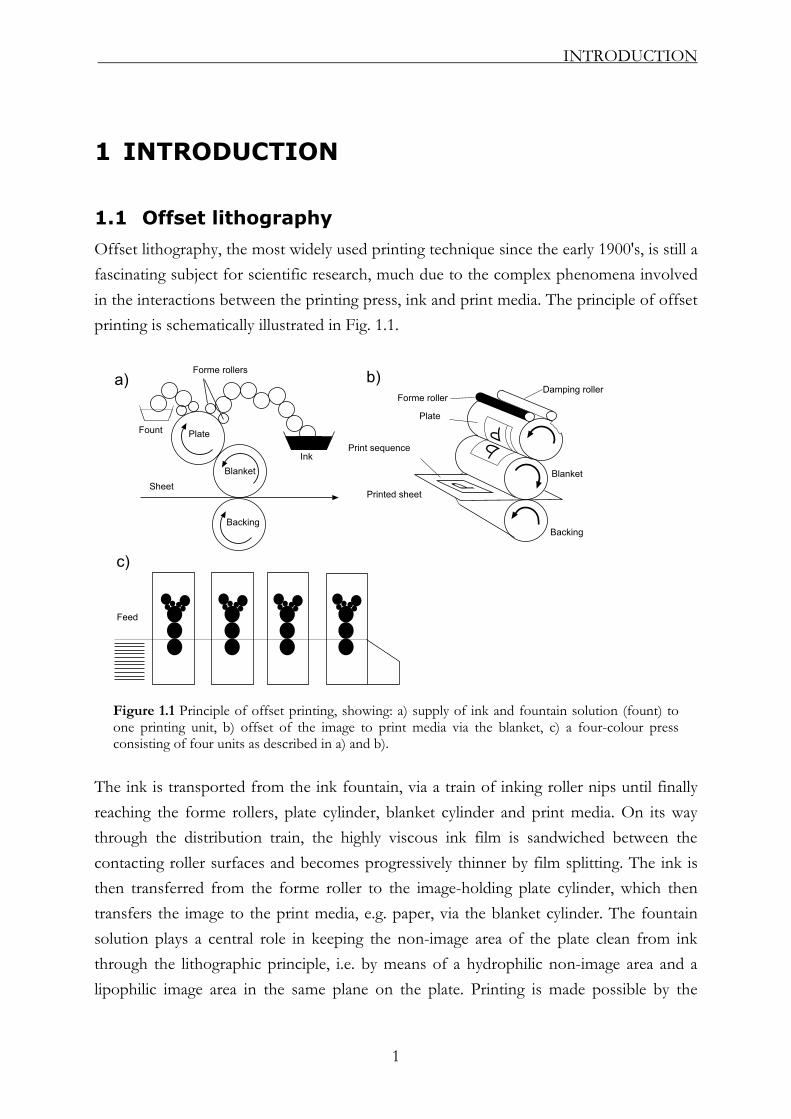
Offset lithography, the most widely used printing technique since the early 1900's, is still a fascinating subject for scientific research, much due to the complex phenomena involved in the interactions between the printing press, ink and print media. The principle of offset printing is schematically illustrated in Fig. 1.1.
Figure 1.1 Principle of offset printing, showing: a) supply of ink and fountain solution (fount) to one printing unit, b) offset of the image to print media via the blanket, c) a four-colour press consisting of four units as described in a) and b).
The ink is transported from the ink fountain, via a train of inking roller nips until finally reaching the forme rollers, plate cylinder, blanket cylinder and print media. On its way through the distribution train, the highly viscous ink film is sandwiched between the contacting roller surfaces and becomes progressively thinner by film splitting. The ink is then transferred from the forme roller to the image-holding plate cylinder, which then transfers the image to the print media, e.g. paper, via the blanket cylinder. The fountain solution plays a central role in keeping the non-image area of the plate clean from ink through the lithographic principle, i.e. by means of a hydrophilic non-image area and a lipophilic image area in the same plane on the plate. Printing is made possible by the
1
INTRODUCTION
establishment of a dynamic balance with fountain solution both as free water and partly emulsified in the ink. The ink-fount balance is thus crucial for the flow behaviour of the ink and its ability to transfer to the substrate via the blanket.
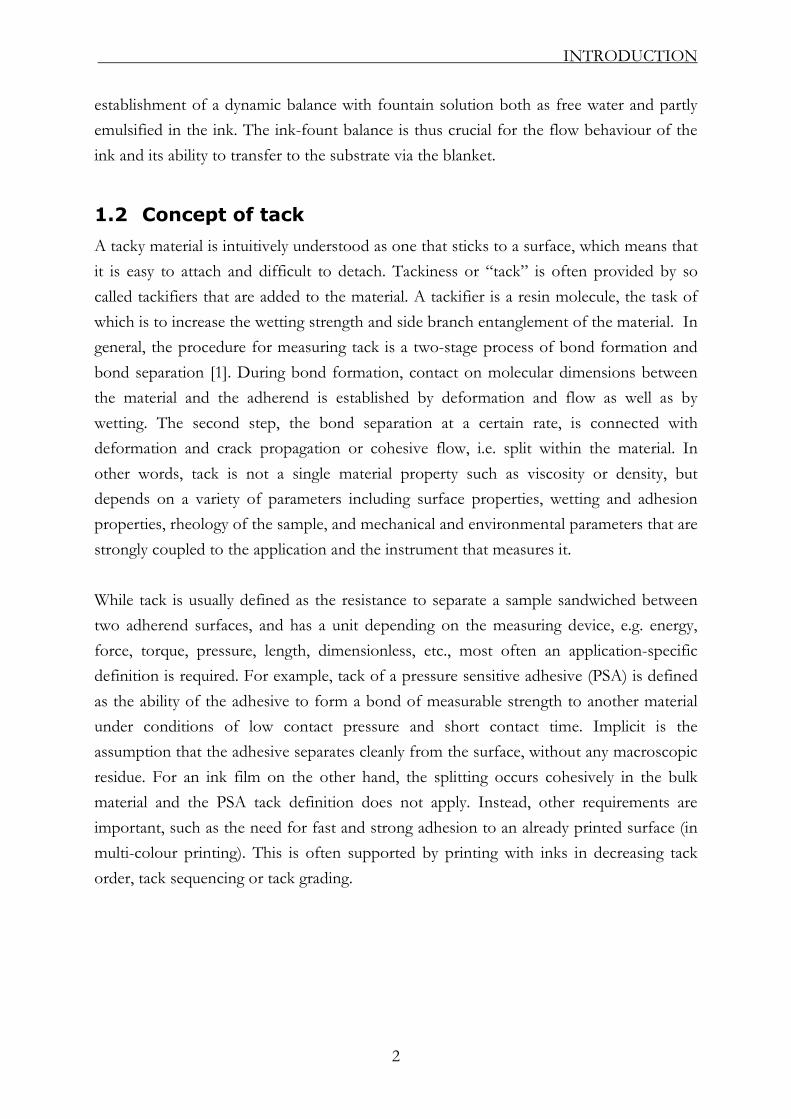
1.2 Concept of tack
A tacky material is intuitively understood as one that sticks to a surface, which means that it is easy to attach and difficult to detach. Tackiness or “tack” is often provided by so called tackifiers that are added to the material. A tackifier is a resin molecule, the task of which is to increase the wetting strength and side branch entanglement of the material. In general, the procedure for measuring tack is a two-stage process of bond formation and bond separation [1]. During bond formation, contact on molecular dimensions between the material and the adherend is established by deformation and flow as well as by wetting. The second step, the bond separation at a certain rate, is connected with deformation and crack propagation or cohesive flow, i.e. split within the material. In other words, tack is not a single material property such as viscosity or density, but depends on a variety of parameters including surface properties, wetting and adhesion properties, rheology of the sample, and mechanical and environmental parameters that are strongly coupled to the application and the instrument that measures it. While tack is usually defined as the resistance to separate a sample sandwiched between two adherend surfaces, and has a unit depending on the measuring device, e.g. energy, force, torque, pressure, length, dimensionless, etc., most often an application-specific definition is required. For example, tack of a pressure sensitive adhesive (PSA) is defined as the ability of the adhesive to form a bond of measurable strength to another material under conditions of low contact pressure and short contact time. Implicit is the assumption that the adhesive separates cleanly from the surface, without any macroscopic residue. For an ink film on the other hand, the splitting occurs cohesively in the bulk material and the PSA tack definition does not apply. Instead, other requirements are important, such as the need for fast and strong adhesion to an already printed surface (in multi-colour printing). This is often supported by printing with inks in decreasing tack order, tack sequencing or tack grading.
2
INTRODUCTION
1.3 Film splitting cavitation noise
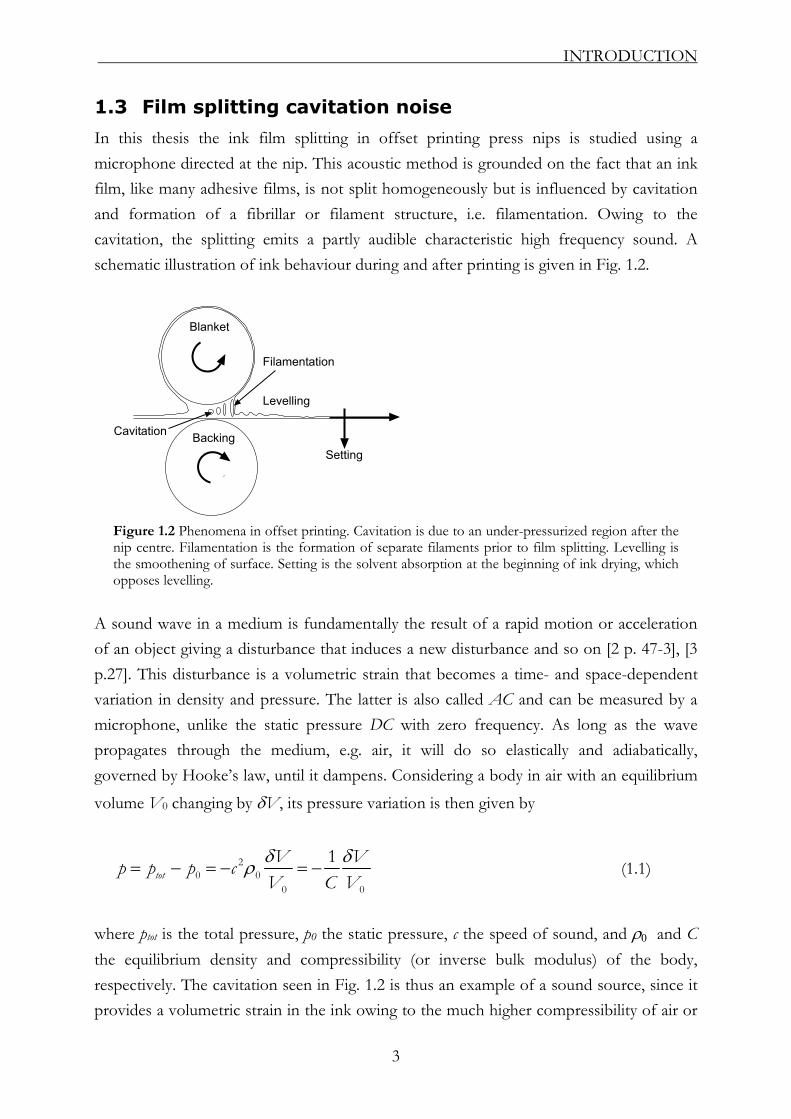
In this thesis the ink film splitting in offset printing press nips is studied using a microphone directed at the nip. This acoustic method is grounded on the fact that an ink film, like many adhesive films, is not split homogeneously but is influenced by cavitation and formation of a fibrillar or filament structure, i.e. filamentation. Owing to the cavitation, the splitting emits a partly audible characteristic high frequency sound. A schematic illustration of ink behaviour during and after printing is given in Fig. 1.2.
Figure 1.2 Phenomena in offset printing. Cavitation is due to an under-pressurized region after the nip centre. Filamentation is the formation of separate filaments prior to film splitting. Levelling is the smoothening of surface. Setting is the solvent absorption at the beginning of ink drying, which opposes levelling.
A sound wave in a medium is fundamentally the result of a rapid motion or acceleration of an object giving a disturbance that induces a new disturbance and so on [2 p. 47-3], [3 p.27]. This disturbance is a volumetric strain that becomes a time- and space-dependent variation in density and pressure. The latter is also called AC and can be measured by a microphone, unlike the static pressure DC with zero frequency. As long as the wave propagates through the medium, e.g. air, it will do so elastically and adiabatically, governed by Hooke’s law, until it dampens. Considering a body in air with an equilibrium volume V0 changing by δV, its pressure variation is then given by
20 0
0 0
1tot
V Vp p p cV C Vδ δρ= − = − = − (1.1)
where ptot is the total pressure, p0 the static pressure, c the speed of sound, and ρ0 and C the equilibrium density and compressibility (or inverse bulk modulus) of the body, respectively. The cavitation seen in Fig. 1.2 is thus an example of a sound source, since it provides a volumetric strain in the ink owing to the much higher compressibility of air or
3

INTRODUCTION
vapour compared to ink, followed by an implosive collapse at the exit. As our experience tells us that this process sounds, the volumetric strain is obviously fast enough to propagate to the air outside the nip exit, although its noisy character reveals a high degree of complexity involved – not directly revealing the geometry of the burst of cavities, but rather a broad distribution of frequencies possibly related to the cavity dimensions or their rate of bursting. The elastic nature of sound suggests an intimate relation between the elastic portion of the ink tack energy and the sound energy emitted by non-dissipative cavitation. A quantity called “sound energy density”, E, (see Fahy [3 p.76]) which unlike the sound pressure is a conserved quantity in the absence of dissipative processes, is given by the sum of kinetic (K) and potential (U) energy densities according to
2 20
202 2
w pE K Uc
ρρ
= + = + (1.2)
Here w is the net particle velocity travelling with the sound. Since microphones only measure p and not w, not all information is obtain regarding the sound source. This loss of information about the source may also be due to obstacles and wave guides that influence the sound field before its local value is measured. Nevertheless, Eq. (1.2) provides a link between the film splitting process and the squared acoustic signal, or average power (see Section 2.2).
1.4 Aim of the study
This thesis aims to show the benefit of using an acoustic method developed to study and monitor the dynamic interaction between ink, fountain solution and substrates in offset lithography. The focus will lie on three questions, namely How does the acoustic emission from offset ink splitting depend on print variables, e.g. ink film thickness, ink-water balance, type of ink and type of substrate? What physical mechanism governs the ink splitting acoustic emission? How could this method be implemented to improve printing performance? The first question is covered by the experimental work both on laboratory and pilot scale carried out and described in the five papers summarised. To answer the second question, a conceptual model and a simplified mathematical formulation is outlined in Chapter 3
4

INTRODUCTION
and in (I). Printing performance is often directly or indirectly influenced by the dynamic variations of ink and fount feed and the corresponding ink-fount-paper interaction in the print nip, and as will be shown, the microphone has a capability to detect this variation in real time. An open and challenging question still remaining though is how to use the output of the acoustic method in a full-scale press-room environment to improve control over print quality. Some options are suggested in the last chapter dealing with recommendations for future work.
1.5 Literature review
1.5.1 Fluid film lubrication and cavitation
The study of film separation and tack dates back to Stefan’s squeeze film experiments on liquids between parallel plates [4]. The squeezing as well as the pulling of the plates (reverse squeeze) will work against a shearing (lubrication) force due to the flow parallel to the plates and the resulting pressure gradient. Reynolds [5] developed a film lubrication theory which is the basis for coating flow computations. Coating processes such as roll coating and printing, in which a liquid passes between two rotating rollers, can be classified into two important flow regions [6], namely a lubrication region located around the nip-centre and a free meniscus flow region at the nip-exit. In the meniscus region cavitation is a possibility. Dowson and Taylor [7] defined two types of cavitation: gaseous cavitation in which gas from the surroundings entrains the liquid or releases from dissolved gas, and vaporous cavitation when the liquid pressure becomes lower than the vapour pressure of some component and causes its boiling. Much computation has been performed since then using elasto-hydrodynamic models for bearing, coating and printing nips, see e.g. [8], [9], [10],[11]. A special concern has been the mechanism of “ribbing” instability at the meniscus, in which a sinusoidal pattern appears on the film surface. Ribbing occurs if the pressure gradient in the meniscus region caused by either viscous or inertial forces is too high [12]. Computations involving the non-Newtonian property of the ink were carried out by Lim et al. [13]. Recently, Cioc [14] presented an algorithm using a space-time volume element method accounting for discontinuities and free boundaries involved in cavitation of bearings, which previously needed to be treated separately by matching the lubrication and meniscus regimes [15].
5

INTRODUCTION
1.5.2 Filamentation and cavitation of ink films
Sjodahl [16] showed that film splitting produces filaments at the nip exit and suggested it to be due to sub-ambient cavitation. This was later postulated by Banks and Mill [17] in a bubble expansion film splitting theory, where they explain the deviation from Stefan’s law by the onset of cavitation before fully hydrodynamic extension of the film. Myers et al. [18] later observed, using a high speed camera, cavitation at a critical speed for model dispersions. At the inception of cavitation, the reversed flow due to suction of fluid into the formed cavities was also visualised. Coveney [19] imaged cavitation between immersed rollers and found a bean-like deformation at the nip exit, as similarly found by Knapp, Daily et al. [20]. By measuring the difference in temperature over the nip of two immersed cylinders Coveney [19 p.(VII)4] discovered a drop in temperature, when cavitation occurred, from the normally increasing viscous flow temperature. Ozogan and Young [21] used Coveney’s discovery to study cavitation in opaque inks. For transparent mineral oils, the onset of cavitation on increasing speed had already been shown to involve formation of a bubble row and a small increase in temperature to a stable level. At higher speed the temperature increased to a new stable level with air fingers and travelling bubble clouds observed. The opaque inks exhibited the same temperature steps, supporting the occurrence of cavitation, but also an oscillating behaviour in the first step indicating that bubbles passed from stable to transient behaviour. Although, cavitation (either gaseous or vaporous) is a requirement for the filamentation observed during film splitting, the mechanism dictating cavitation inception is not known for sure. Owing to the availability of air, which is pumped into the nip while printing and dissolved during ink manufacturing, gaseous cavitation cannot be excluded. This air-pumping mechanism is discussed by Voet [22 p. 436] to explain why reduced ambient pressure did not cause any effect on cavitation between the rollers of a device called Discone while it did increase the tack measured on the Inkometer. Voet argues that cavitation in the Discone is caused mainly by entrainment of air induced by a pressure gradient, whereas for the Inkometer a sliding motion squeezes out the film cavities giving with the extra pressure gradient a higher nip contact area. Taylor and Zettlemoyer [23], in explaining asymmetric film splitting, also suggested that shear thinning and higher temperature in the nip reduced the cohesive strength in favour of cavitation closer to the paper. Later studies addressed cavitation nucleation at paper surface asperities [24] and air entrainment at the nip entrance [25] as that proposed by Voet. In contrast to Banks and Mill [17], Voet and Geffken [26] and Erb and Hanson [27]
6

INTRODUCTION
showed that viscoelasticity in filament elongation, due to presence of medium- or long-chain molecules, contributes much more to the total tack energy than cavity expansion does. Later, the importance of elasticity has been confirmed, for example Oittinen [28] showed that more elastic inks could be less tacky, which could be explained by the Scott model of a power law fluid, see [4 pp. 91-119]. De Grâce et al. [29] investigated filament elongation in a print nip, and found that filaments broke further from the nip at higher ink loads and closer to the nip at higher speeds, which supports this elasticity effect upon decreasing the tack if elongation more than lubrication determines the tack energy. Also Amari et al. [30] observed, by CCD image camera, shorter filament residues after film splitting at higher rotation speed of a pair of laboratory rollers. Increasing speed also broadens the filament distribution [31, 32]. Recently, Ercan [33] photographed filaments in a laboratory inking unit nip and filament residues from a laboratory print tester and compared to rheological and cavitation tensile tests on different liquids and inks, showing that filament average volume and size distribution increased with film thickness and print speed. Although the ink rheology, filamentation and cavitation scaled in a complicated manner, elasticity was in some cases found to decrease the filament length at the nip exit. As showed by e. g. Tanner [34 p. 323] a linear viscoelastic Maxwell-element squeeze-film model, that can be used instead of the Stefan model while still in the lubrication regime, predicts a tack response beginning from zero, which, in agreement with Oittinen, De Grâce et al. and Ercan, not necessarily attains the corresponding purely viscous tack if dissipation is high. High dissipation in a confined geometry corresponds to a low cohesion, or a high degree of cavitation, although this would diverge from the prescribed radial geometry in this Maxwell model and necessitate numerical methods. The pure elongational behaviour after the squeezing action has received a more central role in adhesive research [35] than for inks [36], much due to the higher tack energy during fibrillation of a PSA than an ink. Some principle findings could however be relevant for print nip cavitation. A work by Creton and Lakrout [37] discussed the different failure criteria of an adhesive, showing that a thin confined layer more likely formed new cavities whereas thicker layers tended to extend the cavities once formed. Chikina and Gay [38], in explaining the observed fingering or foam structure during film expansion, presented a bubble expansion model for a viscoelastic PSA, a similar approach to that of Banks and Mill [17]. A contact mechanical theory to explain the same phenomenon has been established by the Shull group, [39].
7
INTRODUCTION
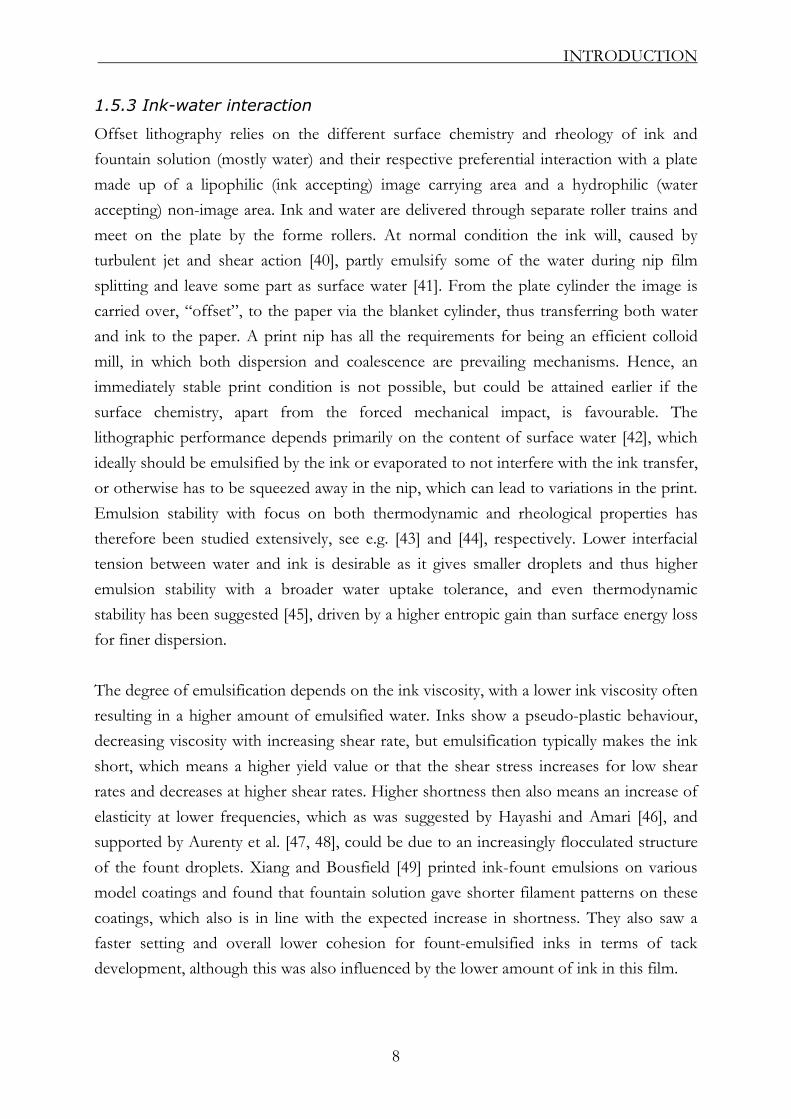
1.5.3 Ink-water interaction
Offset lithography relies on the different surface chemistry and rheology of ink and fountain solution (mostly water) and their respective preferential interaction with a plate made up of a lipophilic (ink accepting) image carrying area and a hydrophilic (water accepting) non-image area. Ink and water are delivered through separate roller trains and meet on the plate by the forme rollers. At normal condition the ink will, caused by turbulent jet and shear action [40], partly emulsify some of the water during nip film splitting and leave some part as surface water [41]. From the plate cylinder the image is carried over, “offset”, to the paper via the blanket cylinder, thus transferring both water and ink to the paper. A print nip has all the requirements for being an efficient colloid mill, in which both dispersion and coalescence are prevailing mechanisms. Hence, an immediately stable print condition is not possible, but could be attained earlier if the surface chemistry, apart from the forced mechanical impact, is favourable. The lithographic performance depends primarily on the content of surface water [42], which ideally should be emulsified by the ink or evaporated to not interfere with the ink transfer, or otherwise has to be squeezed away in the nip, which can lead to variations in the print. Emulsion stability with focus on both thermodynamic and rheological properties has therefore been studied extensively, see e.g. [43] and [44], respectively. Lower interfacial tension between water and ink is desirable as it gives smaller droplets and thus higher emulsion stability with a broader water uptake tolerance, and even thermodynamic stability has been suggested [45], driven by a higher entropic gain than surface energy loss for finer dispersion. The degree of emulsification depends on the ink viscosity, with a lower ink viscosity often resulting in a higher amount of emulsified water. Inks show a pseudo-plastic behaviour, decreasing viscosity with increasing shear rate, but emulsification typically makes the ink short, which means a higher yield value or that the shear stress increases for low shear rates and decreases at higher shear rates. Higher shortness then also means an increase of elasticity at lower frequencies, which as was suggested by Hayashi and Amari [46], and supported by Aurenty et al. [47, 48], could be due to an increasingly flocculated structure of the fount droplets. Xiang and Bousfield [49] printed ink-fount emulsions on various model coatings and found that fountain solution gave shorter filament patterns on these coatings, which also is in line with the expected increase in shortness. They also saw a faster setting and overall lower cohesion for fount-emulsified inks in terms of tack development, although this was also influenced by the lower amount of ink in this film.
8
INTRODUCTION
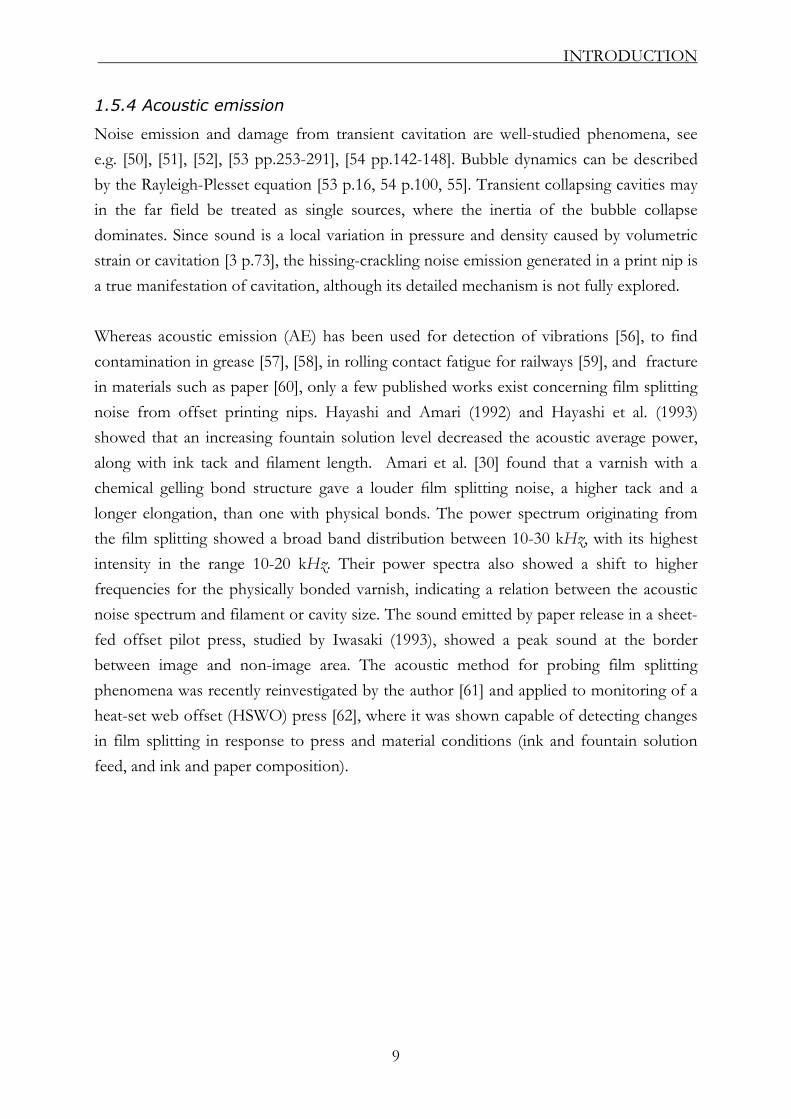
1.5.4 Acoustic emission
Noise emission and damage from transient cavitation are well-studied phenomena, see e.g. [50], [51], [52], [53 pp.253-291], [54 pp.142-148]. Bubble dynamics can be described by the Rayleigh-Plesset equation [53 p.16, 54 p.100, 55]. Transient collapsing cavities may in the far field be treated as single sources, where the inertia of the bubble collapse dominates. Since sound is a local variation in pressure and density caused by volumetric strain or cavitation [3 p.73], the hissing-crackling noise emission generated in a print nip is a true manifestation of cavitation, although its detailed mechanism is not fully explored. Whereas acoustic emission (AE) has been used for detection of vibrations [56], to find contamination in grease [57], [58], in rolling contact fatigue for railways [59], and fracture in materials such as paper [60], only a few published works exist concerning film splitting noise from offset printing nips. Hayashi and Amari (1992) and Hayashi et al. (1993) showed that an increasing fountain solution level decreased the acoustic average power, along with ink tack and filament length. Amari et al. [30] found that a varnish with a chemical gelling bond structure gave a louder film splitting noise, a higher tack and a longer elongation, than one with physical bonds. The power spectrum originating from the film splitting showed a broad band distribution between 10-30 kHz, with its highest intensity in the range 10-20 kHz. Their power spectra also showed a shift to higher frequencies for the physically bonded varnish, indicating a relation between the acoustic noise spectrum and filament or cavity size. The sound emitted by paper release in a sheet-fed offset pilot press, studied by Iwasaki (1993), showed a peak sound at the border between image and non-image area. The acoustic method for probing film splitting phenomena was recently reinvestigated by the author [61] and applied to monitoring of a heat-set web offset (HSWO) press [62], where it was shown capable of detecting changes in film splitting in response to press and material conditions (ink and fountain solution feed, and ink and paper composition).
9

METHODS AND MATERIALS
2 METHODS AND MATERIALS
2.1 Acoustic recording
The principle of the acoustic recording performed in this work is illustrated in Fig. 2.1. The microphone comprised a high level 1/4-inch condenser microcapsule of type 40BE (G.R.A.S ®), with its preamplifier connected to a power supply.
Figure 2.1 Flow chart of the acoustic measurement system.
Digital sampling was performed by a computer coupled to an external analogue digital converter (ADC) manufactured by Data Translation. The detectable frequency range was 10 Hz-50 kHz, with the upper limit set by the sampling rate of 100 kHz, and a sound pressure level (SPL) range of 40-168 dB relative to the 20 µPa audible limit. Using LabView® (National Instruments) and DTLV-Link® (Data Translation), the signal was sampled at a rate of 100 kHz into buffers of 0.1 s that were concatenated into larger recordings. The raw data, in (Volts), was converted back to pressure (Pa) from the microphone’s known sensitivity of 3.92 mV/Pa.
2.2 Signal processing
2.2.1 Average power
As the microphone measures the sound pressure variation p, it will hence give an estimate of the potential energy of the sound (see Eq. (1.2) in Chapter 1.3). By a common convention [63 p.6], a squared signal quantity has the unit of “energy”, as roughly motivated by Eq. (1.2). The sum of all squares in a finite sequence of samplings divided by the number of points N in this sequence is the mean square, or the average, power
10

METHODS AND MATERIALS
12
0
1 N
a rmsk
P p pN
−
=
= = ∑ 2k (2.1)
where prms denotes the root-mean-square sound pressure equal to AC if DC is zero. Average power calculated by Eq. (2.1) is, in the results provided in Chapter 4, usually converted to sound pressure level (SPL) in dB unit as follows
10 105(d ) 20 log 10 log2 10 4 10
rms ap PSPL B −= =⋅ ⋅ 10− (2.2)
The use of the decibel scale originates from its resemblance to the human means of hearing. However, here it is merely used as a convenient way of displaying a wide range of power values in one and the same graph, and to represent results by numbers that can be intuitively understood.
2.2.2 Power spectral density
The power in Eq. (2.1) can also be calculated in the frequency domain according to Parseval’s theorem [64 pp.504, 551]
n (2.3)
Here ∆f is the frequency bin and PSD is the one-sided power spectral density (power normalised to 1 Hz bandwidth) defined according to [64 p.504]
/2
0
N
an
P f PSD=
= ∆ ∑
22
1
0
2 1 12
1 exp( 2 / ) 0... 1
n n
N
n kk
n nn
s
NS X nN
X p ik n N n NN
S NSPSDf f
π−
=
= ≤ ≤ −
= − =
= =∆
∑ − (2.4)
where Sn is the one-sided power spectrum, fs the sampling rate (here 100 kHz) and X the two-sided discrete Fourier transform (DFT) calculated by the Fast Fourier Transform (FFT) [64 pp.504-510]. For the endpoint frequencies, n = 0 (i.e. corresponding to DC) and N/2 (the so-called Nyquist frequency), the power spectrum definition in Eq. (2.4) is
11

METHODS AND MATERIALS
halved, although they could also both be omitted due to their minor contribution. Different conventions exist, however the PSD in Eq. (2.4) maintains the magnitude of the spectrum for any value of N. PSD is also mostly represented on a dB-scale according to Eq. (2.2).
2.2.3 Average frequency
The spectral distributions were analysed both visually and quantitatively from an average frequency fa, here defined as the expectation value
/2 /2
0 0
N N
a nn n
nf PSD n f PSD= =
= ∆∑ ∑ (2.5)
Note that depending on the characteristics of the spectrum, the average frequency is a rather rough measurement, which will be seen later when applying it to broad noisy spectra. Mathematically, it gives the most expected value from a set of possible frequencies, but could miss detailed information at other frequencies. If there is a particular range of importance in the spectrum, that range should be band pass filtrated (see below) prior to using Eq. (2.5).
2.2.4 Filtration and time matching
When calculating the average power or frequency with Eq. (2.1) and (2.3), respectively, a time window filter can be multiplied with the signal, while selecting N samples from it. These windows can be rectangular, having either a value one (selecting) or zero (non-selecting), or functional, e.g. Hann, Hamming, etc, having smoothed edges to reduce aliasing when e.g. Fourier transforming. The time window may be large, say 1 s (N=100 000), and then used to calculate a single averaged value from this, or it can be smaller, e.g. N=1000, and slid forward in time with overlap, typically 50%, to then give a power-time or frequency-time evolution plot (moving or running average). All these filters are low-pass, smoothing and decimating filters, which cut off high frequencies and reduce white noise and number of samples, and thus can efficiently reveal patterns in power-time or frequency-time signals (see sections 2.2.1, 2.2.3). Time windowing also reduces the processor time, since it uses less memory at a time for sub-calculations as compared to when processing the entire array in one step. The same principle can be used to reduce white noise in the PSD. In the Welch method (Welch 1967), a signal is divided into a number (e.g. 10) of 50% overlapping sub-signals,
12

METHODS AND MATERIALS
followed by Hann-window multiplication of each sub-signal, calculation of PSD for each, and finally addition of all PSD’s to give one spectrum. To exclude unwanted low frequency noise (e.g. from printing press machinery) and 1/f noise [65 p.172], and to enhance the broad band ink splitting sound, the spectral analysis gives information about suitable high pass cut-off frequencies. This choice of cut-off varied among the applications presented in Chapter 4 in the range between 2-30 kHz. Selective frequency filtration was performed either in the time or frequency domain by convolution or multiplication, respectively, where multiplication in the frequency domain is more accurate and comprehensive. In order to batch analyse several recordings from an experiment, it is easier if these recordings are in phase. This can be done either by trigger the sampling externally as was done for the heat-set trials in (III). Alternatively, as was done in all other experiments, one can use a method of pattern recognition in which one sample array is cross correlated with a reference array. The resulting array from the cross correlation function then gives a maximum at the index of relative time shift between these two analysed arrays. Since cross correlation is computationally time expensive for large arrays, it is rather performed between pairs of the running average power, as described above, than between raw signals, and the processor time is then no longer a matter. Due to some variation in the signal over longer times, the pattern recognition may sometimes fail. This could be cured by a low-pass filter but sometimes a high-pass filter works best if there is a lot of low frequent non-periodic machinery noise in the signal.
2.2.5 Aliasing errors
According to the Nyquist and Shannon rule [64 p.500], the sampling rate has to be at least twice the sampled frequency band in order for it to be accurately reconstructed. Otherwise, frequency content that is higher than half the sampling rate (Nyquist frequency) will fold back as false aliases in the studied frequency domain. Thus if the analogue signal is not low pass filtered before being digitilised, the obtained spectrum after DFT will be contaminated and there is usually no cure for this. Alternatively, one may assume that higher frequencies are of minor importance, which can be justified if the PSD appears to decrease in the high frequency range. In this work, no anti-aliasing filter was used, although the aliasing is expected to be considerable in some cases. For the purpose of relative measurements of total signal power above a specific frequency, say 5 kHz, this is not a serious matter, as most of that power (except for a minor noise fraction)
13

METHODS AND MATERIALS
comes from the film splitting, although it may have its real origin above 50 kHz. One could imagine for example that the trend in average frequency is mirrored if the highest power lies near the Nyquist frequency.
2.3 Laboratory methods and materials
2.3.1 Ink roller distribution and printing on test strips
Methods
The inking unit (IGT AE, IGT Testing Systems) used in the experiments in (I) and shown in Fig. 2.2a, consists of a large aluminium cylinder at the front, that moves sideways, a small motor-driven aluminium cylinder at the back, and a polyurethane-coated top roller. The surface speed of the rollers is 0.17 m/s. A microphone was clamped in close proximity to the nip, central and perpendicular to its cylinder axis. Pre-weighed amounts of the inks, varied in the broad range from 0.5 to 100 g/m2, were evenly applied to the top roller and subsequently distributed over the full width of the roller and cylinders. On attainment of an even distribution, the acoustic signal at the nip exit was monitored over a period of 1 s. Several recordings were made over a longer duration (1 min.) to verify that the sound pressure level was stable within limits. The same procedure was repeated after adding more ink to the roller.
a) b) Figure 2.2 Principle illustration of acoustic monitoring of film splitting a) on the ink distributor unit (IGT AE) and b) during printing, also illustrating the pull-off testing instrument (ISIT). The former also possesses an extra distribution roller at the back (not shown), and a small print roller that is inked and then mounted on the printing unit.
A pre-determined amount of the ink, distributed on the rollers of the IGT unit, was
14

METHODS AND MATERIALS
uniformly transferred to a smaller roller, or print disc, then mounted on the laboratory printing unit (see Fig. 2.2b). In particular, the printing unit on the Ink Surface Interaction Tester (ISIT, SeGan Ltd) [66] was used for this purpose. The ink on the print disc is applied during a single rotation to a paper strip mounted using double-sided tape on the circumference of a larger cylinder. The nip pressure was set to 800 N, the printing speed to 0.5 m/s, and the transferred ink amount stepped from 1 up to 5 g/m2. The microphone was mounted close to the exit of the nip between print disc and paper-bearing cylinder, to record the sound during the ink splitting and transfer. In separate experiments, not involving acoustic measurement, the ISIT was operated in its standard mode in order to measure, at preset times after printing, the “tack” force necessary to separate a rubber tack disc placed in contact with the printed area.
Materials
The two inks used were commercial cyan sheet-fed offset inks, Toplith and Ecolith (Sun Chemical), with their vehicle based on mineral and vegetable oil, respectively. The two papers were a matte and glossy commercial grade of coated fine paper (115 g/m2), of identical composition, only distinguished by the degree of calendering. The 75° sheet gloss, measured with a ZGM 1022 glossmeter (Zehntner GmbH Testing Instruments) as the average at five locations, is 80 and 17% for the glossy and matte papers, respectively.
2.3.2 Tack on paper and ink-water interaction
Methods
The Prüfbau Deltack, shown in Fig. 2.3a and used in (II), provides a laboratory-scale printing simulation. The unique advantage of this instrument over other laboratory printing equipment is that it also measures the force required to split the ink film at the exit of the printing nip. It consists of a large printing cylinder and two printing stations to the left and right, upon which the smaller inked rubber formes are loaded. Either or both of the formes can be used for printing. The paper samples used are 290 mm x 52 mm (with print area 190 mm x 49 mm) and are prepared for measurement by punching holes in their tape-reinforced ends. The sample is attached to the printing cylinder by pegs, one of which is connected to a sensitive force transducer. At the exit of the printing nip, the paper adheres temporarily to the ink film on the rubber printing forme before being pulled off by the tensile force developed in the paper strip. It is this tensile force that is measured by the instrument as the tack force. The measurable force range is 0.1-7 N, and the printing speed range is 0.5-4 m/s.
15
METHODS AND MATERIALS
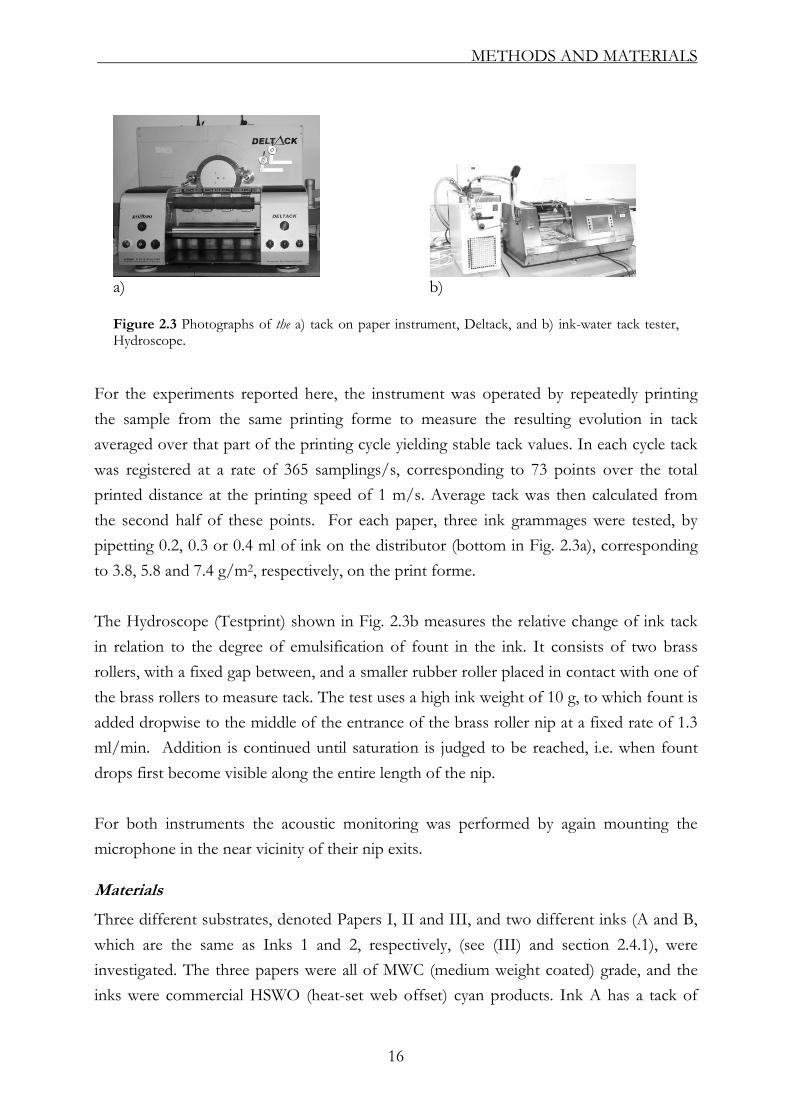
a) b) Figure 2.3 Photographs of the a) tack on paper instrument, Deltack, and b) ink-water tack tester, Hydroscope.
For the experiments reported here, the instrument was operated by repeatedly printing the sample from the same printing forme to measure the resulting evolution in tack averaged over that part of the printing cycle yielding stable tack values. In each cycle tack was registered at a rate of 365 samplings/s, corresponding to 73 points over the total printed distance at the printing speed of 1 m/s. Average tack was then calculated from the second half of these points. For each paper, three ink grammages were tested, by pipetting 0.2, 0.3 or 0.4 ml of ink on the distributor (bottom in Fig. 2.3a), corresponding to 3.8, 5.8 and 7.4 g/m2, respectively, on the print forme. The Hydroscope (Testprint) shown in Fig. 2.3b measures the relative change of ink tack in relation to the degree of emulsification of fount in the ink. It consists of two brass rollers, with a fixed gap between, and a smaller rubber roller placed in contact with one of the brass rollers to measure tack. The test uses a high ink weight of 10 g, to which fount is added dropwise to the middle of the entrance of the brass roller nip at a fixed rate of 1.3 ml/min. Addition is continued until saturation is judged to be reached, i.e. when fount drops first become visible along the entire length of the nip. For both instruments the acoustic monitoring was performed by again mounting the microphone in the near vicinity of their nip exits.
Materials
Three different substrates, denoted Papers I, II and III, and two different inks (A and B, which are the same as Inks 1 and 2, respectively, (see (III) and section 2.4.1), were investigated. The three papers were all of MWC (medium weight coated) grade, and the inks were commercial HSWO (heat-set web offset) cyan products. Ink A has a tack of
16
METHODS AND MATERIALS
150, measured by Tackoscope for 2 min, and viscosity of 12 Pas from a Haake rheometer at shear rate 1000 s-1. The corresponding tack and viscosity values for Ink B are 110 and 10 Pas, respectively. Ink B is more hydrophilic (relative to the standard Ink A) and thus has a greater tendency to emulsify fount. The fount for the Hydroscope measurements was made by adding to water 3.5% of a commercial concentrate and 4% IPA (isopropanol).
2.4 Pilot methods and materials
2.4.1 Heat-set web offset printing
Methods
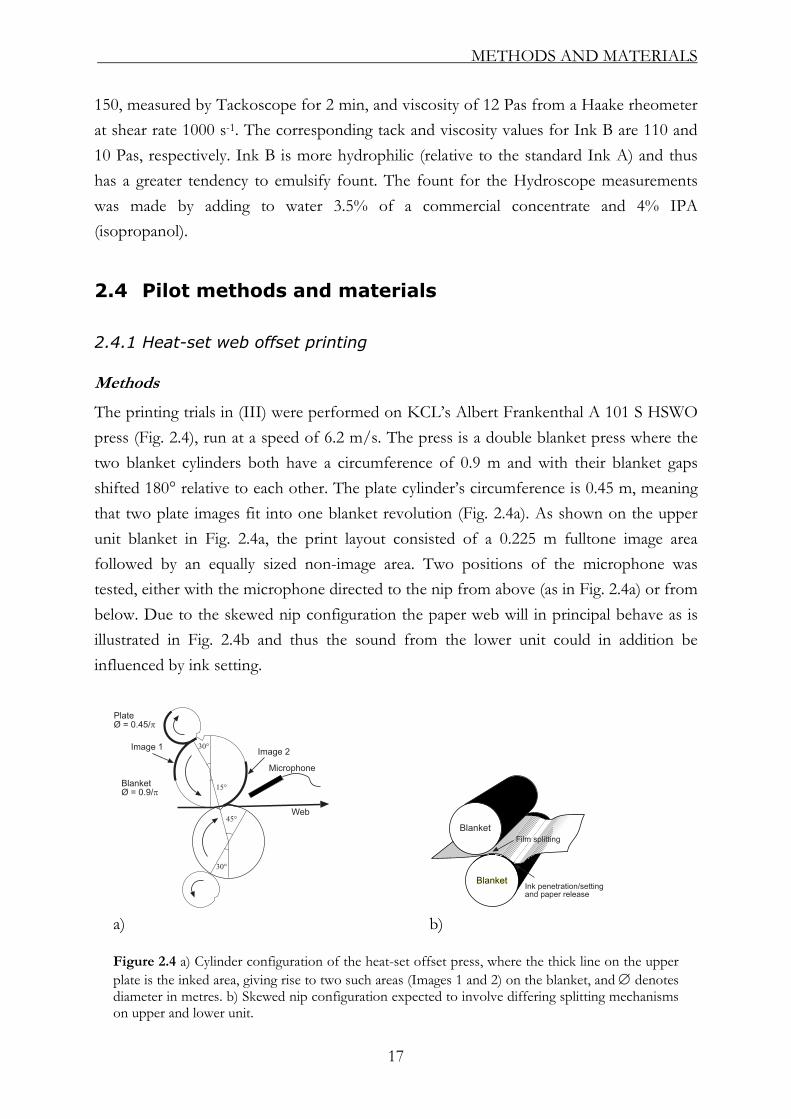
The printing trials in (III) were performed on KCL’s Albert Frankenthal A 101 S HSWO press (Fig. 2.4), run at a speed of 6.2 m/s. The press is a double blanket press where the two blanket cylinders both have a circumference of 0.9 m and with their blanket gaps shifted 180° relative to each other. The plate cylinder’s circumference is 0.45 m, meaning that two plate images fit into one blanket revolution (Fig. 2.4a). As shown on the upper unit blanket in Fig. 2.4a, the print layout consisted of a 0.225 m fulltone image area followed by an equally sized non-image area. Two positions of the microphone was tested, either with the microphone directed to the nip from above (as in Fig. 2.4a) or from below. Due to the skewed nip configuration the paper web will in principal behave as is illustrated in Fig. 2.4b and thus the sound from the lower unit could in addition be influenced by ink setting.
a) b) Figure 2.4 a) Cylinder configuration of the heat-set offset press, where the thick line on the upper plate is the inked area, giving rise to two such areas (Images 1 and 2) on the blanket, and ∅ denotes diameter in metres. b) Skewed nip configuration expected to involve differing splitting mechanisms on upper and lower unit.
17
METHODS AND MATERIALS
Materials
The same inks (A and B) as in II (see section 2.3.2) were used, with their names changed to 1 and 2, respectively. The fountain solution was non-alcoholic and at pH 4.7. Table 1 in (III) shows the properties of the six LWC-type model papers used, denoted Papers 1, 2, 3, 4, 5, 7. Some trial points also used a commercial LWC paper A (70 g/m2).
2.4.2 Sheet-fed offset printing
Methods
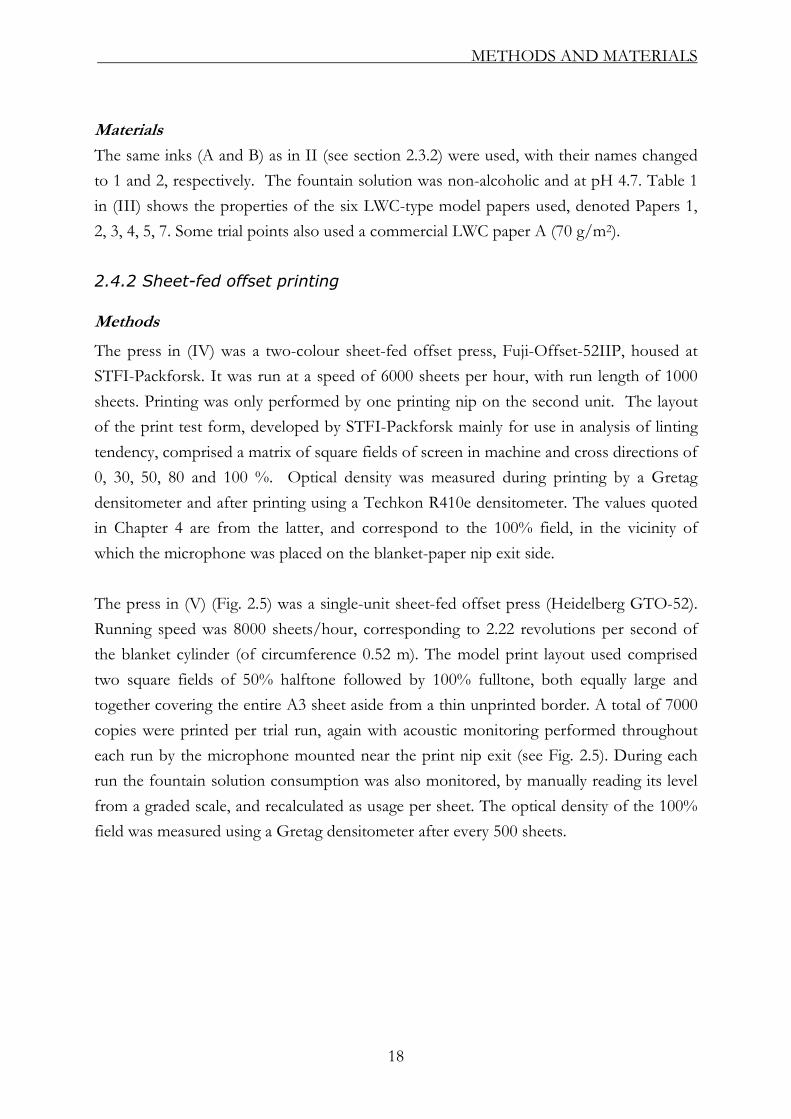
The press in (IV) was a two-colour sheet-fed offset press, Fuji-Offset-52IIP, housed at STFI-Packforsk. It was run at a speed of 6000 sheets per hour, with run length of 1000 sheets. Printing was only performed by one printing nip on the second unit. The layout of the print test form, developed by STFI-Packforsk mainly for use in analysis of linting tendency, comprised a matrix of square fields of screen in machine and cross directions of 0, 30, 50, 80 and 100 %. Optical density was measured during printing by a Gretag densitometer and after printing using a Techkon R410e densitometer. The values quoted in Chapter 4 are from the latter, and correspond to the 100% field, in the vicinity of which the microphone was placed on the blanket-paper nip exit side. The press in (V) (Fig. 2.5) was a single-unit sheet-fed offset press (Heidelberg GTO-52). Running speed was 8000 sheets/hour, corresponding to 2.22 revolutions per second of the blanket cylinder (of circumference 0.52 m). The model print layout used comprised two square fields of 50% halftone followed by 100% fulltone, both equally large and together covering the entire A3 sheet aside from a thin unprinted border. A total of 7000 copies were printed per trial run, again with acoustic monitoring performed throughout each run by the microphone mounted near the print nip exit (see Fig. 2.5). During each run the fountain solution consumption was also monitored, by manually reading its level from a graded scale, and recalculated as usage per sheet. The optical density of the 100% field was measured using a Gretag densitometer after every 500 sheets.
18
METHODS AND MATERIALS
Figure 2.5 Heidelberg GTO-52 sheet-fed offset press. The microphone was mounted on the tripod in the same manner as the camera is in this photograph.
Materials
The paper used in (IV) was a standard commercial newsprint grade, supplied by Stora Enso, of basis weight 45 g/m2, cut into A3 sheets and printed on the topside. The ink was a commercial coldset offset yellow ink for newsprint, supplied by Sun Chemical. A yellow ink was chosen to allow easier identification and quantification of lint particles on the blanket. The inks for the Hydroscope experiments and printing trials in (V) were all coldset test newsprint black inks supplied by Toyo. In particular, the Hydroscope experiments used two such inks, labelled Ink C and D, of tack 6 and 9, respectively, while the printing trials used another two samples, Ink A and B, of tack 4 and 13.5, respectively (not to be confused with those inks used in (II)). These tack numbers were obtained from Inkometer measurements performed by the supplier. The fountain solution used together with these inks in all experiments and trials in (V) was 5% Eurofount H (DS Chemport, Australia). The paper for the printing trials was A3 cut sheets of Norstar (Norske Skog), an improved newsprint of grammage 52 g/m2 with ISO brightness 74, containing 5-8% filler. This batch of Norstar was produced in a horizontal gap former, with its bottom side (facing downwards) receiving the print in the trials.
19

MODELLING
3 MODELLING
Geometrical assumptions
A model for ink roller nip cavitation, suggested in (I), will be clarified here. Since the pressure becomes negative (i.e. below atmospheric) on the exit side of the nip due to the diverging geometry and the viscoelastic and capillary resistance of the ink, there is a driving force for cavitation that could be governed either by air entrainment, degassing of dissolved air or evaporation of the ink solvent. As the cavities expand, they will eventually rupture at the ink-air surface while emitting sound pressure. An analytical approximate treatment of this problem requires a simplified geometry. The roller cylinder axis (y-direction) is divided into Nc groups according to Fig. 3.1a, each containing a spherical bubble that starts its expansion at t0 from some initial size r0 at a position close to the nip centre finally reaching a maximum size rM when it implodes. During the expansion the bubble is separated from the air by an ink filament with “tack height” D, and a meniscus front positioned at “tack length” L from the nip centre. At bubble implosion the meniscus front has reached the maximum tack length LM and maximum tack height DM. It is clear that this rupture opens up a hole that will be built up again as the cylinder or roller continues to rotate. Therefore the bubble expansion and implosion is repeated with a frequency 1/tM Hz. Note that in a more realistic situation of several coexisting smaller (elongated) bubbles, the discontinuous jump between ruptures would be smaller and L more or less constant. A number of other factors will not be considered either, for example interference of sound sources, sound scattering at the ink-air interface and wave guiding through the nip. Consider the volume element in Fig. 3.1b. After a time t the roller has rotated a “tack angle” φ and the ink mass m = 4rMhφR has crossed the nip centre. As there is no
accumulation in the nip, the mass on both sides of the nip contained within the angle φ has to equal this mass m. For an incompressible ink, the volume expansion on the exit side will be compensated by a combination of cavitation, meniscus formation and deformation of the resilient roller surface before complete rupture of the film. However, in this simplified model, all volume expansion is done by the spherical bubble and the rollers and meniscus are taken as non-deformable.
20

MODELLING
a)
b) Figure 3.1 a) Top view of roller cylinder axis (y) divided into Nc volume elements (bubble groups). A bubble grows at roller speed u for r < rM and ruptures at r =rM and L=LM (tack length). b) Side view of a bubble group q at time t or tack angle φ. Note that R is the roller radius (identical for both cylinders) plus the film thickness h, while D and DM (tack height) is the vertical distance between surfaces.
It then follows that the bubble volume has to equal the volume occupied by air on the entrance side, although the corresponding pressures and air vapour masses could differ between these sides. Thus, according to Fig. 3.1b the following holds at all times
21
MODELLING
(2
22 2sin sin cos3 Mr r Rπ )φ φ φ= − − φ (3.1)
thus specifying the bubble radius as a function of tack angle, or time since φ = ut/R. As is clearly seen in Fig. 3.1b, one spherical bubble bounded by the nip geometry could not in reality obey Eq. (3.1) without being deformed or extended outside the exit region, i.e. the volume of ink is in Fig. 3.1b illustrated as larger on the exit side which was not assumed in the first place. In that sense, the spherical bubble should be seen as fictitious in order to simplify the mathematics.
Sound pressure emission from expanding bubbles
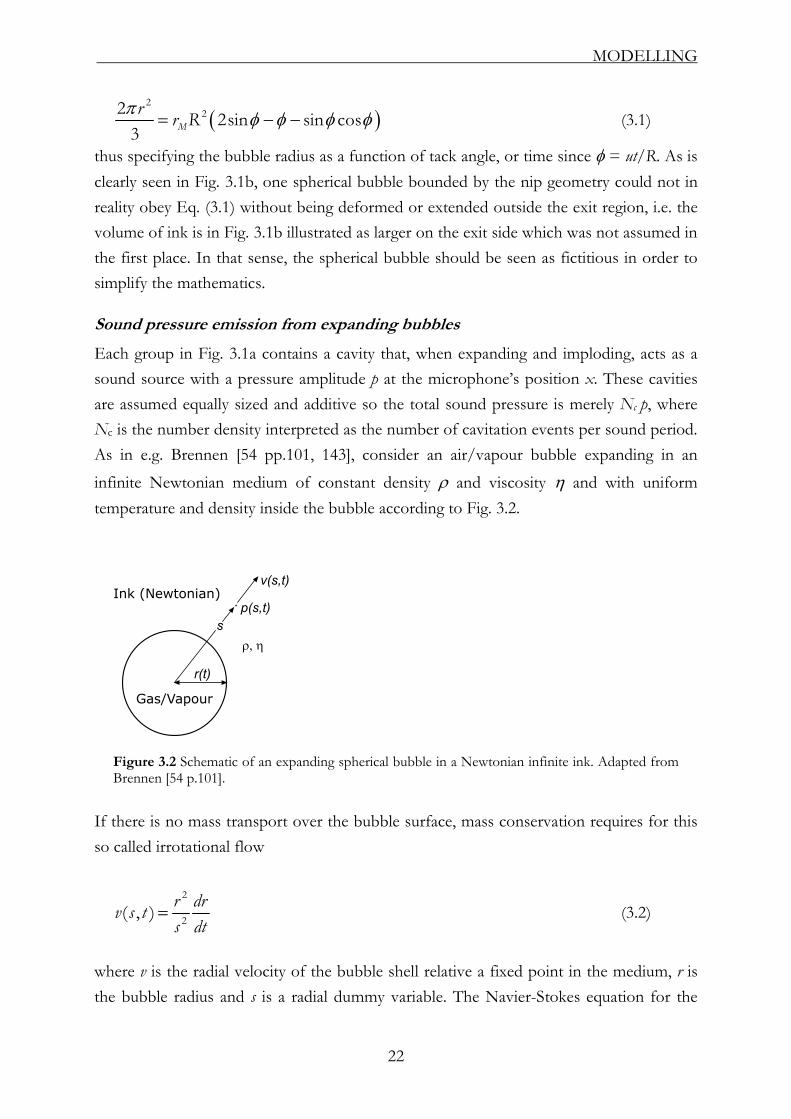
Each group in Fig. 3.1a contains a cavity that, when expanding and imploding, acts as a sound source with a pressure amplitude p at the microphone’s position x. These cavities are assumed equally sized and additive so the total sound pressure is merely Nc p, where Nc is the number density interpreted as the number of cavitation events per sound period. As in e.g. Brennen [54 pp.101, 143], consider an air/vapour bubble expanding in an infinite Newtonian medium of constant density ρ and viscosity η and with uniform temperature and density inside the bubble according to Fig. 3.2.
Figure 3.2 Schematic of an expanding spherical bubble in a Newtonian infinite ink. Adapted from Brennen [54 p.101].
If there is no mass transport over the bubble surface, mass conservation requires for this so called irrotational flow
2
2( , ) r drv s ts dt
= (3.2)
where v is the radial velocity of the bubble shell relative a fixed point in the medium, r is the bubble radius and s is a radial dummy variable. The Navier-Stokes equation for the
22

MODELLING
spherical bubble gives
22
1 2v v p v vv st s s s s s s
ρ η∂ ∂ ∂ ∂ ∂⎡ ⎤⎛ ⎞ ⎛ ⎞+ = − + −⎜ ⎟ ⎜ ⎟⎢∂ ∂ ∂ ∂ ∂⎝ ⎠ ⎝ ⎠⎣ ⎦2 ⎥ (3.3)
When the microphone is at a large distance from the nip, s will be large compared to r, so that Eqs. (3.2) and (3.3) give
4 2 22
2 5 2 2 22p r r dr r d r d drrs s s dt s dt s dt
ρρ⎡ ⎤⎛ ⎞∂ ⎛− = − + ≈ ⎜⎢ ⎥⎜ ⎟∂ ⎝ ⎠⎝ ⎠⎣ ⎦ dt
⎞⎟ (3.4)
and after integration of p with respect to s, from infinity and ambient pressure p0 to the position x at the microphone, Bernoulli’s equation follows according to
22
0 2
d dr u d dr20p r p r
x dt dt xR d dρ ρ
φ φ⎛ ⎞⎛ ⎞= + =⎜ ⎟ ⎜ ⎟⎝ ⎠ ⎝ ⎠
p+ (3.5)
where φ = ut/R. Since p0 is the static pressure, or DC component, and thus not measured by the microphone, it can here be put to zero. To integrate Eq. (3.5) one may simplify r and rM through Taylor expansions of Eq. (3.1), giving
( )1/32
3 572 20Mr Rr φ φ φ
π⎛ ⎞ ⎛= − + Ο⎜⎜ ⎟ ⎝ ⎠⎝ ⎠
⎞⎟ (3.6)
( )3/2 7/2 11/27202M M M M
Rr φ φ φπ
⎛= − + Ο⎜⎝ ⎠
⎞⎟ (3.7)
where φM is the maximum angle. Since φ ≤ φM ∼ 0.1 radian the first term in Eqs. (3.6)-(3.7) suffices and Eq. (3.5) gives the maximum pressure pM
1/32 5
22c M
MN u rp
x Rρ π⎛ ⎞
≈ ⎜ ⎟⎝ ⎠
(3.8)
which shows the physical mechanism of importance, namely that the sound pressure increases with the number of imploding cavities and their maximum size at rupture.
23
MODELLING
Sound frequency
The assumption of a continuous stream of bubbles means for the present model that a new bubble is formed directly after implosion of the previous one, which should give a pulse frequency directly linked to the size of the bubble and the rotation speed. Thus, if all bubbles were equally sized as in Fig. 3.1a and imploded simultaneously at a time lag given by the ratio of their diameter to rotation speed (2rM/u), then we would see a narrow frequency spectra shifted to higher frequencies for increasing u and decreasing rM. Not surprisingly, true spectra [52, 67] are rather broadly distributed, including a high level of noise. In situations when there is a discrete mechanical event involved, as with a propeller shaft underwater, fundamental frequencies related to the shaft rotation may still be found in these noisy spectra. More important is that even the noise may show some degree of order, e.g. cavitation from spool valves [54 p.143], gave sound spectra with a broad power contribution in the same frequency range as the natural frequencies of water bubbles, which theoretically depends inversely on the bubble radius. Lauterborne and Cramer [68] have used chaos theory to prove the existence of order in cavitation noise Now, assume that this ordered noise, despite being made up of implosions/collapses occurring more or less randomly in time, has an average frequency depending inversely on the average implosion time. Then, according to the model in Fig. 3.1, the average frequency is expected to decrease with the maximum bubble size and hence also with the tack length. However, real situations can differ from this ideal behaviour, as shown later in Fig. 4.2b, possibly in virtue of this implosive sound generation being mainly dictated by the very last moment of the bubble’s lifetime. In words, if the tack length is high the implosion becomes more rapid and energetic during the last stage of the film splitting, and thus increasing both the power and frequency of the sound. A parallel can be drawn with the so called anomalous depth effect [53 p. 256] discovered during the Second World War, when it was found that high frequency noise from sub marine propellers sometimes increased at increasing depth, which could be explained by the increasing pressure and thus faster cavity collapses at these depths. In analogy with acoustic cavitation experiments of a single cavity in water, noise emission could also originate from the complexity and non-linear behaviour of the system including multiple frequency response at harmonics as well as sub-harmonics and ultra-harmonics [53 p.115], [69-73]. However such effects remain to be proven experimentally for inks.
24
MODELLING
Filament rheology
To test experimentally the validity of Eq. (3.8), the same equation could be expressed in terms of tack height DM (see Fig. 3.1b) and film thickness h, if a rheological model is used. Assume that the outer filament in Fig. 3.1b can be simplified by a cylindrical filament extended uni-axially from a height 2h and thickness l0 to height DM and thickness l over a time tM. Using a viscoelastocapillary model for uni-axial filament extension [see e.g. 74 p.38] DM can be written as
( )2/3
0 0
22 2 exp3
//
M
M
M
D h EcDe
De tEcCa l t l
λ λση σ η
⎛ ⎞= ⎜ ⎟⎝
= = =
⎠ (3.9)
Here Ec is the elasto-capillary number [75-77], De is the Deborah number, Ca is the
capillary number, λ the longest relaxation time and σ the surface tension. It also follows from Fig. 3.1b that DM can be expressed in terms of the ratio of cavity volume to ink volume (a dimensionless cavitation volume) according to
( )2
2 / 3 23 2 e2 3
πεφ
⎛ ⎞≡ ≈ = ⎜⎝ ⎠
M M
M
r D EcR h h De
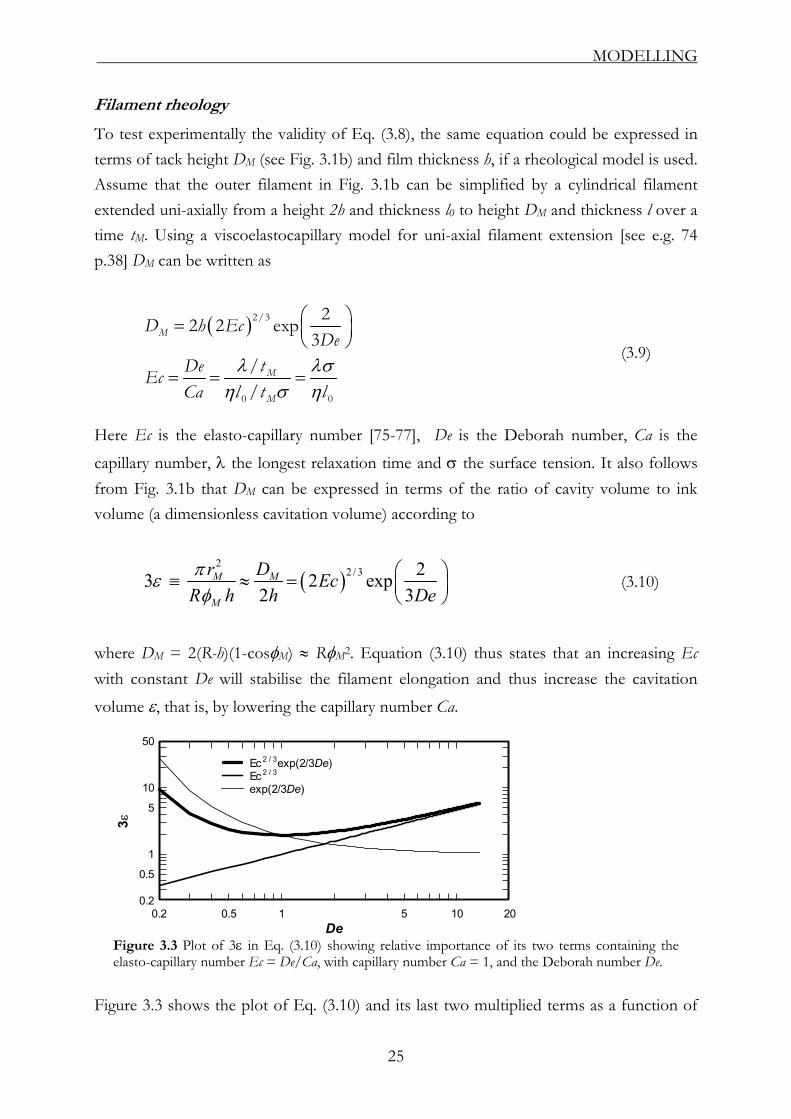
xp ⎟ (3.10)
where DM = 2(R-h)(1-cosφM) ≈ RφM2. Equation (3.10) thus states that an increasing Ec with constant De will stabilise the filament elongation and thus increase the cavitation
volume ε, that is, by lowering the capillary number Ca.
De
3ε
0.2 0.5 1 5 10 200.2
0.5
1
5
10
50
Ec 2 / 3exp(2/3De)Ec 2 / 3
exp(2/3De)
Figure 3.3 Plot of 3ε in Eq. (3.10) showing relative importance of its two terms containing the elasto-capillary number Ec = De/Ca, with capillary number Ca = 1, and the Deborah number De.
Figure 3.3 shows the plot of Eq. (3.10) and its last two multiplied terms as a function of
25

MODELLING
De keeping Ca constant. When De increases, stabilisation or strain hardening occurs for De > 1, and Ec will then dominate this elongation, whereas for De < 1 the exponential term dominates and leads to filament destabilisation.
Average power estimation
Note that Eq. (3.8) is the peak value of a sound wave produced by a continuous burst of imploding cavities. Approximating this sound wave as a sine function with a peak value
pM, its root mean square value is then given by prms = pM/√2 and hence the average power according to Eq.(2.1), (3.8) and (3.10) is
( )2 2 4 2 2 4 5
5/22 1/2 2 3
2 34
c ca
MN u NP hx R x R
ρ ρεπ π
= =u L
(3.11)
where instead of DM the tack length, LM ≈ R/2 DM1/2, is inserted in the last equality.
LM (mm)
Ave
rage
pow
er (dB
)
0.1 0.5 1 5 1040
60
80
100
120
Nc100100010000
h (µm)
Ave
rage
pow
er (dB
)
0.5 1 2 3 4 5 67 10 20 30 50 7010040
60
80
100
120
ε135
Figure 3.4 a) Plot of Eq. (3.11) for ρ = 1000 kg/m3, u = 0.17 m/s, x = 0.05 m and R = 0.039 m (R1=0.03 m, R2=0.055 m). b) Plot of Eq. (3.11) for Nc = 100 and same input values as in a).
Now qualified estimations of Nc and ε can be made from reasonable values of all other
parameters. In Figs. 3.4a-b Eq. (3.11) is thus plotted with Nc and ε as parameters, with the other input values corresponding to those for the experiments performed on the IGT inking unit using a mineral oil-based sheet-fed offset ink. The radius R is an average given by 2/R = 1/R1+1/R2 to reproduce the contact curvature between R1 and R2 which are the top roller and metal roller radius, respectively, as shown in Fig. 2.2a.
Ink tack and sound emission
There is no direct relation between ink tack and sound emission prescribed by the cavitation model presented here, since the model does not consider the amount of tack
26

MODELLING
energy converted to heat, i.e. it only conserves mass and volume and not energy and momentum. Momentum is only considered for the bubbles themselves. Moreover the model assumes a priori the flow geometry and splitting condition, which in a rigorous treatment would be given by the solution of all governing conservation laws. Due to the geometrical simplification, there was actually no need to consider the momentum equation for the ink film, and thus the tack force is not included explicitly in the model. If the separation is dominated by filament elongation the tack force F of a single cylindrical filament is simply given by F = AηE dε/dt where A is the cross
sectional area of the filament at its middle, ηE the extensional viscosity, and dε/dt the strain rate. However, since the film is initially very thin, lubrication is presumably dominant or comparable and the full film lubrication problem has to be solved as well and matched with the meniscus problem, or using the method suggested by Cioc [14]. Worth noting is the cancelling viscosity in the Navier-Stokes equation, Eq. (3.3), for radial flow. The effects of viscosity, pressure from gas content and surface tension only come into play as boundary conditions, i.e. at the bubble surface if s is integrated to r in Eq. (3.3) resulting in the Rayleigh-Plesset (R-P) equation (p.9), and at the meniscus boundary in Eq. (3.9). Since tack is mostly governed by viscosity the vanishing viscosity in the cavitation model again shows that this was treated separately without considering ink tack. It could be argued that the bubbles themselves and the R-P equation contribute to the tack as has been discussed by [17, 78] and that the viscosity in the R-P equation then shows its importance. During bubble expansion some contribution to tack is possible according to Boyle’s law, stating that the volume pressure work (p1V1 = p2V2) is conserved, as in a piston operation, thus decreasing the pressure while increasing the volume. However, since the air/vapour compressibility is much higher than for ink, bubble formation should first be seen, together with viscous ink flow, as a means of releasing the tack from a highly confined squeeze flow to filament elongational flow [22]. This tack release is further accomplished by entraining or pumping, i.e. compression followed by decompression, of air and vapour bubbles through the nip. The amount of tack energy transformed into sound energy during film expansion then depends on the elasto-capillary forces stabilising these bubbles as described by Eq. (3.10).
27
RESULTS AND DISCUSSION
4 RESULTS AND DISCUSSION
4.1 Laboratory results
4.1.1 Ink roller distribution
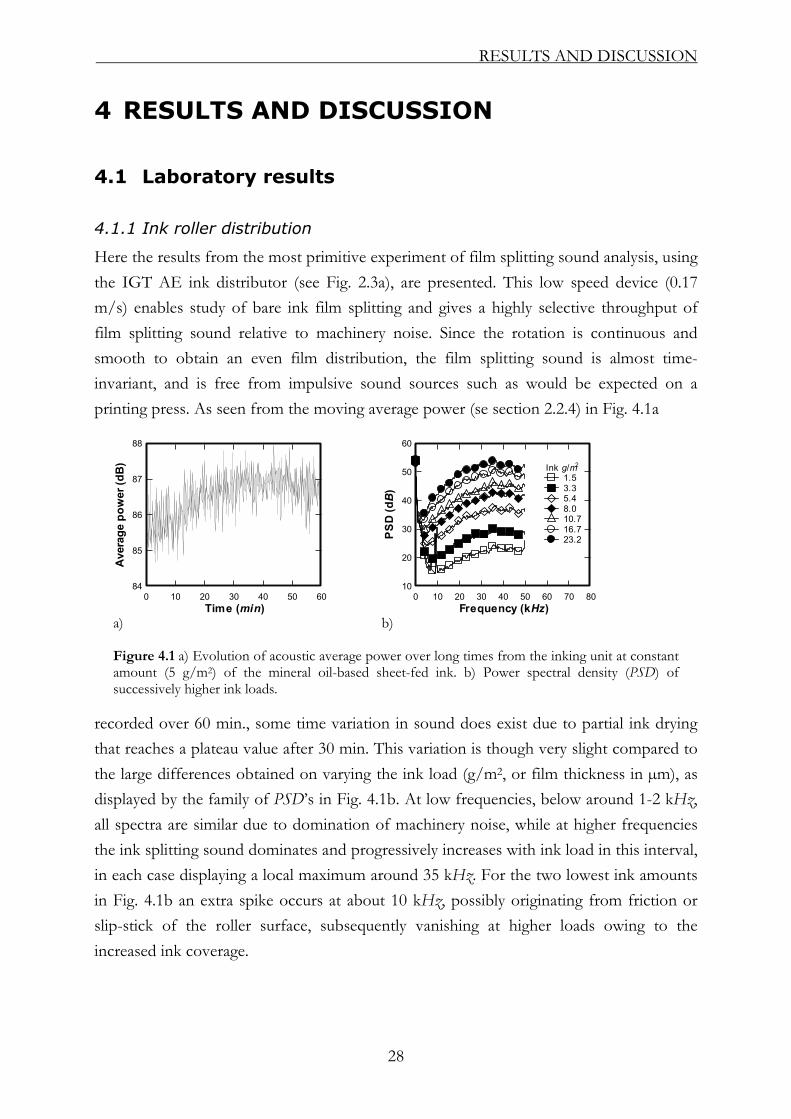
Here the results from the most primitive experiment of film splitting sound analysis, using the IGT AE ink distributor (see Fig. 2.3a), are presented. This low speed device (0.17 m/s) enables study of bare ink film splitting and gives a highly selective throughput of film splitting sound relative to machinery noise. Since the rotation is continuous and smooth to obtain an even film distribution, the film splitting sound is almost time-invariant, and is free from impulsive sound sources such as would be expected on a printing press. As seen from the moving average power (se section 2.2.4) in Fig. 4.1a
Time (min)
Ave
rage
pow
er (d
B)
0 10 20 30 40 50 6084
85
86
87
88
Frequency (kHz)
PS
D (dB
)
0 10 20 30 40 50 60 70 8010
20
30
40
50
60
Ink g/m2
1.53.35.48.010.716.723.2
a) b) Figure 4.1 a) Evolution of acoustic average power over long times from the inking unit at constant amount (5 g/m2) of the mineral oil-based sheet-fed ink. b) Power spectral density (PSD) of successively higher ink loads.
recorded over 60 min., some time variation in sound does exist due to partial ink drying that reaches a plateau value after 30 min. This variation is though very slight compared to the large differences obtained on varying the ink load (g/m2, or film thickness in µm), as displayed by the family of PSD’s in Fig. 4.1b. At low frequencies, below around 1-2 kHz, all spectra are similar due to domination of machinery noise, while at higher frequencies the ink splitting sound dominates and progressively increases with ink load in this interval, in each case displaying a local maximum around 35 kHz. For the two lowest ink amounts in Fig. 4.1b an extra spike occurs at about 10 kHz, possibly originating from friction or slip-stick of the roller surface, subsequently vanishing at higher loads owing to the increased ink coverage.
28

RESULTS AND DISCUSSION
Ink load (g/m2)
Ave
rage
pow
er(dB
)
0.5 0.60.7 1 2 3 4 5 6 7 8 9 10 20 30 40 50 60 7080 10066
72
78
84
90
96
102
108
III
III
IV
y = 25.07log 10 x+70 R2 = 0.98
y = 15.4log10 x+80 R2 = 0.96
Exp. dataModel: N c = 100, ε = 4
a)
Ink load (g/m2)
Ave
rage
freq
uenc
y (kHz)
0.5 0.60.7 1 2 3 4 5 6 7 8 9 10 20 30 40 50 60 7080 10028
30
32
34
36
I
II
III
IV
b)
LM (mm)
Ave
rage
pow
er (dB
)
0.7 0.8 0.9 1 2 3 4 5 666
72
78
84
90
96
102
108
Model: N c = 100, ε = 4
c) Figure 4.2 a) Average power, and b) average frequency, from film splitting for all ink amounts tested on the inking unit. The slope of 25.07 in region II of the average power in a) agrees with Eq. (3.11) (with slope 25) which is plotted for Nc = 100, ε = 4, ρ = 1000 kg/m3, u = 0.17 m/s, x = 0.05 m and R = 0.039 m. c) Average power as a function of corresponding tack length LM calculated by Eq. (3.11) and the same parameter values as in a).
Figures 4.2a-b display the average power and average frequency, respectively, calculated via Eqs. (2.2) and (2.5) from one second recordings, for the mineral oil-based ink at all studied loads in the range 0.5-100 g/m2. In each case a high-pass filter has been used at 5 kHz, thus excluding the lower frequency machine contributions. Four regions denoted I-IV with differing functional dependence on ink load are clearly evident from Fig. 4.2 and
29

RESULTS AND DISCUSSION
are interpreted below. On addition of ink in region I, cavities form and expand in the nip, with both their energy and rate consequently increasing with ink amount. Over this region a full lubricating film is developed, however the resulting reduction in roller frictional noise is more than compensated for by the power increase from cavitation. In region II the average power and frequency continue to rise, with the former following a power law with exponent from least squares fitting (see Fig. 4.2a) very close to that of 2.5 predicted in the scaling of Eq. (3.11), i.e. a factor 25 on dB-log scale (Eq. (2.2)). This close agreement is somewhat surprising given the simplifications made throughout the derivation of this model. Furthermore, substitution of known parameters and estimated values of Nc and ε from Fig. 3.4 reveal that the magnitude of the prediction in Eq. (3.11) is in reasonable accord with measurements in Fig. 4.2a. Although the tack length was not quantitatively measured in this work Eq. (3.11) gives reasonable tack lengths in lines with what was visually observed by a CCD camera in [61 p.10]. The increasing average frequency up to 7 g/m2 may be explained by an increasing number of cavitation events per unit time, resulting from filament splitting over the extended tack length from the nip, and an increasing size distribution of cavities due to increased likelihood of coalescence further from the nip. In addition, as was discussed on p. 24, each rupture may occur more rapidly and energetically due to a rise in tack with ink load during this period, which will contribute to both power and frequency. This tack rise was supported by the time to roller stop measurements (see Fig. 6 in (I)). In region III the average power continues to exhibit a power law scaling, however now with the lower exponent of 1.5, or a factor of 15 on dB-log scale, coinciding with the sudden decrease in average frequency. While it appears likely that the lower exponent in region I is due to the ratio ε decreasing with ink amount (to approach its stable value in region II), due to the extra ink load improving the sub-optimal coverage and air-seal in the nip, such an explanation cannot apply in region III. One factor possibly contributing to this loss of power and reduction in frequency is the observed onset of ribbing in region III, which could hinder the cavities from elongation or decrease their number density Nc in this direction. Note also from Eqs. (3.9) - (3.10) that ε is a function of h when De < 1, but independent of h for De >> 1. The negative deviation from the slope predicted by Eq. (3.11) and found in Fig. 4.2a, might then be explained by the lower De, either at low
30

RESULTS AND DISCUSSION
ink loads when the rupture is fast due to the minor ink volume to deform (region I) or for the less confined geometries at higher ink loads where viscous flow dominates the ink splitting (region III). In the fourth region, the average power decreases while frequency increases again, however this is due to a slipping contact between the friction-driven polymer roller and metal roller. Accordingly, the ribbing seen in region III now disappeared due to decrease in roller speed to below the critical value by virtue of this sliding of the friction-driven top roller.
4.1.2 Printing on test strips
An example of a transduced acoustic raw signal, i.e. pressure variation as a function of time, recorded during the printing of a single paper strip, is displayed in Fig. 4.3a. After high pass filtering at 5 kHz (i.e. as performed above for the inking experiments) the moving average power in Fig. 4.3b now reveals the known fact that the rotation of the cylinder over the recording time can be divided into three stages, where the second stage (“Printing”) involves the contact between the print cylinder and the paper sample.
Time (s)
Sou
nd p
ress
ure
(Pa)
0 0.2 0.4 0.6 0.8 1 1.2-3
-1.5
0
1.5
3
Time (s)
Ave
rage
pow
er (d
B)
0 0.2 0.4 0.6 0.8 1 1.2 1.461
62
63
64
65
66
67
PrintingRotationstarts
Rotationstops
a) b) Figure 4.3 Sound pressure a) and average power b) variation (moving average) from the printing unit nip for 3 g/m2 of the mineral oil-based sheet-fed ink applied to the glossy coated paper.
The supposition that the extra sound from the printing region arises from ink film splitting, and not merely mechanical friction effects, was justified by the PSD (see Fig. 7d in (I)) displaying power increasing with ink load. Clearly, the main distinction between the samples is manifested above around 5 kHz, whereas the contributions at lower frequencies originate principally from the printer motor and machinery effects, and are thus relatively independent of ink amount. The machinery contributions are much louder (and also extend up to somewhat higher frequencies) than was the case for the ink
31
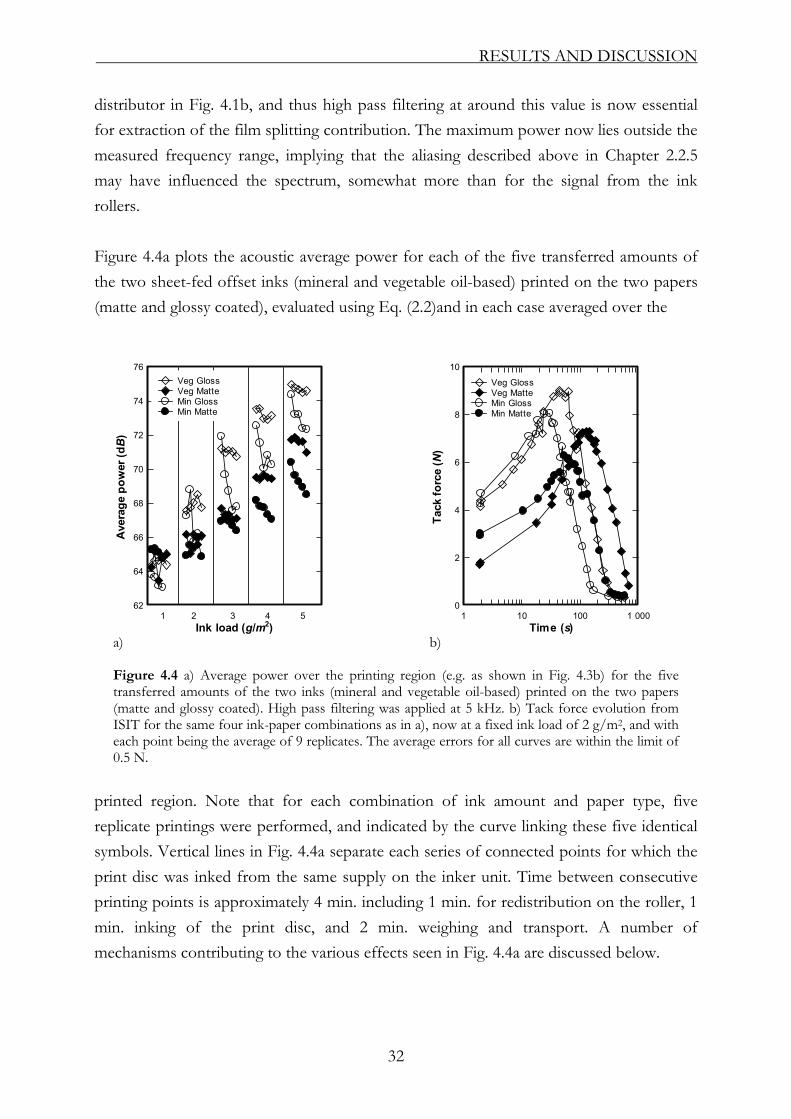
RESULTS AND DISCUSSION
distributor in Fig. 4.1b, and thus high pass filtering at around this value is now essential for extraction of the film splitting contribution. The maximum power now lies outside the measured frequency range, implying that the aliasing described above in Chapter 2.2.5 may have influenced the spectrum, somewhat more than for the signal from the ink rollers. Figure 4.4a plots the acoustic average power for each of the five transferred amounts of the two sheet-fed offset inks (mineral and vegetable oil-based) printed on the two papers (matte and glossy coated), evaluated using Eq. (2.2)and in each case averaged over the
Ink load (g/m2)
Ave
rage
pow
er (dB
)
62
64
66
68
70
72
74
76
1 2 3 4 5
Veg GlossVeg MatteMin GlossMin Matte
Time (s)
Tack
forc
e (N
)
1 10 100 1 0000
2
4
6
8
10
Veg GlossVeg MatteMin GlossMin Matte
a) b) Figure 4.4 a) Average power over the printing region (e.g. as shown in Fig. 4.3b) for the five transferred amounts of the two inks (mineral and vegetable oil-based) printed on the two papers (matte and glossy coated). High pass filtering was applied at 5 kHz. b) Tack force evolution from ISIT for the same four ink-paper combinations as in a), now at a fixed ink load of 2 g/m2, and with each point being the average of 9 replicates. The average errors for all curves are within the limit of 0.5 N.
printed region. Note that for each combination of ink amount and paper type, five replicate printings were performed, and indicated by the curve linking these five identical symbols. Vertical lines in Fig. 4.4a separate each series of connected points for which the print disc was inked from the same supply on the inker unit. Time between consecutive printing points is approximately 4 min. including 1 min. for redistribution on the roller, 1 min. inking of the print disc, and 2 min. weighing and transport. A number of mechanisms contributing to the various effects seen in Fig. 4.4a are discussed below.
32

RESULTS AND DISCUSSION
Paper effects
In particular, the glossy paper gives rise to higher power than its matte counterpart at all ink levels (aside possibly from the lowest) and for both ink types. The higher roughness of the matte paper (see Table 1 in (I)) gives a greater chance for cavity growth, with the ink film in the nip being presumably less air-tight than for the glossy paper. In the language of Eq. (3.9) this corresponds to a destabilisation of the filaments and thus earlier ruptures. Further, the matte paper’s generally lower ink-paper contact area would be expected to reduce tack force per nominal area and thus also the corresponding acoustic power, which is also realised by a lower cavity number density Nc due to faster coalescence.
Ink effects
The film-splitting power (averaged over these replicates) increases in all cases with ink amount, as for the ink distributing unit in Fig. 4.2a, but with a lower slope coefficient than predicted by Eq. (3.11), now lying in the range 1-1.5 for the printing experiments. Average power also increases somewhat from mineral- to vegetable-oil based ink, for each paper and again at all ink amounts with the possible exception of the lowest. This trend may be directly due to higher ink tack or differing tendency to cavitation influenced by substrate interaction (see below). Further, observe that the replicates exhibit a clear and systematic hysteresis (especially apparent at the three highest ink levels), i.e. for their consecutive inking and printing at a given ink level, the average power decreases in the running order from first to last replicate. Although this suggests that increased distribution time on the inking unit shifts the power on printing to lower values, the average power from the splitting on the inking unit itself displayed the opposite trend (see Fig. 4.1a), namely increasing slowly over these time periods. The hysteresis effect in Fig. 4.2a is more pronounced for the mineral oil-based ink, with its vegetable oil counterpart displaying greater constancy.
Ink-paper interaction effects
It is also conceivable that the acoustic method detects the onset of ink setting, known to occur more rapidly on the glossy paper by virtue of its finer surface pores, thus increasing the ink viscosity and hence the work of film splitting. Figure 4.4b shows the pull-off tack force development as measured by ISIT (see Fig. 2.2b) for the same inks and papers as in Fig. 4.4a. Since the force is measured after printing, the first point at 2 s is still not early enough to be directly comparable (in terms of vehicle concentration) to the sound recorded during printing, and is subject to significant measurement uncertainty if not supported by results from subsequent pull-offs. In this sense the maximum tack value
33

RESULTS AND DISCUSSION
measured, or the slope of tack build-up to this maximum, provides a more reliable quantity. Note that the maximum tack increases in the same order as the average power in Fig. 4.4a, i.e. from mineral (oil-based ink) on matte (paper) to vegetable on matte to mineral on glossy to vegetable on glossy. This could be interpreted as an indication that setting already influences tack force and acoustic average power in the nip exit.
4.1.3 Ink tack on paper
This section summarises the results in (II) from the measurements with Deltack (see Fig. 2.3a). The sound pressure time record is similar in form to that from IGT printing in Fig. 4.3, consisting of three sub-intervals: a waiting region, where the instrument is stationary, a rotation region, where both the printing cylinder and forme are spinning but no contact is occurring, and a printing region during which the cylinder and forme are in contact. Within this third region of total print time 0.2 s an analysis interval of 0.15 s was chosen and high pass filtered at 1.8 kHz, again to exclude machinery noise.
Effect of substrate
Figures 4.5a-b show measured tack for the HSWO Inks A and B, respectively, printed on the three MWC papers. The tack behaviour of the two inks is similar on each of the three papers, despite their differing ink tack and viscosity values given above in Chapter 2.3.2. The highest tack always occurs during the initial printing cycle, after which it falls sharply over the next 2-3 cycles. Tack arises from the splitting of the free ink film between forme and paper and the reduction from its initial level is likely due to decreasing thickness of this free ink film as its vehicle absorbs into the paper. All three papers subsequently display a common increase in tack as the setting ink becomes more viscous, followed by a decline as the ink surfaces on the paper and forme become too viscous to flow and fully wet each other. For both inks the time taken to reach the peak is approx. 25 s, 15 s and 40 s for I, II and III, respectively (with setting on paper III being somewhat slower with Ink A). Thus these three MWC papers are distinct in terms of their characteristic rates of tack build-up and fall due to oil imbibition, and are likely to perform quite differently when printed (as confirmed by the results in Chapter 4.2). The corresponding data of acoustic average power for inks A and B are shown in Figs. 4.5c-d. The acoustic measurements do not show perfect correspondence with those of tack as the former increase sharply at the beginning, in contrast to the rapid drop in tack occurring in the first cycles after printing. After a few seconds the power increases together with the tack, and both methods rate the papers in the same hierarchy of II, I, III in terms of decreasing setting rate (i.e. increasing time to maximum). Note though that
34

RESULTS AND DISCUSSION
Time(s)
Tack
(N)
0 10 20 30 40 50 600.6
1.2
1.8
2.4
3
3.6
Ink APaper IPaper IIPaper III
Time (s)
Tack
(N)
0 10 20 30 40 50 600.6
1.2
1.8
2.4
3
3.6
Ink BPaper IPaper IIPaper III
a) b)
Time (s)
Ave
rage
pow
er (dB
)
0 10 20 30 40 50 60 7072
74
76
78
80
82
84
Ink APaper IPaper IIPaper III
Time (s)
Ave
rage
pow
er (dB
)
0 10 20 30 40 50 60 7072
74
76
78
80
82
84
Ink BPaper IPaper IIPaper III
c) d) Figure 4.5 Tack versus time for a) Ink A and b) Ink B and corresponding average power (SPL) for c) Ink A and d) Ink B, each printed on the three MWC papers I, II and III, for 3.8 g/m2 ink on the forme roller before printing. Each curve is the average of two replicates, with median (non-logarithmic for c) and d)) coefficients of variation: a) 5%, 3%, 7%, b) 10%, 18%, 4%, c) 8%, 6%, 5%, and d) 13%, 7%, 13%, for papers I, II, III, respectively.
the average power continues to be high, with only a slight drop in magnitude, over times after onset of tack fall. For paper III the time interval of measurement was not sufficient to observe any power drop.
Effect of ink load
Figure 4.6 displays the effect of increasing ink load on a) tack and b) average power, for one ink-paper pair. On increasing ink load, the first measured tack point and the minimum tack after the initial drop both decrease, and the subsequent tack rise and later fall become delayed and prolonged. The corresponding acoustic results similarly reveal a delaying and flattening effect in the average power development with increasing ink. However, as also shown in Fig. 4.5, the final tack fall has only a minimal effect on average power, which seems to slowly increase well beyond the measured time interval.
35

RESULTS AND DISCUSSION
Time(s)
Tack
(N)
0 20 40 60 80 100 1201.5
2
2.5
3
3.5
Ink load3.8 g/m2
5.8 g/m2
7.4 g/m2
Time (s)
Ave
rage
pow
er (dB
)
0 20 40 60 80 100 12072
75
78
81
84
Ink load3.8 g/m2
5.8 g/m2
7.4 g/m2
a) b) Figure 4.6 a) Tack, and b) acoustic average power, from Deltack as function of time for three different amounts of Ink A on the forme roller before printing on paper III. All curves are averages of two replicates, with median coefficients of variation (of the linear y-values) for 3.8, 5.8 and 7.4 g/m2 of 7, 3 and 6%, respectively, for a) and 5, 11 and 8% for b).
Flow regimes
Tack is the resistance to splitting the ink film, which is an energetic process that may depend on three different flow mechanisms: squeeze flow, elongational flow, and adhesive failure. These three different flow regimes are exemplified in Figs. 4.5a-b. In the initial printing cycle ink viscosity is low and lubrication forces are therefore expected to be dominant. According to Stefan’s or Reynolds’ equation the reverse squeeze gives a tack that is several orders of magnitude higher than observed experimentally, with cavitation being one reason for the discrepancy. Another factor is the effective contact area that gives the cohesive split, which in Figs 4.5a-b is manifested by the immediate drop in tack after the first ink penetration. The ink available for cohesive squeeze flow decreases abruptly after this first impression, with the splitting position moving closer to the print forme surface and thus promoting adhesive fracture or easier cavitation and accordingly the tack drop. As the ink film sets the tack increases as a consequence of the rising concentration of tackifying resins remaining in the film, and the splitting flow becomes more elongational. Eventually, the wetting or adhesion area between forme and solidifying ink film will decrease, resulting in the final tack fall. Cavitation and sound clearly also depend on amount and viscosity of ink, although not in a manner identical to tack. At low viscosity, energy may dissipate by flow and fast rupture rather than cavity extension (lower relaxation time and De in Eq. (3.9)), explaining the relatively low initial average power in Figs 4.5c-d. Similarly, if the available ink amount is high, the lubrication force is reduced, again favouring viscous flow over cavity expansion, partly explaining the delayed response and lower average power in Fig. 4.6b at higher ink
36

RESULTS AND DISCUSSION
loads. This delay may also be due to the slower solvent absorption from the thicker ink film. As setting proceeds, the cavities become more stable since the increasingly viscous ink hinders their coalescence, enabling their extension in elongational flow, thus increasing the pressure pulse amplitude up to and at collapse and duly causing an increase in acoustic power emission (and tack) in Figs 4.5-4.6. One possible explanation for the fact that average power continues to increase after tack starts falling is that, after many impressions with the same forme, the ink surfaces become cratered, producing sites for air entrainment without the need for energy exchange with the ink bulk. Instead the cavity expansion energy is provided by the surface adhesion and, as the contact becomes more elastic, the splitting becomes more crack-like, promoting sound generation and minimizing the damping effect from viscous flow.
4.1.4 Ink-water balance
In the Hydroscope experiments two dispersed phases are present, namely the emulsified fount droplets and the air/vapour cavities. Further, the ink film thickness is high, compared to Deltack or normal press roller conditions, which gives essentially elongational flow. In an analogy with emulsification in colloid mills, homogenizers and ultrasonic devices, see Gopal [79 pp. 19-20], Bullof [40 p.573] described the ink-fount emulsification as a balance between dispersion and coalescence, with the emulsion progressively approaching a maximum water concentration, and a minimum droplet size. A similar process should occur on the Hydroscope. The amount and emulsified state of fount affects the film thickness and viscosity of the emulsion, with direct consequences for air cavity elongation and collapse, and thus acoustic emission. Further, deformation of fount droplets themselves in the nip exit can provide an additional sound source. As for the IGT signal in Fig. 4.1a the Hydroscope sound pressure is invariant over short times (see Fig. 7a in (II)). From the evolution of the spectra during titration and evaporation (Figs. 7d-e, for Ink A, in (II)) a high pass filter cut-off at 2 kHz was motivated.
37

RESULTS AND DISCUSSION
Time (s)
Hyd
rosc
ope
tack
0 200 400 600 800 1 000120
180
240
300
360
420
Start90 s
Stop A513 s
Stop B609 s
Evap.
Emuls.
Ink AInk B
Time (s)
Ave
rage
pow
er (d
B)
0 200 400 600 800 1 00078
84
90
96
102
108
Start90 s
Stop B609 s
Stop A513 s
Evap.
Emuls. Ink AInk B
a) b)
Time (s)
Ave
rage
freq
uenc
y (kHz)
0 200 400 600 800 1 00016
18
20
22
24
26
28
Start90 s
Stop A513 s
Stop B609 s
Emuls. Evap.
Ink AInk B
Average power (dB)
Hyd
rosc
ope
tack
78 84 90 96 102 108120
180
240
300
360
420
Evap.
Emuls.
Start
Stop
Ink AInk B
c) d)
Figure 4.7 a) Hydroscope tack (dimensionless), b) corresponding acoustic average power and c) average frequency (both high pass filtered at 2 kHz), as a function of time, for the two Inks A and B; d) correlation between a) and b). One replicate was performed as shown.
Figure 4.7 shows tack and acoustic data over the duration of the Hydroscope experiments for Inks A and B. Hydroscope tack data is contained in Fig.4.7a and the averaged power and frequency are given in Fig. 4.7b and c, respectively. Figure 4.7d shows the Hydroscope tack data plotted against the corresponding average power, parameterised by time. The first vertical line in Figs. 4.7a-c indicates the start of fount titration after attainment of an even ink distribution. Fount was then added at a rate of 1.3 ml/min until saturation, indicated by the second vertical lines for Inks A and B. The level of fount addition at saturation increased from 9 ml for Ink A at 513 s, to 11 ml for Ink B at 609 s. After cessation of addition the fount subsequently evaporated and the ink eventually recovered towards its initial state. The experiment and response is subdivided into five stages as outlined below.
Stage 1: Before titration 0 - 90 s
In Fig. 4.7a the initial tack is higher for Ink A than B, as expected from their Tack-o-scope values. The starting values of average power shown in Fig. 4.7b for Inks A and B before fount addition, are strikingly similar, although the corresponding average
38

RESULTS AND DISCUSSION
frequency is slightly lower for Ink A (Fig. 4.7c). One possible interpretation is that the lower tack of Ink B, forces it to rupture at an earlier stage if elongational forces are assumed to dominate. As realised from Eq. (3.11), if the tack length is lower and the sound power is constant, the number of cavities Nc is probably higher instead and the cavity sizes smaller according to Eq. (3.8), which might explains the higher average frequency of Ink B.
Stage 2: Emulsification 90 - ∼300 s
On fount addition Ink A loses tack immediately while Ink B remains at high tack until approximately 200 s, reflecting the higher emulsion capacity of Ink B that is able to rapidly subsume and emulsify fount in smaller spherical droplets, thus preserving its film cohesion. At around 250 s the tack of Ink B decreases abruptly, signifying collapse or saturation of an intermediate structure. The fact that the average power remains high for both inks and even increases to a maximum for Ink B indicates that the fount droplets introduce new sites for cavitation. As long as the emulsion is stable the fount droplets and their associated cavities are small enough to remain dispersed and contribute to the total sound emission. In that sense, the average frequency and average power again reveal the presence of smaller droplets in ink B.
Stage 3: Saturation ∼300 - ∼600 s
At the beginning of this third stage the fount concentration is about 40 % w/w, and the downward trend halts temporarily for Ink B and actually turns upward for Ink A, in all three measures of Fig. 4.7a-c. As discussed by Iwaki et al. [80], the stage before saturation can even be preceded by a rejection of fount from an over-emulsified state, thus passing through a minimum in tack. Moreover, the droplet/cavity sizes decrease continuously, which motivates the increasing tack and frequency of Ink A. For Ink B, the constant frequency and tack indicates rather a stable condition with constant droplet/cavity sizes. At approximately 400 s, tack and average power start to drop even more, presumably due to increased amount of surface water and increasing rate of coalescence giving larger droplets. Owing to its comparably low viscosity and ink repellence, the surface water will exist as small droplets [5], which might also account for the increase of average frequency, for Ink A over 300-400 s and Ink B at 500-600 s, but not necessarily changing the tack.
Stage 4: Evaporation ∼600 s - ∼800 s
After the end of titration of Ink B, the sudden drop in average frequency confirms the prior influence of free water. It also reveals, together with tack and average power, that the evaporation-induced recovery proceeds more rapidly for Ink B than for A, suggesting
39
RESULTS AND DISCUSSION
that Ink A continues to expel excess fount from the ink film at a higher rate than evaporation of the phase-separated layer. An alternative, but not contradictory, interpretation is that Ink A, with its lower water-carrying capacity, adopts more of an oil-in-water (O/W) emulsion, thus taking longer time to re-coalesce to a coherent ink film. Note that the minimum average frequency after titration stop, (760 s for Ink A and 670 s for B) might reflect the actual droplet size after most surface water is removed.
Stage 5: Recovery ∼800 s -1000 s
During the following recovery the droplet sizes decrease due to evaporation combined with a more efficient emulsification. The tack first overshoots its original level for Ink A and B at 925 s and 790 s, respectively, possibly due to the still high amount of water giving higher “shortness” [30], and thus an elastic contribution to tack (see section 1.5.3). Since shortness counteracts cavity extension and favours rupture, average power does not exhibit this overshoot. At 1000 s this temporary structure is mostly broken down, but some residual water might explain the increasing average frequency and that tack exceeds its initial value. The combined plot of tack against average power in Fig. 4.7d summarises the above-mentioned trends and clearly illustrates that some correlation exists between these two measures. A hysteresis is expected for both inks due to the time dependency involved in both emulsification and evaporation. Ink B exhibits a much greater hysteresis though, reflecting its attraction towards the more stable emulsion structure.
4.2 Pilot scale results
4.2.1 Heat-set web offset printing
Time and frequency characteristics
The acoustic raw signal from the heat-set printing trial in (III) with the microphone positioned at the upper unit (see Fig. 2.4a) is shown in Fig. 4.8. After matching of this raw signal with the plate dimension and printing speed it became clear that the period between each peak corresponded to half a revolution of the blanket cylinder (one plate cylinder revolution) including the image and non-image regions of higher and lower pressures, respectively. The spikes separating these two sub-intervals are caused by image release on passing from image to non-image area, and also closely coinciding with the passing of the blanket gap.
40
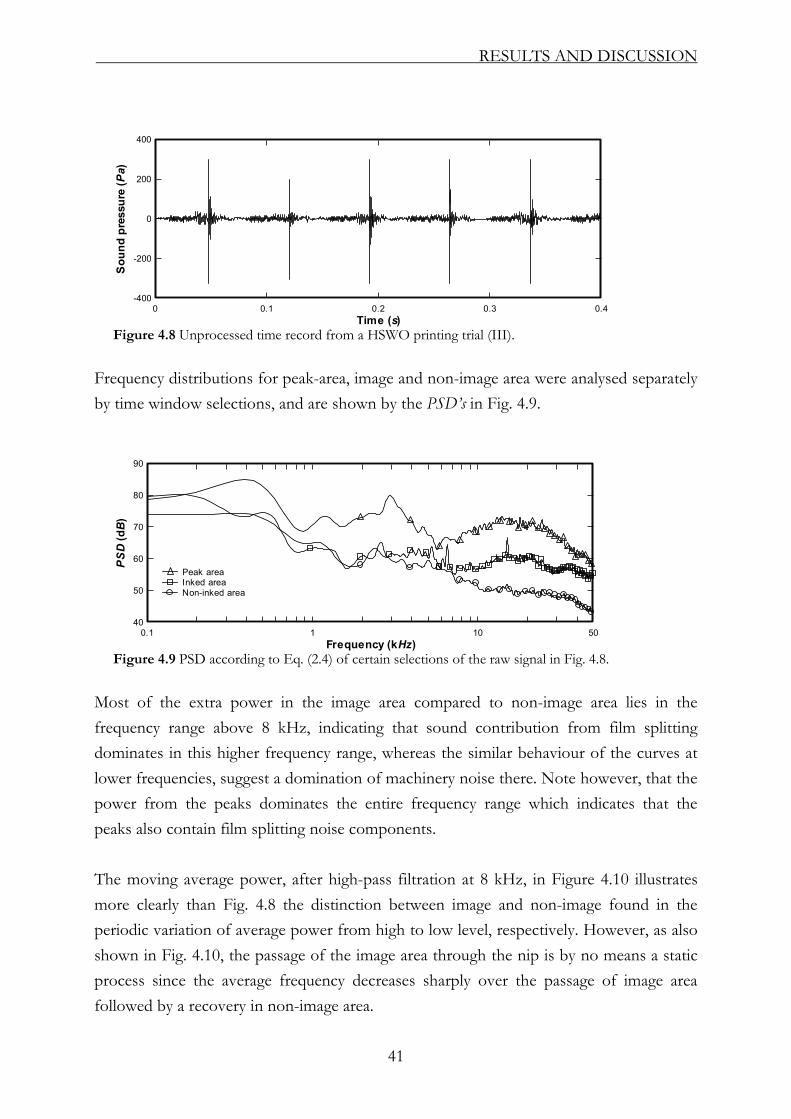
RESULTS AND DISCUSSION
Time (s)
Sou
nd p
ress
ure
(Pa)
0 0.1 0.2 0.3 0.4-400
-200
0
200
400
Figure 4.8 Unprocessed time record from a HSWO printing trial (III).
Frequency distributions for peak-area, image and non-image area were analysed separately by time window selections, and are shown by the PSD’s in Fig. 4.9.
Frequency (kHz)
PSD
(dB
)
0.1 1 10 5040
50
60
70
80
90
Peak areaInked areaNon-inked area
Figure 4.9 PSD according to Eq. (2.4) of certain selections of the raw signal in Fig. 4.8.
Most of the extra power in the image area compared to non-image area lies in the frequency range above 8 kHz, indicating that sound contribution from film splitting dominates in this higher frequency range, whereas the similar behaviour of the curves at lower frequencies, suggest a domination of machinery noise there. Note however, that the power from the peaks dominates the entire frequency range which indicates that the peaks also contain film splitting noise components. The moving average power, after high-pass filtration at 8 kHz, in Figure 4.10 illustrates more clearly than Fig. 4.8 the distinction between image and non-image found in the periodic variation of average power from high to low level, respectively. However, as also shown in Fig. 4.10, the passage of the image area through the nip is by no means a static process since the average frequency decreases sharply over the passage of image area followed by a recovery in non-image area.
41
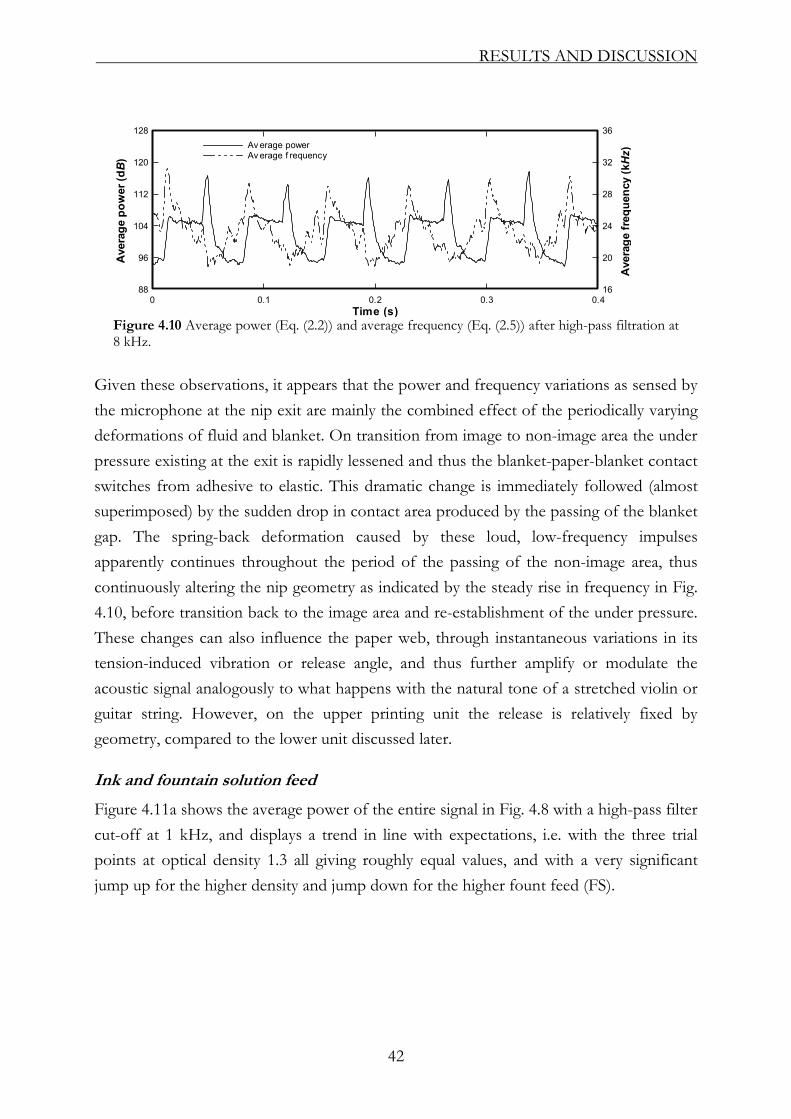
RESULTS AND DISCUSSION
Time (s)
Ave
rage
pow
er (dB
)
Ave
rage
freq
uenc
y (kHz)
0 0.1 0.2 0.3 0.488 16
96 20
104 24
112 28
120 32
128 36Av erage powerAv erage f requency
Figure 4.10 Average power (Eq. (2.2)) and average frequency (Eq. (2.5)) after high-pass filtration at 8 kHz.
Given these observations, it appears that the power and frequency variations as sensed by the microphone at the nip exit are mainly the combined effect of the periodically varying deformations of fluid and blanket. On transition from image to non-image area the under pressure existing at the exit is rapidly lessened and thus the blanket-paper-blanket contact switches from adhesive to elastic. This dramatic change is immediately followed (almost superimposed) by the sudden drop in contact area produced by the passing of the blanket gap. The spring-back deformation caused by these loud, low-frequency impulses apparently continues throughout the period of the passing of the non-image area, thus continuously altering the nip geometry as indicated by the steady rise in frequency in Fig. 4.10, before transition back to the image area and re-establishment of the under pressure. These changes can also influence the paper web, through instantaneous variations in its tension-induced vibration or release angle, and thus further amplify or modulate the acoustic signal analogously to what happens with the natural tone of a stretched violin or guitar string. However, on the upper printing unit the release is relatively fixed by geometry, compared to the lower unit discussed later.
Ink and fountain solution feed
Figure 4.11a shows the average power of the entire signal in Fig. 4.8 with a high-pass filter cut-off at 1 kHz, and displays a trend in line with expectations, i.e. with the three trial points at optical density 1.3 all giving roughly equal values, and with a very significant jump up for the higher density and jump down for the higher fount feed (FS).
42
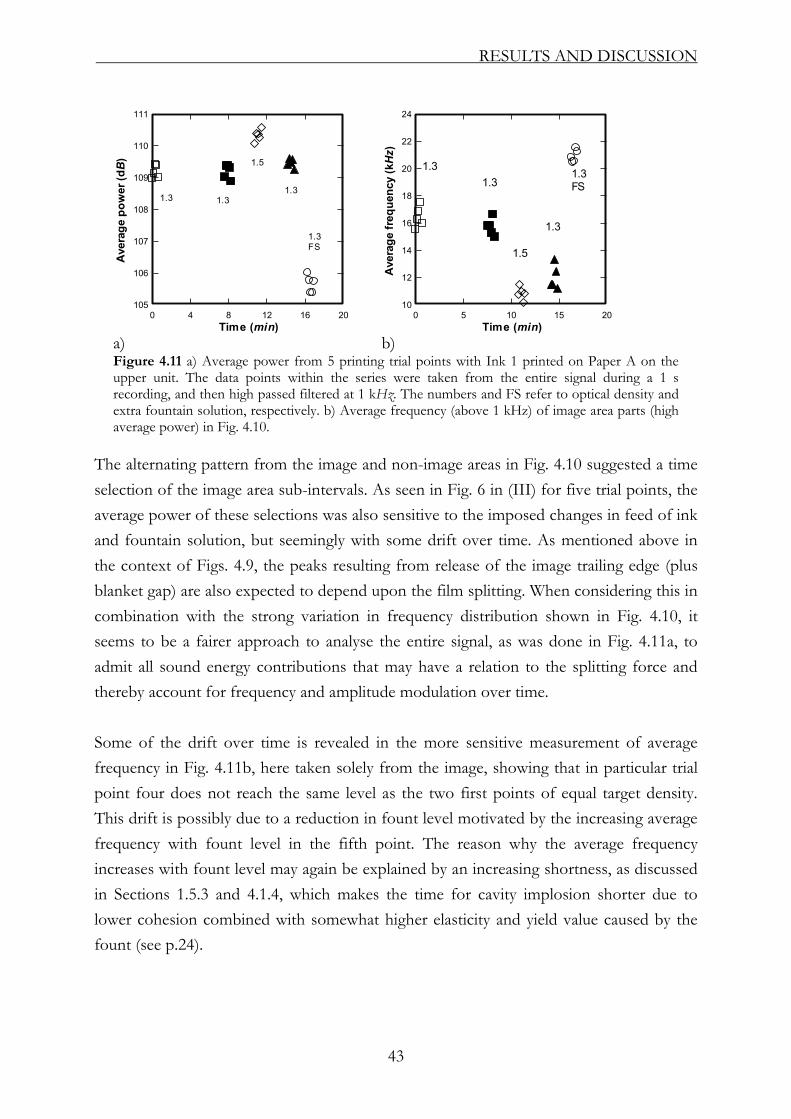
RESULTS AND DISCUSSION
Time (min)
Ave
rage
pow
er (dB
)
0 4 8 12 16 20105
106
107
108
109
110
111
1.31.3 1.3
1.5
1.3FS
Time (min)
Ave
rage
freq
uenc
y (kHz)
0 5 10 15 2010
12
14
16
18
20
22
24
1.31.3
1.3
1.5
1.3FS
a) b) Figure 4.11 a) Average power from 5 printing trial points with Ink 1 printed on Paper A on the upper unit. The data points within the series were taken from the entire signal during a 1 s recording, and then high passed filtered at 1 kHz. The numbers and FS refer to optical density and extra fountain solution, respectively. b) Average frequency (above 1 kHz) of image area parts (high average power) in Fig. 4.10.
The alternating pattern from the image and non-image areas in Fig. 4.10 suggested a time selection of the image area sub-intervals. As seen in Fig. 6 in (III) for five trial points, the average power of these selections was also sensitive to the imposed changes in feed of ink and fountain solution, but seemingly with some drift over time. As mentioned above in the context of Figs. 4.9, the peaks resulting from release of the image trailing edge (plus blanket gap) are also expected to depend upon the film splitting. When considering this in combination with the strong variation in frequency distribution shown in Fig. 4.10, it seems to be a fairer approach to analyse the entire signal, as was done in Fig. 4.11a, to admit all sound energy contributions that may have a relation to the splitting force and thereby account for frequency and amplitude modulation over time. Some of the drift over time is revealed in the more sensitive measurement of average frequency in Fig. 4.11b, here taken solely from the image, showing that in particular trial point four does not reach the same level as the two first points of equal target density. This drift is possibly due to a reduction in fount level motivated by the increasing average frequency with fount level in the fifth point. The reason why the average frequency increases with fount level may again be explained by an increasing shortness, as discussed in Sections 1.5.3 and 4.1.4, which makes the time for cavity implosion shorter due to lower cohesion combined with somewhat higher elasticity and yield value caused by the fount (see p.24).
43
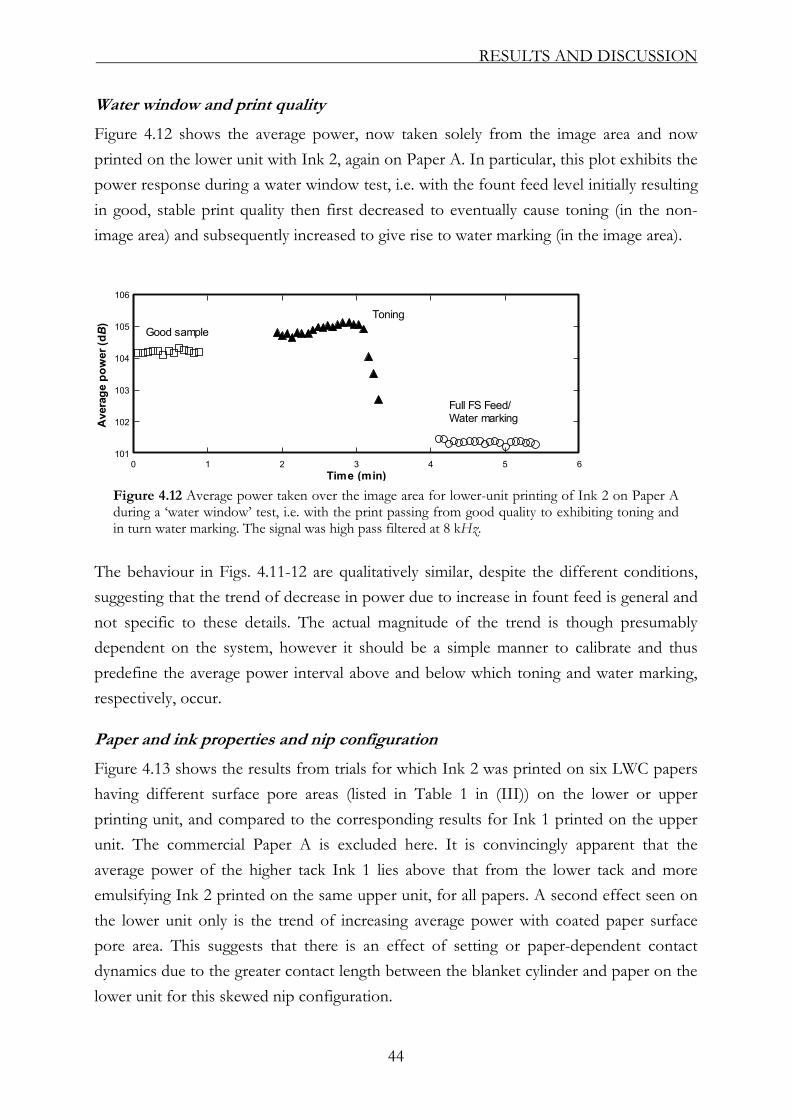
RESULTS AND DISCUSSION
Water window and print quality
Figure 4.12 shows the average power, now taken solely from the image area and now printed on the lower unit with Ink 2, again on Paper A. In particular, this plot exhibits the power response during a water window test, i.e. with the fount feed level initially resulting in good, stable print quality then first decreased to eventually cause toning (in the non-image area) and subsequently increased to give rise to water marking (in the image area).
Time (min)
Ave
rage
pow
er (dB
)
0 1 2 3 4 5 6101
102
103
104
105
106
Good sampleToning
Full FS Feed/Water marking
Figure 4.12 Average power taken over the image area for lower-unit printing of Ink 2 on Paper A during a ‘water window’ test, i.e. with the print passing from good quality to exhibiting toning and in turn water marking. The signal was high pass filtered at 8 kHz.
The behaviour in Figs. 4.11-12 are qualitatively similar, despite the different conditions, suggesting that the trend of decrease in power due to increase in fount feed is general and not specific to these details. The actual magnitude of the trend is though presumably dependent on the system, however it should be a simple manner to calibrate and thus predefine the average power interval above and below which toning and water marking, respectively, occur.
Paper and ink properties and nip configuration
Figure 4.13 shows the results from trials for which Ink 2 was printed on six LWC papers having different surface pore areas (listed in Table 1 in (III)) on the lower or upper printing unit, and compared to the corresponding results for Ink 1 printed on the upper unit. The commercial Paper A is excluded here. It is convincingly apparent that the average power of the higher tack Ink 1 lies above that from the lower tack and more emulsifying Ink 2 printed on the same upper unit, for all papers. A second effect seen on the lower unit only is the trend of increasing average power with coated paper surface pore area. This suggests that there is an effect of setting or paper-dependent contact dynamics due to the greater contact length between the blanket cylinder and paper on the lower unit for this skewed nip configuration.
44
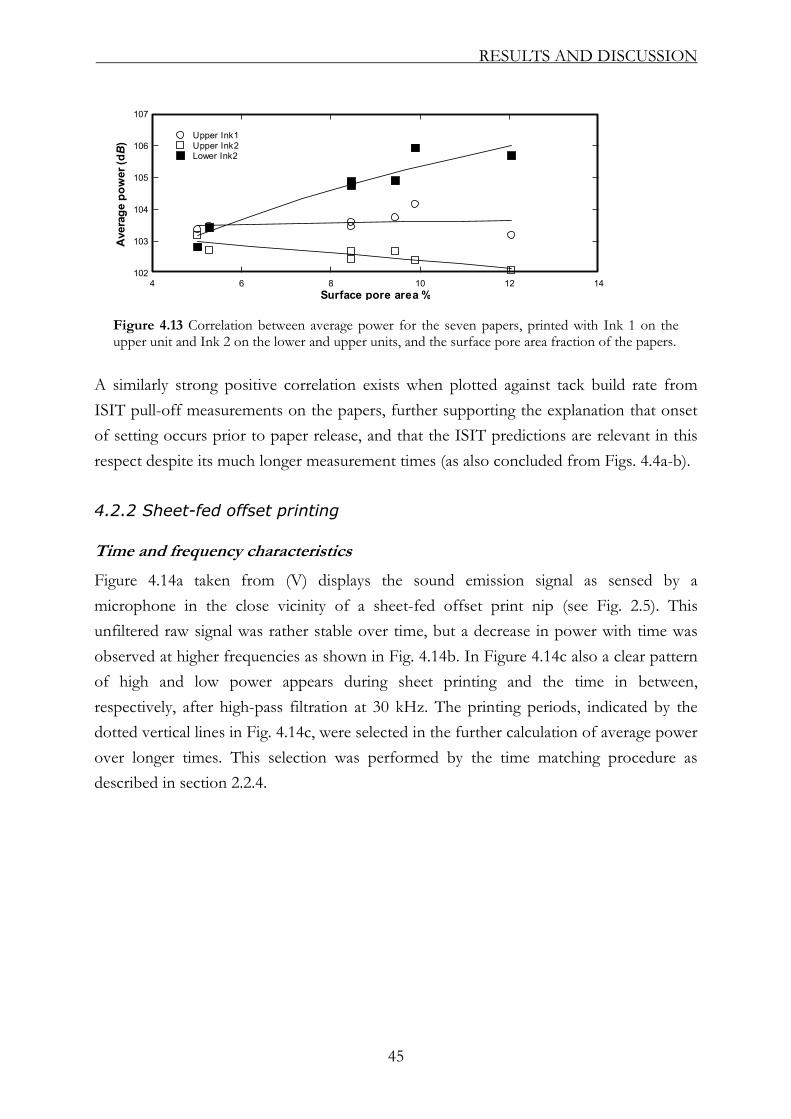
RESULTS AND DISCUSSION
Surface pore area %
Ave
rage
pow
er (dB
)
4 6 8 10 12 14102
103
104
105
106
107
Upper Ink1Upper Ink2Lower Ink2
Figure 4.13 Correlation between average power for the seven papers, printed with Ink 1 on the upper unit and Ink 2 on the lower and upper units, and the surface pore area fraction of the papers.
A similarly strong positive correlation exists when plotted against tack build rate from ISIT pull-off measurements on the papers, further supporting the explanation that onset of setting occurs prior to paper release, and that the ISIT predictions are relevant in this respect despite its much longer measurement times (as also concluded from Figs. 4.4a-b).
4.2.2 Sheet-fed offset printing
Time and frequency characteristics
Figure 4.14a taken from (V) displays the sound emission signal as sensed by a microphone in the close vicinity of a sheet-fed offset print nip (see Fig. 2.5). This unfiltered raw signal was rather stable over time, but a decrease in power with time was observed at higher frequencies as shown in Fig. 4.14b. In Figure 4.14c also a clear pattern of high and low power appears during sheet printing and the time in between, respectively, after high-pass filtration at 30 kHz. The printing periods, indicated by the dotted vertical lines in Fig. 4.14c, were selected in the further calculation of average power over longer times. This selection was performed by the time matching procedure as described in section 2.2.4.
45
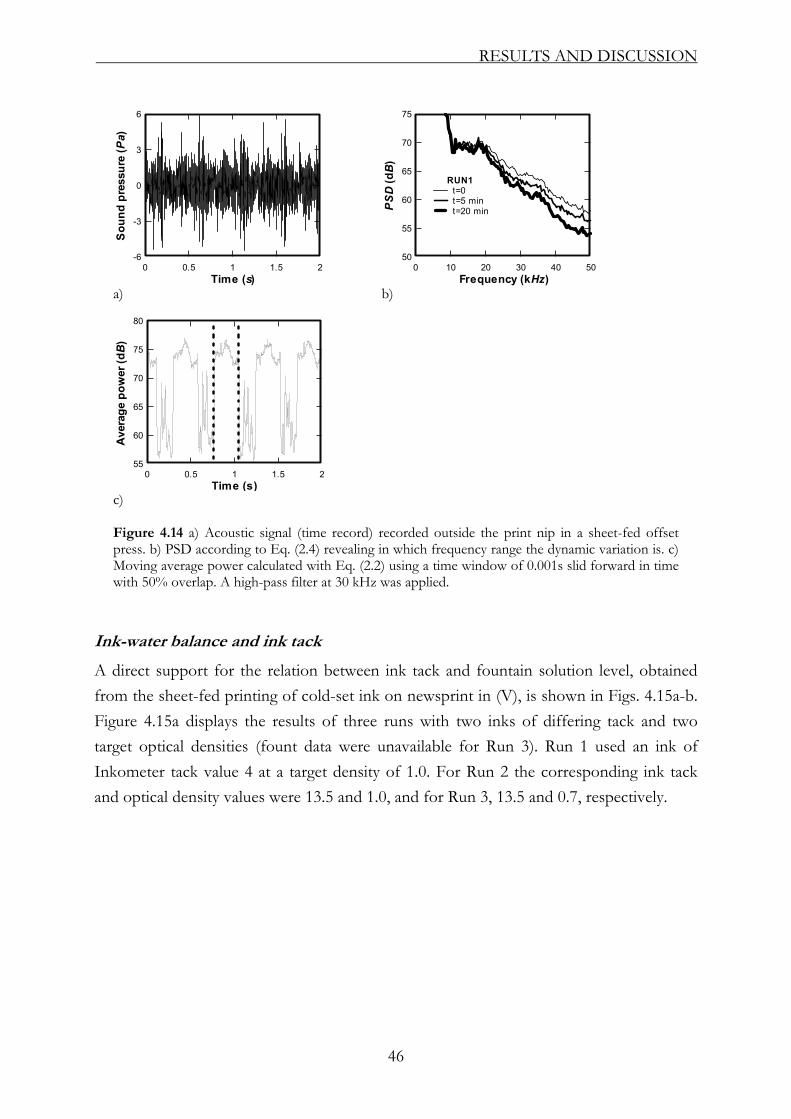
RESULTS AND DISCUSSION
Time (s)
Sou
nd p
ress
ure
(Pa)
0 0.5 1 1.5 2-6
-3
0
3
6
Frequency (kHz)
PSD
(dB
)
0 10 20 30 40 5050
55
60
65
70
75
RUN1t=0t=5 mint=20 min
a) b)
Time (s)
Ave
rage
pow
er (dB
)
0 0.5 1 1.5 255
60
65
70
75
80
c) Figure 4.14 a) Acoustic signal (time record) recorded outside the print nip in a sheet-fed offset press. b) PSD according to Eq. (2.4) revealing in which frequency range the dynamic variation is. c) Moving average power calculated with Eq. (2.2) using a time window of 0.001s slid forward in time with 50% overlap. A high-pass filter at 30 kHz was applied.
Ink-water balance and ink tack
A direct support for the relation between ink tack and fountain solution level, obtained from the sheet-fed printing of cold-set ink on newsprint in (V), is shown in Figs. 4.15a-b. Figure 4.15a displays the results of three runs with two inks of differing tack and two target optical densities (fount data were unavailable for Run 3). Run 1 used an ink of Inkometer tack value 4 at a target density of 1.0. For Run 2 the corresponding ink tack and optical density values were 13.5 and 1.0, and for Run 3, 13.5 and 0.7, respectively.
46

RESULTS AND DISCUSSION
Time (min)
Ave
rage
pow
er (dB
)
0 15 30 45 60 7566
69
72
75
78
81
RUN 1RUN 2RUN 3
Average power (dB)
FS u
sage
/she
et (m
l)
70 72 74 76 78 800.03
0.04
0.05
0.06
0.07
0.08
RUN 1RUN 2
a) b) Figure 4.15 a) Evolution of acoustic average power from printing sub-intervals, high pass filtered at 30 kHz, during all three printing runs of 7000 sheets each (V). b) Correlation between average power and fountain solution consumption for Runs 1 and 2.
Clearly, the effect of the higher tack in Run 2 compared to Run 1 is seen throughout the duration as a higher average power. The decreasing average power with fount usage in Fig. 4.15b is consistent with interpretation given for Figs. 4.11-12. One reasonable explanation for this long term effect is that fountain solution will emulsify into the ink and build up a reservoir in the ink roller-train over a longer time until some equilibrium point is achieved. After each of the one or two pauses within each run (breaks in their curves in Fig. 4.15a), there is a small increase in the average power on resumption, indicating the transient effect of fount evaporation from print nip regions to which the microphone is directed. For the same reason one would have expected a higher initial power value for Run 3, at least higher than the end value for Run 2 since the same ink is used in these two last runs and the pause is much longer. However, the lower density of 0.7 in Run 3 obviously influences the average power as well. It is also worth mentioning that the fountain solution, in addition to being indispensable for imaging, also acts as a chilling agent that contributes to the balancing effect on the printing process. Another aspect is the set of factors controlling rate of evaporation of fountain solution from the ink layer. Evaporation of fount in the form of surface water will mostly depend on its amount and the temperature and humidity of the surrounding air. For fount emulsified in the ink, the thickness, viscosity and temperature of the ink layer will certainly play a role as well. If the ink film thickness increases the average power is expected from experience to increase. However, when accounting for fount evaporation, this behaviour might not always be observed on a printing press as the fount will evaporate more rapidly from a thinner film, giving a film that is of lower fount
47

RESULTS AND DISCUSSION
concentration and hence of higher tack. All these factors will accordingly interplay to control the instantaneous tack and thus the sound emission.
Change in optical density during start up
Figure 4.16a, from the cold-set offset printing trials on newsprint using a sheet-fed offset press (IV), displays the average power of the acoustic emission from five consecutive printing series of 1000 sheets each. The steep slope (decreasing or increasing) towards
Time (min)
Ave
rage
pow
er (dB
)
0 30 60 90 12068
70
72
74
76ABCDE
Optical density
Ave
rage
pow
er (dB
)
0.8 0.9 1 1.1 1.2 1.3 1.4 1.568
70
72
74
76
ABCDE
a) b) Figure 4.16 a) Evolution of the average power during five printing series of 1000 sheets each (IV). Recordings were made every 15 s, i.e. approx. every 25 sheets. Each point is the average power over a recording duration of 2 s, in the frequency band 15-50 kHz. A band stop filter was applied over 24-27 kHz to avoid anomalous machinery sound in this range. b) Average power as a function of optical density for the print runs in a). Dotted lines show the target density and its corresponding average power.
approximately the same final power value in all series (dotted line) clearly indicates an equilibration in the printing process. One exception is Series D, for which the power remains nearly constant during the entire print run, though at the same end-value as the others. Figure 4.16b shows the time-parameterised evolution of average power as a function of optical density, with all curves approaching the steady state level when the target density is attained.
The explanation for these curves starting at different positions may be found from considerations of the ink-water balance and the ink rheology and tack at the time of press start for each series. With the general results in Figs. 4.11-12 and 4.15b being valid here as well, average power is expected to decrease on addition and emulsification of more fountain solution. Further, ink viscosity decreases at higher temperatures. For Series A, the press was started after several hours delay following the previous run, and thus the ink had to be warmed up. On becoming warmer, its viscosity decreases and accordingly it
48
RESULTS AND DISCUSSION
flows more easily, improving the ink transfer from being originally incomplete. Meanwhile, the ink-fount balance has changed from almost no fount to an emulsion throughout the ink train, but with variable concentration depending on location and film thickness on the rollers. In the 10 min. pause between Series A and B the fountain solution on the blanket and plate will rapidly evaporate due to the very thin ink film at these locations. As a consequence, the ink tack and sound are much higher at the beginning of Series B, but soon equilibrate to lower values as the fount level increases again. This same behaviour of initially decreasing average power and print density is repeated for Series C and E. Obviously more ink is transferred at the beginning of these three Series B, C and E, due to the tackier and purer ink (containing less fount) at this stage, thus explaining their correspondingly higher optical densities. Series C and D were separated by a longer rest period (30 min.) during which both fount level and temperature were free to decrease, thus tending to give the same trends as for the cold start-up in Series A. The effect is again an increasing ink transfer according to Fig. 4.16b, but with the average power remaining seemingly unaffected, presumably due to the increasing fount level counteracting the effect of larger contact area on tackiness.
49

CONCLUDING REMARKS
5 CONCLUDING REMARKS This study has shown the ability of an acoustic technique to resolve differences in ink film splitting and related phenomena occurring within and outside printing nips both on laboratory scale and on pilot scale for realistic sound levels and variations in ink and fount feeds. The technique thus possesses a great potential as on-line monitoring and feedback tool for press control, as well as a means of assessing the relevance of predictions from simpler laboratory methods. A mass-conservation model of cavitation-expansion-induced sound production was developed, and despite its simplicity its predicted power-law dependence of acoustic average power on ink load was found to agree with that measured for intermediate amounts on an inker unit. Deviations from the model at high and low ink loads could qualitatively be explained by variations of other ink load-depending rheological and topographical factors in these regimes. The fact that tack was found to be non-linearly related to average power signifies that tack is a function of the entire resistance in the ink film whereas the acoustic average power mostly depends on the sub-ambient pressure energy stored in the cavities. Average frequency related to expected variations of the cavity sizes and number of cavity events per sound wave period, influenced by ink cohesion and fountain solution droplets. To learn more about the mechanism of ink film splitting and sound emission the cavities formed has to be visualised by any technique available, e.g. high speed cinematography or heat sensors. To provide for predictability in a full-scale press-room environment calibration would be needed against the tested conditions. Real time signal evaluation and calibration might be possible through a learning procedure for the particular situation. Elaboration with different types of microphones and signal processes might be needed for integration of this technique into the control system of the press.
50
ACKNOWLEDGEMENTS
ACKNOWLEDGEMENTS
I would like to thank all present and former colleagues at YKI for your friendship, help and creative support. I am especially grateful to my supervisor Andrew Fogden. Thanks for your open and kind attitude and belief in me during these years making this work a possible task. I wish you and your family all the best back to your roots in Australia. I wish to thank Torbjörn Pettersson and Mikael Sundin for always being helpful during these years. I also would like to thank my supervisor at KTH Per Claesson and the bunch of former supervisors (at least those I remember just now) Johan Fröberg, Fredrik Tiberg and John Daicic for your support during my first years at YKI. Thanks to Vincent Craig at Australian National University for suggesting the acoustic technique and working together on the preliminary experiments. Apple should know what their simple computer microphones could do with some dirty ink. The work was performed as a part of the PrintTech Research (T2F) Program, and for partial financing support I would like to thank: The Foundation for Knowledge and Competence Development (KK-stiftelsen), The Swedish Pulp and Paper Research Foundation and Stiftelsen Grafisk Forskning. Bo Rydins Forskningsfond, SCA, is gratefully acknowledged for the financial support during my visit at APPI in Melbourne, Australia. A special thanks to Torbjörn Kloow at Acoutronic AB for provision of, and assistance with, the microphone equipment. For valuable collaboration and for bringing a patent application out of this work, I would like to thank the people at KCL and in particular Heidi Reinius and Ulla Mattila and I wish all luck to Erkki Hellen who will work further on this technique. Dr Warren Batchelor at APPI, Monash University in Melbourne is gratefully acknowledged for his contribution to two of my papers and for making the visit at APPI possible. All my love to all friends and especially to my family Ingrid, Tora and Emmy who surprisingly still wants to play ball after withstanding this battle.
51

LITTERATURE
LITTERTURE
1. ZOSEL, A., "Adhesion and Tack of Polymers: Influence of Mechanical Properties and
Surface Tensions", Colloid Polym. Sci., 263(7):541-553 (1985). 2. FEYNMAN, R., LEIGHTON, R.B. and SANDS, M., "The Feynman Lectures on Physics",
vol. 1 (1963). 3. FAHY, F., "Foundations of Engineering Acoustics", 2 ed, Acad. Pr. (2003). 4. BIKERMAN, J.J., "The Science of Adhesive Joints", 2 ed, Acad. Pr. (1968). 5. REYNOLDS, O., "On the Theory of Lubrication and Its Application to Mr. Beauchamps
Tower's Experiments, Including an Experimental Determination of the Viscosity of Olive Oil", Phil.Trans. Roy. Soc., A177:157 (1886).
6. TAYLOR, G.I., "Cavitation of a Viscous Fluid in Narrow Passages", J. Fluid Mech.:595-553 (1963).
7. DOWSON, D. and TAYLOR, C.M., "Cavitation in Bearings", Annu. Rev. Fluid Mech., 11:35-66 (1979).
8. DOWSON, D. and HIGGINSSON, G.R., "Elasto-Hydrodynamic Lubrication", Pergamon Pr., Oxford (1966).
9. COYLE, D.J., "Forward Roll Coating with Deformable Rolls: A Simple One-Dimensional Elastohydrodynamic Model", Chem. Eng. Sci., 43(10):2673-2684 (1988).
10. MACPHEE, J., SHIEH, J. and HAMROCK, B.J., "The Application of Elastohydrodynamic Lubrication Theory to the Prediction of Conditions Existing in Lithographic Printing Press Roller Nips", IARIGAI 1991, in Adv. Print. Sci. Tech. Proc., 242-276 (1992).
11. CARVALHO, M.S. and SCRIVEN, L.E., "Capillary and Viscoelastic Effect on Elastohydrodynamic Lubrication in Roller Nips", J. Trib., 118:872-879 (1996).
12. PEARSON, J.R.A., "The Stability of Uniform Viscous Flow under Rollers and Spreaders", J. Fluid Mech., 7:481-500 (1960).
13. LIM, C.H., BOHAN, M.F.J., CLAYPOL, T.C. and GETIN, D.T., "A Finite Element Investigation into a Soft Rolling Contact Supplied by a Non-Newtonian Ink", J. Phys. D: Appl. Phys., 29:1894-1903 (1996).
14. CIOC, S., "Application of the Space-Time Conservation Element and Solution Element Numerical Method to Flows in Fluid Films", Diss. Thesis, Univ. Toledo (2004).
15. RUSCHAK, K.J., "Coating Flows", Annu. Rev. Fluid Mech., 17:65-89 (1985). 16. SJODAHL, L.H., "Ink Flow on Rotating Rollers", Am. Ink Maker, 3:31 (1951). 17. BANKS, W.H. and MILL, C.C., "Some Observations on the Behaviour of Liquids between
Rotation Rollers", Proc. Roy. Soc., 414 (1954). 18. MYERS, R.R., MILLER, J.C. and ZETTLEMOYER, A.C., "The Splitting of Thin Liquid
Films. Kinematics", J. Colloid Sci., 14:287-299 (1958). 19. COVENEY, V.A., "Cavitation between Immersed Rollers", Diss. Thesis, Watford College
(1978). 20. KNAPP, R.T., DAILY, J.W. and HAMMIT, F.G., "Cavitation", McGraw-Hill (1970). 21. OZOGAN, M.S. and YOUNG, F.R., "An Experimental Study of Cavitation in Real Ink
Systems Using Temperature Measurement Techniques", J. Oil Colour Chem. Assoc., 64:249 (1981).
22. VOET, A., "The Tack of Printing Inks", Adhesion and Adhesives, Applications, Houwink, R. and Salomon, G. (Eds.), vol. 2, Elsevier Publ. Comp., (1967).
23. TAYLOR, J.H. and ZETTLEMOYER, A.C., "Hypothesis on the Mechanism of Ink Splitting During Printing", TAPPI J., 41(12):749 (1958).
24. DE GRACE, J.H. and MANGIN, P.J., "A Mechanistic Approach to Ink Transfer. Part I Effects on Substrate Properties and Press Conditions", IARIGAI 1983, in Adv. Print. Sci. Tech. Proc., 312-332 (1984).
25. BERY, Y.A. and LOEL, P.A., "Nature of Film Splitting", IPGAC Proc., 53-74 (1992). 26. VOET, A. and GEFFKEN, C.F., "The Nature of Tack", Ind. Eng. Sci., 43:1614-1623 (1951). 27. ERB, R.A. and HANSON, R.S., "Tensile Strength of Polymeric Liquids ", J. Rheol., 4(1):91-
52
LITTERATURE
116 (1960). 28. OITTINEN, P., "Fundamentals of Rheological Properties and Tack of Printing Inks and Their
Influence on Ink Behaviour in the Printing Nip", Diss. Thesis, Helsinki Univ. Tech. (1976). 29. DE GRACE, Y.H., DALPHOND, J.E. and MANGIN, P.J., "A Mechanistic Approach to Ink
Transfer, Part III: Properties of Ink Filaments in Printing Nips", IARIGAI 1991, in Adv. Print. Sci. Tech. Proc., 312 (1992).
30. AMARI, T., XIAMFU, W., HAYASHI, T. and MORITA, K., "Dynamics and Rheology of Inks Including Various Types of Gelling Agents", TAGA Proc., 354-367 (1994).
31. THOMSON, I.G. and YOUNG, F.R., "High-Speed Photographic Studies of Ink Filamentation", J. Oil Colour Chem. Assoc., 58:389-391 (1975).
32. GLATTER, T. and BOUSFIELD, D., "Print Gloss Development on a Model Substrate", TAPPI J., 80(7):125-132 (1996).
33. ERCAN, S.N., "The Influence of Process Parameters on Filament Size Distribution", Diss. Thesis, Univ. Maine (2001).
34. TANNER, R.I., "Engineering Rheology", 2nd ed, Oxford Univ. Pr. (2000). 35. TIRTAATMADJA, V. and SRIDHAR, T., "A Filament Stretching Device for Measurement of
Extensional Viscosity", J. Rheol., 37(6):1081-1102 (1993). 36. LYNE, B. and ASPLER, J.S., "Colloids and Surfaces in Reprographic Technology", Am.
Chem. Soc., 200:385-420 (1982). 37. CRETON, C. and LAKROUT, H., "Micromechanics of Flat-Probe Adhesion Tests of Soft
Viscoelastic Polymer Films", J. Polym. Sci., 38:965-979 (2000). 38. CHIKINA, I. and GAY, C., "Cavitation in Adhesives", Phys. Rev. Lett., 85(21):4546-4549
(2000). 39. SHULL, K.R., FLANIGAN, C., M., and CROSBY, A., "Fingering Instabilities of Confined
Elastic Layers in Tension", Phys. Rev. Lett., 84(14):3057-3060 (2000). 40. BULLOF, J.J., "Emulsions in Printing and the Graphic Arts", Emulsions and Emulsion
Technology, Part II, Lissant, K.J. (Ed.), vol. 6, 573-574 (1974). 41. ROSENBERG, A., "What Part Play Surface Water and Emulsified Water in the Lithographic
Process", TAGA Proc., (1985). 42. FADNER, T.A., "Surface Chemistry Control in Lithography", 16th IARIGAI Conference,
347-357 (1981). 43. BASSEMIR, R.W. and KRISHNAN, R., "Optimizing Lithographic Performance-a Physical-
Chemical Approach", TAGA Proc., 560-573 (1987). 44. CHOU, S.M. and FADNER, T.A., "Shear Stability of Fountain Solution Emulsified in
Lithographic Inks", TAGA Proc., 37-61 (1986). 45. BASSEMIR, R.W. and KRISHNAN, R., "A Study of Lithographic vs Thermodynamic
Considerations", TAGA Proc., 339-353 (1988). 46. HAYASHI, T. and AMARI, T., "Dynamics of Transfer and Splitting of Emulsified Ink",
IPGAC Proc., 75-80 (1992). 47. AURENTY, P., SCHRÖDEWR, A. and GANDINI, A., "Water in Alkyde Resin Emulsions:
Droplet Size and Interfacial Tension", Langmuir, 11(12):4712-4718 (1995). 48. AURENTY, P., PALIERNE, J.F. and GANDINI, A., "Viscoelasticity of Water/Ink Emulsions
at Low and High Frequency", Coat. Fund. Symp. Proc., 59-75 (1998). 49. XIANG, Y. and BOUSFIELD, D.W., "Effect of Fountain Solution on Ink Tack Development
and Print Quality", TAPPI Coating Conf., 179-189 (1999). 50. HARRISON, M., "An Experimental Study of Single Bubble Cavitation Noise", J. Acoustic
Soc. Am., 24(6):776-782 (1952). 51. BLAKE, W.K., "Mechanics of Flow-Induced Sound and Vibration", Acad. Pr. (1986). 52. CECCIO, S.L., "Observation of the Dynamics and Acoustics of Traveling Bubble Cavitation",
Diss. Thesis, California Inst. Tech. (1990). 53. YOUNG, F.R., "Cavitation", Imperial College Pr. (1999). 54. BRENNEN, C.E., "Fundamentals of Multiphase Flows", Cambridge Univ. Pr. (2005). 55. PLESSET, M.R. and PROSPERETTI, M.S., "Bubble Dynamics and Cavitation", Annu. Rev.
Fluid Mech., 9:145-185 (1977). 56. HOLROYD, T.J., "Acoustic Emission- an NDT Technique Evolving into a Versatile
Industrial Monitoring Method", Measurement & Control, 30(5):141-145 (1997). 57. HOWARD, P.L.J., "Noise Testing of Rolling Element Bearings", NLGI Spokesman, 39:54-60
53

LITTERATURE
(1975). 58. MIETTINEN, J. and ANDERSSON, P., "Acoustic Emission of Rolling Bearings Lubricated
with Contaminated Grease", Trib. Int., 33:777-787 (2000). 59. BRUZELIUS, K. and MBA, D., "An Initial Investigation on the Potential Applicability of
Acoustic Emission to Rail Track Fault Detection", NDT&E Int., 37:507-516 (2004). 60. SALMINEN, L.I., TOLVANEN, A.I. and ALAVA, M.J., "Acoustic Emission from Paper
Fracture", Phys. Rev. Lett., 89(18):1-4 (2002). 61. VOLTAIRE, J., "Ink Film Splitting Acoustics and Tack on Paper in Offset Printing: A
Laboratory and Theoretical Study", Lic. Thesis, Roy. Inst. Tech. and YKI, Inst. Surf. Chem. (2004).
62. VOLTAIRE, J., MATTILA, U., FOGDEN, A., NIEMINEN, S. and REINIUS, H., "Acoustic Characterisation of Film Splitting in a Hswo Printing Nip", IPGAC Proc., 21 (2004).
63. OPPENHEIM, A.V. and WILLSKY, A.S., "Signals and Systems", 2 ed, Prentice Hall Int. Inc. (1997).
64. PRESS, W.H., FLANNERY, B.P., TEUKOLSKY, S.A. and VETTERLING, W.T., "Numerical Recipes in C", Cambridge Univ. Pr. (1992).
65. SMITH, S.W., "The Scientist and Engineer's Guide to Digital Signal Processing", California Tech. Publ. (1997).
66. GANE, P.A.C. and SEYLER, E.N., "Tack Development: An Analysis of Ink/Paper Interaction in Offset Printing", Coating Conference Proc., 243-260 (1994).
67. KUMAR, S. and BRENNEN, C.E., "A Study of Pressure Pulses Generated by Traveling Bubble Cavitation", J. Fluid Mech., 255:541-564 (1993).
68. LAUTERBORN, W. and CRAMER, E., "Subharmonic Route to Chaos Observed in Acoustics", Phys. Rev. Lett., 47(20):1445-1447 (1981).
69. NEPPIRAS, E.A., "Acoustic Cavitation", Phys. Rep., 61(3):159-251 (1980). 70. NEPPIRAS, E.A., "Subharmonic and Other Low-Frequency Emission from Bubbles in
Sound-Irradiated Liquids", J. Acoustic Soc. Am., 46(3):587-601 (1969). 71. LAUTERBORN, W., "Numerical Investigation of Nonlinear Oscillations of Gas Bubbles in
Liquids", J. Acoustic Soc. Am., 59(2):283-293 (1976). 72. FLYNN, H.G., "Cavitation Dynamics I. A Mathematical Formulation", J Acoustic Soc Am,
57(6):1379-1396 (1975). 73. FLYNN, H.G., "Cavitation Dynamics II. Free Pulsations and Models for Cavitation Bubbles",
J. Acoustic Soc. Am., 58(6):1160-1170 (1975). 74. PLOG, J.P., "Investigation of the Visco-Elastic Behaviour of Water Soluble Cellulosic
Derivatives in Uniaxial Elongation", Diss. Thesis, (2005). 75. BOUSFIELD, D.W., KEUNINGS, R., MARRUCCI, G. and DENN, M.M., "Nonlinear
Analysis of the Surface-Tension Driven Breakup of Viscoelastic Fluid Filaments", J. Non-Newt. Fluid Mech., 21:79-97 (1986).
76. RASMUSSEN, H.K. and HASSAGER, O., "The Role of Surface Tension on the Elastic Decohesion of Polymeric Filaments ", J. Rheol., 45:527-537 (2001).
77. SPIEGELBERG, S.H. and MCKINLEY, G.H., "Stress Relaxation and Elastic Decohesion of Viscoelastic Polymer Solutions in Extensional Flow", J. Non-Newt. Fluid Mech., 67:49-76 (1996).
78. HOFFMAN, R.D. and MYERS R.R., "The Splitting of Thin Liquid Films. II Cavitation Dynamics", Trans. Soc. Rheol., 6(1):197-207 (1962).
79. GOPAL, E.S.R., "Principles of Emulsion Formation", Emulsion Science, Sherman, P. (Ed.), Acad. Pr., 1-75 (1969).
80. IWAKI, T., SATO, K. and NIMODA, T., "Ink Water Emulsified State in Offset Printing", TAGA Proc., (1990).
54