injury morbidity surveillance in nyanga and …...injury morbidity surveillance in nyanga and...
TRANSCRIPT
Injury Morbidity Surveillance in Nyanga and Khayelitsha in the Western Cape
Phase 3 Summary Report September/October 2014
Linda Mureithi1, Algernon Africa1, Nienke van Schaik1,
Tracey Naledi2, Richard Matzopoulos3,4 and René English1
March 2015
1 Health Systems Trust
2 Health Impact Assessment Unit, Provincial Government of the Western Cape
3 University of Cape Town
4 South African Medical Research Council
Report prepared for:
Report prepared by:
Dr Anthony Hawkridge
Director: Health Impact Assessment Unit Western Cape Department of Health
Dr Richard Matzopoulos
Principal Investigator IDRC Project Specialist Scientist SAMRC/UCT School of Public Health
Health Systems Trust
34 Essex Terrace Westville 3630 Tel.: +27 (0)31 266 9090 Fax: +27 (0)31 266 9199
Suggested citation: Mureithi L, Africa A, Van Schaik N, Naledi T, Matzopoulos R, English R. Injury Morbidity Surveillance in Nyanga and Khayelitsha in the Western Cape – Phase 3 Summary Report September/October 2014. Durban: Health Systems Trust; 2015. © Health Systems Trust (2015). All rights reserved. The copyright in the compilation of this publication, its name and logo is owned by Health Systems Trust. You may not reproduce this publication or its name or the Health Systems Trust’s logo or its trademarks, including those of any third party that appears in this publication, in any form, or for commercial purposes, or for purposes of advertising, publicity, promotion, or in any other manner implying their endorsement, sponsorship of, or affiliation with any product or service, without Health Systems Trust’s prior express written permission. All information in this publication is provided in good faith but is relied upon entirely at your own risk. By making use of this publication and its information, you agree to indemnify Health Systems Trust, its Board of Trustees, employees and service providers from all liability arising from its use.

Acknowledgments
This work was jointly funded by the Western Cape Department of Health’s Health
Impact Assessment Unit and with the aid of a grant from the International
Development Research Centre, Ottawa, Canada. The authors thank the hospital,
facility and emergency centre unit managers at the six facilities included in this rapid
assessment for their time and co-operation, and for allowing us access to the
facilities to conduct the study. We are also grateful to the facility staff members who
tirelessly attended to those with injuries and co-operated graciously with the data
capturers. In addition, we thank the Violence Prevention for Urban Upgrading team
for providing the mapped sub-areas of Khayelitsha and Nyanga used in this study, as
well as Mobenzi Researcher for assistance in developing the mobile version of the
data-collection tool used.

Injury Morbidity Surveillance in Nyanga and Khayelitsha: Phase 3 Summary Report i
Table of contents
Introduction ........................................................................................................ 1 1.
Aims and objectives............................................................................................ 1 2.
Methodology ....................................................................................................... 1 3.
3.1 Interviews with injured patients ...................................................................... 2 3.2 Emergency centre register data on all cases ................................................. 2 Data analysis ...................................................................................................... 2 4.
Data quality issues ............................................................................................. 3 5.
Findings.............................................................................................................. 4 6.
6.1 Total cases seen, by facility ........................................................................... 5 6.2 Injury cases by facility .................................................................................... 8 6.3 Age distribution of injuries ............................................................................ 10 6.4 Cause of injury ............................................................................................. 10
6.4.1 Violent injuries ...................................................................................... 10 6.4.2 Transport-related injuries ..................................................................... 14 6.4.3 Unintentional injuries ............................................................................ 17 6.4.4 Self-harm injuries ................................................................................. 19
Alcohol and drug use and injuries ..................................................................... 21 7.
Location of injuries ........................................................................................... 22 8.
Summary .......................................................................................................... 24 9.
References ....................................................................................................... 25 10.
Appendix A: Data collection form ............................................................................. 26
Appendix B: League table ranking specific cause of injury by age category ............ 28
Appendix C: Comparison between 2012/2013/2014 surveys ................................... 29
Injury Morbidity Surveillance in Nyanga and Khayelitsha: Phase 3 Summary Report ii
List of tables
Table 1: Characteristics of total cases seen, by facility .............................................. 5
Table 2: Proportion of injury and non-injury cases by facility, n (%) ........................... 6
Table 3: Characteristics of injury cases assessed, by facility ..................................... 8
Table 4: Overview of main causes of injury ............................................................. 10
Table 5: Characteristics of violent injuries by gender ............................................... 12
Table 6: Characteristics of transport-related injuries by gender ............................... 15
Table 7: Characteristics of unintentional injuries by gender ..................................... 17
Table 8: Characteristics of self-harm injuries by gender .......................................... 19
Table 9: Location of injury by area and sub-area ..................................................... 22
Table 10: League table showing leading specific causes of injury by age category . 28
Table 11: Proportion of injury and non-injury cases by facility – 2012/2013/2014
surveys .................................................................................................................... 29
Table 12: Probable alcohol use by gender and cause of injury – 2012/2013/2014
surveys .................................................................................................................... 29
Table 13: Proportion of injury cases by cause – 2012/2013/2014 surveys ............... 30
List of figures
Figure 1: Flowchart of patients interviewed ............................................................... 4
Figure 2: Number of injury and non-injury cases by facility ........................................ 6
Figure 3: Proportion of injury and non-injury cases presenting by day of week (%) ... 7
Figure 4: Age distribution of injuries by gender ........................................................ 10
Figure 5: Probable alcohol use and cause of injury among males ........................... 21
Figure 6: Probable alcohol use and cause of injury among females ........................ 21
Figure 7: Proportion of injury and non-injury cases by facility – 2012, 2013 and 2014
surveys .................................................................................................................... 30

Injury Morbidity Surveillance in Nyanga and Khayelitsha: Phase 3 Summary Report iii
List of abbreviations
DoB date of birth
CFU clinical forensic unit
CHC community health centre
EC emergency centre
GFJ GF Jooste Hospital
HST Health Systems Trust
ICU intensive care unit
IDRC International Development Research Centre
IPWG Injury Prevention Work Group
KDH Khayelitsha District Hospital
MM Michael Mapongwana Community Health Centre
Perp. perpetrator(s)
PoP plaster of Paris
RA rapid assessment
SAMRC South African Medical Research Council
S.H. self-harm
UCT University of Cape Town
Viol. violence
WC Western Cape

Injury Morbidity Surveillance in Nyanga and Khayelitsha: Phase 3 Summary Report iv
Definitions
The following definitions apply to the study form, given in Appendix A.
Injury: an injury case is defined as any patient presenting for a first presentation of
an acute injury (within 24 hours of the injury).
Non-injury: a non-injury case is defined as any patient not presenting for a first
presentation of an injury and includes: medical cases, surgical non-injury cases and
injury cases presenting for follow-up of an acute injury (e.g. wound dressing, suture
removal, PoP removal or check, x-ray, circulation check).
Violence:
Violent injuries: violent injuries are defined as injuries resulting from the intentional
use of physical force, threatened or actual, against another person, or against a
group of people or a community.1
Sharp object: where the cause of the violent injury was as a result of sharp object
such as a knife, blade or broken bottle.
Blunt object: when injury was inflicted with a blunt object and was not as a result of
a push, kick or punch.
Community assault: where the reason for visit indicated community assault or if the
reason was assault, and multiple community members were recorded as those
responsible for the injury.
Push, kick or punch: this included injury cases that were reported or documented
as assaults with no mention of an object being used.
Burn: where the reason for visit stated that an individual was purposefully burnt by
another person, or if the injury was reported to be due to assault with a hot object or
liquid or food. This was then classified as either violence due to fire burn or other
burn.
Human bite: human bites were considered violent injuries.
Violence unknown: where the injury was classified as violent, but there was
insufficient information to further sub-classify the injury into one of the other groups.
Type of violence
Rape or sexual assault: this included sexual assault cases reviewed through
retrospective folder reviews and the clinical forensic units (CFUs) at Khayelitsha
District Hospital (KDH) and GF Jooste Hospital (GFJ). The number of cases may be
higher than reported, as only cases that presented through these two units were
reviewed.
Child abuse: where the injury was reported as being the result of a purposeful act of
violence against a minor.
Gang-related: where the violence was reported to be the result of gang-related
activities, whether as a victim or perpetrator.

Injury Morbidity Surveillance in Nyanga and Khayelitsha: Phase 3 Summary Report v
Crime-related: where the injury was reported to be associated with a crime such as
a mugging or robbery.
Interpersonal violence: when a violent injury did not fit any one of the first four
types of violent injury, it was classified as being due to interpersonal violence.
Self-harm: injuries due to intentional self-harm. These can include methods such as
sharp object, firearm, fire burn, jump, hanging and paraffin poisoning.
Other poisoning: where the reason stated was that the injury was an “overdose”;
this includes those in which the substance was mentioned, as well as those in which
no specific poisonous substance was reported.
Unknown self-harm: when the reason stated was that the injury was an “attempted
suicide” or “parasuicide”, but no specific cause or method was reported.
Other specific cause or method: self-harm not falling into any of the available
categories, with the option of specifying the reason.
Unintentional: non-transport-related unintentional injuries are classified as
unintentional and include accidental burns. Various methods are listed in the form in
Appendix A.
The following require additional explanation:
Fall: where the information stated that the injury was due to a fall. Falls are classified
as fall on level, fall from height or fall on stairs.
Other bite/sting: where the injury was due to a bite by an animal other than a dog
(e.g. snake bite, insect bite or spider bite).
Other specific cause or method: where the cause or method was accidental and
did not fit into any of the other categories, cases were sub-classified as unintentional
with the option of specifying the cause.
Other poisoning: where the reason indicated unintentional poisoning with a
substance other than paraffin.
Probable alcohol use:
Yes/suspected: if the patient reported consuming alcohol or was deemed to be
obviously under the influence of alcohol, as observed by the data collector or medical
staff (or as recorded in the patient file).
No: if the patient denied consuming alcohol and was not deemed to be obviously
under the influence of alcohol, as observed by the data collector or medical staff (or
as recorded in the patient file).
Unknown: if the patient refused to answer or was unable to answer and was not
deemed to be obviously under the influence of alcohol, as observed by the data
collector or medical staff (or as recorded in the patient file), and/or there was no
documentation relating to alcohol in the file.
Injury Morbidity Surveillance in Nyanga and Khayelitsha: Phase 3 Summary Report vi
Probable drug use:
Yes/suspected: if the patient reported using drugs or was deemed to be obviously
under the influence of drugs, as observed by the medical staff (or as recorded in the
patient file).
No: if the patient denied using drugs and was not deemed to be obviously under the
influence of drugs, as observed by the medical staff (or as recorded in the patient
file).
Unknown: if the patient refused to answer or was unable to answer and was not
deemed to be obviously under the influence of drugs, as observed by the medical
staff (or as recorded in the patient file), and/or there was no documentation relating to
drug use in the file.

Injury Morbidity Surveillance in Nyanga and Khayelitsha: Phase 3 Summary Report 1
Introduction 1.
In 2012 Health Systems Trust (HST) conducted a rapid assessment (RA) to collect
comprehensive information on injuries in order to determine high-risk population sub-
groups and areas in Khayelitsha, Nyanga and Elsies River. These are three out of
five high-violence communities identified by the Western Cape (WC) Provincial
Government’s Injury Prevention Work Group (IPWG) as requiring targeted injury
prevention efforts. The RA revealed that much higher percentages of women and
children suffer violent injuries (non-fatal) than are reflected in local mortality statistics,
where transport-related injuries are the leading cause of fatal injury among
females.2,3 This initial RA highlighted the importance of facility-level data for
monitoring injury morbidity and its value in informing health service planning, as well
as for the development of targeted interventions. HST was subsequently requested
to conduct repeat RAs in two of the aforementioned communities in order to monitor
trends over time and evaluate the effectiveness of interventions, in addition to
establishing the risk profile in these areas. The repeat surveillance also forms part of
two International Development Research Centre (IDRC) funded studies: “Evaluating
the effectiveness of urban upgrading for violence prevention in selected low-income
communities in the Western Cape Province, South Africa” and “Evaluating the
effectiveness of the Western Cape Liquor Act in Khayelitsha, a large low-income
community in Cape Town, South Africa”. This is the third in a series of six-monthly
RAs to be conducted between September 2013 and October 2015.
Aims and objectives 2.
The aims of this study are:
To conduct an RA of injury morbidity presenting at district-level health services in
six facilities in Khayelitsha and Nyanga, which are two out of five previously
identified high-violence communities in the WC Province;
To establish a risk profile of injuries presenting in these areas through
identification of high-risk population sub-groups and high-risk areas for injury, as
well as monitor trends over time and evaluate the effectiveness of interventions.
The facilities included in this assessment comprise hospitals and community
health centres (CHCs).
The objectives are:
To collect detailed information (basic demographic data, triage code, cause,
location, time, details of perpetrator, and injury type data) on each trauma case
presenting at each of the six health facilities over a one-week period;
To establish the proportion of injuries in these areas associated with obvious
alcohol and/or drug use.
Methodology 3.
The six facilities included in this RA are:
Khayelitsha District Hospital (KDH)
Khayelitsha Site B CHC
Michael Mapongwana (MM) CHC
Gugulethu CHC

Injury Morbidity Surveillance in Nyanga and Khayelitsha: Phase 3 Summary Report 2
Nyanga CHC
Heideveld CHC.a
3.1 Interviews with injured patients
Basic demographic data were collected by trained data collectors 24 hours per day,
and captured directly into an electronic standardised questionnaire (Appendix A)
downloaded onto a mobile phone. Information was captured on all individuals seen in
the Casualty Department/Emergency Centre (EC) from 07h00 on 25 September
2014 to 07h00 on 02 October 2014. Patients presenting with injuries were
interviewed, where possible, to obtain further details on their injuries, such as
location, alcohol use, and who they were injured by, as well as the time at which the
injury occurred. Informed consent was obtained prior to the interviews taking place. A
waiver of consent was provided by the University of Cape Town Human Research
and Ethics Committee for certain subsets of patients. These data were then collected
either at the time of injury by data collectors using patient files (for those unable to
consent due to severity of injury), or by a trained researcher retrospectively using
registers and patient files. Data collection on sexual assault cases seen at the clinical
forensic units (CFUs) during the same one-week period was also done through
retrospective folder reviews. Due to the small number of injury cases seen at Nyanga
CHC in the first RA, a decision was taken to conduct only retrospective folder reviews
at this facility in subsequent RAs.
3.2 Emergency centre register data on all cases
In addition to information on injuries collected via interviews, data on all individuals
(injury and non-injury) seen in the EC during the same period (25 September to 2
October 2014), as captured in the EC register by healthcare staff, were captured onto
the same database. The data capturers used the same electronic tool and mobile
phones to capture data. This was done between 25 September and 13 October
2014. Information collected included basic demographic data (date of birth, gender),
identifying particulars (name, folder number), date of visit to EC, triage code and
reason for visit. Data capturers were given a list of all injury cases interviewed and
already captured onto the database, and these cases were not recaptured. Where it
was noted that an injury case had not been interviewed, these folders were
requested for subsequent folder review.
Data analysis 4.
Data captured on the electronic database were exported as a Microsoft Excel file and
were then imported into STATA version 12.0 (StataCorp, Texas, USA) for further
analysis. During data cleaning, duplicates were identified and dropped. Where a
patient was referred from one facility to another, only the initial visit at the first facility
was included for the detailed analysis of injury data. Visits at other facilities were
included in the total tally for each facility (see Tables 1 and 2) but not in subsequent
analyses. Proportions were calculated for categorical variables. The t-test was used
to test for significant differences between proportions calculated where appropriate. A
further detailed analysis will be performed as part of the final report on completion of
all five surveys.
a In the first two RAs data collection occurred at GFJ Hospital. However, at the time of this third RA. GFJ Hospital was undergoing ongoing restructuring changes, a process that started in October 2013. The emergency unit was relocated to Heideveld CHC, and all other hospital wards were moved to Mitchells Plain District Hospital. Data collection for this RA was therefore conducted at Heideveld CHC.

Injury Morbidity Surveillance in Nyanga and Khayelitsha: Phase 3 Summary Report 3
Data quality issues 5.
In the first two RAs data collection was done at GFJ Hospital. However, at the time of
this third RA, GFJ Hospital was undergoing ongoing restructuring changes, a process
that started in October 2013. The emergency unit was relocated to Heideveld CHC,
and all other hospital wards were moved to Mitchells Plain District Hospital. Data
collection for this RA was therefore conducted at Heideveld CHC.
In addition, polytrauma cases from GFJ Hospital’s drainage area that would normally
have been seen at this facility are referred directly to Groote Schuur Hospital. This
may have resulted in fewer injury cases, particularly severe injuries, being seen at
Heideveld CDC, as compared to those seen at GFJ during the initial study in 2012.
Where folder numbers were missing, data collectors were asked to use “9999”;
unique numbers were then created and allocated for each case retrospectively during
data cleaning and analysis.
Some cases were classified inappropriately: eighteen unintentional injuries were
misclassified as self-harm, and one transport-related and one violent injury were
misclassified as unintentional injuries. These cases were reclassified retrospectively,
as appropriate, using the reason for visit captured in patient files.

Injury Morbidity Surveillance in Nyanga and Khayelitsha: Phase 3 Summary Report 4
Findings 6.
Figure 1 gives an overview of patients seen at all six facilities – both non-injury and
injury cases. Table 1 and Table 3 give an overview of the main characteristics of total
cases and injury cases respectively, interviewed by facility.
Figure 1: Flowchart of patients interviewedb
b Injury cases were assessed primarily via interview. Folder reviews were done for a subset of patients (see Section 3 above). Where a hospital folder could not be located or a folder had missing notes on the relevant visit, the EC register data (basic demographic data only) were captured.
Total acute injury cases captured N=687
b
1 179 non-injury cases (includes 18 follow-up injury cases inadvertently interviewed)
First presentation injury cases interviewed
N=669
18 duplicate interfacility referral cases excluded
550 (82.2%) interviews 119 (17.8%) folder reviews
b
Total cases seen at all six facilities (injury and non-injury)
N=1 866

Injury Morbidity Surveillance in Nyanga and Khayelitsha: Phase 3 Summary Report 5
6.1 Total cases seen, by facility
A total of 1 866 cases were seen at all six facilities over the one-week period. Of
these, 687 (36.8%) were injury cases. Table 1 shows the characteristics of all cases
seen, by facility.
Table 1: Characteristics of total cases seen, by facility
Baseline characteristics of total cases seen by facility
Area Khayelitsha Nyanga Total
Facility KDH Site B Michael M Nyanga Gugulethu Heideveld
n= 404 n= 511 n=120 n= 101 n= 465 n= 265 1 866
Patient demographics
Gender, n (%)
Male 227 (56.2) 253 (49.5) 58 (48.3) 41 (40.6) 242 (52.0) 149 (56.2) 970 (52.0)
Female 177 (43.8) 258 (50.5) 62 (51.7) 60 (59.4) 223 (48.0) 116 (43.8) 896 (48.0)
Race, n (%)
Black 402 (99.5) 508 (99.4) 120 (100.0) 101 (100.0) 458 (98.5) 114 (43.0) 1 703 (91.3)
Coloured 2 (0.5) 2 (0.4) 0 (0) 0 (0) 5 (1.1) 151 (57.0) 160 (8.6)
Asian 0 (0) 1 (0.2) 0 (0) 0 (0) 2 (0.4) 0 (0) 3 (0.2)
White 0 (0) 0 (0) 0 (0) 0 (0) 0 (0) 0 (0) 0 (0)
Age group, n (%)
<1 17 (4.2) 21 (4.1) 12 (10.0) 0 (0) 13 (2.8) 0 (0) 63 (3.4)
1-4 11 (2.7) 25 (4.9) 16 (13.3) 2 (2.0) 33 (7.1) 9 (3.4) 96 (5.1)
5-9 12 (3.0) 30 (5.9) 11 (9.2) 0 (0) 21 (4.5) 7 (2.6) 81 (4.3)
10-14 8 (2.0) 19 (3.7) 3 (2.5) 0 (0) 22 (4.7) 7 (2.6) 59 (3.2)
15-19 29 (7.2) 40 (7.8) 1 (0.8) 8 (7.9) 42 (9.0) 12 (4.5) 132 (7.1)
20-24 46 (11.4) 67 (13.1) 6 (5.0) 7 (6.9) 64 (13.8) 24 (9.1) 214 (11.5)
25-34 106 (26.2) 130 (25.4) 13 (10.8) 19 (18.8) 127 (27.3) 59 (22.3) 454 (24.3)
35-44 78 (19.3) 75 (14.7) 19 (15.8) 9 (8.9) 54 (11.6) 38 (14.3) 273 (14.6)
45-54 47 (11.6) 43 (8.4) 15 (12.5) 13 (12.9) 45 (9.7) 36 (13.6) 199 (10.7)
55-64 26 (6.4) 24 (4.7) 14 (11.7) 33 (32.7) 18 (3.9) 28 (10.6) 143 (7.7)
>65 24 (5.9) 37 (7.2) 10 (8.3) 10 (9.9) 26 (5.6) 45 (17.0) 152 (8.2)
Unknown age 0 (0) 0 (0) 0 (0) 0 (0) 0 (0) 0 (0) 0 (0)
Triage code, n (%)
Red 84 (20.8) 7 (1.4) 0 (0) 0 (0) 12 (2.6) 17 (6.4) 120 (6.4)
Orange 47 (11.6) 217 (42.5) 7 (5.8) 0 (0) 147 (31.6) 104 (39.3) 522 (28.0)
Yellow 227 (56.2) 243 (47.5) 74 (61.7) 0 (0) 223 (48.0) 82 (30.9) 849 (45.5)
Green 26 (6.4) 33 (6.5) 39 (32.5) 0 (0) 70 (15.1) 20 (7.5) 188 (10.1)
Blue 0 (0) 1 (0.2) 0 (0) 0 (0) 5 (1.1) 0 (0) 6 (0.3)
Not recorded 20 (5.0) 10 (2.0) 0 (0) 101 (100.0) 8 (1.7) 42 (15.9) 181 (9.7)
Day of week, n (%)
Monday 56 (13.9) 77 (15.1) 25 (20.8) 31 (30.7) 40 (8.6) 35 (13.2) 264 (14.2)
Tuesday 71 (17.6) 52 (10.2) 33 (27.5) 5 (5.0) 19 (4.1) 12 (4.5) 192 (10.3)
Wednesday 65 (16.1) 65 (12.7) 14 (11.7) 15 (14.9) 22 (4.7) 45 (17.0) 226 (12.1)
Thursday 53 (13.1) 72 (14.1) 27 (22.5) 18 (17.8) 132 (28.4) 47 (17.7) 349 (18.7)
Friday 31 (7.6) 51 (10.0) 21 (17.5) 32 (31.7) 53 (11.4) 38 (14.3) 226 (12.1)
Saturday 58 (14.4) 76 (14.9) 0 (0) 0 (0) 83 (17.9) 33 (12.5) 250 (13.4)
Sunday 70 (17.3) 118 (23.1) 0 (0) 0 (0) 116 (25.0) 55 (20.8) 359 (19.2)

Injury Morbidity Surveillance in Nyanga and Khayelitsha: Phase 3 Summary Report 6
Almost half of all EC visits (45.5%) were triaged yellow (and therefore non-urgent)
and a further 28.0% orange. In 9.7% of all cases the triage code could not be
determined from the information available in either the EC register or the patient
notes. Table 2 and Figure 2 show the distribution of injury and non-injury cases, by
facility. The proportion of injury cases varied from 3.0% at Nyanga CHCc to 48.0% at
Gugulethu CHC.
Table 2: Proportion of injury and non-injury cases by facility, n (%)
Facility Injury cases Non-injury cases Total cases
KDH 143 (35.4) 261 (64.6) 404 (100.0)
Site B 216 (42.3) 295 (57.7) 511 (100.0)
MM 30 (25.0) 90 (75.0) 120 (100.0)
Gugulethu 223 (48.0) 242 (52.0) 465 (100.0)
Heideveld 72 (27.2) 193 (72.8) 265 (100.0)
Nyanga 3 (3.0) 98 (97.0) 101 (100.0)
Total 687 (36.8) 1 179 (63.2) 1 866 (100.0)
Figure 2: Number of injury and non-injury cases by facility
Injury cases presenting to facilities increased sharply towards the end of the week peaking on Sunday when over half (59.3%) of all cases seen were injuries (see Figure 3) .
c Nyanga and Michael Mapongwana CHCs are 12-hour facilities and are closed during the weekend. As such a much lower proportion of acute injuries present to these facilities.
261 295
90 98
242 193
143
216
30 3
223
72
0
100
200
300
400
500
600
KDH Site B MM Nyanga Gugulethu Heideveld
Nu
mb
er
of
case
s
Facility
Non-injury cases Injury cases

Injury Morbidity Surveillance in Nyanga and Khayelitsha: Phase 3 Summary Report 7
Figure 3: Proportion of injury and non-injury cases presenting by day of week (%)
36.4 29.7 32.7 22.4 27.4
42.8 59.3
63.6 70.3 67.3 77.7 72.6
57.2 40.7
0.0
20.0
40.0
60.0
80.0
100.0
Monday Tuesday Wednesday Thursday Friday Saturday Sunday
%
Day of week
Proportion of injury & non-injury cases by day of week (%) (N=1866) Injury Non-injury

Injury Morbidity Surveillance in Nyanga and Khayelitsha: Phase 3 Summary Report 8
6.2 Injury cases by facility
A total of 687 injury cases were interviewed during the study period. As in the
previous three surveys, Gugulethu CHC saw the highest number of injuries (223
cases) (See Table 3.) Overall, males accounted for the majority of injury cases
(65.1%). Most injuries occurred on Sunday (31.0%) and Saturday (15.6%). The bulk
of injuries were triaged yellow (50.2%), and a further 32.0% orange. Only 5.0% of
cases had no triage code recorded. With regard to time of injury, 34.1% of injuries
were reported to have occurred between 13h00 (1 p.m.) and 19h00 (7 p.m.), and a
further 33.2% between 19h00 (7 p.m.) and 01h00 (1 a.m.). With regard to place or
scene of injury, 32.5% were reported to have occurred in the home and 26.2% in on
a highway, street or road.
Table 3: Characteristics of injury cases assessed, by facility
Characteristics of injury cases seen by facility
Area Khayelitsha Nyanga Total
Facility KDH Site B Michael M Nyanga Gugulethu Heideveld
n=143 n=216 n=30 n=3 n=223 n=72 N=687
Patient demographics
Gender, n (%)
Male 100 (69.9) 134 (62.0) 16 (53.3) 1 (33.3) 148 (66.4) 48 (66.7) 447 (65.1)
Female 43 (30.1) 82 (38.0) 14 (46.7) 2 (66.7) 75 (33.6) 24 (33.3) 240 (34.9)
Race, n (%)
Black 142 (99.3) 215 (99.5) 30 (100.0) 3 (100.0) 220 (98.7) 27 (37.5) 637 (92.7)
Coloured 1 (0.7) 0 (0) 0 (0) 0 (0) 2 (0.9) 45 (62.5) 48 (7.0)
Asian 0 (0) 1 (0.5) 0 (0) 0 (0) 1 (0.5) 0 (0) 2 (0.3)
White 0 (0) 0 (0) 0 (0) 0 (0) 0 (0) 0 (0) 0 (0)
Age group, n (%)
<1 1 (0.7) 1 (0.5) 1 (3.3) 0 (0) 2 (0.9) 0 (0) 5 (0.7)
1-4 5 (3.5) 10 (4.6) 3 (10.0) 1 (33.3) 16 (7.2) 3 (4.2) 38 (5.5)
5-9 10 (7.0) 16 (7.4) 7 (23.3) 0 (0) 13 (5.8) 4 (5.6) 50 (7.3)
10-14 6 (4.2) 13 (6.0) 2 (6.7) 0 (0) 12 (5.4) 3 (4.2) 36 (5.2)
15-19 13 (9.1) 21 (9.7) 1 (3.3) 0 (0) 26 (11.7) 7 (9.7) 68 (9.9)
20-24 28 (19.6) 33 (15.3) 4 (13.3) 0 (0) 37 (16.6) 16 (22.2) 118 (17.2)
25-34 45 (31.5) 75 (34.7) 2 (6.7) 0 (0) 72 (32.3) 13 (18.1) 207 (30.1)
35-44 20 (14.0) 21 (9.7) 7 (23.3) 1 (33.3) 23 (10.3) 15 (20.8) 87 (12.7)
45-54 9 (6.3) 11 (5.1) 2 (6.7) 1 (33.3) 17 (7.6) 4 (5.6) 44 (6.4)
55-64 3 (2.1) 5 (2.3) 1 (3.3) 0 (0) 2 (0.9) 2 (2.8) 13 (1.9)
>65 3 (2.1) 10 (4.6) 0 (0) 0 (0) 3 (1.4) 5 (6.9) 21 (3.1)
Unknown age 0 (0) 0 (0) 0 (0) 0 (0) 0 (0) 0 (0) 0 (0)
Day of week, n (%)
Monday 16 (11.2) 32 (14.8) 12 (40.0) 0 (0) 29 (13.0) 7 (9.7) 96 (14.0)
Tuesday 10 (7.0) 15 (6.9) 10 (33.3) 0 (0) 18 (8.1) 4 (5.6) 57 (8.3)
Wednesday 11 (7.7) 24 (11.1) 3 (10.0) 2 (66.7) 20 (9.0) 14 (19.4) 74 (10.8)
Thursday 25 (17.5) 20 (9.3) 3 (10.0) 0 (0) 21 (9.4) 9 (12.5) 78 (11.4)
Friday 11 (7.7) 14 (6.5) 2 (6.7) 1 (33.3) 28 (12.6) 6 (8.3) 62 (9.0)
Saturday 21 (14.7) 39 (18.1) 0 (0) 0 (0) 37 (16.6) 10 (13.9) 107 (15.6)
Sunday 49 (34.3) 72 (33.3) 0 (0) 0 (0) 70 (31.4) 22 (30.6) 213 (31.0)
Triage code, n (%)
Red 33 (23.1) 1 (0.5) 0 (0) 0 (0) 7 (3.1) 3 (4.2) 44 (6.4)
Orange 27 (18.9) 87 (40.3) 7 (23.3) 0 (0) 84 (37.7) 15 (20.8) 220 (32.0)
Yellow 47 (32.9) 116 (53.7) 22 (73.3) 0 (0) 127 (57.0) 33 (45.8) 345 (50.2)
Green 20 (14.0) 10 (4.6) 1 (3.3) 0 (0) 4 (1.8) 8 (11.1) 43 (6.3)
Blue 0 (0) 0 (0) 0 (0) 0 (0) 1 (0.5) 0 (0) 1 (0.2)
Unknown 16 (11.2) 2 (0.9) 0 (0) 3 (100.0) 0 (0) 13 (18.1) 34 (5.0)

Injury Morbidity Surveillance in Nyanga and Khayelitsha: Phase 3 Summary Report 9
Characteristics of injury cases seen by facility
Area Khayelitsha Nyanga Total
Facility KDH Site B Michael M Nyanga Gugulethu Heideveld
n=143 n=216 n=30 n=3 n=223 n=72 N=687
Alcohol, n (%)
Yes/Suspected 37 (25.9) 82 (38.0) 4 (13.3) 1 (33.3) 97 (43.5) 21 (29.2) 242 (35.2)
No 81 (56.6) 69 (31.9) 26 (86.7) 2 (66.7) 122 (54.7) 30 (41.7) 330 (48.0)
Unknown 25 (17.5) 65 (30.1) 0 (0) 0 (0) 4 (1.8) 21 (29.2) 115 (16.7)
Drugs, n (%)
Yes/Suspected 8 (5.6) 44 (20.4) 4 (13.3) 0 (0) 20 (9.0) 4 (5.6) 80 (11.6)
No 101 (70.6) 108 (50.0) 26 (86.7) 3 (100.0) 195 (87.4) 48 (66.7) 481 (70.0)
Unknown 34 (23.8) 64 (29.6) 0 (0) 0 (0) 8 (3.6) 20 (27.8) 126 (18.3)
Cause of injury, n (%)
Violence 104 (72.7) 129 (59.7) 6 (20.0) 0 (0) 125 (56.1) 43 (59.7) 407 (59.2)
Transport 13 (9.1) 18 (8.3) 2 (6.7) 1 (33.3) 38 (17.0) 17 (23.6) 89 (13.0)
Unintentional 20 (14.0) 67 (31.0) 22 (73.3) 2 (66.7) 56 (25.1) 10 (13.9) 177 (25.8)
Self-harm 6 (4.2) 2 (0.9) 0 (0) 0 (0) 4 (1.8) 2 (2.8) 14 (2.0)
Time of injury, n (%)
7am- 1pm 26 (18.2) 59 (27.3) 9 (30.0) 1 (33.3) 36 (16.1) 9 (12.5) 140 (20.4)
1pm-7pm 40 (28.0) 67 (31.0) 14 (46.7) 1 (33.3) 80 (35.9) 32 (44.4) 234 (34.1)
7pm-1am 48 (33.6) 65 (30.1) 7 (23.3) 1 (33.3) 83 (37.2) 24 (33.3) 228 (33.2)
1am-7am 29 (20.3) 25 (11.6) 0 (0) 0 (0) 24 (10.8) 7 (9.7) 85 (12.4)
Place or scene or injury, n(%)
Home (including yard) 43 (30.1) 80 (37.0) 12 (40.0) 1 (33.3) 69 (30.9) 18 (25.0) 223 (32.5)
School (including creche) 4 (2.8) 7 (3.2) 4 (13.3) 1 (33.3) 4 (1.8) 0 (0) 20 (2.9)
Shebeen, bar or night club
16 (11.2) 28 (13.0) 1 (3.3) 0 (0) 35 (15.7) 7 (9.7) 87 (12.7)
Highway, street or road 43 (30.1) 24 (11.1) 9 (30.0) 1 (33.3) 69 (30.9) 34 (47.2) 180 (26.2)
Public transport area 3 (2.1) 7 (3.2) 0 (0) 0 (0) 12 (5.4) 1 (1.4) 23 (3.4)
Open field 10 (7.0) 3 (1.4) 1 (3.3) 0 (0) 7 (3.1) 5 (6.9) 26 (3.8)
Commercial area (e.g.shopping centre)
5 (3.5) 1 (0.5) 1 (3.3) 0 (0) 2 (0.9) 0 (0) 9 (1.3)
Construction or industrial area
2 (1.4) 0 (0) 0 (0) 0 (0) 1 (0.5) 0 (0) 3 (0.4)
Sports area (e.g. soccer field)
0 (0) 1 (0.5) 0 (0) 0 (0) 1 (0.5) 0 (0) 2 (0.3)
Other 1 (0.7) 5 (2.3) 2 (6.7) 0 (0) 20 (9.0) 2 (2.8) 30 (4.4)
Unknown 16 (11.2) 60 (27.8) 0 (0) 0 (0) 3 (1.4) 5 (6.9) 84 (12.2)
Activity at time of injury, n(%)
Leisure 71 (46.7) 109 (50.5) 6 (20.0) 1 (33.3) 73 (32.7) 22 (30.6) 282 (41.1)
Working 8 (5.6) 13 (6.0) 5 (16.7) 0 (0) 36 (16.1) 9 (12.5) 71 (10.3)
Travelling 28 (19.6) 7 (3.2) 7 (23.3) 1 (33.3) 35 (15.7) 22 (30.6) 100 (14.6)
Education 2 (1.4) 5 (2.3) 3 (10.0) 1 (33.3) 3 (1.4) 0 (0) 14 (2.0)
Playing sport 3 (2.1) 8 (3.7) 4 (13.3) 0 (0) 20 (9.0) 3 (4.2) 38 (5.5)
Other 15 (10.5) 12 (5.6) 5 (16.7) 0 (0) 53 (23.8) 12 (16.7) 97 (14.1)
Unknown 16 (11.2) 62 (28.7) 0 (0) 0 (0) 3 (1.4) 4 (5.6) 85 (12.4)
Placement, n(%)
Discharged 38 (26.6) 68 (31.5) 24 (80.0) 2 (66.7) 132 (59.2) 41 (56.9) 305 (44.4)
Admitted to ward 66 (46.2) 52 (24.1) 0 (0) 0 (0) 2 (0.9) 9 (12.5) 129 (18.8)
Admitted to ICU 7 (4.9) 0 (0) 0 (0) 0 (0) 0 (0) 0 (0) 7 (1.0)
Died 1 (0.7) 0 (0) 0 (0) 0 (0) 0 (0) 0 (0) 1 (0.2)
Absconded 2 (1.4) 0 (0) 0 (0) 0 (0) 0 (0) 1 (1.4) 3 (0.4)
Referred 1 (0.7) 1 (0.5) 0 (0) 1 (33.3) 1 (0.5) 1 (1.4) 5 (0.7)
Transferred 2 (1.4) 0 (0) 6 (20.0) 0 (0) 14 (6.3) 0 (0) 22 (3.2)
Information not available at time of interview
24 (16.8) 37 (17.1) 0 (0) 0 (0) 59 (26.5) 7 (9.7) 127 (18.5)
Unknown 2 (1.4) 58 (26.9) 0 (0) 0 (0) 15 (6.7) 13 (18.1) 88 (12.8)

Injury Morbidity Surveillance in Nyanga and Khayelitsha: Phase 3 Summary Report 10
6.3 Age distribution of injuries
The majority of injuries occurred in the 15 to 44 year age group among males
(74.1%) and females (61.3%). For both genders, the 25 to 34 year age group was the
most affected (see Figure 4).
Figure 4: Age distribution of injuries by genderd
6.4 Cause of injury
Overall, 669 first-presentation injury cases were assessed. Of these, 58.9% were as
a result of violence, 26.0% were unintentional injuries, and 13.2% were transport-
related. Only 1.9% were due to self-harm (see Table 4). For ranking of specific
causes of injuries by age category, see Table 10 in Appendix B.
Table 4: Overview of main causes of injury
Cause of injury n (%)
Violence 394 (58.9)
Transport 88 (13.2)
Unintentional 174 (26.0)
Self-harm 13 (1.9)
Total 669 (100.0)e
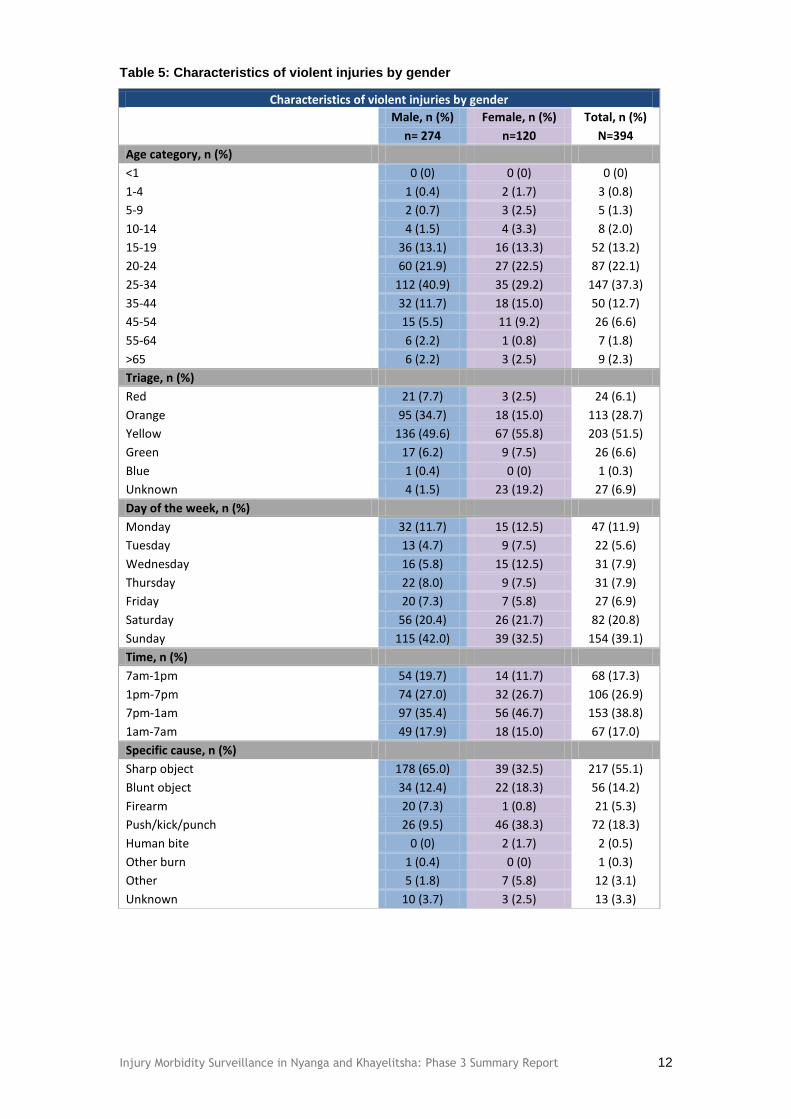
6.4.1 Violent injuries
Of the 394 violent injury cases reported, the majority (69.5%) were males. Most
violent injuries were triaged yellow (51.5%) and occurred on Sunday (39.1%) and
Saturday (20.8%). The most common specific method reported was sharp object,
55.1% overall. Among males, sharp object (65.0%) was the leading specific method
of violent injury, followed by blunt object (12.4%) and push/kick/punch (9.5%). Among
females, push/kick/punch (38.3%) was the leading specific method reported, followed
by sharp object (32.5%) and blunt object (18.3%). This is in keeping with findings in
the first and second surveys where physical assault (push/kick/punch) was the
leading specific method of violent injury among women. The most common type of
violence reported amongst males was crime-related violence (43.1%), followed by
d Excludes one case in which the age was not established. e This total number of injuries excludes 18 duplicate patients who were referred from one study facility to
another. Only the initial presentation is included.
0.5
4.9 6.9
4.4
10.4
16.7
34.0
13.0
4.9 1.6 2.8
1.3
7.2 7.6 6.8 8.9
16.5
23.2
12.7 9.7
2.5 3.8
0.0
5.0
10.0
15.0
20.0
25.0
30.0
35.0
<1 1-4 5-9 10-14 15-19 20-24 25-34 35-44 45-54 55-64 >65
%
Age category (years)
Age and gender distribution of injuries (%) (N=669) Male (n=432) Female (n=237)

Injury Morbidity Surveillance in Nyanga and Khayelitsha: Phase 3 Summary Report 11
interpersonal (21.2%) and gang-related violence (20.4%). Among females
interpersonal and crime-related violence were the leading types of violence (25.8%
and 24.2% respectively). Sexual violence accounted for 17.5% of violent injuries
among women.
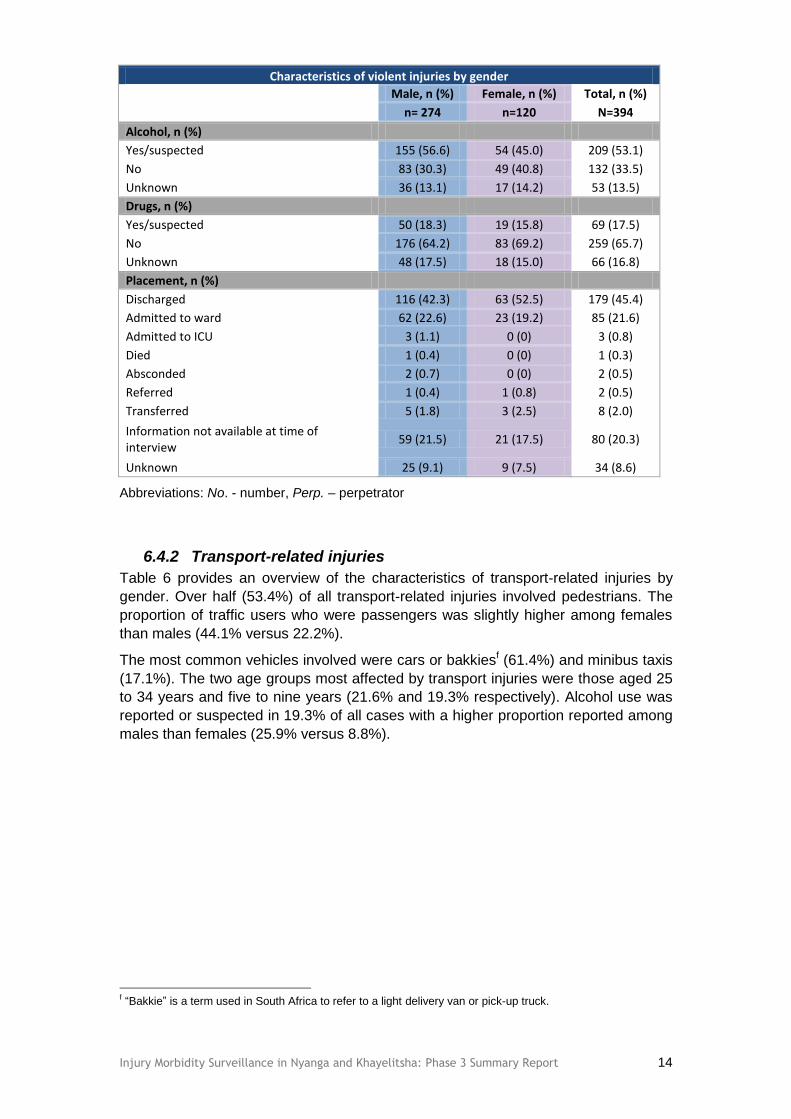
Table 5 presents an overview of the characteristics of violent injuries by gender.
Overall, most perpetrators were reported to be male (80.5%). Interestingly, the most
commonly reported type of perpetrator was a community member: 28.2% overall,
32.5% among males and 18.3% among females, which were the highest proportions
in both genders. A spouse, partner or ex-intimate partner was reported to be the
perpetrator in 13.3% of violent injuries among women. Although, overall, 33.1% of
males were injured by one perpetrator, a further 20.1% of males reported being
assaulted by four or more perpetrators. This is in keeping with findings from the two
previous surveys.4,5
Overall, the leading places where violent injuries occurred were the home (31.0%),
highway/street/road (27.7%) and shebeen/bar/nightclub (21.1%). Over half (52.5%)
of females reported having sustained violent injuries within the home. Alcohol use
was reported or suspected in 53.1% of all violent injuries. Drug use was either
reported or suspected in 17.5% of violent injuries.
Injury Morbidity Surveillance in Nyanga and Khayelitsha: Phase 3 Summary Report 12
Table 5: Characteristics of violent injuries by gender
Characteristics of violent injuries by gender
Male, n (%) Female, n (%) Total, n (%)
n= 274 n=120 N=394
Age category, n (%)
<1 0 (0) 0 (0) 0 (0)
1-4 1 (0.4) 2 (1.7) 3 (0.8)
5-9 2 (0.7) 3 (2.5) 5 (1.3)
10-14 4 (1.5) 4 (3.3) 8 (2.0)
15-19 36 (13.1) 16 (13.3) 52 (13.2)
20-24 60 (21.9) 27 (22.5) 87 (22.1)
25-34 112 (40.9) 35 (29.2) 147 (37.3)
35-44 32 (11.7) 18 (15.0) 50 (12.7)
45-54 15 (5.5) 11 (9.2) 26 (6.6)
55-64 6 (2.2) 1 (0.8) 7 (1.8)
>65 6 (2.2) 3 (2.5) 9 (2.3)
Triage, n (%)
Red 21 (7.7) 3 (2.5) 24 (6.1)
Orange 95 (34.7) 18 (15.0) 113 (28.7)
Yellow 136 (49.6) 67 (55.8) 203 (51.5)
Green 17 (6.2) 9 (7.5) 26 (6.6)
Blue 1 (0.4) 0 (0) 1 (0.3)
Unknown 4 (1.5) 23 (19.2) 27 (6.9)
Day of the week, n (%)
Monday 32 (11.7) 15 (12.5) 47 (11.9)
Tuesday 13 (4.7) 9 (7.5) 22 (5.6)
Wednesday 16 (5.8) 15 (12.5) 31 (7.9)
Thursday 22 (8.0) 9 (7.5) 31 (7.9)
Friday 20 (7.3) 7 (5.8) 27 (6.9)
Saturday 56 (20.4) 26 (21.7) 82 (20.8)
Sunday 115 (42.0) 39 (32.5) 154 (39.1)
Time, n (%)
7am-1pm 54 (19.7) 14 (11.7) 68 (17.3)
1pm-7pm 74 (27.0) 32 (26.7) 106 (26.9)
7pm-1am 97 (35.4) 56 (46.7) 153 (38.8)
1am-7am 49 (17.9) 18 (15.0) 67 (17.0)
Specific cause, n (%)
Sharp object 178 (65.0) 39 (32.5) 217 (55.1)
Blunt object 34 (12.4) 22 (18.3) 56 (14.2)
Firearm 20 (7.3) 1 (0.8) 21 (5.3)
Push/kick/punch 26 (9.5) 46 (38.3) 72 (18.3)
Human bite 0 (0) 2 (1.7) 2 (0.5)
Other burn 1 (0.4) 0 (0) 1 (0.3)
Other 5 (1.8) 7 (5.8) 12 (3.1)
Unknown 10 (3.7) 3 (2.5) 13 (3.3)

Injury Morbidity Surveillance in Nyanga and Khayelitsha: Phase 3 Summary Report 13
Characteristics of violent injuries by gender
Male, n (%) Female, n (%) Total, n (%)
n= 274 n=120 N=394
Type of violence, n (%)
Rape/sexual 4 (1.5) 21 (17.5) 25 (6.4)
Child abuse 1 (0.4) 1 (0.8) 2 (0.5)
Gang-related 56 (20.4) 6 (5.0) 62 (15.7)
Crime-related 118 (43.1) 29 (24.2) 147 (37.3)
Interpersonal 58 (21.2) 31 (25.8) 89 (22.6)
Other 15 (5.5) 24 (20.0) 39 (9.9)
Unknown 22 (8.0) 8 (6.7) 30 (7.6)
Perp. Victim Relationship, n (%)
Spouse/partner 6 (2.2) 16 (13.3) 22 (5.6)
Ex-intimate partner 4 (1.5) 16 (13.3) 20 (5.1)
Parent 4 (1.5) 6 (5.0) 10 (2.5)
Other relative 17 (6.2) 13 (10.8) 30 (7.6)
Unrelated caregiver 1 (0.4) 1 (0.8) 2 (0.5)
Friend 20 (7.3) 4 (3.3) 24 (6.1)
Neighbour 19 (6.9) 8 (6.7) 27 (6.9)
Community member 89 (32.5) 22 (18.3) 111 (28.2)
Acquaintance 14 (5.1) 6 (5.0) 20 (5.1)
Other 32 (11.7) 6 (5.0) 38 (9.6)
Unknown 68 (24.8) 22 (18.3) 90 (22.8)
Gender of Perp., n (%)
Male 233 (85.0) 84 (70.0) 317 (80.5)
Female 8 (2.9) 26 (21.7) 34 (8.6)
Unknown 33 (12.0) 10 (8.3) 43 (10.9)
No. of Perp., n (%)
1 91 (33.2) 85 (70.8) 176 (44.7) 2 49 (17.9) 14 (11.7) 63 (16.0) 3 41 (15.0) 7 (5.8) 48 (12.2) 4 or more 55 (20.1) 3 (2.5) 58 (14.7)
Unknown 38 (13.9) 11 (9.2) 49 (12.4)
Activity at time of injury, n (%)
Leisure 132 (48.2) 89 (74.2) 221 (56.1)
Working 33 (12.0) 1 (0.8) 34 (8.6)
Travelling 35 (12.8) 12 (10.0) 47 (11.9)
Education 0 (0) 1 (0.8) 1 (0.3)
Playing sport 1 (0.4) 0 (0) 1 (0.3)
Other 45 (16.4) 7 (5.8) 52 (13.2)
Unknown 28 (10.2) 10 (8.3) 38 (9.6)
Place or scene of injury, n (%)
Home 59 (21.5) 63 (52.5) 122 (31.0)
School 1 (0.4) 2 (1.7) 3 (0.8)
Shebeen, bar or night club 64 (23.4) 19 (15.8) 83 (21.1)
Highway, street or road 88 (32.1) 21 (17.5) 109 (27.7)
Public transport area 6 (2.2) 0 (0) 6 (1.5)
Open field 11 (4.0) 3 (2.5) 14 (3.6)
Commercial area 5 (1.8) 1 (0.8) 6 (1.5)
Construction or industrial area 1 (0.4) 0 (0) 1 (0.3)
Other 11 (4.0) 1 (0.8) 12 (3.1)
Unknown 28 (10.2) 10 (8.3) 38 (9.6)
Injury Morbidity Surveillance in Nyanga and Khayelitsha: Phase 3 Summary Report 14
Characteristics of violent injuries by gender
Male, n (%) Female, n (%) Total, n (%)
n= 274 n=120 N=394
Alcohol, n (%)
Yes/suspected 155 (56.6) 54 (45.0) 209 (53.1)
No 83 (30.3) 49 (40.8) 132 (33.5)
Unknown 36 (13.1) 17 (14.2) 53 (13.5)
Drugs, n (%)
Yes/suspected 50 (18.3) 19 (15.8) 69 (17.5)
No 176 (64.2) 83 (69.2) 259 (65.7)
Unknown 48 (17.5) 18 (15.0) 66 (16.8)
Placement, n (%)
Discharged 116 (42.3) 63 (52.5) 179 (45.4)
Admitted to ward 62 (22.6) 23 (19.2) 85 (21.6)
Admitted to ICU 3 (1.1) 0 (0) 3 (0.8)
Died 1 (0.4) 0 (0) 1 (0.3)
Absconded 2 (0.7) 0 (0) 2 (0.5)
Referred 1 (0.4) 1 (0.8) 2 (0.5)
Transferred 5 (1.8) 3 (2.5) 8 (2.0)
Information not available at time of interview
59 (21.5) 21 (17.5) 80 (20.3)
Unknown 25 (9.1) 9 (7.5) 34 (8.6)
Abbreviations: No. - number, Perp. – perpetrator
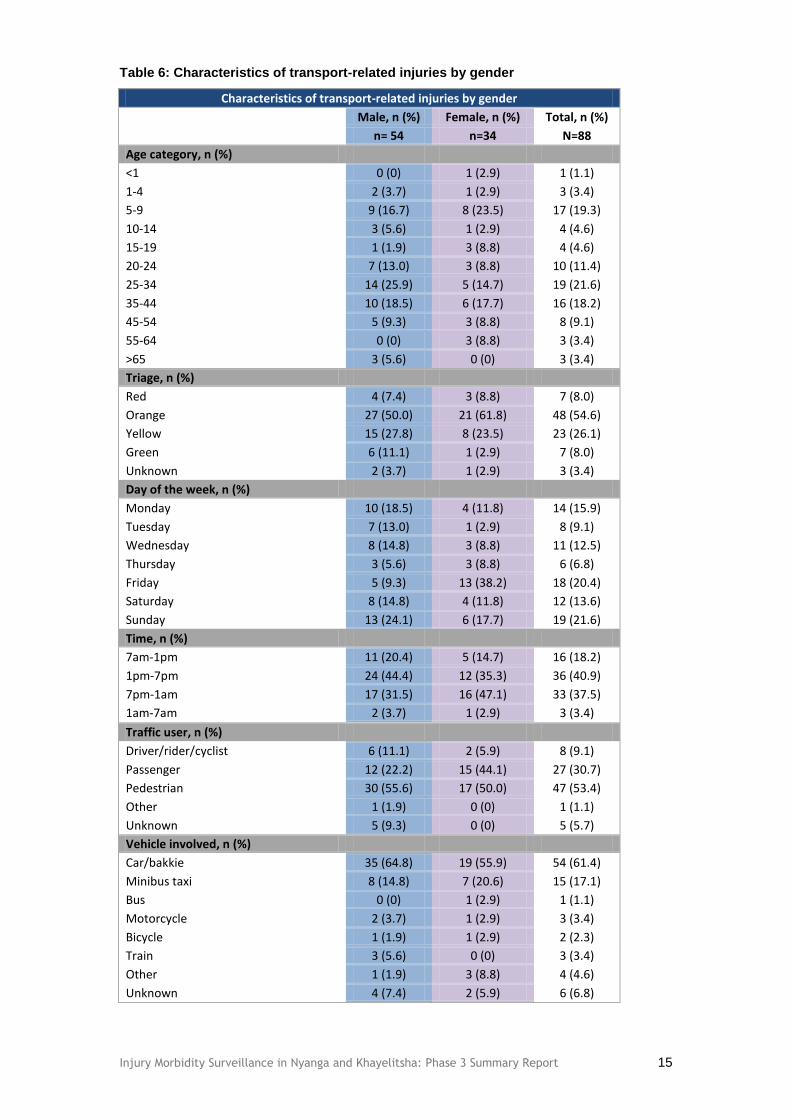
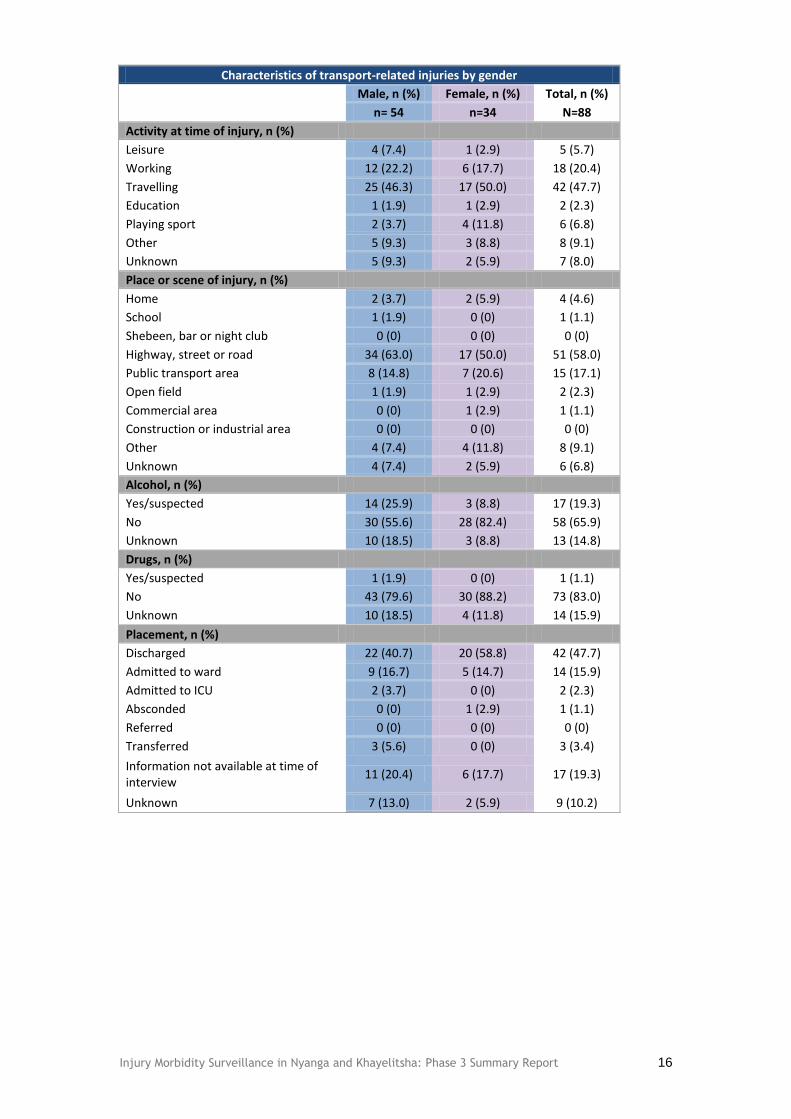
6.4.2 Transport-related injuries
Table 6 provides an overview of the characteristics of transport-related injuries by
gender. Over half (53.4%) of all transport-related injuries involved pedestrians. The
proportion of traffic users who were passengers was slightly higher among females
than males (44.1% versus 22.2%).
The most common vehicles involved were cars or bakkiesf (61.4%) and minibus taxis
(17.1%). The two age groups most affected by transport injuries were those aged 25
to 34 years and five to nine years (21.6% and 19.3% respectively). Alcohol use was
reported or suspected in 19.3% of all cases with a higher proportion reported among
males than females (25.9% versus 8.8%).
f “Bakkie” is a term used in South Africa to refer to a light delivery van or pick-up truck.
Injury Morbidity Surveillance in Nyanga and Khayelitsha: Phase 3 Summary Report 15
Table 6: Characteristics of transport-related injuries by gender
Characteristics of transport-related injuries by gender
Male, n (%) Female, n (%) Total, n (%)
n= 54 n=34 N=88
Age category, n (%)
<1 0 (0) 1 (2.9) 1 (1.1)
1-4 2 (3.7) 1 (2.9) 3 (3.4)
5-9 9 (16.7) 8 (23.5) 17 (19.3)
10-14 3 (5.6) 1 (2.9) 4 (4.6)
15-19 1 (1.9) 3 (8.8) 4 (4.6)
20-24 7 (13.0) 3 (8.8) 10 (11.4)
25-34 14 (25.9) 5 (14.7) 19 (21.6)
35-44 10 (18.5) 6 (17.7) 16 (18.2)
45-54 5 (9.3) 3 (8.8) 8 (9.1)
55-64 0 (0) 3 (8.8) 3 (3.4)
>65 3 (5.6) 0 (0) 3 (3.4)
Triage, n (%)
Red 4 (7.4) 3 (8.8) 7 (8.0)
Orange 27 (50.0) 21 (61.8) 48 (54.6)
Yellow 15 (27.8) 8 (23.5) 23 (26.1)
Green 6 (11.1) 1 (2.9) 7 (8.0)
Unknown 2 (3.7) 1 (2.9) 3 (3.4)
Day of the week, n (%)
Monday 10 (18.5) 4 (11.8) 14 (15.9)
Tuesday 7 (13.0) 1 (2.9) 8 (9.1)
Wednesday 8 (14.8) 3 (8.8) 11 (12.5)
Thursday 3 (5.6) 3 (8.8) 6 (6.8)
Friday 5 (9.3) 13 (38.2) 18 (20.4)
Saturday 8 (14.8) 4 (11.8) 12 (13.6)
Sunday 13 (24.1) 6 (17.7) 19 (21.6)
Time, n (%)
7am-1pm 11 (20.4) 5 (14.7) 16 (18.2)
1pm-7pm 24 (44.4) 12 (35.3) 36 (40.9)
7pm-1am 17 (31.5) 16 (47.1) 33 (37.5)
1am-7am 2 (3.7) 1 (2.9) 3 (3.4)
Traffic user, n (%)
Driver/rider/cyclist 6 (11.1) 2 (5.9) 8 (9.1)
Passenger 12 (22.2) 15 (44.1) 27 (30.7)
Pedestrian 30 (55.6) 17 (50.0) 47 (53.4)
Other 1 (1.9) 0 (0) 1 (1.1)
Unknown 5 (9.3) 0 (0) 5 (5.7)
Vehicle involved, n (%)
Car/bakkie 35 (64.8) 19 (55.9) 54 (61.4)
Minibus taxi 8 (14.8) 7 (20.6) 15 (17.1)
Bus 0 (0) 1 (2.9) 1 (1.1)
Motorcycle 2 (3.7) 1 (2.9) 3 (3.4)
Bicycle 1 (1.9) 1 (2.9) 2 (2.3)
Train 3 (5.6) 0 (0) 3 (3.4)
Other 1 (1.9) 3 (8.8) 4 (4.6)
Unknown 4 (7.4) 2 (5.9) 6 (6.8)
Injury Morbidity Surveillance in Nyanga and Khayelitsha: Phase 3 Summary Report 16
Characteristics of transport-related injuries by gender
Male, n (%) Female, n (%) Total, n (%)
n= 54 n=34 N=88
Activity at time of injury, n (%)
Leisure 4 (7.4) 1 (2.9) 5 (5.7)
Working 12 (22.2) 6 (17.7) 18 (20.4)
Travelling 25 (46.3) 17 (50.0) 42 (47.7)
Education 1 (1.9) 1 (2.9) 2 (2.3)
Playing sport 2 (3.7) 4 (11.8) 6 (6.8)
Other 5 (9.3) 3 (8.8) 8 (9.1)
Unknown 5 (9.3) 2 (5.9) 7 (8.0)
Place or scene of injury, n (%)
Home 2 (3.7) 2 (5.9) 4 (4.6)
School 1 (1.9) 0 (0) 1 (1.1)
Shebeen, bar or night club 0 (0) 0 (0) 0 (0)
Highway, street or road 34 (63.0) 17 (50.0) 51 (58.0)
Public transport area 8 (14.8) 7 (20.6) 15 (17.1)
Open field 1 (1.9) 1 (2.9) 2 (2.3)
Commercial area 0 (0) 1 (2.9) 1 (1.1)
Construction or industrial area 0 (0) 0 (0) 0 (0)
Other 4 (7.4) 4 (11.8) 8 (9.1)
Unknown 4 (7.4) 2 (5.9) 6 (6.8)
Alcohol, n (%)
Yes/suspected 14 (25.9) 3 (8.8) 17 (19.3)
No 30 (55.6) 28 (82.4) 58 (65.9)
Unknown 10 (18.5) 3 (8.8) 13 (14.8)
Drugs, n (%)
Yes/suspected 1 (1.9) 0 (0) 1 (1.1)
No 43 (79.6) 30 (88.2) 73 (83.0)
Unknown 10 (18.5) 4 (11.8) 14 (15.9)
Placement, n (%)
Discharged 22 (40.7) 20 (58.8) 42 (47.7)
Admitted to ward 9 (16.7) 5 (14.7) 14 (15.9)
Admitted to ICU 2 (3.7) 0 (0) 2 (2.3)
Absconded 0 (0) 1 (2.9) 1 (1.1)
Referred 0 (0) 0 (0) 0 (0)
Transferred 3 (5.6) 0 (0) 3 (3.4)
Information not available at time of interview
11 (20.4) 6 (17.7) 17 (19.3)
Unknown 7 (13.0) 2 (5.9) 9 (10.2)
Injury Morbidity Surveillance in Nyanga and Khayelitsha: Phase 3 Summary Report 17
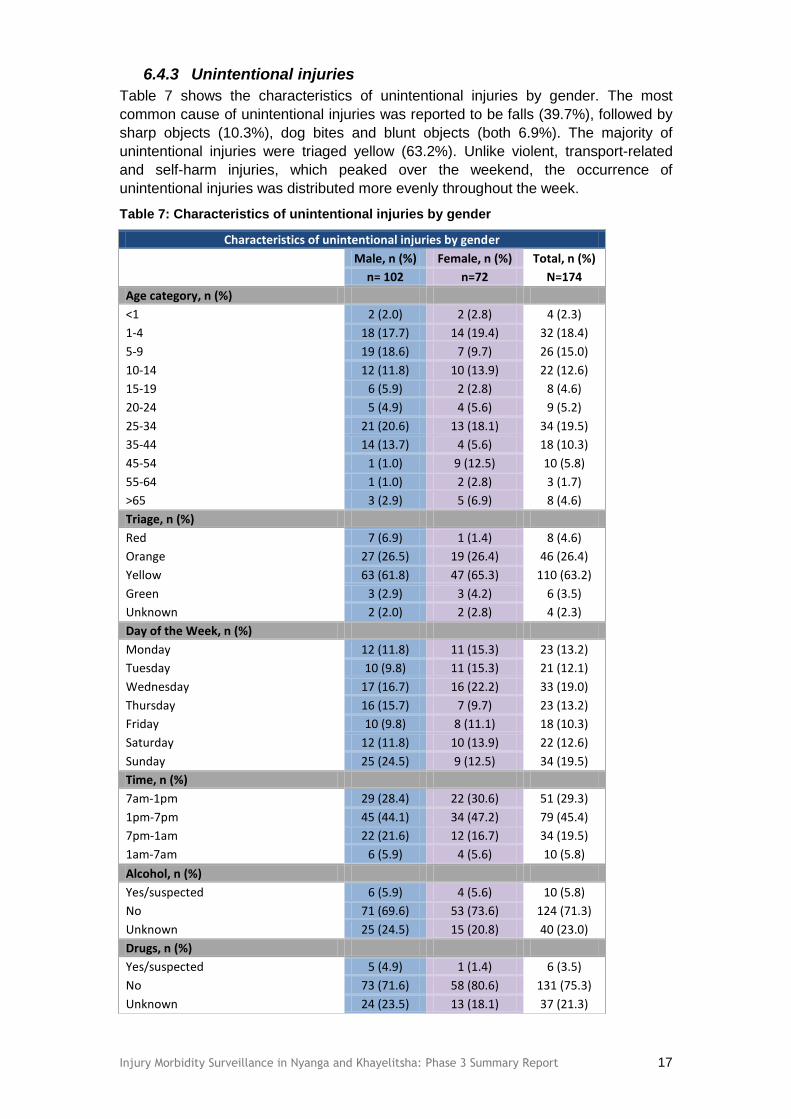
6.4.3 Unintentional injuries
Table 7 shows the characteristics of unintentional injuries by gender. The most
common cause of unintentional injuries was reported to be falls (39.7%), followed by
sharp objects (10.3%), dog bites and blunt objects (both 6.9%). The majority of
unintentional injuries were triaged yellow (63.2%). Unlike violent, transport-related
and self-harm injuries, which peaked over the weekend, the occurrence of
unintentional injuries was distributed more evenly throughout the week.
Table 7: Characteristics of unintentional injuries by gender
Characteristics of unintentional injuries by gender
Male, n (%) Female, n (%) Total, n (%)
n= 102 n=72 N=174
Age category, n (%)
<1 2 (2.0) 2 (2.8) 4 (2.3)
1-4 18 (17.7) 14 (19.4) 32 (18.4)
5-9 19 (18.6) 7 (9.7) 26 (15.0)
10-14 12 (11.8) 10 (13.9) 22 (12.6)
15-19 6 (5.9) 2 (2.8) 8 (4.6)
20-24 5 (4.9) 4 (5.6) 9 (5.2)
25-34 21 (20.6) 13 (18.1) 34 (19.5)
35-44 14 (13.7) 4 (5.6) 18 (10.3)
45-54 1 (1.0) 9 (12.5) 10 (5.8)
55-64 1 (1.0) 2 (2.8) 3 (1.7)
>65 3 (2.9) 5 (6.9) 8 (4.6)
Triage, n (%)
Red 7 (6.9) 1 (1.4) 8 (4.6)
Orange 27 (26.5) 19 (26.4) 46 (26.4)
Yellow 63 (61.8) 47 (65.3) 110 (63.2)
Green 3 (2.9) 3 (4.2) 6 (3.5)
Unknown 2 (2.0) 2 (2.8) 4 (2.3)
Day of the Week, n (%)
Monday 12 (11.8) 11 (15.3) 23 (13.2)
Tuesday 10 (9.8) 11 (15.3) 21 (12.1)
Wednesday 17 (16.7) 16 (22.2) 33 (19.0)
Thursday 16 (15.7) 7 (9.7) 23 (13.2)
Friday 10 (9.8) 8 (11.1) 18 (10.3)
Saturday 12 (11.8) 10 (13.9) 22 (12.6)
Sunday 25 (24.5) 9 (12.5) 34 (19.5)
Time, n (%)
7am-1pm 29 (28.4) 22 (30.6) 51 (29.3)
1pm-7pm 45 (44.1) 34 (47.2) 79 (45.4)
7pm-1am 22 (21.6) 12 (16.7) 34 (19.5)
1am-7am 6 (5.9) 4 (5.6) 10 (5.8)
Alcohol, n (%)
Yes/suspected 6 (5.9) 4 (5.6) 10 (5.8)
No 71 (69.6) 53 (73.6) 124 (71.3)
Unknown 25 (24.5) 15 (20.8) 40 (23.0)
Drugs, n (%)
Yes/suspected 5 (4.9) 1 (1.4) 6 (3.5)
No 73 (71.6) 58 (80.6) 131 (75.3)
Unknown 24 (23.5) 13 (18.1) 37 (21.3)

Injury Morbidity Surveillance in Nyanga and Khayelitsha: Phase 3 Summary Report 18
Characteristics of unintentional injuries by gender
Male, n (%) Female, n (%) Total, n (%)
n= 102 n=72 N=174
Specific Cause/Method, n (%)
Sharp object 12 (11.8) 6 (8.3) 18 (10.3)
Blunt object 10 (9.8) 2 (2.8) 12 (6.9)
Hot liquid burn 4 (3.9) 5 (6.9) 9 (5.2)
Electrical burn 1 (1.0) 0 (0) 1 (0.6)
Fire burn 6 (5.9) 1 (1.4) 7 (4.0)
Fall on level 31 (30.4) 28 (38.9) 59 (33.9)
Fall on stairs 0 (0) 5 (6.9) 5 (2.9)
Fall from height 1 (1.0) 4 (5.6) 5 (2.9)
Jump 4 (3.9) 2 (2.8) 6 (3.5)
Caught between/struck against 4 (3.9) 1 (1.4) 5 (2.9)
Paraffin poisoning 1 (1.0) 1 (1.4) 2 (1.2)
Other poisoning 4 (3.9) 0 (0) 4 (2.3)
Dog bite 6 (5.9) 6 (8.3) 12 (6.9)
Other bite/sting 5 (4.9) 3 (4.2) 8 (4.6)
Other 5 (4.9) 2 (2.8) 7 (4.0)
Unknown 8 (7.8) 6 (8.3) 14 (8.1)
Activity at time of injury, n (%)
Leisure 22 (21.6) 20 (27.8) 42 (24.1)
Working 10 (9.8) 8 (11.1) 18 (10.3)
Travelling 3 (2.9) 5 (6.9) 8 (4.6)
Education 5 (4.9) 5 (6.9) 10 (5.8)
Playing sport 20 (19.6) 9 (12.5) 29 (16.7)
Other 20 (19.6) 13 (18.1) 33 (19.0)
Unknown 22 (21.6) 12 (16.7) 34 (19.5)
Place or scene of injury, n (%)
Home 45 (44.1) 40 (55.6) 85 (48.9)
School 9 (8.8) 5 (6.9) 14 (8.1)
Shebeen, bar or night club 1 (1.0) 1 (1.4) 2 (1.2)
Highway, street or road 6 (5.9) 8 (11.1) 14 (8.1)
Public transport area 1 (1.0) 0 (0) 1 (0.6)
Open field 7 (6.9) 0 (0) 7 (4.0)
Commercial area 1 (1.0) 1 (1.4) 2 (1.2)
Construction or industrial area 2 (2.0) 0 (0) 2 (1.2)
Sports area 0 (0) 2 (2.8) 2 (1.2)
Other 8 (7.8) 2 (2.8) 10 (5.8)
Unknown 22 (21.6) 13 (18.1) 35 (20.1)
Placement, n (%)
Discharged 41 (40.2) 38 (52.8) 79 (45.4)
Admitted to ward 14 (13.7) 6 (8.3) 20 (11.5)
Admitted to ICU 0 (0) 1 (1.4) 1 (0.6)
Referred 0 (0) 2 (2.8) 2 (1.2)
Transferred 6 (5.9) 3 (4.2) 9 (5.2)
Information not available at time of interview
16 (15.7) 8 (11.1) 24 (13.8)
Unknown 25 (24.5) 14 (19.4) 39 (22.4)

Injury Morbidity Surveillance in Nyanga and Khayelitsha: Phase 3 Summary Report 19
6.4.4 Self-harm injuries
Table 8 shows the characteristics of self-harm injuries by gender. The majority were
due to other poisoning (92.3%), which is poisoning due to any substance other than
paraffin, and were primarily cases reported as “overdose” in the registers. Although
there were only 13 cases of self-harm reported, eight cases (61.5%) of these were
triaged orange and a further three cases (23.1%) were triaged red, thus requiring
very urgent and emergency management respectively, as suggested by the South
African Triage Scale.6
Table 8: Characteristics of self-harm injuries by gender
Characteristics of self-harm injuries by gender
Male, n (%) Female, n (%) Total, n (%)
n= 2 n=11 N=13
Age category, n (%)
<1 0 (0) 0 (0) 0 (0)
1-4 0 (0) 0 (0) 0 (0)
5-9 0 (0) 0 (0) 0 (0)
10-14 0 (0) 1 (9.1) 1 (7.7)
15-19 2 (100.0) 0 (0) 2 (15.4)
20-24 0 (0) 5 (45.5) 5 (38.5)
25-34 0 (0) 2 (18.2) 2 (15.4)
35-44 0 (0) 2 (18.2) 2 (15.4)
45-54 0 (0) 0 (0) 0 (0)
55-64 0 (0) 0 (0) 0 (0)
>65 0 (0) 1 (9.1) 1 (7.7)
Triage, n (%)
Red 0 (0) 3 (27.3) 3 (23.1)
Orange 2 (100.0) 6 (54.6) 8 (61.5)
Yellow 0 (0) 2 (18.2) 2 (15.4)
Green 0 (0) 0 (0) 0 (0)
Unknown 0 (0) 0 (0) 0 (0)
Day of the week, n (%)
Monday 0 (0) 0 (0) 0 (0)
Tuesday 1 (50.0) 1 (9.1) 2 (15.4)
Wednesday 0 (0) 3 (27.3) 3 (23.1)
Thursday 1 (50.0) 4 (36.4) 5 (38.5)
Friday 0 (0) 1 (9.1) 1 (7.7)
Saturday 0 (0) 1 (9.1) 1 (7.7)
Sunday 0 (0) 1 (9.1) 1 (7.7)
Time, n (%)
7am-1pm 1 (50.0) 0 (0) 1 (7.7)
1pm-7pm 0 (0) 7 (63.6) 7 (53.9)
7pm-1am 0 (0) 3 (27.3) 3 (23.1)
1am-7am 1 (50.0) 1 (9.1) 2 (15.4)
Specific cause/method, n (%)
Paraffin poisoning 0 (0) 1 (9.1) 1 (7.7)
Other poisoning 2 (100.0) 10 (90.9) 12 (92.3)
Activity at time of injury, n (%)
Leisure 0 (0) 9 (81.8) 9 (69.2)
Other 1 (50.0) 1 (9.1) 2 (15.4)
Unknown 1 (50.0) 1 (9.1) 2 (15.4)

Injury Morbidity Surveillance in Nyanga and Khayelitsha: Phase 3 Summary Report 20
Characteristics of self-harm injuries by gender
Male, n (%) Female, n (%) Total, n (%)
n= 2 n=11 N=13
Place or scene of injury, n (%)
Home 1 (50.0) 10 (90.9) 11 (84.6)
Unknown 1 (50.0) 1 (9.1) 2 (15.4)
Alcohol, n (%)
Yes/suspected 0 (0) 0 (0) 0 (0)
No 1 (50.0) 8 (72.7) 9 (69.2)
Unknown 1 (50.0) 3 (27.3) 4 (30.8)
Drugs, n (%)
Yes/suspected 0 (0) 2 (18.2) 2 (15.4)
No 1 (50.0) 6 (54.6) 7 (53.9)
Unknown 1 (50.0) 3 (27.3) 4 (30.8)
Placement, n (%)
Discharged 1 (50.0) 1 (9.1) 2 (15.4)
Admitted to ward 0 (0) 5 (45.5) 5 (38.5)
Admitted to ICU 0 (0) 1 (9.1) 1 (7.7)
Transferred 0 (0) 1 (9.1) 1 (7.7)
Information not available at time of interview
0 (0) 1 (9.1) 1 (7.7)
Unknown 1 (50.0) 2 (18.2) 3 (23.1)

Injury Morbidity Surveillance in Nyanga and Khayelitsha: Phase 3 Summary Report 21
Alcohol and drug use and injuries 7.
Overall, 35.2% of all injuries involved obvious or suspected alcohol use (see Table
3). With regard to violent injuries among males and females, 56.6% and 45.0% were
associated with alcohol use respectively (see Figure 5 and Figure 6). With regard to
drug use, 17.5% of injury cases overall reported or were suspected to have used
drugs. No information on the specific type of drug was collected.
Figure 5: Probable alcohol use and cause of injury among males
Figure 6: Probable alcohol use and cause of injury among females
56.6
25.9
5.9 0.0
30.3
55.6
69.6
50.0
13.1 18.5 24.5
50.0
0%
20%
40%
60%
80%
100%
Violence Transport Unintentional Self-harmCause of injury
Probable alcohol use and cause of injury in males (%) (N=432) Yes/suspected No Unknown
45.0
8.8 5.6 0.0
40.8
82.4 73.6
72.7
14.2 8.8 20.8 27.3
0%
20%
40%
60%
80%
100%
Violence Transport Unintentional Self-harmCause of injury
Probable alcohol use and cause of injury in females (%) (N=237) Yes/suspected No Unknown

Injury Morbidity Surveillance in Nyanga and Khayelitsha: Phase 3 Summary Report 22
Location of injuries 8.
The majority of injuries in Khayelitsha were reported to have occurred in Site B
(30.8%), Site C and Harare (both 12.3%). In Nyanga, KTC had the highest proportion
of injuries (19.2%) followed by New Crossroads and Mau Mau (both 13.5%). In
Gugulethu, Section 3 (22.1%) had the highest proportion of injuries, followed by
Section 2 (16.4%). Injuries reported to have occurred in “Other areas” accounted for
8.5% (57 cases) of all injuries. Of these the most commonly reported “Other areas”
were Manenberg and Heideveld, with 19 and 18 out of 57 cases reported to have
occurred here respectively (see Table 9).
Table 9: Location of injury by area and sub-area
Location of injury by area and subarea
Area/subarea n (%)
Khayelitsha n=319
Enkanini 13 (4.1)
Harare 39 (12.3)
Ilitha Park 15 (4.7)
Khaya 6 (1.9)
Kuyasa 8 (2.6)
Makaya 20 (6.3)
Makhaza 31 (9.8)
Site B 98 (30.8)
Site C 39 (12.3)
Town 2 15 (4.7)
Unknown subarea Khayelitsha 8 (2.6)
Other subarea Khayelitsha 27 (8.5)
Nyanga n=52
New Crossroads 7 (13.5)
Old Locations 3 (5.8)
Mau Mau 7 (13.5)
Freedom Square 1 (1.9)
Zwelitsha 4 (7.7)
Emaholweni (Terminus Rd) 6 (11.5)
Emaholweni (Lusaka) 1 (1.9)
KTC 10 (19.2)
Lusaka 3 (5.8)
Other subarea Nyanga 9 (17.3)
Unknown subarea Nyanga 1 (1.9)
Gugulethu n=122
Station Park 2 (1.6)
Phola Park 1 (0.8)
Kwakhi-khi 8 (6.6)
Section 1 20 (16.4)
Section 2 28 (23)
Thambo Village 1 (0.8)
Section 3 27 (22.1)
Section 4 10 (8.2)
Malunga Park 1 (0.8)
Other subarea Gugulethu 19 (15.6)
Unknown subarea Gugulethu 5 (4.1)

Injury Morbidity Surveillance in Nyanga and Khayelitsha: Phase 3 Summary Report 23
Location of injury by area and subarea
Area/subarea n (%)
Phillipi n=40
Sweet Home Farm 3 (7.5)
Unknown subarea Phillipi 14 (35)
Other subarea Phillipi 23 (57.5)
Crossroads n=16
Known subarea Crossroads 14 (87.5)
Unknown subarea Crossroads 1 (6.3)
Other subarea Crossroads 1 (6.3)
Other n=57
Unknown n=63
Total n=669

Injury Morbidity Surveillance in Nyanga and Khayelitsha: Phase 3 Summary Report 24
Summary 9.
The overall proportion of injury cases is slightly higher compared to the previous RA
conducted in February/March 20144 but lower than the first two RAs2,5, both of which
were conducted in September/October. However, this may be indicative of seasonal
variation. Violence continues to be the predominant cause of injuries in both these
communities, particularly among young males. As noted in the RAs conducted in
2012 and 2013, patterns of injury, and particularly violent injury, differ slightly by age
and gender.2,5 Sharp force remains the leading cause of violent injury overall,
particularly among males. However, physical blunt assault (push/kick/punch) is still
the predominant cause of violent injury among women, with spouses and partners
being the main perpetrators. As with the previous RAs, a notably high proportion of
violence continues to be inflicted by community members, as well as by multiple
perpetrators. The sub-areas within the two communities reporting the highest number
of injuries remain unchanged from the 2013 RA.5
Injury Morbidity Surveillance in Nyanga and Khayelitsha: Phase 3 Summary Report 25
References 10.
1. WHO. Global consultation on violence and health. Violence: a public health
priority (WHO/EHA/SPI.POA.2). Geneva: World Health Organization; 1996.
2. Mureithi L, Van Schaik N, Matzopoulos R, Misra M, Naledi T, English R. Report
on the Rapid Assessment of the Injury Morbidity Burden at Health Services in
Three High Violence Communities in the Western Cape. Durban: Health
Systems Trust; 2013 February.
3. Prinsloo M, Neethling I. A profile of fatal injuries in South Africa – 7th Annual
Report of the National Injury Mortality Surveillance System 2005. South African
Medical Research Council/ UNISA, Crime VaILP; 2007.
4. Mureithi L, Van Schaik N, Matzopoulos R, Naledi T, English R. Injury Morbidity
Surveillance in Nyanga and Khayelitsha in the Western Cape: Phase 2 Summary
Report February/March 2014. Durban: Health Systems Trust; 2014 May.
5. Mureithi L, Van Schaik N, Yama K, Matzopoulos R, Naledi T, English R. Injury
Morbidity Surveillance in Nyanga and Khayelitsha in the Western Cape: Phase 1
Summary Report September/October 2013. Durban: Health Systems Trust; 2013
December.
6. South African Triage Group. South African Triage Scale (SATS) Training Manual
2012. Cape Town: Western Cape Department of Health; 2012.

Injury Morbidity Surveillance in Nyanga and Khayelitsha: Phase 2 Summary Report 26
Appendix A: Data collection form
a
Is this an interview? Yes No
Is this a folder review? Yes No
Reason for visit to emergency centre: Capture reason for seeking treatment at health facility
FIRST PRESENTATION TO A FACILITY FOR THIS INJURY?
Yes
No Was patient referred? Yes No If yes capture referral facility:____________
Is this a follow-up for a previous injury?
Yes No
TRIAGE CODE 1 Red 2 Orange 3 Yellow 4 Green 5 Blue 99 Unknown
Date of injury d d m m y y y y Time of injury h h m m If exact time not known choose
approximate time
7am-1pm 1pm-7pm
7pm-1am 1am-7am
Date of treatment
d d m m y y y y Triage time h h m m If exact time not known choose
approximate time
7am-1pm 1pm-7pm
7pm-1am 1am-7am
Please complete the section appropriate for the cause of injury
(1) VIOLENCE (person-on-person intentional)
Specific cause Type of violence Perpetrator-victim relationship
1 Sharp object (e.g.
cut/stabbed) 7 Choking/strangulation 1 Rape/sexual 1 Spouse/partner 7 Neighbour
2 Blunt object 8 Fire burn 2 Child abuse 2 Ex-intimate partner 8 Community member
3 Firearm 9 Other burn 3 Gang-related 3 Parent 9 Acquaintance
4 Push/kick/ punch
10 Poisoning 4 Crime-related (e.g.robbery,
mugging) 4 Other relative 10 Police
5 Human bite 89 Other 5 Interpersonal (other than those
above) 5 Unrelated caregiver 89 Other
6 Explosion 99 Unknown 89 Other Specify:__________ 6 Friend 99 Unknown
d d m m y y y y
IF DOB UNKNOWN CAPTURE AGE→
AREA WHERE INJURY
OCCURRED
WAS ALCOHOL USED BY THE PATIENT PRIOR TO INJURY?
Yes/suspected No Unknown
WERE DRUGS USED BY THE PATIENT PRIOR TO INJURY?
Yes/suspected No Unknown
CAUSE OF INJURY Violence Transport Unintentional/other accident Self-harm
1 2 3 4
IF YES CAPTURE DATE OF INTERVIEW OR FOLDER REVIEW →
FACILITY CODE HOSP. FOLDER NO.
GENDER M F RACE A B C W
DATE OF BIRTH d d m m y y y y AGE
STUDY NO.

Injury Morbidity Surveillance in Nyanga and Khayelitsha: Phase 3 Summary Report 27
(2) TRANSPORT
(3) UNINTENTIONAL/ OTHER ACCIDENT OR (4) SELF-HARM
Specific cause
Specific cause/ method
Traffic user
If cause of injury is unintentional or other accident or self-harm choose specific cause or method below
1 Driver/ rider/ cyclist
1 Sharp object 12 Caught between/ struck against
2 Passenger
89 Other
2 Blunt object 13 Near drowning
3 Pedestrian
99 Unknown
3 Firearm 14 Hanging
Vehicle involved
4 Hot liquid burn 15 Paraffin poisoning
1 Car/bakkie 6 Bicycle
5 Chemical burn 16 Other poisoning
2 Minibus taxi 7 Train
6 Electrical burn 17 Inhaled gas
3 Bus 8 Aircraft
7 Fire burn 18 Dog bite
4 Truck 89 Other
8 Fall on level 19 Other bite/sting
5 Motorcycle 99 Unknown
9 Fall on stairs 20 Machinery
10 Fall from height 89 Other
11 Jump 99 Unknown
Where does patient normally reside/live? Choose from list
Khayelitsha Nyanga Gugulethu Phillipi Crossroads Other:_____________ Unknown
Main area:_________________________________________
Sub-area:___________________________________________
Where did the injury occur? Choose from list
Khayelitsha Nyanga Gugulethu Phillipi Crossroads Other:_____________ Unknown
Main area:_________________________________________
Sub-area:___________________________________________
Gender of main perpetrator M F U
Number of perpetrators 1 2 3 4 or more Unknown
PLACEMENT AFTER INITIAL ASSESSMENT
1 Discharged
2 Admitted to ward
3 Admitted to ICU
4 Died
5 Absconded
6 Referred to: _________________
7 Transferred to: _________________
8 Information not available at time of interview
99 Unknown
FORM COMPLETED BY
Name:
Signature:
Date:

Injury Morbidity Surveillance in Nyanga and Khayelitsha: Phase 2 Summary Report 28
Appendix B: League table ranking specific cause of injury by age category
Table 10: League table showing leading specific causes of injury by age category
Age category
Rank <1 1-4 5-9 10-14 15-19 20-24 25-34 35-44 45-54 55-64 >65 Overallg
1 Hot liquid burn
Fall on level Pedestrian Fall on level Sharp object
viol. Sharp object
viol. Sharp object
viol. Sharp object
viol. Sharp object
viol. Sharp object
viol. Sharp object
viol. Sharp object
viol.
1 10 12 13 27 56 83 25 15 3 3 216
2 Fall on level
Hot liquid burn
Fall on level Sharp object
viol Push/kick/
punch Firearm viol.
Blunt object viol.
Pedestrian Fall on level Push/kick/
punch Fall on level Fall on level
1 4 5 4 9 9 25 11 4 2 2 59
3 Fall from height
Other Rape/sexual Dog bite Blunt object
viol. Blunt object
viol. Push/kick/
punch Blunt object
viol. Blunt object
viol Passenger Fall on stairs
Blunt object viol.
1 4 5 3 6 8 22 10 4 2 2 56
4 Unknown Blunt object Sharp object
Other bite/ sting
Rape/sexual Pedestrian Fall on level Push/kick/
punch Push/kick/
punch Fall on level Firearm viol.
Push/kick/ punch
1 2 4 2 6 8 12 7 4 1 2 50
5 Passenger Jump Blunt object Rape/sexual Fall on level
Push/kick/ punch
Passenger Fall on level Poisoning
viol. Dog bite
Unknown violence
Pedestrian
1 2 4 2 4 5 8 5 3 1 2 47
6
Paraffin
poisoning Jump Passenger Sharp object
Other poisoning
S.H. Pedestrian Blunt object Passenger Unknown
Unknown transport
Passenger
2 4 2 3 5 8 4 3 1 2 27
7
Other bite/
sting Passenger Pedestrian Passenger
Other violence
Unknown Firearm viol. Dog bite Blunt object
viol. Rape/sexual
2 3 2 3 4 5 4 2 1
25
Unknown
Unknown violence
Pedestrian Pedestrian
Firearm viol.
2
5
2 1
21
Rape/sexual
Unknown violence
2 1
g Overall ranking column includes total injuries from each specific cause or method. Those that could not be ranked were excluded because either there were no cases, or there were more specific causes or methods (typically one or two cases) than remaining ranking places could accommodate.

Injury Morbidity Surveillance in Nyanga & Khayelitsha: Phase 1 Summary Report 29
Appendix C: Comparison between 2012/2013/2014 surveysh
Table 11: Proportion of injury and non-injury cases by facility – 2012/2013/2014 surveys
Facility KDH Site B MM Gugulethu GFJ Nyanga Total
Sep 2012
Injury 239 (47.8) 156 (56.9) 40 (25.3) 254 (52.5) 161 (28.0) N/A 850 (42.7)
Non-injury 261 (52.2) 118 (43.1) 118 (74.7) 230 (47.5) 414 (72.0) N/A 1141 (57.3)
Total 500 (100.0) 274 (100.0) 158 (100.0) 575 (100.0) 484 (100.0) N/A 1991 (100.0)
Sep 2013
Injury 151 (34.2 ) 240 (51.1) 34 (27.9) 325 (56.0) 80 (25.5) 6 (7.2) 836 (41.6)
Non-injury 291 (65.8) 230 (28.9) 88 (72.1) 255 (44.0) 234 (74.5) 77 (92.8) 1175 (58.4)
Total 442 (100.0) 470 (100.0) 122 (100.0) 580 (100.0) 314 (100.0) 83 (100.0) 2011 (100.0)
Feb 2014
Injury 184 (25.0) 192 (34.8) 21 (20.2) 234 (39.8) 92 (33.8) 4 (6.2) 727 (31.4)
Non-injury 552 (75.0) 360 (65.2) 83 (79.8) 354 (60.2) 180 (66.2) 61 (93.9) 1590 (68.6)
Total 736 (100.0) 552 (100.0) 104 (100.0) 588 (100.0) 272 (100.0) 65 (100.0) 2317 (100.0)
Sep 2014 Heideveldi
Injury 143 (35.4) 216 (42.3) 30 (25.0) 223 (48.0) 72 (27.2) 3 (3.0) 687 (36.8)
Non-injury 261 (64.6) 295 (57.7) 90 (75.0) 242 (52.0) 193 (72.8) 98 (97.0) 1179 (63.2)
Total 404 (100.0) 511 (100.0) 120 (100.0) 465 (100.0) 265 (100.0) 101 (100.0) 1866 (100.0)
Table 12: Probable alcohol use by gender and cause of injury – 2012/2013/2014 surveys
Violence Transport
Sept 2012 Male Female Total Male Female Total
Yes 198 (53.4) 53 (33.5) 251 (47.5) 18 (28.1) 9 (21.4) 27 (25.5)
No 152 (41.0) 93 (58.9) 245 (46.3) 42 (65.6) 27 (64.3) 69 (65.1)
Unknown 21 (5.7) 12 (7.6) 33 (6.2) 4 (6.3) 6 (14.3) 10 (9.4)
Total 371 (100.0) 158 (100.0) 529 (100.0) 64 (100.0) 42 (100.0) 106 (100.0)
Sept 2013
Yes 158 (55.4) 65 (48.5) 223 (53.2) 12 (30.8) 4 (15.4) 16 (24.6)
No 86 (30.2) 56 (41.8) 142 (33.9) 23 (59.0) 20 (76.9) 43 (66.2)
Unknown 41 (14.4) 13 (9.7) 54 (12.9) 4 (10.3) 2 (7.7) 6 (9.2)
Total 285 (100.0) 134 (100.0) 419 (100.0) 39 (100.0) 26 (100.0) 65 (100.0)
Feb 2014
Yes 135 (50.6) 67 (45.0) 202 (48.6) 15 (29.4) 1 (3.5) 16 (20.0)
No 98 (36.7) 70 (47.0) 168 (40.4) 31 (60.8) 22 (75.9) 53 (66.3)
Unknown 34 (12.7) 12 (8.1) 46 (11.1) 5 (9.8) 6 (20.7) 11 (13.8)
Total 267 (100.0) 149 (100.0) 416 (100.0) 51 (100.0) 29 (100.0) 80 (100.0)
Sept 2014
Yes 155 (56.6) 54 (45.0) 209 (53.1) 14 (25.9) 3 (8.8) 17 (19.3)
No 83 (30.3) 49 (40.8) 132 (33.5) 30 (55.6) 28 (82.4) 58 (65.9)
Unknown 36 (13.1) 17 (14.2) 53 (13.5) 10 (18.5) 3 (8.8) 13 (14.8)
Total 274 (100.0) 120 (100.0) 394 (100.0) 54 (100.0) 34 (100.0) 88 (100.0)
h Data for 2012 exclude data from Elsies River CHC, which were included in the RA conducted in 2012 survey. i GFJ Hospital was undergoing on-going restructuring changes at the time of this RA, a process that started in October 2013. The emergency unit has been relocated to Heideveld CHC. As such data collection was conducted at Heideveld CHC in September 2014. In the first three RAs data collection occurred at GFJ Hospital.

Injury Morbidity Surveillance in Nyanga and Khayelitsha: Phase 2 Summary Report 30
Table 13: Proportion of injury cases by cause – 2012/2013/2014 surveys
Violence Sexual assault Transport Unintentional Self-harm Unknown Total
Sep-12 529 (62.2) 58 (6.8) 106 (12.5) 168 (19.8) 20 (2.4) 27 (3.2) 850 (100.0)
Sep-13 419 (61.4) 35 (5.1) 65 (9.5) 176 (25.8) 23 (3.4) N/A 683 (100.0)
Feb-14 416 (60.4) 26(3.8) 80 (11.6) 172 (25.0) 21 (3.1) N/A 689 (100.0)
Sep-14 394 (58.9) 25 (3.7) 88 (13.2) 174 (26.0) 13 (1.9) N/A 669 (100.0)
Figure 7: Proportion of injury and non-injury cases by facility – 2012, 2013 and 2014 surveysj
j GFJ Hospital was undergoing on-going restructuring changes at the time of this RA, a process that started in October 2013. The emergency unit has been relocated to Heideveld CHC. As such data collection was conducted at Heideveld CHC in September 2014. In the first three RAs data collection occurred at GFJ Hospital.
KDH Site B MM Gug GFJ* Nyanga Total
Sept 2012 47.8 56.9 25.3 52.5 28.0 42.7
Sept 2013 34.2 51.1 27.9 56.0 25.5 7.2 41.6
Feb 2014 25.0 34.8 20.2 39.8 33.8 6.2 31.4
Sept 2014 35.4 42.3 25.0 48.0 27.2 3.0 36.8
0.0
10.0
20.0
30.0
40.0
50.0
60.0
Pro
po
rtio
n o
f in
jury
cas
es
Proportion of injury cases by facility 2012/2013/2014 surveys