initiation and organizational modes of an extreme-rain
TRANSCRIPT

Initiation and Organizational Modes of an Extreme-Rain-Producing MesoscaleConvective System along a Mei-Yu Front in East China
YALI LUO
State Key Laboratory of Severe Weather, Chinese Academy of Meteorological Sciences, Beijing, China
YU GONG
National Meteorological Center, Chinese Meteorological Administration, Beijing, China
DA-LIN ZHANG
State Key Laboratory of Severe Weather, Chinese Academy of Meteorological Sciences, Beijing, China,
and Department of Atmospheric and Oceanic Science, University of Maryland, College Park, College Park, Maryland
(Manuscript received 6 April 2013, in final form 24 August 2013)
ABSTRACT
The initiation and organization of a quasi-linear extreme-rain-producing mesoscale convective system
(MCS) along a mei-yu front in east China during the midnight-to-morning hours of 8 July 2007 are studied
using high-resolution surface observations and radar reflectivity, and a 24-h convection-permitting simulation
with the nested grid spacing of 1.11 km. Both the observations and the simulation reveal that the quasi-linear
MCS forms through continuous convective initiation and organization into west–east-oriented rainbands with
life spans of about 4–10 h, and their subsequent southeastward propagation. Results show that the early
convective initiation at the western end of the MCS results from moist southwesterly monsoonal flows as-
cending cold domes left behind by convective activity that develops during the previous afternoon-to-evening
hours, suggesting a possible linkage between the early morning and late afternoon peaks of the mei-yu
rainfall. Two scales of convective organization are found during the MCS’s development: one is the east- to
northeastward ‘‘echo training’’ of convective cells along individual rainbands, and the other is the south-
eastward ‘‘band training’’ of the rainbands along the quasi-linear MCS. The two organizational modes are
similar within the context of ‘‘training’’ of convective elements, but they differ in their spatial scales and
movement directions. It is concluded that the repeated convective backbuilding and the subsequent echo
training along the same path account for the extreme rainfall production in the present case, whereas the band
training is responsible for the longevity of the rainbands and the formation of the quasi-linear MCS.
1. Introduction
The mei-yu season over the Yangtze–Huai Rivers
basin (YHRB; see Fig. 1 for the distribution of the two
rivers), typically occurring during the period from mid-
June to mid-July, is one of the three heavy-rainfall periods
over China (e.g., Ding 1992). Numerous observational and
modeling studies have been conducted in the past three
decades to examine the large-scale circulation, synoptic-
scale weather systems, mesoscale convective systems
(MCSs), and cloud-precipitation morphology associated
with the mei-yu rainfall (Chen and Yu 1988; Chen et al.
1998; Qian et al. 2004; Ding and Chan 2005). Most of the
previous studies have attributed the generation of heavy
rainfall to the continuous lifting of moist monsoonal air
at the mei-yu front that is characterized by weak tem-
perature gradients but high equivalent potential tem-
perature ue gradients (Ding and Chan 2005). Because of
its quasi-stationary character, the YHRB experiences
heavy rainfall often as a series of convective cells moves
over the same region along the mei-yu front—the so-
called echo-training process (Doswell et al. 1996).
Only recently has the rapid growth of computing
power allowed real-data convection-permitting studies
of MCSs with a grid spacing of 1–4 km (Lean et al. 2008;
Corresponding author address: Dr. Yali Luo, State Key Labora-
tory of Severe Weather, Chinese Academy of Meteorological Sci-
ences, Beijing 100081, China.
E-mail: [email protected]
JANUARY 2014 LUO ET AL . 203
DOI: 10.1175/MWR-D-13-00111.1
� 2014 American Meteorological Society

Kain et al. 2008; Schwartz et al. 2009). Of relevance to
the present study is a cloud-resolving simulation of a
heavy-rain-producing MCS that occurred during the
mei-yu season of July 2003 with the nested grid size of
444mbyZhang andZhang (2012, hereafterZZ12). ZZ12
demonstrate the important roles of isentropic lifting of
moist monsoonal air over convectively generated cold
domes in triggering deep convection, of a low-level jet
(LLJ) in maintaining conditional instability, and of the
echo training in producing the heavy rainfall.
Recently, the mei-yu rainfall over YHRB was found
to exhibit two diurnal peaks: one in the early morning
with a duration of more than 6 h and the other in the late
afternoon of 1–3-h duration (Yu et al. 2007; Zhou et al.
2008; Yuan et al. 2010; Yuan et al. 2012; Luo et al. 2013).
Mechanisms that govern the formation of the early
morning rainfall peak are not well known, despite nu-
merous studies on the mei-yu rainfall over YHRB. Al-
though the importance of the low-level southwesterly
flow has been noticed (Chen et al. 2010), our knowledge
FIG. 1. (a) Topography (shadings) in the simulation domains (D1, D2, and D3). The Tibetan
Plateau and the Yangtze and Yellow Rivers (blue lines), along with a few cities, are labeled.
(b) Topography (shadings) over the inner-most domain (D3). The rectangular box denotes the
control region used in the present study. TheHuaiRiver (blue line), andMountsDabie,Huang,
and Lu are labeled. The small black circles above the letters W, H, and N represent the
Wangjiaba reservoir and the cities of Hefei and Nanjing, respectively. The remaining figures
also adopt this labeling convention.
204 MONTHLY WEATHER REV IEW VOLUME 142

about the important processes at the meso- and smaller
scales is lacking. In particular, details of the initiation
and organization of MCSs are essentially unavailable in
the literature due to the lack of high-resolution obser-
vations. Convective initiation, surface mesoscale fea-
tures, and echo-training phenomena shown in ZZ12 are
based on a cloud-resolving simulation with few obser-
vational supports.
The present study focuses on an extreme rainfall
event that occurred over YHRB during themidnight-to-
morning hours [i.e., 0000–1400 Beijing standard time
(BST), BST 5 UTC 1 8 h] of 8 July 2007. The mei-yu
season of 2007 was well known in China for having the
worst flood in the Huai River valley since 1954 due to
the development of several heavy rainfall events and the
unusually long rainy period over the region from 19 June
to 26 July (Zhao et al. 2007). The extreme rainfall event
under study was the heaviest one during the season.
Figure 2a shows the 14-h accumulated rainfall distribu-
tion exhibiting an elongated rainfall belt of more than
700 km in length and 100–200 km in width, with the peak
amount of 298mm; it was nearly west–east (northwest–
southeast) oriented to the west (east) of the Huai River.
In this study, we focus more on the western portion of
this rainfall belt, as highlighted by a rectangular box
of about 360 km 3 100 km in Fig. 2a, where a majority
of rain gauge stations receiving more than 200mm of
rainfall are located. Thus, the elongated rectangular box
is hereafter referred to as the control region or box.
Because of the persistent heavy rainfall, the water level
of Wangjiaba’s reservoir, as denoted by the ‘‘W’’ in
Fig. 2, was up to 29.4m on 9 July. It exceeded the res-
ervoir warning level by 1.8m and prompted the Chinese
Ministry of Water Resources to make a sluice in the
reservoir.
The major objectives of the present study are twofold:
(i) to investigate the mechanisms governing the noc-
turnal convective initiation along the mei-yu front and
(ii) to document the meso-g- to meso-b-scale organiza-
tions of the associated MCS that developed during the
midnight-to-early morning period and weakened in the
afternoon hours of 8 July 2007. The objectives will be
achieved through multiscale observational analyses and
a 24-h numerical simulation of the MCS with the nested
1.1-km grid spacing. The observational data used herein
include the mosaic radar reflectivity data and the 8-km
resolution rainfall, whose high quality has been shown
by Luo et al. (2013), surface observations of air tem-
perature, wind direction and speed, and pressure at au-
tomatic weather stations that were carefully quality
controlled.
It should be mentioned that Luo et al. (2010) have
studied this extreme rainfall event, but they focused
mostly on its associated microphysical processes and
their coupling with dynamical processes leading to the
generation of convective and stratiform rainfall. Their
results were obtained using eight convection-permitting
simulations with different cloud microphysics schemes
and the nested-grid size of 3.33km. The above-mentioned
objectives were not pursued.
The next section shows a sequence of radar reflectivity
from the mosaic reflectivity data during the life cycle of
the MCS, and provides an overview of the large-scale
conditions under which the torrential rainfall was gen-
erated. Section 3 provides a brief description of the
Weather Research and Forecasting Model (WRF) and
FIG. 2. Distribution of the 14-h accumulated surface rainfall
(shaded, mm) during the period of 0000–1400 BST 8 Jul 2007 de-
rived from (a) the 8-km resolution gridded hourly rainfall analysis
and (b) the model simulation from the finest-resolution (1.1 km)
domain. The rectangular box in black denotes the control region.
Note that slightly different locations of the control region in (a) and
(b) are given due to some position errors in the simulatedMCS (see
text). The narrow elongated zones (dashed) in (a) and (b) are used
to plot the Hovm€oller diagrams in Figs. 11a and 11b, respectively.
The Yangtze and Huai Rivers and coastlines are plotted in gray.
The black circles above the letters W, H, and N represent the
Wangjiaba reservoir and the cities of Hefei and Nanjing, re-
spectively. RMAX denotes the maximum accumulated rainfall
amount (mm).
JANUARY 2014 LUO ET AL . 205

shows verifications of the 24-h simulation against all
available high-resolution observations. Section 4 exam-
ines the initiation of the 8 July 2007 MCS. Section 5
presents the three-dimensional structures associated with
the extreme-rain-producing MCS, especially the echo-
training process and the propagation of convective rain-
bands along the same path leading to the extreme rainfall.
A summary and conclusions, including a conceptual
model of the MCS and its associated extreme rainfall
production, are presented in the final section.
2. Observational analysis
To help understand the generation of the quasi-linear
torrential rainfall belt given in Fig. 2a, we present first in
Fig. 3 the time sequence of radar reflectivity at 3 km
FIG. 3. Radar reflectivity (dBZ) at 3 km AGL derived from the
mosaic reflectivity data at 24 selected times. Numbers (1–12) in-
side ellipses are used to trace the evolution of major rainbands.
Black circles above the letters W and H denote the Wangjiaba
reservoir and the city of Hefei, respectively. The thick-dashed
lines show the approximate position of the mei-yu front (as rep-
resented by the ue 5 345-K contour at 850 hPa estimated from the
ERA-Interim analysis) from which ue decreases northward. The
ERA-Interim data at 0000, 0600, 1200, and 1800 BST 8 Jul are
linearly interpolated in time to obtain the ue contours. The blue
lines in (a)–(c) and (f) are isotherms at the surface and the blue
letter C denotes the local minimum temperature.
206 MONTHLY WEATHER REV IEW VOLUME 142

above ground level (AGL) during the life cycle of the
MCS. One can see many finescale structural features and
the detailed evolution of the extreme-rain-producing
MCSdue to the use of the newly available high-resolution
(0.018 3 0.018) mosaic radar reflectivity data (Luo et al.
2013). ThisMCSwas initiated nearmidnight (i.e., 0000BST
8 July) and then organized in a quasi-linear fashion
consisting of numerous well-defined, near-west–east-
oriented band-shaped convective precipitation regions
of reflectivity .35 dBZ (simply referred to herein as
rainbands) during its life span. Specifically, we have
traced major rainbands of interest in Fig. 3 from the
6-min resolution reflectivity data, and labeled them se-
quentially based on the time of their first appearances.
It is difficult to quantitatively define the beginning and
ending of a rainband because of the splitting of a rain-
band and merging of different rainbands.
Figure 3a shows two banded precipitation areas at the
initiating time: one close to Wangjiaba (W) with strong
echoes but small coverage (labeled as 1), and the other
betweenW and H with weak echoes but larger coverage
(referred to as WH). The latter propagated eastward to
the eastern edge of the control region and diminished in
3 h (Fig. 3d), contributing little to the total rainfall in the
control box. However, WH developed in the previous
afternoon-to-evening hours and left behind a meso-
b-scale cold dome (Figs. 3a–c and 3f) that appeared to
play an important role in triggering the nocturnal con-
vection during the early development stage of the MCS
of interest (section 4).
Rainband 1 grew in length as it moved northeastward
into the control region (Fig. 3b). By 0330 BST, it moved
close to the central axis of the elongated control box
with stratiform rainfall to the east (Fig. 3g). During the
period of 0000–0530 BST (Figs. 3a–k), we see the initi-
ation and organization of rainband 2 to the north of
rainband 1, rainbands 3 and 4 to the south of rainband 1,
and rainbands 5 and 6 to the west. As the old rainbands
propagated eastward, rainband 2 became stratiform due
to its downstream location with respect to the source of
the energy supply, while the backbuilding of convective
cells allowed rainband 5 to extend from the southwest
corner of the control box to the Huai River with a length
scale of over 200 km. Rainband 3 dissipated shortly after
it moved into the control box at about 0512 BST, when
rainband 7 initiated over the southeastern corner of the
control box due likely to the lifting of outflows from
rainband 4.
At 0530 BST, we see six well-defined rainbands that
were either west–east or southwest–northeast oriented,
depending on their distribution on the west or east side
of the Huai River (Fig. 3k). About 10min later, new
echoes of about 30 dBZ appeared over the southwestern
corner of the control box that formed rainband 8 at
about 0630 BST. By 0554 BST, rainband 5 split into two
segments (the western one is labeled rainband 9), due
likely to the different propagation speeds between the
southeastward-moving rainband and the eastward-moving
convective cells in the backbuilding region. These rain-
bands were observed to move southeastward along the
same area, while convective cells, after their formation,
tended to move eastward along individual rainbands;
they are referred to herein as band training and echo
training, respectively, rather than simply echo training,
as in Doswell et al. (1996). The life spans of these rain-
bands varied roughly from 4h (e.g., rainbands 2 and 3) to
about 10 h (e.g., rainband 1).
Most of the extreme rainfall was generated during the
5-h period of 0700–1200 BST 8 July when the back-
building pattern of radar reflectivity remained quasi-
stationary and highly organized in linear fashion, that
is, west–east oriented to the west of and northeast–
southwest oriented to the east of the Huai River (cf.
Figs. 3o–u and 2a). The backbuilding and echo-band
training processes could account for the generation of
the extreme rainfall in the present case (cf. Figs. 2a
and 3), which are to a certain extent similar to the back-
building conceptual model of extreme-rain-producing
MCSs by Schumacher and Johnson (2005) except for
the organized rainband structures and evolution. The
echo-training process appeared to dominate for the
west–east-oriented portion of the rainfall belt shown in
Fig. 2a. Shortly after 1200 BST, the quasi-linear MCS
began to break into scattered convective clusters con-
sisting of numerous southwest–northeast-oriented short
rainbands, despite the continued backbuilding to the
southwest of the control region (Figs. 3w and 3x). Thus,
the quasi-linear MCS over the control box dissipated
quickly during the early afternoon hours of 8 July.
One may note the distribution of a long but weak
precipitation region between the quasi-linear MCS and
the mei-yu front (the ue5 345-K contours in Fig. 3) after
0706 BST (Figs. 3o–x). This precipitation region could
be clearly traced back to the dissipation of rainband 6
as it moved to the rear of the quasi-linear MCS (cf.
Figs. 3h–j). Like rainband 2, its eastern portion evolved
into stratiform rain at later stages (Fig. 3h) as a result of
the reduced energy supply. Thus, the origin of this weak
(stratiform) precipitation region differs from the trailing
stratiform region in the conceptual model of a mid-
latitude mature squall line by Houze et al. (1989) and
that in a model-simulated one (Zhang et al. 1989).
However, the detrainment of buoyant air and hydro-
meteors from the quasi-linear MCS could contribute
to the maintenance of the stratiform precipitation
(Luo et al. 2010), which is similar in some sense to that
JANUARY 2014 LUO ET AL . 207
described by Houze et al. (1989). The backbuilding and
echo-training processes appeared to account for the
westward extension of the weak precipitation region
during the weakening stage (Figs. 3v–x). Nevertheless,
this rainband contributed little to the total rainfall pro-
duction (cf. Figs. 3o–x and 2a).
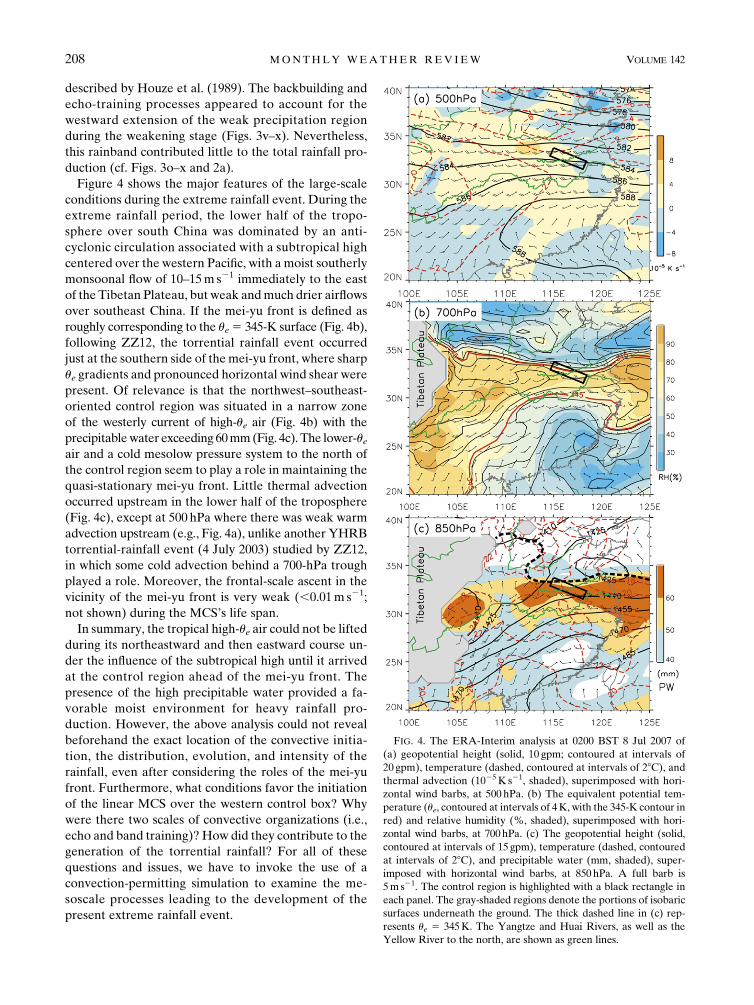
Figure 4 shows the major features of the large-scale
conditions during the extreme rainfall event. During the
extreme rainfall period, the lower half of the tropo-
sphere over south China was dominated by an anti-
cyclonic circulation associated with a subtropical high
centered over the western Pacific, with a moist southerly
monsoonal flow of 10–15m s21 immediately to the east
of the Tibetan Plateau, but weak andmuch drier airflows
over southeast China. If the mei-yu front is defined as
roughly corresponding to the ue5 345-K surface (Fig. 4b),
following ZZ12, the torrential rainfall event occurred
just at the southern side of themei-yu front, where sharp
ue gradients and pronounced horizontal wind shear were
present. Of relevance is that the northwest–southeast-
oriented control region was situated in a narrow zone
of the westerly current of high-ue air (Fig. 4b) with the
precipitablewater exceeding 60mm(Fig. 4c). The lower-ueair and a cold mesolow pressure system to the north of
the control region seem to play a role in maintaining the
quasi-stationary mei-yu front. Little thermal advection
occurred upstream in the lower half of the troposphere
(Fig. 4c), except at 500 hPa where there was weak warm
advection upstream (e.g., Fig. 4a), unlike another YHRB
torrential-rainfall event (4 July 2003) studied by ZZ12,
in which some cold advection behind a 700-hPa trough
played a role. Moreover, the frontal-scale ascent in the
vicinity of the mei-yu front is very weak (,0.01m s21;
not shown) during the MCS’s life span.
In summary, the tropical high-ue air could not be lifted
during its northeastward and then eastward course un-
der the influence of the subtropical high until it arrived
at the control region ahead of the mei-yu front. The
presence of the high precipitable water provided a fa-
vorable moist environment for heavy rainfall pro-
duction. However, the above analysis could not reveal
beforehand the exact location of the convective initia-
tion, the distribution, evolution, and intensity of the
rainfall, even after considering the roles of the mei-yu
front. Furthermore, what conditions favor the initiation
of the linear MCS over the western control box? Why
were there two scales of convective organizations (i.e.,
echo and band training)? How did they contribute to the
generation of the torrential rainfall? For all of these
questions and issues, we have to invoke the use of a
convection-permitting simulation to examine the me-
soscale processes leading to the development of the
present extreme rainfall event.
FIG. 4. The ERA-Interim analysis at 0200 BST 8 Jul 2007 of
(a) geopotential height (solid, 10 gpm; contoured at intervals of
20 gpm), temperature (dashed, contoured at intervals of 28C), andthermal advection (1025K s21, shaded), superimposed with hori-
zontal wind barbs, at 500 hPa. (b) The equivalent potential tem-
perature (ue, contoured at intervals of 4K, with the 345-K contour in
red) and relative humidity (%, shaded), superimposed with hori-
zontal wind barbs, at 700hPa. (c) The geopotential height (solid,
contoured at intervals of 15gpm), temperature (dashed, contoured
at intervals of 28C), and precipitable water (mm, shaded), super-
imposed with horizontal wind barbs, at 850hPa. A full barb is
5m s21. The control region is highlighted with a black rectangle in
each panel. The gray-shaded regions denote the portions of isobaric
surfaces underneath the ground. The thick dashed line in (c) rep-
resents ue 5 345K. The Yangtze and Huai Rivers, as well as the
Yellow River to the north, are shown as green lines.
208 MONTHLY WEATHER REV IEW VOLUME 142

3. Model description and verification
a. Model description
In this study, the multiscale processes leading to the
development of the 8 July 2007 extreme rainfall event
are explicitly simulated using a one-way triply nested (10/
3.33/1.11km), nonhydrostatic, cloud-resolving version of
the Advanced Research core of WRF (WRF-ARW,
version 3.0.1; Skamarock et al. 2008). All the domains
are initialized at 1400 BST (i.e., 0600 UTC) 7 July,
and then integrated for 24 h. The European Centre for
Medium-RangeWeather Forecasts (ECMWF) InterimRe-
Analysis dataset (ERA-Interim; Dee et al. 2011, available
online at http://www.ecmwf.int/research/era/do/get/era-
interim) is used for the model initial conditions and the
outermost lateral boundary conditions updated every
6 h. The configuration of the grids and the model physics
parameterizations are summarized in Table 1. Figure 1a
shows the three domains used, while Fig. 1b shows better
the topographical features of interest. The control box is
located about 100 km downstream of Mount Dabie in
central China. However, a sensitivity experiment with
the Dabie topography removed produces negligible
changes in the simulated convective evolution and sur-
face rainfall distribution (not shown). In the next three
subsections, we verify the 24-h simulation of the extreme
rainfall event against the 8-km-resolution rain-gauge-
based hourly rainfall analysis, themosaic radar reflectivity
data, and the mesoscale meteorological features ob-
served at the surface stations.
b. Surface rainfall verification
Figure 2 compares the 14-h accumulated rainfall be-
tween the model-simulated and observed results. Note
that the control boxes in all figures showing the simu-
lated results have been shifted 40 km to the northeast of
the one used in the observed due to the presence of lo-
cation and timing errors in the simulated rainfall; these
errors could be attributed to the use of the large-scale
initial conditions with little mesoscale information and
uncertainties in association with the model physical
schemes. With these limitations in mind, we may state
that the model reproduces reasonably well the general
orientation and elongated rainfall distribution as ob-
served, especially the extreme rainfall in the middle
portion of the rainfall belt. In particular, the model pro-
duces a peak rainfall amount of 234mm compared to the
observed amount of 298mm. This 64-mm rainfall dif-
ference is about half of that in the cloud-resolving study
of another YHRB torrential-rainfall event examined by
ZZ12. However, the model underproduces the rainfall
amount to the northwest of Wangjiaba; otherwise, it
would reproduce the west–east-oriented extreme rain-
fall belt as observed (cf. Figs. 2a and 2b).
Figure 5 compares the time series of the control-box-
averaged hourly rainfall rates between the observed and
simulated results, after grouping the 8-km resolution
observed and the model-simulated hourly rainfall rates
into three ranges: heavy, medium, and light, which are
defined as the rates of greater than 15, between 5 and 15,
and between 0.1 and 5mmh21, respectively. Note that
the rainfall rates are calculated for the observations and
the numerical simulation using their respective control
boxes, which are different from each other (Fig. 2). The
observed total rainfall rates, dominated by the heavy
rainfall rates, revealed three stages of the storm de-
velopment: (i) a growing stage from 0000 to 0730 BST
8 July, during which period the hourly rainfall rate
increased continuously, especially between 0330 and
0730 BST 8 July; (ii) a steady-state stage, in which the
hourly rainfall kept nearly constant during a period of
about 5 h; and (iii) a weakening stage when the rainfall
rate exhibited marked decreases after 1200 BST 8 July
(Fig. 5a).
The model captures well the total, heavy, medium,
and light rainfall rates during the growing stage. The
TABLE 1. Summary of the simulation design.
Domain D1 D2 D3
Grid points (x, y) 508 3 462 733 3 886 1147 3 553
Areal coverage (km2) 6410 3 5070 2950 3 2440 1273 3 613
Grid spacing (km) 10 3.33 1.11
s values 1, 0.993, 0.983, 0.970, 0.954, 0.934, 0.909, 0.880, 0.834, 0.788, 0.743, 0.697, 0.617,
0.544, 0.478, 0.417, 0.363, 0.313, 0.269, 0.228, 0.192, 0.159, 0.130, 0.104, 0.081,
0.061, 0.042, 0.026, 0.012, 0
Convective scheme Kain (2004) Turned off Turned off
Cloud microphysics scheme Morrison et al. (2009)
Longwave radiation scheme Mlawer et al. (1997)
Shortwave radiation scheme Dudhia (1989)
Planetary boundary layer scheme Mellor–Yamada–Janji�c (Janji�c 1990, 2002)
Land surface scheme Thermal diffusion (Chen and Dudhia 2001)
JANUARY 2014 LUO ET AL . 209

peak total and heavy rainfall intensities occur at 0830 BST
8 July—only 1 h later than the observed. The model also
appears to reproduce well the total rainfall amount over
the control region if the hourly total rainfall rates, given
in Fig. 5a, are integrated for the 14-h study period.
However, the model appears to fail in reproducing the
steady rainfall stage, as the simulated total rainfall de-
creases too rapidly after 0830 BST 8 July. This is mainly
associated with the simulated heavy rainfall portion (cf.
Figs. 5a and 5d), suggesting that the simulated MCS
under study weakens too rapidly. On the other hand, the
model overproduces rainfall at the medium intensity
during most of the maintenance stage, which could ac-
count partly for the too rapid decrease in the heavy
rainfall amount (cf. Figs. 5c and 5d). Note that both the
observed and simulated light rainfall, including the total
amount and coverage, account for less than 5% of the
total rainfall, which is consistent with a small coverage
area of stratiform rainfall associated with the MCS (cf.
Figs. 5b and 3), as compared to some other linear MCSs
shown by Houze et al. (1989), Zhang and Gao (1989),
and Parker and Johnson (2004).
c. Radar reflectivity verification
Figure 6 shows the maps of the simulated radar re-
flectivity, calculated following Smith (1984) and Luo
et al. (2010), which should be compared to those shown
in Fig. 3. Due to the delayed precipitation spinup, the
first simulated reflectivity map is shown 3.5 h later than
the observed (i.e., at 0330 BST 8 July). The model pro-
duces an MCS to the southwest of Wangjiaba, whose
patterns of behavior are similar to those of WH (cf.
Figs. 6a–d and 3a–d), but it lags 2–3 h behind the ob-
served and has a larger area of coverage. In spite of these
shortcomings, the model reproduces the backbuilding
and subsequent organization of convective cells into the
west–east-oriented rainbands over the western portion
of the control region, especially during the 3-h growing
stage of 0330–0630 BST 8 July (Figs. 6a–d). Like those
shown in Fig. 3, these rainbands become southwest–
northeast oriented and propagate southeastward after
moving to the east of the Huai River.
Although it is not possible to compare the convective
cells one by one between the observation and simula-
tion, it is encouraging that the model reproduces the
continuous initiation of convective cells over an elon-
gated region, as highlighted by box A in Figs. 6a–d, to
the northwest of Wangjiaba. Moreover, the model
reproduces five or six rainbands at the mature stage
(Figs. 6e–g), with both the width and the length scales
close to those observed. Because the model fails to re-
produce another (weak) rainband 6 between the mei-yu
front and the quasi-linear MCS (cf. Figs. 6e–g and 3e–g),
it produces a contiguous region of high reflectivity re-
sulting from the echo training and subsequent weakening
of convective cells along individual rainbands. This ap-
pears to be responsible for the overproduction of rainfall
with medium rates shown in Fig. 5c. The simulated
MCS shows signs of dissipation after 1100 BST 8 July,
which is 1 h earlier than the observed, as is also in-
dicated by Fig. 5a.
d. Mesoscale surface verification
Figure 7 compares the simulated mesoscale surface
features shortly after the initiation (i.e., 0200 BST) and
near the end of the mature stage (i.e., 1200 BST) of the
MCS of interest to those from the observations. Figures
7a and 7b are used herein to indicate howwell the model
reproduces a west–east-elongated rainfall band from
previous convective activity that occurred in the late
FIG. 5. Comparison of the time series of the hourly rainfall rates
(mmh21), averaged over the control region, during the period
0000–1400 BST 8 Jul 2007 between the observations (solid) and the
D3 simulation (dashed) for (a) the total and (b) heavy (.15mmh21),
(c) moderate (5–15mmh21), and (d) light (0.1–5mmh21) rainfall
rates. The rainfall rates at individual grid points are summed up for
each rainfall category and then divided by the total number of grid
points over the control region.
210 MONTHLY WEATHER REV IEW VOLUME 142

FIG. 6. (a)–(h) As in Fig. 3, but for the D3 simulation at the following selected times: 0330, 0430, 0530, 0630, 0800,
0900, 1000, and 1100 BST 8 Jul 2007. (a)-(d) The gray rectangle represents the region where the continuous CIN
occurs during the early development stage of the linearMCS, referred to as regionA in the text. (e),(h) The gray lines
represent the locations of cross sections used in Figs. 12a and 12b, respectively.
JANUARY 2014 LUO ET AL . 211

afternoon and evening hours of 7 July. The convective
activity left behind a cold dome with a minimum surface
temperature of 258C to the south of the western control
region, as compared to that of 298C in the rainfall-free
regions (Fig. 7a). Themodel reproduces the development
of the convective activity and the cold dome (Fig. 7b), but
with the cold center being located close to 100km to the
northeast of the observed (cf. Figs. 7a and 7b). As will be
shown in section 4, the cold dome plays a critical role in
the initiation of the quasi-linear MCS at midnight.
The convectively generated surface features at the
mature stage showmore clearly perturbations of surface
temperature, horizontal winds, and surface pressure af-
ter the quasi-linear MCS had lasted for about 5 h (cf.
Figs. 7c and 3t–x). One can see the development of an
elongated cold pool corresponding to the quasi-linear
MCS and the formation of a pressure ridge in the vi-
cinity of the control region. The cold dome had a
minimum surface temperature of 238C, while surface
temperatures in the rain-free area to the south were
338C and warmer. Such a large thermal gradient (i.e.,
108C in 120 km) generated cold outflows converging
with the southwesterly flows that were about 100 km to
the southwest of the MCS. In spite of the intense cold
outflow, deep convection occurred only over the control
region. The model reproduces, at least qualitatively, the
convectively generated cold pool, a meso-b-scale pres-
sure ridge, cold outflows converging with the south-
westerly flows, and large thermal contrasts along the
leading edge of the outflows during the mature stage (cf.
Figs. 7d and 7c). The simulated surface winds are slightly
larger than those observed owing to the interpolation of
their model surface values to 10m AGL.
Given the general agreement between the simulation
and observations in the surface rainfall distribution,
mesoscale surface features, and the development of the
quasi-linear MCS, we may use the convection-permitting
simulation along with more detailed observational anal-
yses to address the questions raised in section 2.
4. Convective initiation
In this section, we wish to use the model simulation
and observations to understand why convective initiation
FIG. 7. Comparison of the surface temperature (contoured in red at 28C intervals) and sea level pressure (con-
toured in blue at 1-hPa intervals), superimposed with horizontal wind barbs from (a),(c) observations collected at the
surface meteorological stations and (b),(d) the simulation valid at (a),(b) 0200 and (c),(d) 1200 BST 8 Jul 2007. Note
that a full barb is 2.5m21. Shading denotes 12-h accumulated rainfall amounts (mm). Letter C denotes the local
minimum temperature. The black rectangle in each panel denotes the control region.
212 MONTHLY WEATHER REV IEW VOLUME 142

could continuously occur in the western portion of the
control region during the early development of the lin-
ear MCS. Major factors that are relevant to convective
initiation at night include convective available potential
energy (CAPE), convective inhibition (CIN), and the
level of free convection (LFC) and lifting condensation
level (LCL) that are derived from parcel ascents at dif-
ferent vertical levels. Here, they are calculated using the
D3 simulation over a rectangular area of 120 km 340 km near the western edge of the control region (i.e.,
region A in Figs. 6a–d).
Figure 8 shows vertical profiles of the region-A-
averaged values of the above-mentioned parameters at
0300, 0500, and 0700 BST 8 July 2007. Of importance is
that CAPE (CIN) increases (decreases) from 0100 to
0700 BST below 3km AGL, except near the surface
where both CAPE and CIN remain nearly unchanged at
about 200 and 2200 J kg21, respectively. The relatively
small CAPE and large (negative) CIN values near the
surface are consistent with the simulated cold dome
produced by a previously dissipatedMCS (Fig. 7b). Note
an elevated layer of the maximum CAPE that is cen-
tered at about 1 km AGL with its magnitude increasing
from 300 J kg21 at 0100 BST to 1000 J kg21 at 0300 BST
and then to 2000 J kg21 at 0700 BST. CIN nearly van-
ishes during the period 0400–0700 BST 8 July immedi-
ately above the level of the maximum CAPE (i.e., about
1 km), where the corresponding LCL and LFC are only
100–200m above the parcel’s originating level. These
results suggest that the atmospheric conditions over the
western portion of the control region are favorable for
convective initiations with some small lifting needed,
especially for air parcels originating from 1 to 2 km
AGL. Moreover, the increasing CAPE and decreasing
CIN coincide well with the continuous initiations of
convective cells in the western portion of the linear
MCS during the period of 0300–0800 BST 8 July (cf.
Figs. 8a,b and 6a–d).
One may ask: Where is the source of the unstable air
causing the increasing CAPE? What mechanism is
responsible for the initiation of convective cells? To
answer these questions, backward trajectories are cal-
culated for the period of 0600–0000 BST 8 July 2007
using the D3 simulation outputs at 1-min intervals, fol-
lowing the technique of McGregor (1993) and Zheng
et al. (2013) with third-order precision. A total of 150
grid points at 1 km AGL in region A, where the peak
CAPE and minimum CIN are on average located, is
FIG. 8. Vertical profiles of environmental (a) CAPE (J kg21) and (b) CIN (J kg21) derived
from parcel ascents from various vertical levels averaged over regionA (shown in Figs. 6a–d) in
D3 at 0300, 0500, and 0700 BST 8 Jul 2007. The corresponding profiles of the distance (km)
from the parcel’s lifting level to its (c) LCL and (d) LFC.
JANUARY 2014 LUO ET AL . 213

selected. As shown in Fig. 9a, most air parcels could be
traced 6 h backward to 280–300 km to the southwest of
region A, where higher-ue air is present (e.g., 364 com-
pared to 348K in region A).
Figure 9b shows the time evolution of the mid-80th
percentile of trajectories (i.e., between the 15th and
135th trajectories) that arrives at certain vertical levels
but at any point in the (x, y) plane, because the top and
bottom 10th percentile of the trajectories are considered
to be outliers and should be excluded in the trajectory
analysis. One can see that most of the air parcels traced
in the southwesterly flows remain at about 600m AGL
with little vertical displacement until 0250 BST 8 July
when they begin to ascend up to 1 km AGL (cf. Figs. 9b
and 8a,b). Since there is little diabatic heating involved,
this ascent must follow isentropic surfaces above the
cold dome from the previous convective activity (e.g.,
associated withWH; Figs. 6a–c), just like those shown by
Banacos and Schultz (2005; see their Fig. 2c) and ZZ12.
The isentropic ascending motion occurs near the south-
western edge of sharp high-ue gradients (i.e., near the
southern end of an elongated box indicated by dashed
lines in Fig. 9a). A vertical cross section of the zonally
averaged ue and moisture fluxes with a width of 40 km,
taken from the location of the sharp high-ue gradients
northeastward, is given inFig. 9c, showing that a higher-ueair tongue as large as 364K, with a large moisture flux
tongue above, ascends over an underlying cold dome
northeastward into the western portion of the control
region. It is this overrunning higher-ue tongue that is re-
sponsible for increasing the CAPE at 1km AGL (Fig. 8a),
leading to the continued conditional instability in region
A (Figs. 6a–d).
In summary, both the larger-scale monsoonal flow and
the mesoscale surface cold dome left behind by the
previous convective activity play important roles in con-
trolling the timing and location of convective initiation.
While the importance of high-ue monsoonal flow in gen-
erating heavy mei-yu rainfall is well recognized (e.g.,
Chen et al. 2010), little evidence has been shown pre-
viously on the close linkage between the convective
activity occurring during the previous afternoon-to-
evening hours and the subsequent nocturnal convective
development along a mei-yu front. The above result
suggests the possible relationship between the two
observed rainfall peaks in the diurnal variation of the
mei-yu rainfall over YHRB.
5. Echo- and band-training processes
Previous studies have shown that linear MCSs tend
to favor the generation of extreme rainfall through the
echo-training process (Houze et al. 1990; Doswell et al.
FIG. 9. (a)Horizontal projection of the 150 backward trajectories
started from 980m AGL (colors from blue to orange denote the
times from 0600 BST backward to 0000 BST 8 Jul), overlaid by
wind barbs at 980m AGL (a full barb is 5m s21) and ue at 4-K
intervals at 240mAGL at 0300 BST 8 Jul 2007 (see text for details).
A rectangular box (A) is used to indicate the region of convective
initiation (also see Figs. 6a–d). (b) The time–height cross section of
themid-80th percentile of the trajectories. (c) Vertical cross section
of ue (contoured at 4-K intervals), in-plane flow vectors, and the
moisture flux [shadings, gm (kg s)21], jVjqy, where V is the hori-
zontal wind vector and qy is the mixing ratio of the water vapor,
at 0500 UTC 8 Jul 2007 along the southwest–northeast-oriented
narrow zone as dashed in (a).
214 MONTHLY WEATHER REV IEW VOLUME 142

FIG. 10. (a)–(j) Radar reflectivity (dBZ) at 3-km AGL derived from the mosaic reflectivity data at intervals of
12min during 0800–0948 BST 8 Jul 2007. The black line in (h) represents the location of the cross section used in
Fig. 12a.
JANUARY 2014 LUO ET AL . 215

1996; Schumacher and Johnson 2005). However, few
studies have examined the detailed three-dimensional
structures of the linear MCSs due to the lack of high-
resolution data. As an example, we illustrate the back-
building process by showing in Fig. 10 the observed
evolution of rainband 10 within a 108-min time window
at 12-min intervals. During 0800–0848 BST 8 July, new
convective cells were seen being continuously initiated
at the western edge of the west–east-oriented rainband
moving eastward, leading to its growth from about 60 km
FIG. 11. As in Fig. 10, but for the simulated radar reflectivity at intervals of 10min fromD3 during 0650–0820 BST
8 Jul 2007. Ellipses (N and S) denote the regions of convective backbuilding. The black line in (h) represents the
location of the cross section used in Fig. 12b.
216 MONTHLY WEATHER REV IEW VOLUME 142

to longer than 100 km in length (Figs. 10a–e). Of interest
is that the rainband exhibited little westward propaga-
tion until after 0848 BST, when new convective cells
began to form continuously and grow in size near its
southwestern end. As a result, this rainband extended
south-southwestward (Figs. 10e–h). Such a backbuilding
phenomenon also appeared in the formation or the
growth of the other rainbands (Fig. 3).
Figure 11 shows that although the model could not
reproduce the westward building of convective cells as
pronounced as the observed along two rainbands (la-
beled as N and S), it does reveal that the continued
convective initiation and growth at their western ends
in a quasi-stationary manner. This difference in con-
vective backbuilding could be attributed to either the
distribution of CIN on the west that is larger or the
outflow lifting that is weaker than the observed. On
the other hand, individual convective cells along the
two rainbands keep propagating northeastward, as will
be shown in the next section. All of this suggests that the
backbuilding process in the simulation is operative, but
much slower than the observed.
Figure 12 shows the vertical cross sections of the
observed radar reflectivity (Fig. 12a) and the model-
simulated radar reflectivity, ue, and in-plane flow vec-
tors (Fig. 12b), along a typical near-west–east-oriented
rainband in the vicinity of Wangjiaba during the mature
stage (see Figs. 10h and Figs. 11h). Both the observa-
tions and the simulation show that the individual rain-
bands consist of discrete, vertically erected convective
FIG. 12. Vertical cross section of radar reflectivity (dBZ; shadings) from (a) the mosaic radar
reflectivity data along a rainband (see Fig. 10h) at 0924 BST and (b) the model-simulated
reflectivity along a rainband (see Fig. 11h) at 0800 BST 8 Jul 2007. Note that (i) the observed
radar reflectivity in the lowest layers was missing as part of the limitations of the radar scan and
(ii) themodel-simulated ue at 4-K intervals and in-plane flow vectors are plotted in (b), but they
were not available from the observations. The vertical velocity is multiplied by a factor of 10.
Letters H and L denote the local maximum and minimum of ue, respectively.
JANUARY 2014 LUO ET AL . 217

cells with increasing reflectivity (i.e., from 35 to 55 dBZ)
and cloud-top height rearward, followed by a narrow
stratiform region with reflectivity of less than 35 dBZ,
indicating the development of convective cells at the
different stages of their life cycles. Again, new convec-
tive cells are seen being triggered at the western end
of the rainband. The simulation provides more detailed
information about the dynamical and thermodynamical
structures associated with the echo-training process
(Fig. 12b). Superimposed on the convective updrafts and
downdrafts are along-band flows of 15–20ms21 through-
out the troposphere before reaching the intense cells
where the southwesterly flows in the lowest 4-km layer
ascend rearward, just like the front-to-rear ascending
flow in the conceptual model of Houze et al. (1989).
Obviously, the along-band flows account for the rear-
ward advection of cloud hydrometeors or convective
cells and the formation of the stratiform region, which
is consistent with the echo-training conceptual model
of Doswell et al. (1996). With all the results shown in
Figs. 2, 3, 6, 10, and 11, we may state that the continuous
convective initiation in region A and the subsequent
echo training along the west–east-oriented rainbands
are mostly responsible for the generation of extreme
rainfall in the present case.
The observed rainband training can also be seen in
Fig. 13a, which shows a Hovm€oller diagram of the near-
west–east-averaged radar reflectivity at 6-min intervals
along the ridge axis of the total accumulated rainfall, as
given in Fig. 2a. Only the reflectivity data along the
central 40-km portion of torrential rainfall (Fig. 2a; i.e.,
roughly with a total accumulated rainfall amount of
100mm and greater) are processed. The extreme rainfall
region encountered the passage of five major rainbands;
they propagate rightward at roughly the same speed of
12–15m s21. The band training along the northwest–
southeast-oriented quasi-linear MCS appears to favor
the maintenance of the rainbands as they could access
higher CAPE in the larger-scale west-to-southwesterly
flows.
The model also reproduces reasonably well the ob-
served band-training process. One can see that the
general rainband structures in Fig. 13b are very similar
to those in Fig. 13a, except for some differences in in-
tensity and the timing and location of convective initi-
ations in the western portion of the linear MCS. Of
importance is that the model reproduces four or five
well-defined rainbands moving along the quasi-linear
MCS at the same speed of 12–15m s21 as that seen from
the radar observations. The model also appears to re-
produce reasonably well the temporal and spatial in-
tervals between individual rainbands as well as the
westward building of deep convection in the Hovm€oller
diagram. The previously mentioned underestimation of
rainfall over the western end of the control box in the
simulation (cf. Figs. 2b and 2a) can also be seen by
comparing Figs. 13b and 13a.
Vertical cross sections along the leading portion of the
quasi-linearMCS in the simulation, given in Fig. 14 show
the training scenarios that are similar to those along a
rainband. That is, during the mature stage (Fig. 14a), the
linearMCS is composed of numerous discrete rainbands
with high reflectivity (greater than 50 dBZ) and high
cloud depths in the western half of the control region,
except for the backbuilding region, and relatively lower
ones in the eastern half. The cloud depth appears to be
closely related to the magnitude of the incoming ele-
vated environmental-ue air that decreases rightward,
indicating the decreasing conditional instability right-
ward. Like the echo training, along-line flows of
FIG. 13. (a) Time–distance (i.e., Hovm€oller) diagram of the ob-
served 6-min radar reflectivities (dBZ) that are west–east averaged
along the central portion of the observed rainfall belt (i.e., a narrow
zone denoted by dashed lines in Fig. 2a). (b) As in (a), but for the
simulated 5-min rainfall rates (mmh21) that are west–east aver-
aged along the central portion of the simulated rainfall belt (i.e.,
a narrow zone denoted by dashed lines in Fig. 2b).
218 MONTHLY WEATHER REV IEW VOLUME 142
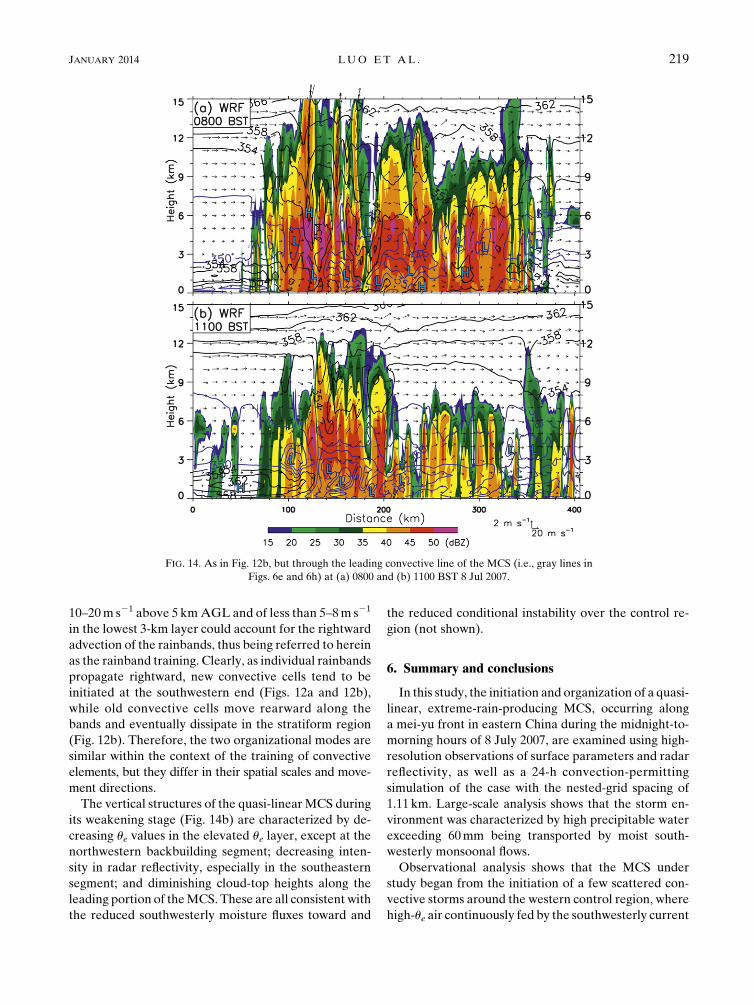
10–20m s21 above 5 kmAGL and of less than 5–8m s21
in the lowest 3-km layer could account for the rightward
advection of the rainbands, thus being referred to herein
as the rainband training. Clearly, as individual rainbands
propagate rightward, new convective cells tend to be
initiated at the southwestern end (Figs. 12a and 12b),
while old convective cells move rearward along the
bands and eventually dissipate in the stratiform region
(Fig. 12b). Therefore, the two organizational modes are
similar within the context of the training of convective
elements, but they differ in their spatial scales and move-
ment directions.
The vertical structures of the quasi-linearMCS during
its weakening stage (Fig. 14b) are characterized by de-
creasing ue values in the elevated ue layer, except at the
northwestern backbuilding segment; decreasing inten-
sity in radar reflectivity, especially in the southeastern
segment; and diminishing cloud-top heights along the
leading portion of theMCS. These are all consistent with
the reduced southwesterly moisture fluxes toward and
the reduced conditional instability over the control re-
gion (not shown).
6. Summary and conclusions
In this study, the initiation and organization of a quasi-
linear, extreme-rain-producing MCS, occurring along
a mei-yu front in eastern China during the midnight-to-
morning hours of 8 July 2007, are examined using high-
resolution observations of surface parameters and radar
reflectivity, as well as a 24-h convection-permitting
simulation of the case with the nested-grid spacing of
1.11 km. Large-scale analysis shows that the storm en-
vironment was characterized by high precipitable water
exceeding 60mm being transported by moist south-
westerly monsoonal flows.
Observational analysis shows that the MCS under
study began from the initiation of a few scattered con-
vective storms around the western control region, where
high-ue air continuously fed by the southwesterly current
FIG. 14. As in Fig. 12b, but through the leading convective line of the MCS (i.e., gray lines in
Figs. 6e and 6h) at (a) 0800 and (b) 1100 BST 8 Jul 2007.
JANUARY 2014 LUO ET AL . 219

isentropically ascended a cold dome left behind by
convective activity that occurred during the previous
afternoon-to-evening hours. The continuous convective
initiation, their organizations into more than eight well-
defined west–east-oriented rainbands in the western half
of the control region, and the subsequent southeastward
propagation of the rainbands led to the formation of
the quasi-linear MCS. Although some rainbands were
reorganized during their southeastward propagations,
their identities could be readily traced. The MCS lasted
for 14 h from the appearance of its first rainband to its
dissipation, while the life span of individual rainbands
ranged from 4 to more than 10 h.
It is shown that although there are some notable dif-
ferences between the convection-permitting simulation
and the observations, the model reproduces reasonably
well the above-mentioned meso-b-scale features, in-
cluding the previously dissipated MCS and the asso-
ciated cold pool, the orientation and distribution of
the quasi-linear MCS, as well as the associated rainfall
magnitudes. Themodel produces a peak rainfall amount
of 234mm compared to an observed amount of 298mm,
both occurring during the middle portion of the lin-
ear MCS.
Based on the observational analysis and numerical
simulation results, Fig. 15 summarizes the two scales of
convective organization taking place during the mature
stage of the quasi-linear MCS: one is the eastward echo
training of convective cells along individual rainbands
and the other is the southeastward band training of the
rainbands along the MCS. The echo training appears
to be responsible for generating most of the extreme
rainfall (to the west of the Huai River), while the band
training accounts for the longevity of some rainbands
and the formation of the linear MCS. The two organi-
zational modes are similar within the context of ‘‘train-
ing’’ of convective elements, but they differ in their
spatial scales and directions of movement. New con-
vection initiates at the western (or southwestern) end of
individual rainbands, as the high-ue air continuously fed
by the southwesterly current ascends the convectively
generated cold outflows.
The above conceptual model appears to be similar
to that of the extreme rainfall climatology in North
America by Schumacher and Johnson (2005) in terms
of echo training, but differs in the formation of several
parallel rainbands, their subsequent band training along
the same path, and the development of little stratiform
rainfall. The present quasi-linear MCS also includes a
weak rainband, which evolved into a stratiform zone, to
the rear of the leading rainbands as a result of the re-
duced energy supply. Our results also reveal a possible
linkage between a mesoscale cold pool, generated by
convective activity during the previous afternoon-to-
evening hours, and the nocturnal convective initiation
leading to the development of an extreme-rain-producing
linear MCS with the maximum regional rainfall in the
early morning hours. Clearly, more case studies need to
be conducted in the future to generalize our findings and
gain insights into different convective organizations in
the development of extreme rainfall. In a forthcoming
study, we will further examine multiscale processes that
influencing the formation and evolution of the linear
MCS in the present case.
Acknowledgments. We wish to thank the anonymous
reviewers for providing constructive comments and
suggestions, which significantly helped improve the
quality of the manuscript. We would also like to thank
Dr. Yongjun Zheng for his assistance in performing the
trajectory analysis. This study was jointly funded by the
National Basic Research Program of China (973 Program;
2012CB417202), the National Key Technology Research
and Development Program of China (2012BAC22B03),
the National Natural Science Foundation of China (Pro-
jects 41175049 and 41221064), and the Basic Research
Funds of the Chinese Academy of Meteorological Sci-
ences (2012Y001). The third author (DLZ) was also
supported by NSF Grant ATM0758609 and NOAA
Grant NA12NWS4680008. The surface observations
and radar data were provided by the National Meteo-
rological Information Center of the Chinese Meteoro-
logical Administration, where theWRF simulations were
performed.
REFERENCES
Banacos, P. C., and D. M. Schultz, 2005: The use of moisture flux
convergence in forecasting convective initiation: Historical
and operational perspectives. Wea. Forecasting, 20, 351–366.
FIG. 15. Schematic diagram of the backbuilding, echo training,
and rainband training associated with the quasi-linear-shaped,
extreme-rain-producing MCS. Shadings in orange, green, and blue
represent radar reflectivity values of roughly 50, 35, and 20 dBZ,
respectively. See the text for more details.
220 MONTHLY WEATHER REV IEW VOLUME 142

Chen, F., and J. Dudhia, 2001: Coupling an advanced land surface–
hydrology model with the Penn State–NCARMM5 modeling
system. Part I: Model implementation and sensitivity. Mon.
Wea. Rev., 129, 569–585.Chen, G. T. J., and C. C. Yu, 1988: Study of low-level jet and ex-
tremely heavy rainfall over northern Taiwan in the mei-yu
season. Mon. Wea. Rev., 116, 884–891.
Chen, H., R. Yu, J. Li, W. Yuan, and T. Zhou, 2010:Why nocturnal
long-duration rainfall presents an eastward-delayed diurnal
phase of rainfall down theYangtzeRiver valley. J. Climate, 23,
905–917.
Chen, S. J., Y.-H. Kuo, W. Wang, Z. Y. Tao, and B. Cui, 1998: A
modeling case study of heavy rainstorms along the mei-yu
front. Mon. Wea. Rev., 126, 2330–2351.
Dee, D. P., and Coauthors, 2011: The ERA-Interim reanalysis:
Configuration and performance of the data assimilation sys-
tem. Quart. J. Roy. Meteor. Soc., 137, 553–597.
Ding, Y. H., 1992: Summer monsoon rainfalls in China. J. Meteor.
Soc. Japan, 70, 373–396.——, and J. C. L. Chan, 2005: The East Aisan summer monsoon:
An overview. Meteor. Atmos. Phys., 89, 117–142.
Doswell, C. A., III, H. E. Brooks, and R. A. Maddox, 1996: Flash
flood forecasting: An ingredients-based methodology. Wea.
Forecasting, 11, 560–581.
Dudhia, J., 1989: Numerical study of convection observed dur-
ing the Winter Monsoon Experiment using a mesoscale two-
dimensional model. J. Atmos. Sci., 46, 3077–3107.
Houze, R. A., Jr., S. A. Rutledge,M. I. Biggerstaff, and B. F. Smull,
1989: Interpretation of Doppler weather radar displays in
midlatitude mesoscale convective systems. Bull. Amer. Me-
teor. Soc., 70, 608–619.
——, B. F. Smull, and P. Dodge, 1990: Mesoscale organization of
springtime rainstorms in Oklahoma. Mon. Wea. Rev., 118,
613–654.
Janji�c, Z. I., 1990: The step-mountain coordinate: Physical package.
Mon. Wea. Rev., 118, 1429–1443.
——, 2002: Nonsingular implementation of the Mellor–Yamada
level 2.5 scheme in theNCEPMesoModel. NCEPOfficeNote
437, 61 pp.
Kain, J. S., 2004: The Kain–Fritsch convective parameterization:
An update. J. Appl. Meteor., 43, 170–181.——, and Coauthors, 2008: Some practical considerations re-
garding horizontal resolution in the first generation of op-
erational convection-allowing NWP. Wea. Forecasting, 23,
931–952.
Lean, H. W., P. A. Clark, M. Dixon, N. M. Roberts, A. Fitch,
R. Forbes, and C. Halliwell, 2008: Characteristics of high-
resolution versions of the Met Office Unified Model for
forecasting convection over the United Kingdom. Mon. Wea.
Rev., 136, 3408–3424.
Luo, Y., Y. Wang, H. Wang, Y. Zheng, and H. Morrison, 2010:
Modeling convective-stratiform precipitation processes on
a mei-yu front with the Weather Research and Forecasting
model: Comparison with observations and sensitivity to cloud
microphysics parameterizations. J. Geophys. Res., 115,D18117,
doi:10.1029/2010JD013873.
——, W. Qian, R. Zhang, and D.-L. Zhang, 2013: Gridded hourly
precipitation analysis from high-density rain-gauge network
over the Yangtze-Huai Rivers basin during the 2007 mei-yu
season and comparison with CMORPH. J. Hydrometeor., 14,1243–1258.
McGregor, J. L., 1993: Economical determination of departure
points for semi-Lagrangian models.Mon.Wea. Rev., 121, 221–
230.
Mlawer, E. J., S. J. Taubman, P. D. Brown, M. J. Iacono, and S. A.
Clough, 1997: Radiative transfer for inhomogeneous atmo-
sphere: RRTM, a validated correlated-k model for the long-
wave. J. Geophys. Res., 102 (D14), 16 663–16 682.
Morrison, H., G. Thompson, and V. Tatarskii, 2009: Impact of
cloud microphysics on the development of trailing stratiform
precipitation in a simulated squall line: Comparison of one-
and two-moment schemes. Mon. Wea. Rev., 137, 991–1007.
Parker,M.D., andR.H. Johnson, 2004: Structures and dynamics of
quasi-2D mesoscale convective systems. J. Atmos. Sci., 61,
545–567.
Qian, J. H., W. K. Tao, and K. M. Lau, 2004: Mechanisms for
torrential rain associated with the mei-yu development during
SCSMEX 1998. Mon. Wea. Rev., 132, 3–27.
Schumacher, R. S., and R. H. Johnson, 2005: Organization and
environmental properties of extreme-rain-producing meso-
scale convective systems. Mon. Wea. Rev., 133, 961–976.
Schwartz, C. S., and Coauthors, 2009: Next-day convection-allowing
WRFmodel guidance: A second look at 2-km versus 4-km grid
spacing. Mon. Wea. Rev., 137, 3351–3372.Skamarock, W. C., and Coauthors, 2008: A description of the
Advanced Research WRF version 3. NCAR/TN–4751STR,
113 pp.
Smith, P. L., 1984: Equivalent radar reflectivity factors for snow
and ice particles. J. Climate Appl. Meteor., 23, 1258–1260.
Yu, R.-C., T. J. Zhou, A. Y. Xiong, Y. J. Zhu, and J. Li, 2007:
Diurnal variations of summer precipitation over contigu-
ous China. Geophys. Res. Lett., 34, L01704, doi:10.1029/
2006GL028129.
Yuan, W.-H., R.-C. Yu, H.-M. Chen, J. Li, and M.-H. Zhang, 2010:
Subseasonal characteristics of diurnal variation in summer
monsoon rainfall over central eastern China. J. Climate, 23,
6684–6695.
——,——,M. Zhang,W. Lin, H. Chen, and J. Li, 2012: Regimes of
diurnal variation of summer rainfall over subtropical East
Asia. J. Climate, 25, 3307–3320.
Zhang, D.-L., and K. Gao, 1989: Numerical simulation of an intense
squall line during 10–11 June 1985 PRE-STORM. Part II: Rear
inflow, surface pressure perturbations and stratiform precip-
itation. Mon. Wea. Rev., 117, 2067–2094.
——, ——, and D. B. Parsons, 1989: Numerical simulation of
an intense squall line during 10–11 June 1985 PRE-STORM.
Part I: Model verification. Mon. Wea. Rev., 117, 960–994.
Zhang, M., and D.-L. Zhang, 2012: Subkilometer simulation of
a torrential-rain-producing mesoscale convective system in
East China. Part I: Model verification and convective organi-
zation. Mon. Wea. Rev., 140, 184–201.
Zhao, S.-X., L.-S. Zhang, and J.-H. Sun, 2007: Study of heavy
rainfall and related mesoscale systems causing severe flood in
Huaihe River basin during the summer of 2007 (in Chinese).
Climatic Environ. Res., 12, 713–727.
Zheng, Y.-J., G.-X. Wu, and Y.-M. Liu, 2013: Dynamical and
thermal problems in vortex development and movement.
Part I: A PV–Q view. Acta Meteor. Sin., 27, 1–14.
Zhou, T.-J., R. Yu, H. Chen, A. Dai, and Y. Pan, 2008: Summer
precipitation frequency, intensity, and diurnal cycle over
China: A comparison of satellite data with rain gauge obser-
vations. J. Climate, 21, 3997–4010.
JANUARY 2014 LUO ET AL . 221