initial investigation of land subsidence using gps … · initial investigation of land subsidence...
TRANSCRIPT
Presented at GNSS 2004The 2004 International Symposium on GNSS/GPS
Sydney, Australia6–8 December 2004
Initial Investigation Of Land Subsidence Using GPS DataAnd Rigorous Analysis
Halim Setan & Mohd Sharuddin Ibrahim Department of Geomatic Engineering
Faculty of Geoinformation Science & EngineeringUniversiti Teknologi Malaysia (UTM)
81310 UTM Skudai Johor, Malaysia
Abdul Nasir Matori & Sa’adiah Mohd SaatDepartment of Civil Engineering
Universiti Teknologi Petronas (UTP)Perak, Malaysia
Halim Setan
ABSTRACT
This research attempts to combine geophysical and Global PositioningSystem (GPS) data via Geographical Information System (GIS) to investigatethe land subsidence phenomena. This paper discusses the land subsidencedetection procedure using GPS via rigorous analysis, together with the initialresults. For testing purpose, two epochs of GPS data (in RINEX format) werecollected from 4 stations via static mode using dual frequency GPS receivers.Data for each epoch were imported into PINNACLE software for thecomputation of GPS baseline vectors (using precise ephemeris). The outputfrom PINNACLE was exported into NGS Blue Book format, and used asinput (via a special interface program CONVERT) for network adjustmentusing STARNET software. Consequently, the results from STARNET wereused as input (via program CONVERT) for rigorous deformation analysisusing our in-house developed software (GPSAD2000). The results show thepracticality of the data processing procedure using PINNACLE, STARNET,CONVERT and GPSAD2000.
KEYWORDS: GPS, STARNET, GPSAD2000, Deformation Detections, GIS
1. INTRODUCTION
Land subsidence occurs when large amounts of ground water have been withdrawn fromcertain types of rocks, such as fine-grained sediments. The rocks compact because the water is

partly responsible for holding the ground up. When the water is withdrawn, the rocks fall inon it. Subsidence is simply the formation of depressions on the ground surface (USGS, 2004).
Land subsidence causes many problems including: (1) changes in elevation and slope ofstreams, canals, and drains; (2) damage to bridges, roads, railroads, storm drains, sanitarysewers, canals, and levees; (3) damage to private and public buildings; and (4) failure of wellcasings from forces generated by compaction of fine-grained materials in aquifer systems. Insome coastal areas, subsidence has resulted in tides moving into low-lying areas that werepreviously above high-tide levels (USGS, 2004).
Sinkhole can be defined as a depression in the earth's surface caused by dissolving ofunderlying limestone, salt, or gypsum. Drainage is provided through underground channelsthat may be enlarged by the collapse of a cavern roof. Sinkholes are common where the rockbelow the land surface is limestone, carbonate rock, salt beds, or rocks that can naturally bedissolved by ground water circulating through them. As the rock dissolves, spaces andcaverns develop underground. Sinkholes are dramatic because the land usually stays intact fora while until the underground spaces just get too big. If there is not enough support for theland above the spaces then a sudden collapse of the land surface can occur. These collapsescan be small (Figure 1), or they can be huge and can occur where a house or road is on top(USGS, 2004).
Figure 1. Diagrammatic evolution of a collapsed sinkhole (USGS, 2004)
Several methods are available to monitor land subsidence and sinkhole. Examples of themethods are: repeated surveys with conventional leveling or GPS technique, geophysical
Residuum spalls into cavity
Resulting void in clayey residuum produces arch inoverburden
Cavity migrates upward by progressive roof collapse
Cavity breaches the ground surface creating sinkhole
technique (such as surface resistivity, Ground Penetrating Radar (GPR)), and InterferometricSynthetic Aperture Radar (InSAR).
1.1 GPS Technique
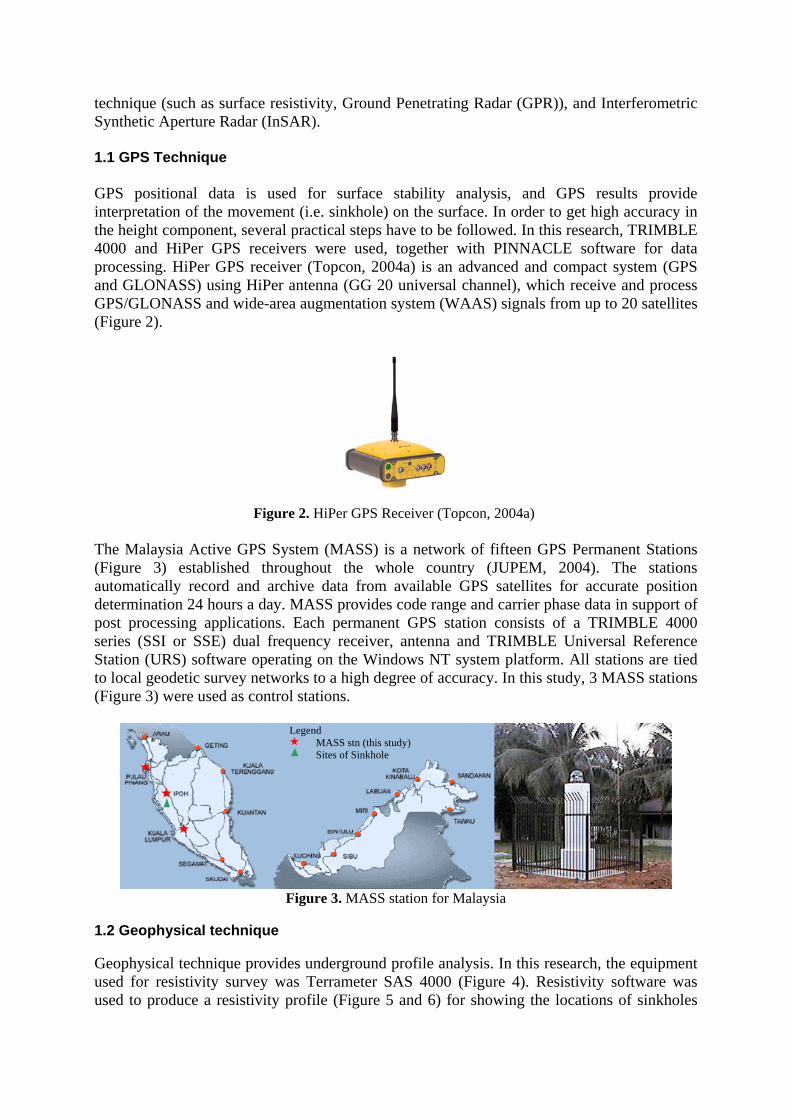
GPS positional data is used for surface stability analysis, and GPS results provideinterpretation of the movement (i.e. sinkhole) on the surface. In order to get high accuracy inthe height component, several practical steps have to be followed. In this research, TRIMBLE4000 and HiPer GPS receivers were used, together with PINNACLE software for dataprocessing. HiPer GPS receiver (Topcon, 2004a) is an advanced and compact system (GPSand GLONASS) using HiPer antenna (GG 20 universal channel), which receive and processGPS/GLONASS and wide-area augmentation system (WAAS) signals from up to 20 satellites(Figure 2).
Figure 2. HiPer GPS Receiver (Topcon, 2004a)
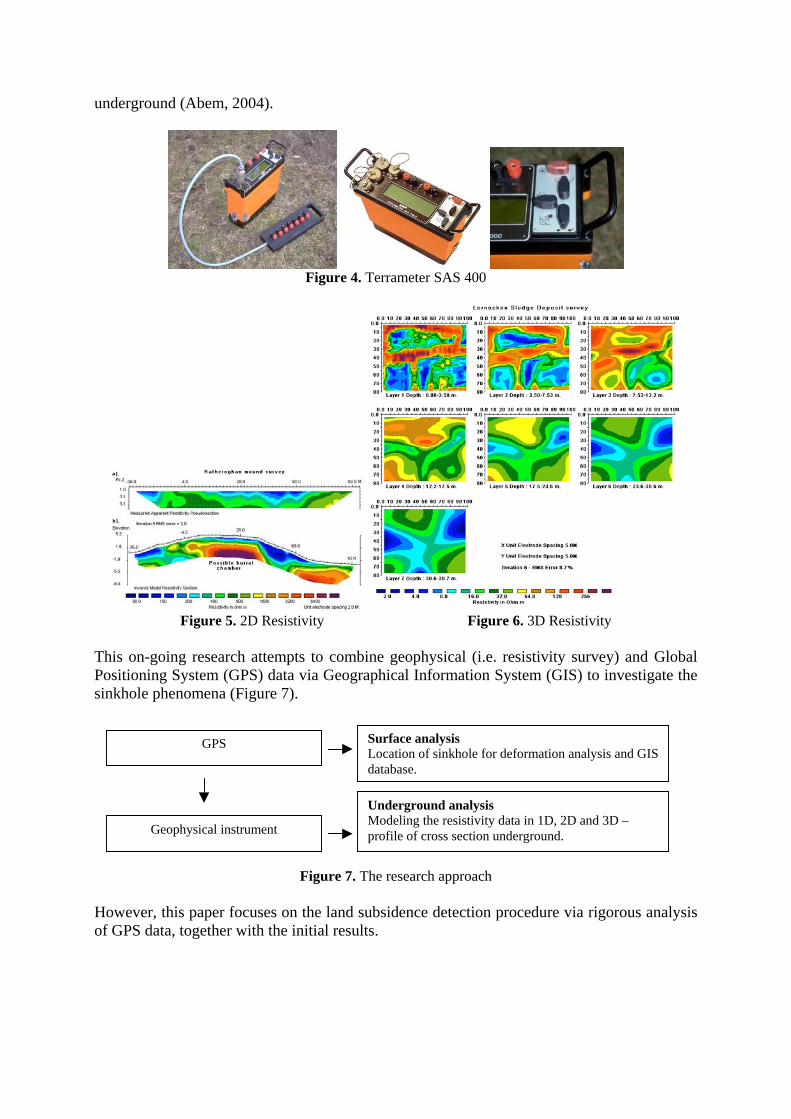
The Malaysia Active GPS System (MASS) is a network of fifteen GPS Permanent Stations(Figure 3) established throughout the whole country (JUPEM, 2004). The stationsautomatically record and archive data from available GPS satellites for accurate positiondetermination 24 hours a day. MASS provides code range and carrier phase data in support ofpost processing applications. Each permanent GPS station consists of a TRIMBLE 4000series (SSI or SSE) dual frequency receiver, antenna and TRIMBLE Universal ReferenceStation (URS) software operating on the Windows NT system platform. All stations are tiedto local geodetic survey networks to a high degree of accuracy. In this study, 3 MASS stations(Figure 3) were used as control stations.
1.2 Geophysical technique
Geophysical technique providused for resistivity survey wused to produce a resistivity
Legend MASS stn (this study) Sites of Sinkhole
Figure 3. MASS station for Malaysia
es underground profile analysis. In this research, the equipmentas Terrameter SAS 4000 (Figure 4). Resistivity software wasprofile (Figure 5 and 6) for showing the locations of sinkholes
underground (Abem, 2004).
Figure 4. Terrameter SAS 400
Figure 5. 2D Resistivity Figure 6. 3D Resistivity
This on-going research attempts to combine geophysical (i.e. resistivity survey) and GlobalPositioning System (GPS) data via Geographical Information System (GIS) to investigate thesinkhole phenomena (Figure 7).
Figure 7. The research approach
However, this paper focuses on the land subsidence detection procedure via rigorous analysisof GPS data, together with the initial results.
GPS
Geophysical instrument
Surface analysisLocation of sinkhole for deformation analysis and GISdatabase.
Underground analysisModeling the resistivity data in 1D, 2D and 3D –profile of cross section underground.

2. METHOD
The procedure for subsidence analysis between 2 epochs is illustrated in Figure 8. Data foreach epoch were imported into PINNACLE software for the computation of GPS baselinevectors (using precise ephemeris). The output from PINNACLE was exported into NGS BlueBook format, and used as input (via a special interface program CONVERT) for networkadjustment using STARNET V6 commercial software. Consequently, the results fromSTARNET V6 were used as input (via program CONVERT) for rigorous deformationanalysis using our in-house developed software (GPSAD2000). More details are discussed inHalim & Mohd Sharuddin (2002, 2003a, 2003b).
Figure 8. Data processing procedure
3. LAND SUBSIDENCE DETECTION
Two epochs of GPS data were collected from 4 stations (3 MASS stations (Figure 3, Figure20) and 1 object station (with HiPer GPS receiver) via static mode for 1-2 hours (Figure 9).The procedure for data processing is summarised in Figure 8. Table 1 shows the baselinedistances between stations.
Baseline (from to) DistanceFrom ToKTPK 5720930A_L9MO 157390.668mUSMP 5720930A_L9MO 131005.833mIPOH KTPK 169952.874mIPOH USMP 124701.065mKTPK USMP 288249.700m
Table 1. Baseline distance
GPS processing and baseline estimationEpoch 1 Epoch 2
STARNET V6 -Least squares adjustmentEpoch 1 Epoch 2
CONVERT Interface programEpoch 1 Epoch 2
Epoch 1 + Epoch 2
Deformation detection andvisualization analysis
Geographical InformationSystem (GIS) to investigate theland subsidence phenomena
GPSAD2000
CONVERT Interface program

3.1 GPS baseline processing
PINNACLE software (Figure 9) was used for GPS processing and baseline vectors estimationonly. The processing engine supports Stop-and-Go, Rapid Static, and Kinematic (with On-The-Fly ambiguity resolution) as well as classical Static survey. It can process anycombination of single and dual frequency GPS and GLONASS data. The least-squareprocessing of both static and kinematic data allows short occupation time and renders theprocessing insensitive to cycle slips because they are repaired very effectively. The programautomatically chooses the processing parameters for each session. This allows it to handlearbitrarily long occupations and long baselines (up to 1000 km and longer). PINNACLE hasthe capability to export the data in NGS Blue Book format. This format contains values ofGPS baseline vectors and covariances of each baseline (Topcon, 2004b).
Figure 9. PINNACLE software
3.2 CONVERT NGS Blue Book Format into STARNET format
PINNACLE exports the data in NGS Blue Book format. Unfortunately, this format is notsupported by STARNET software (Table 2). In this research, we developed a special interfaceprogram called CONVERT. Program CONVERT has two tasks (Figure 10 and Figure 21),conversion of input data (from NGS Blue Book format to STARNET format *.gps) andoutput data (from STARNET output *.dmp to GPSAD2000 format *.def).
3.3 Least Squares Adjustment with STARNET V6
STARNET V6 is a windows-based software package for rigorous simultaneous least squaresadjustment of 2D and 3D survey networks (Starplus, 2000). STARNET comes with thefollowing options: STARNET standard edition for 2D and 3D adjustments, STARNETProfessional edition for GPS adjustment processing using baseline vector, and STARNETLevel edition for 1D. In processing GPS baseline vectors, STARNET has the capability toimport several formats (Table 2). It is possible to process baseline using any GPS softwarewhich has the capability to export into the supported formats in Table 2.

Figure 10. CONVERT: NGS Blue Book to STARNET format
No Base line format Extension
1 Astech 0*.*2 Blue Book GFile *.ngs3 Geo Genius *.txt4 Leica *.asc5 NovAtel *.job6 Sercel *.phs7 Sokkia *.sgl8 Topcon *.ts9 Trimble Geomatic Office *.asc10 Trimble GPSurvey *.ssf, *.ssk11 Trimble TSC1 *.dc12 Waypoint *.exp
Table 2. GPS base line format for STARNET
When using STARNET V6 for deformation detection purposes, special setting is required inorder to extract the variance covariance and other relevant information in the dump file *.dmp(Halim & Mohd Sharuddin, 2003b).
The procedure for adjustment with STARNET is shown in Figure 11 to Figure 19. Initially,select Input > Data Files, and input 2 data files (i.e. provisional coordinates and GPS format*.gps that has been rearranged using CONVERT earlier) (Figure 11). Next, determine settingusing Options > Project: Adjustment (Figure 12), General (Figure 13), Instrument (Figure14), Listing file (Figure 15), Other file (Figure 16), Special (Figure 17) and GPS (Figure 18).
Figure 11. Input of GPS baseline vector and provisional coordinates
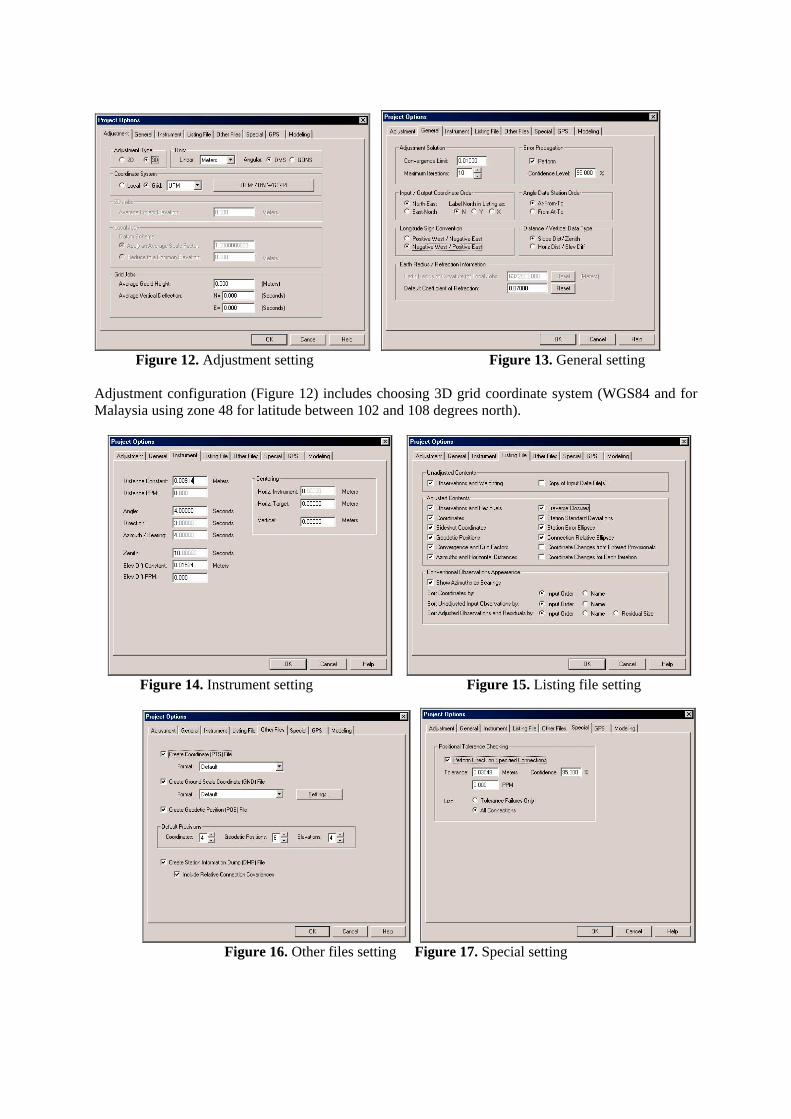
Figure 12. Adjustment setting Figure 13. General setting
Adjustment configuration (Figure 12) includes choosing 3D grid coordinate system (WGS84 and forMalaysia using zone 48 for latitude between 102 and 108 degrees north).
Figure 14. Instrument setting Figure 15. Listing file setting
Figure 16. Other files setting Figure 17. Special setting
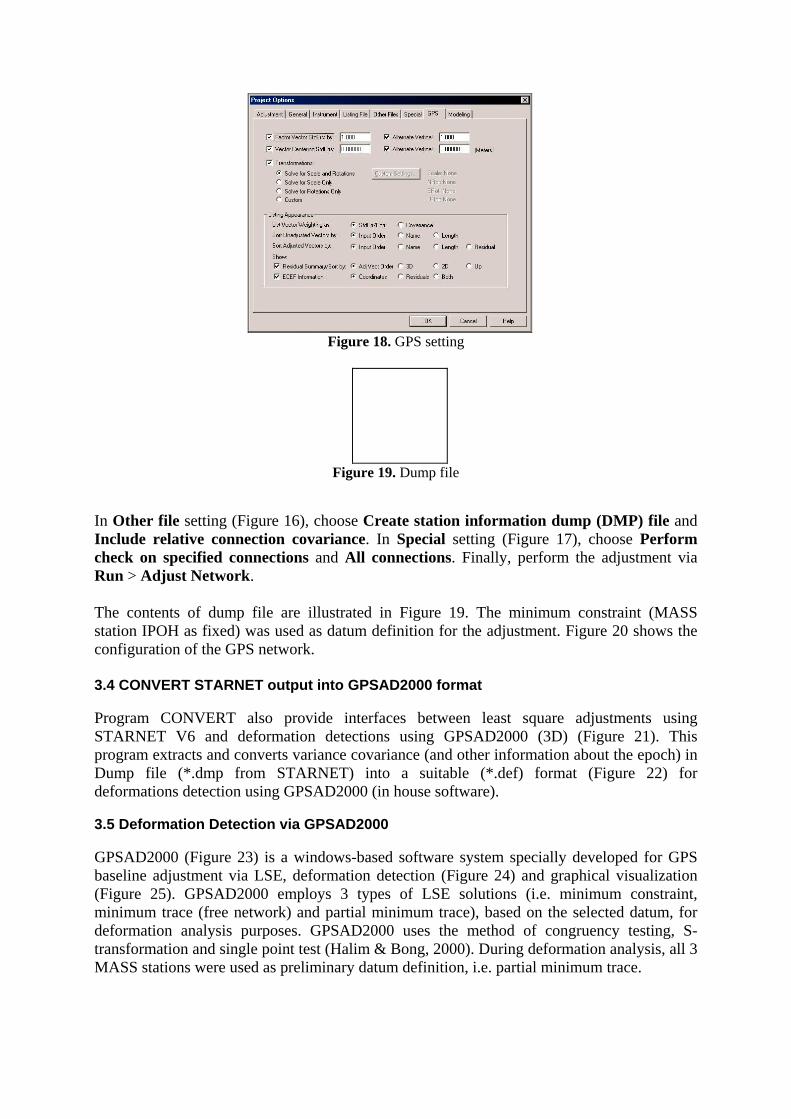
Figure 18. GPS setting
Figure 19. Dump file
In Other file setting (Figure 16), choose Create station information dump (DMP) file andInclude relative connection covariance. In Special setting (Figure 17), choose Performcheck on specified connections and All connections. Finally, perform the adjustment viaRun > Adjust Network.
The contents of dump file are illustrated in Figure 19. The minimum constraint (MASSstation IPOH as fixed) was used as datum definition for the adjustment. Figure 20 shows theconfiguration of the GPS network.
3.4 CONVERT STARNET output into GPSAD2000 format
Program CONVERT also provide interfaces between least square adjustments usingSTARNET V6 and deformation detections using GPSAD2000 (3D) (Figure 21). Thisprogram extracts and converts variance covariance (and other information about the epoch) inDump file (*.dmp from STARNET) into a suitable (*.def) format (Figure 22) fordeformations detection using GPSAD2000 (in house software).
3.5 Deformation Detection via GPSAD2000
GPSAD2000 (Figure 23) is a windows-based software system specially developed for GPSbaseline adjustment via LSE, deformation detection (Figure 24) and graphical visualization(Figure 25). GPSAD2000 employs 3 types of LSE solutions (i.e. minimum constraint,minimum trace (free network) and partial minimum trace), based on the selected datum, fordeformation analysis purposes. GPSAD2000 uses the method of congruency testing, S-transformation and single point test (Halim & Bong, 2000). During deformation analysis, all 3MASS stations were used as preliminary datum definition, i.e. partial minimum trace.
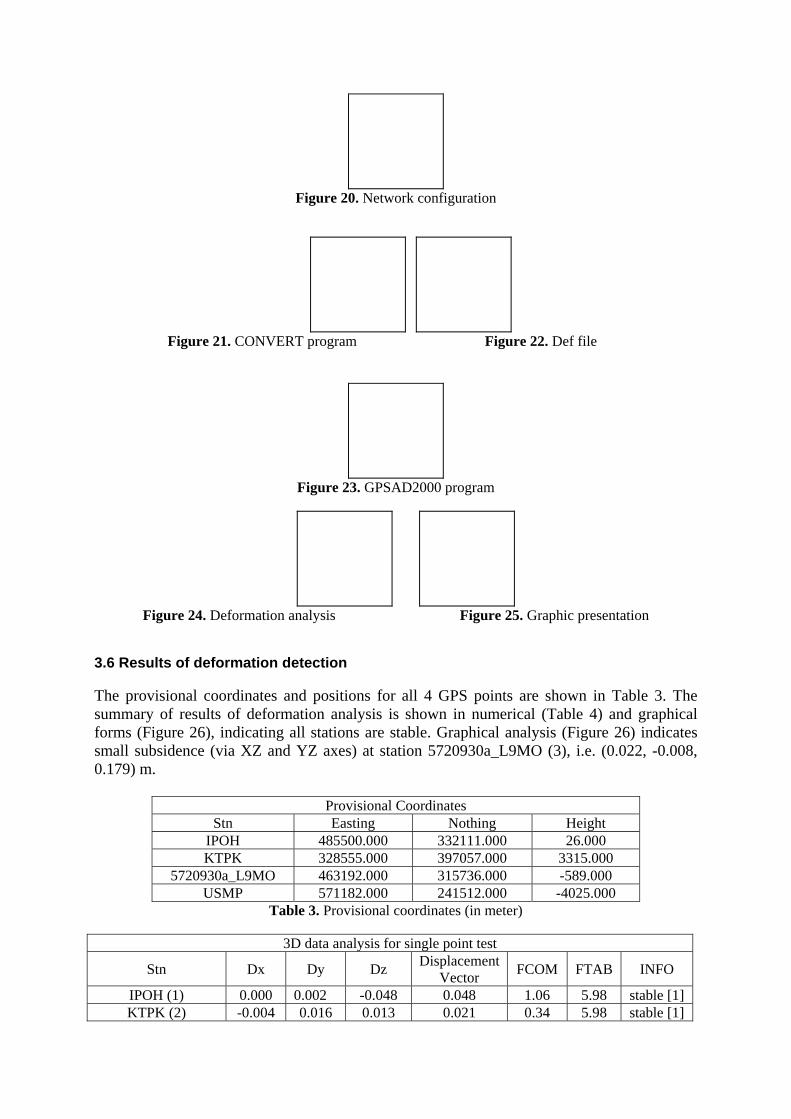
Figure 20. Network configuration
Figure 21. CONVERT program Figure 22. Def file
Figure 23. GPSAD2000 program
Figure 24. Deformation analysis Figure 25. Graphic presentation
3.6 Results of deformation detection
The provisional coordinates and positions for all 4 GPS points are shown in Table 3. Thesummary of results of deformation analysis is shown in numerical (Table 4) and graphicalforms (Figure 26), indicating all stations are stable. Graphical analysis (Figure 26) indicatessmall subsidence (via XZ and YZ axes) at station 5720930a_L9MO (3), i.e. (0.022, -0.008,0.179) m.
Provisional CoordinatesStn Easting Nothing Height
IPOH 485500.000 332111.000 26.000KTPK 328555.000 397057.000 3315.000
5720930a_L9MO 463192.000 315736.000 -589.000USMP 571182.000 241512.000 -4025.000
Table 3. Provisional coordinates (in meter)
3D data analysis for single point test
Stn Dx Dy Dz DisplacementVector FCOM FTAB INFO
IPOH (1) 0.000 0.002 -0.048 0.048 1.06 5.98 stable [1]KTPK (2) -0.004 0.016 0.013 0.021 0.34 5.98 stable [1]

5720930a_L9MO(3)
-0.022 0.008 -0.179 0.181 4.59 5.98 stable [0]
USMP (4) 0.004 -0.018 0.035 0.039 1.04 5.98 stable [1]Table 4. Deformation analysis (in meter): numerical
4. GIS AND SINKHOLE MODELING
Figure 27 shows the integration of various data via GIS for sinkhole modelling, usingArcViewGIS and VISUAL BASIC. The geophysical and GPS data provide the stability statusof the sinkhole. The GIS (or topographical) data provides information in several layers (e.g.such as contour, land use, residential area, etc). All these data are imported into GIS databasefor further analysis (i.e. Buffering, Proximity, Visualization of DTM, Cross section, andMonitoring the movement of sinkhole) (Figure 28).
Figure 26. Deformation analysis: graphical
XY
Fi
5. CONCLUSIONS
This research attempts to cGeographical Informationpaper discusses the land show the practicality of CONVERT and GPSAD2investigate the land subsid
ACKNOWLEDGEMENTS: T
YZ
XZ
gure 27. GIS integration for sinkhole modelling
ombine geophysical and Global Positioning System (GPS) data via System (GIS) to investigate the land subsidence phenomena. Thissubsidence detection procedure via rigorous analysis. The resultsthe data processing procedure using PINNACLE, STARNET,
000. Integration of various data via GIS provides a practical tool toence phenomena.
his research is sponsored by IRPA vote 74148.

Figure 28. GIS database
REFERENCES
Abem (2004),’Tutorial on resistivity”, http://www.abem.com
Halim Setan & Bong Chin Nyet (2000). “GPSAD2000, A software system for GPS baselineadjustment, deformation detection and visualization analysis”. 4th Asia Structural Engineering &Construction Conference (APSEC 2000), Kuala Lumpur, 13-15 September.
Halim Setan & Mohd Sharuddin Ibrahim (2002), “Deformation Detection Using STARNET andDEFORM”. Geoinformation Symposium 2002, Penang, Malaysia.
Halim Setan & Mohd Sharuddin Ibrahim (2003a), “An Interface Program For Deformation DetectionUsing STARNET”. International Geoinformation Symposium 2003, Kuala Lumpur, Malaysia. 22-24 October.
Halim Setan & Mohd Sharuddin Ibrahim (2003b), “Procedure for Deformation Detection UsingSTARNET”. 11th International Symposium on Deformation Measurement, 25-28 May 2003,Greece.
JUPEM(2004). http://www.geodesi.jupem.gov.my/mass.htm
Starplus Software,Inc (2000b). “STARNET-Pro V6 least squares Survey Adjustment Program.Reference Manual”.
Topcon (2004a). http://www.topconca.com/gps.html
Topcon (2004b). http://www.topconpositioning.comwww.topcongps.com/software/pinnacle.html
USGS (2004). http://water.usgs.gov/ogw/karst/kig2002/rco_field.html