initial analysis on the mitigation p forestry sector
TRANSCRIPT

INITIAL ANALYSIS ON THE MITIGATION POTENTIAL IN THE FORESTRY SECTOR
Prepared for the UNFCCC Secretariat Prepared by Jürgen Blaser Carmenza Robledo
Intercooperation, Bern 1. August, 2007

The document contains the authors’ views and does not necessarily represent those of the UNFCCC Secretariat or of any specific Party of the UNFCCC

Content Introduction................................................................................................................................. 5 1. REDD: Minimum Investments required for reducing GHG Emissions from Deforestation and Forest Degradation by 2030 ............................................................................................... 5
1.1. Main findings................................................................................................................ 7 1.2. Calculation and its rational .......................................................................................... 8
1.2.1. General explanation of the variables ................................................................... 8 1.2.2. Global estimates................................................................................................. 11 1.2.3. Estimates per region .......................................................................................... 13
I. Eastern and Southern Africa.................................................................................. 14 II. Northern Dry Africa ................................................................................................ 15 III. Western and Central Africa................................................................................ 16 V. Central America and Mexico.............................................................................. 18 VI. South America.................................................................................................... 19 VII. Other countries................................................................................................... 20
2. Forest Management.......................................................................................................... 21 2.1. What would it cost to bring tropical production forests under (sustainable forest management, in costs per ha) in the year 2030? ................................................................ 21 2.2. What is the additional C-sequestration potential of forest management?................ 21
3. Forest Restoration ............................................................................................................ 25 4. Afforestation/Reforestation ................................................Error! Bookmark not defined. 5. References........................................................................................................................ 26


Introduction The task given the UNFCCC Secretariat to the consultants on July 27 by was to estimate the potential and cost requirements for mitigation options to offset current level of emissions from the forestry sector in 2030 i.e. 5,8 GtCO2. The work was conducted between July 27 and August 1, 2007. In this document three out of the four mitigation options in forestry were considered (see graphic 1):
- Reducing emissions from deforestation and forest degradation - Forest management - Forest restoration
Afforestation and reforestation as the only eligible mitigation option has not been tackled in this report (see report of Evelyne Trines)1. The following graphic summarizes the conceptual approach proposed by the consultants to tackle GHG mitigation options in forestry. Only A/R CDM is an eligible option in the Kyoto Protocol, other options are put forward for consideration for a post 2012-regime.
Forest Degradation Process DeforestationDevegetation
Graphic 1: Mitigation opportunities in the forestry sectorGraphic 1: Mitigation opportunities in the forestry sector
------ Sustainable use of existing forest:àEmission reduction: Considered in REDD
------ Sustainable use of existing forest:àEmission reduction: Considered in REDD
------ Forest Restoration and Rehabilitation: àEmission reduction + carbon sequestration. Not considered yet
------ Plantations & Agroforestry: àCarbon sequestration: Included in A/R CDM
Initial carbon stocks
Closed forest Production forest Degraded forest Non-forest
1. REDD: M INIMUM INVESTMENTS REQUIRED FOR REDUCING GHG EMISSIONS FROM DEFORESTATION AND FOREST DEGRADATION BY 2030
The present chapter contains an approach to estimate the potential and cost requirements with regard to reducing emissions from deforestation and forest degradation (REDD) as one of the three main mitigation options in the forestry sector. For a complete understanding of the potential of the entire sector, this document should be read in combination with the specific comments provided by the authors on the dialogue paper. 1 Elements that could not been taken into account for the present report but that are also of importance in the overall context of mitigation options in forests are: how to treat reduced impact logging? How to treat “pioneer agroforestry”? How to treat synergies between REDD and adaptation?

This chapter presents an attempt to calculate the lowest investment flows that will be required to reduce emissions from deforestation and forest degradation by 2030. The general approach was to clarify how much money will be needed to compensate the loss if DD (Degradation and Deforestation) do not happen (the opportunity cost), considering the major direct drivers in the most important regions where REDD can be applied as a future mitigation option. The first section summarizes the main findings. The second section presents the rational used in the calculation and the corresponding tables. Final results depend completely of the assumptions and default values presented in the rational. This rational can be refined at a later stage, if required. For a full understanding of the chapter the following considerations should be borne in mind:
§ Only compensation prices for the opportunity cost of direct drivers of DD have been calculated and no investment or maintenance costs of alternative land-use have been taken into consideration. Most importantly, the figures proposed in this document cannot be understood as expressing the FULL cost of reducing emissions from deforestation and/or forest degradation. The reason is that the effective cost of this reductions will be highly affected by future UNFCCC decisions on REDD in the post 2012 regime. As this regime and its implementation arrangements have not yet been defined, a realistic calculation of the full costs of REDD can not be done at the moment. Once an agreement is found in the COP administrative and transaction costs for REDD will need to be calculated.
§ Data of benefits per direct driver are based on FAO data, ITTO data, scientific
literature; project work and expert judgement (see section two for detailed references). The estimates are based on business as usual under the current development scenario and market values up to the year 2030. Dollar figures are in today’s real prices in US$ (data base allowed assessments between 2000 and 2005). Figures are based on one year, time horizon 2005-2030 (25 years).
§ Recurrent benefits are estimated on an annual basis over a time span of 25 years,
keeping actual prices. In the case of logging and NTFP gathering, the calculation is done, considering a single or repeated interventions (increasing degradation), distributed over 25 years.
§ The minimum investment flow required for reducing emissions from deforestation
and forest degradation is equal to the opportunity cost of converting forest into other land uses.
§ The rate of deforestation used here is 12.9 million hectares per year (according to
FAO 2006), which is the total of net loss of forests of those countries that have a negative forest area dynamic (see also explanation in section 2). Other figures on DD are also those published in FRA (Forest Resource Assessment carried 2005, FAO 2006).
§ The data on carbon per hectare is based on Marklund and Schoene (2006). They
used the basic data of FRA 2005. § Emissions from deforestation in the 1990s are 5.8 GtCO2/yr as estimated in the
IPCC, AR4 (AR4 WGIII-Mitigation to Climate Change, 2007) § Deforestation and forest degradation are relevant in particular for tropical and
subtropical non-Annex I countries. For this reason Annex I countries will not be

estimated in detail in the calculations presented in REDD. Data for these countries are presented in table 8 “other countries” using average values.
1.1. Main findings The following are the main findings according to the calculations made by the authors: § If emissions from deforestation and forest degradation are to be reduced to zero by
2030 a minimum investment of 12. 2 billion US$2 per year would be necessary to compensate the opportunity costs of DD.
§ An average price of 2.8 US$/tCO2 will cover the opportunity cost of DD of 8.5 million
of ha yearly. This would represent a emission reduction of ~GtC 3.76 tCO2/year (65% of the emissions). For this scenario the price of 2.80 US$/tCO2 will also allow to improve livelihood conditions in many regions. Such an improvement depends on various factors:
o the administration and transaction costs of REDD activities o the specific conditions of each region (socio-economic, institutional, access to
infrastructure etc.). A more detailed analysis is recommended to analyse the impacts of different carbon prices on the development path of each region.
§ If using this average price then investments of 10.4 billion US$ yearly will be
needed.3 According to the analysis, this average price will be higher than the opportunity costs of the following DD drivers: cattle ranching (large scale), small scale agriculture/ shifting cultivation, fuelwood and NTFP gathering and fuel-wood/charcoal (traded).
§ Costs of REDD will depend not only on the opportunity cost of converting or
degrading forests, but also on the requirements of the REDD-activity in a future climate regime. As this regime has not been agreed yet, presenting an estimation on full costs of REDD, (including administrative costs, costs for monitoring, etc) seem to be premature.
§ Opportunity costs vary significantly among regions (even among countries) and over
time. Underlying drivers for deforestation (e.g. structural changes in land tenure or in agricultural or forest policies) also have a great impact on opportunity costs. The figures presented here can therefore only be understood as indicative.
§ The potential for REDD needs to be understood as complementary to the other
mitigation alternatives in forestry, mainly afforestation and reforestation and forest management. Furthermore, it will be highly relevant to include the sequestration potential of forest restoration in a future mitigation regime. Activities in agroforestry and bio-energy although considered in other sectors (i.e. agriculture and energy) have considerable implications on forest dependent livelihood and in the overall forestry sector. The relationship among these activities and the overall forest sector still need to be analysed in detail
§ In some cases, deforestation will convert forest into another use with a high content
of living biomass (e.g. conversion in palm oil, rubber, pulp, cocoa plantations, or
2 1 Billion USD = 1000 Million USD 3 Considering C content in forest as 449 tCO2/ha as an average for the calculation
woody bioenergy plantations). This kind of deforestation has, however, a high impact on biodiversity conservation and on livelihoods. However, from the perspective of the GHG emissions this deforestation can be partially neutralised through the sequestration effect in the plantation.
1.2. Calculation and its rational This section presents all the estimates per region and at the global level, as well as the rationale and explanation for each single table. The purpose is to make the method of calculation fully transparent to facilitate any future discussion on these figures.
1.2.1. General explanation of the variables Seven variables were included:
1. Categories of direct deforestation and degradation drivers 2. Estimate of the share of deforestation/degradation driver 3. Total areas of DD in Million ha 4. Estimate of benefits from land-use change/degradation per main direct DD driver 5. Lowest investment required to compensate the opportunity costs (in Million US$ per
year) 6. Lowest C compensation prices per tCO2 per year 7. Lowest C compensation prices per tC per year
The text below explains the rational used in determining or calculating the values of each variable. For the regional tables an additional explanation of variables 2 and 4 is included. 1 Categories of direct deforestation and degradation drivers Opportunity costs are defined for the three major direct drivers of DD as follows:
o Commercial Agriculture (national and international markets)
§ Commercial crops § Cattle ranging (large scale)
o Subsistence farming § Small scale agriculture/shifting cultivation/swidden agriculture § Fuel-wood and NTFP gathering for local use, mostly family based
o Wood extraction § Commercial (legal and illegal) for national and international markets § Traded fuel-wood (commercial at sub-national and national level)
It is understood that deforestation usually results from a combination of factors; direct and underlying causes of DD interact in complex and variable ways. To simplify the calculations in this exercise, however, the separation of the main direct drivers seems to be the most appropriate approach. Infrastructure development (e.g. roads, dams), urban development and mining have not been listed. Mining is also a direct driver, but generally limited in area and locality specific. Emissions by fire (without conversion) have not been considered in the calculations. 2 Estimate of the share of deforestation/degradation driver Estimates are based on the fact that there are different direct drivers for DD in each country where DD occurs. The different drivers have different underlying causes; nevertheless there are general patterns that remain more or less similar in all regions. Commercial agriculture is

more important in regions where investment capital is relatively readily available (e.g. Latin America, certain SE-Asian countries). Commercial livestock ranching is more widespread in Latin and Central America, while it is not practiced at a similar scale in SE Asia. Subsistence farming, which includes small-scale farming and livestock breading of settlers at the forest fringes, shifting cultivation and swidden agriculture occurs in all the tropical regions, forest-rich and forest-poor; its relative importance in all the regions is closely linked with the increasing population and macro-economic characteristics in a given country. This kind of farming leads to a permanent or time bound land-use change while the category titled “fuelwood and NTFP gathering” can lead to carbon stock loss through gradual forest degradation. Wood extraction occurs in all the regions, forest-rich and forest-poor, however timber (including commercial logging) is of importance only in forest-rich countries. Unsustainable wood extraction (which is the general case in all tropical regions) leads to forest degradation, and is also an underlying cause for deforestation. SE-Asia, which has the most timber-rich forests, is more prone to carbon stock loss through timber extraction than Africa and tropical America. Commercial fuelwood is a phenomenon in many smaller, forest-poor countries with rapid development of urban centres. All these characteristics have been taken into account when estimating the share of each driver. The estimates made in the tables below are based on ITTO (2006); Forner et al (2006); Kaimowitz and Angelsen (2001); Moutinho and Schwartzman (2005); Chomitz and Kumari (1998); Chomitz, K. (2006) and Geist and Lambin (2002) and expert judgement. 3 Total areas of DD in Million ha The data used are those from the Forest Resource Assessment 2005 - FRA 2005 (FAO 2006). The total net change in forest area in the period 2000–2005 is estimated at -7.3 million hectares per year. Compared to the 1990s, the current annual net loss is 18 percent lower and equals a loss of 0.18 percent of the remaining forest area each year during this period. For the FRA 2005 assessment, countries were not requested to provide information on each of the four components of net change, as most countries do not have such information. This, however, makes estimation of the deforestation rate difficult and no attempt has been made to do so at the country level. Rather, an estimate of the global deforestation rate has been made as follows: The total net loss for countries with a negative change in forest area was 13.1 million hectares per year for 1990–2000 and 12.9 million hectares per year for 2000–2005. This would indicate that annual deforestation rates were at least at this level. Taking these considerations into account the global deforestation rate was estimated at 12.9 million hectares per year during the period 1990–2005, with few signs of a significant decrease over time. Consequently, the hectare figure of DD by main direct driver has been based on the 12.9 million ha figure, as a conservative approach. 4 Estimate of benefits from land-use change/degradation per main direct DD driver The USD figures have been estimated as follows: § For commercial agriculture: Benefits are estimated based on the commercial value as
product harvested multiplied by an average market value. Calculation basis where average yield as average market price assessments for the main crops in each region. Main source was FAOSTAT for Agriculture and Nutrition, but also other sources have been taken into account (UNCTAD, base calculations for the Stern Report by Grieg-Gran, M. (2006) and other sources. The dollar figure indicated is the average price of the main or the three main commercially traded crops per region.

§ For subsistence farming: benefits are calculated using an average amount of product harvested multiplied by a shadow value in form of the price in the inland market. This is based on work of bilateral development agencies, principally SDC and DfID. This was not possible to do in detail for all the regions. Estimation figures were therefore also based on general poverty assessment figures taking as a reference value 1 USD per day. The average size of a forest fringe farming is estimated generally to 1.5 ha. (Millenium Ecosystem Assessment Report 2005).
§ Wood extraction: Commercial benefits are calculated as wood harvested multiplied by
an average market price. Degradation patterns (mainly wood extraction) have been calculated on yield loss over a 25 years period of time. E.g. unsustainable extraction in a given forest (in two interventions) can be 80 m3/ha average price of a cubic meter of timber 200 USD, occurring over 25 years: (80x200) / 25 = 640 USD. Data basis: ITTO Market News Bulletin (www.itto.or.jp), FAO Forest Stat.; ITTO (2006).
5. Lowest investment required to compensate the opportunity costs
(in Million USD per year) In the regional tables this variable was estimated for each driver as the result of multiplying the area of deforestation per driver (3) by the benefits per ha (4). This determines the income that won’t be received if this area is not deforested/degraded (opportunity cost per drivers in each region). For the global estimates this variable was calculated adding the regional values per driver as estimated in tables 2 – 8.
6. Lowest C compensation prices per tCO2 per year This variable was calculated dividing the total benefits per year (all regions) of each driver by a constant value of tCO2/ha. The constant value of tCO2/ha (315 tCO2/ha) is based on FAO data for above and below ground biomass only as a conservative approach. This figure is calculated as the average of the figures indicated for Western and Central Africa, Eastern and Southern Africa, South East Asia, East Asia, Caribbean and Central America and South America as presented by Marklund and Schoene (2006). This approach facilitates also monitoring C over time with a higher certainty.
7. Lowest C compensation prices per tC per year This variable was calculated dividing the total benefits per year (all regions) of each driver by a constant value of tC/ha. The constant value of tC/ha (86 tCO2/ha) is based on FAO data for above and below ground biomass only as a conservative approach. This figure is calculated as the average of the figures indicated for Western and Central Africa, Eastern and Southern Africa, South East Asia, East Asia, Caribbean and Central America and South America as presented by Marklund and Schoene (2006). This approach facilitates also monitoring C over time with a higher certainty.
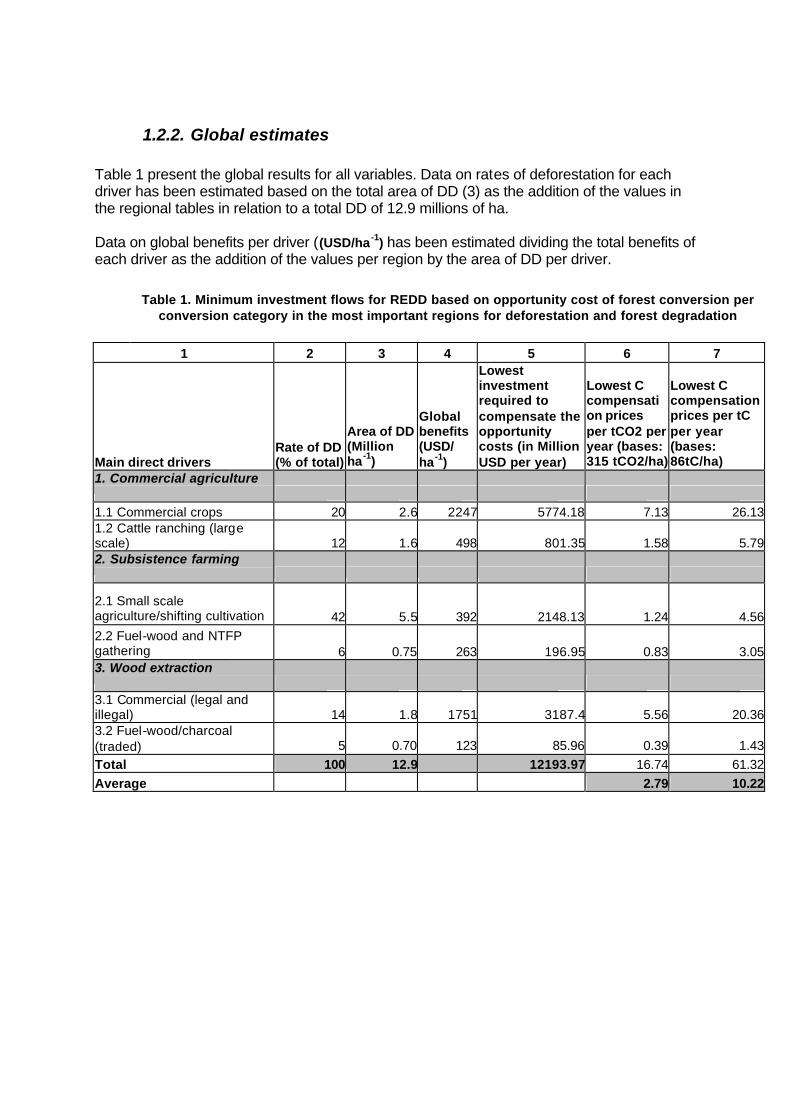
1.2.2. Global estimates Table 1 present the global results for all variables. Data on rates of deforestation for each driver has been estimated based on the total area of DD (3) as the addition of the values in the regional tables in relation to a total DD of 12.9 millions of ha. Data on global benefits per driver ((USD/ha -1) has been estimated dividing the total benefits of each driver as the addition of the values per region by the area of DD per driver.
Table 1. Minimum investment flows for REDD based on opportunity cost of forest conversion per
conversion category in the most important regions for deforestation and forest degradation
1 2 3 4 5 6 7
Main direct drivers Rate of DD (% of total)
Area of DD (Million ha -1)
Global benefits (USD/ ha -1)
Lowest investment required to compensate the opportunity costs (in Million USD per year)
Lowest C compensation prices per tCO2 per year (bases: 315 tCO2/ha)
Lowest C compensation prices per tC per year (bases: 86tC/ha)
1. Commercial agriculture 1.1 Commercial crops 20 2.6 2247 5774.18 7.13 26.131.2 Cattle ranching (large scale) 12 1.6 498 801.35 1.58 5.792. Subsistence farming
2.1 Small scale agriculture/shifting cultivation 42 5.5 392 2148.13 1.24 4.562.2 Fuel-wood and NTFP gathering 6 0.75 263 196.95 0.83 3.053. Wood extraction 3.1 Commercial (legal and illegal) 14 1.8 1751 3187.4 5.56 20.363.2 Fuel-wood/charcoal (traded) 5 0.70 123 85.96 0.39 1.43Total 100 12.9 12193.97 16.74 61.32Average 2.79 10.22

Table 1b: GHG emissions reductions per scenario
Region DD Reduced (million of ha -1)
Carbon factor (tCO2/ha)
Total reduction per region (in GtCO2/year)
Scenario 1: zero emissions by 2030 Eastern and Souther Africa 1,7 292,8 0,50 Northen Dry Africa 0,98 120,78 0,12 Western and Central Africa 1,36 724,68 0,99 South SE Asia and Pacific 3,21 442,86 1,42 Central America and Mexico 0,55 563,64 0,31 South America 4,25 512,4 2,18 Other regions 0,86 329,4 0,28
Total 12,9 5,79 Scenario 2: emission reduction to be expected at a carbon price of USD 2.8 tCO2 Eastern and Souther Africa 1,28 292,8 0,37 Northen Dry Africa 0,8 120,78 0,10 Western and Central Africa 0,88 724,68 0,64 South SE Asia and Pacific 1,64 442,86 0,73 Central America and Mexico 0,44 563,64 0,25 South America 2,89 512,4 1,48 Other regions 0,6 329,4 0,20
Total 8,53 3,76 Table 1b shows the proportion of emission reductions that can be expected yearly and per regions. Carbon factors were calculated for all carbon pools excluding COS from data provided by Marklund and Schoener, 2006.

1.2.3. Estimates per region
Social-economic conditions, agricultural land-use and forest use are different region by region and country by country. Global estimates alone will not suffice and a country-by-country analysis is not a feasible approach at this moment, nevertheless needed for future, more in-depth analysis4. For the present analysis, the six regions that are net forest carbon emitters have been considered according to FRA 2005. The figures correspond to the net loss of forest (in thousand of hectares) for countries with a negative change in forest area according to FRA 2005. Since this change takes into account afforestation and natural forest increase in each of the countries in the region, the absolute deforestation area might be even higher. However, the fact that in many countries there is no full assessment available on the fate of deforested areas (some of them might naturally grow back into forests through secondary succession immediately after clearing), the proposed figure can be assessed as relatively solid. The regions considered in the calculations are:
Regions Area of DD(‘000 ha) § Eastern and Southern Africa 1702 § Northern Africa (Dry Africa) 982 § Western and Central Africa 1356 § South, SE Asia and Pacific 3207 § Central America and Mexico 545 § South America, tropical and subtropical 4251 § Other countries outside the regions 857 Total of all regions considered 12,900 Total DD in the six tropical regions assessed 12,043
4 Some pilot projects on REDD have been initiated in various developing countries and will produce relevant information in a short period of time

I. Eastern and Southern Africa5 The estimates for Eastern and Southern Africa are presented in table 2 Table 2. Minimum investment flows for REDD based on opportunity cost of forest conversion per
conversion category in Eastern and Southern Africa
1 2 3 4 5
Main direct drivers (1) Share of total DD
Area of DD (Million ha)
Benefits (USD/ha -1)
Lowest investment required to compensate the opportunity costs (in Million USD per year)
1. Commercial agriculture 1.1 Commercial crops 0.2 0.34 1670 567.801.2 Cattle ranching (large scale) 0.1 0.17 330 56.102. Subsistence farming 2.1 Small scale agriculture/shifting cultivation 0.5 0.85 350 297.502.2 Fuel-wood and NTFP gathering 0.05 0.09 250 21.253. Wood extraction
3.1 Commercial (legal and illegal) 0.05 0.09 640 54.40
3.2 Fuel-wood/charcoal (traded) 0.1 0.17 160 27.20Total 1 1.7 1024.25 Data in table 2 was estimated based on the remarks in Box 1:
Box 1: Remarks in regard to table 2: Eastern and Southern Africa
% of total DD Benefits (USD/ha -1) Main direct drivers Remarks Value Remarks Value
1. Commercial Agriculture
1.1 Commercial crops
Variety of situations due to different climatic and socio-economic conditions. Most of the countries forest-poor, deforestation mostly on heavily degraded forest land 20
Commodity prices of a variety of commodities, including cotton, pulp, tobacco, sugar cane, sweet potato, cassava. Compiled from FAOSTAT, highest prices taken
1670
1.2 Cattle ranching (large scale)
Only in few countries of relative importance 10
Bovine meat data, compiled from FAOSAT
330
2. Subsistance farming
2.1 Small scale agriculture/shifting cultivation
Heavy population pressure on remaining forests due to poverty
50
Expert judgment, based on project work and shadow pricing, 1 USD per day
350
2.2 Fuel-wood and NTFP gathering
Fuelwood is the most important energy source, NTFPs additional income source 5
Based on shadow prices for charcoal fuelwood, medicinal plants and other NTFPs
250
3. Wood extraction
3.1 Commercial non-sustainable (legal and illegal)
A region with few commercial timber harvesting and relatively low value timber stocks
5
30 m3 valued 200 USD, and service wood of undefined quantify, all mainly local markets (expert judgment)
640
3.2 Fuelwood/Charcoal (traded)
Commercial fuelwood market mostly informal 10
Basis: 100 m3 x 2 over 25 years, 20 USD per m3 (FAOFORSTAT)
160
5 In this region mining is an important driver of deforestation, thought not very important in total area, but through its indirect impacts. However, as mining has not been considered in this calculations, the data of mining as driver in easttern and southern Africa has been included in the other drivers

II. Northern Dry Africa
The estimates for Northern Dry Africa are presented in table 3. Table 3. Minimum investment flows for REDD based on opportunity cost of forest conversion
according to the direct drivers in Northern Dry Africa
1 2 3 4 5
Main direct drivers Share of total DD
Area of DD (Million ha)
Benefits (USD/ha -1)
Lowest investment required to compensate the opportunity costs (in Million USD per year)
1. Commercial agriculture
1.1 Commercial crops 0.15 0.15 1540 226.38
1.2 Cattle ranching (large scale) 0.3 0.29 330 97.022. Subsistence farming
2.1 Small scale agriculture/shifting cultivation 0.3 0.29 350 102.902.2 Fuel-wood and NTFP gathering 0.12 0.12 280 32.933. Wood extraction
3.1 Commercial (legal and illegal) 0.03 0.03 400 11.76
3.2 Fuel-wood/charcoal (traded) 0.1 0.10 65 6.37Total 1 0.98 477.36 Data in table 3 was estimated based on the remarks in Box 2:
Box 2. Remarks in regard to table 3: Northern Dry Africa
Share of total DD Benefits (USD/ha -1) Main direct drivers
Remarks Value (%)
Remarks Value
1. Commercial Agriculture
1.1 Commercial crops
Area where the main tropical cash crops are on their growth limit. Mainly cotton, in future maybe jatropha 15
Cotton, sorghum, groundnuts, medium prices, FAO AgriSTAT, highest prices chosen
1540
1.2 Cattle ranching (large scale) Traditional extensive livestock grazing over wide areas 30
Extensive, FAOSTAT 330
2. Subsistance farming 2.1 Small scale agriculture/shifting cultivation
Forest- fringe areas are the only interested areas for cultiviation 30
Same basis as for East Africa 350
2.2 Fuel-wood and NTFP gathering
Fuelwood main energy source, NTFP for fodder 12
Shadow prices for NTFP, in particular fodder and fuelwood
280
3. Wood extraction 3.1 Commercial non-sustainable (legal and illegal)
A region without major timber stocks 3
1 m3 per ha valued 350 USD and a certain amount of service wood
400
3.2 Fuelwood/Charcoal (traded) Commercial fuelwood market mostly informal 10
Basis: 40 m3 X 2 over 25 years, 20 USD per m3 (FAOFORSTAT)
65

III. Western and Central Africa The estimates for Western and Central Africa are presented in table 4.
Table 4. Minimum investment flows for REDD based on opportunity cost of forest conversion
according to the direct drivers in Western and Central Africa
1 1 3 4 5
Main direct drivers Share of total DD
Area of DD (Million ha)
Benefits (USD/ha -1)
Lowest investment required to compensa te the opportunity costs (in Million USD per year)
1. Commercial agriculture 1.1 Commercial crops 0.2 0.27 2125 578.001.2 Cattle ranching (large scale) 0.05 0.07 330 22.442. Subsistence farming 2.1 Small scale agriculture/shifting cultivation 0.5 0.68 450 306.002.2 Fuel-wood and NTFP gathering 0.05 0.07 250 17.003. Wood extraction 3.1 Commercial (legal and illegal) 0.15 0.20 1200 244.803.2 Fuel-wood/charcoal (traded) 0.05 0.07 100 6.80Total 1 1.36 1175.04 Data in table 4 was estimated based on the remarks in Box 3:
Box 3: Remarks in regard to table 4: Western and Central Africa
Share of total DD Benefits (USD/ha -1) Main direct drivers
Remarks Value (%)
Remarks Value
1. Commercial Agriculture
1.1 Commercial crops
Traditional expansion zone for commercial crops since colonial times; still forest land reserves available for expansion
20 Cocoa, palm oil, sugar cane, rubber, cassava and others, FAO AgriSTAT, medium of 3 highest priced crops chosen
2120
1.2 Cattle ranching (large scale)
In the more semi-arid areas with savannah like forest areas (carbon stock poor) 5
In selected countries and semi-arid areas, same figures as in table 2
330
2. Subsistance farming
2.1 Small scale agriculture/shifting cultivation
Pressure in forest-fringe areas high due to opening-up of closed forest areas by roads; pressure will increase over the next 25 years 50
Many of small- scale agriculture is market driven (source: Swiss funded project work and Grien-Gran (2006)
450
2.2 Fuelwood and NTFP gathering
NTFP gathering (including fauna and flora) of increasing importance 5
In particular charcoal and NTFP forest products harvesting; ITTO (2006)
250
3. Wood extraction
3.1 Commercial non-sustainable (legal and illegal)
Area with heavy pressure on unsustainable logging, increasing efforts on forest management 15
50 m3 in 2 intervals of forest degradation, 300 USD per m3
1200
3.2 Fuelwood/Charcoal (traded)
Charcoal becomes more and more a formal business on unsustainable basis 5
Basis: 100 m3 x 2 over 25 years, 12 USD per m3 (FAOFORSTAT)
100

IV. South, SE Asia and Pacific The estimates for South, SE Asia and Pacific are presented in table 5.
Table 5. Minimum investment flows for REDD based on opportunity cost of forest conversion according to the direct drivers in South, SE Asia and Pacific
1 2 3 4 5
Main direct drivers Share of total DD
Area of DD (Million ha)
Benefits (USD/ha -1)
Lowest investment required to compensate the opportunity costs (in Million USD per year)
1. Commercial agriculture 1.1 Commercial crops 0.24 0.77 2500 1926.001.2 Cattle ranching (large scale) 0.01 0.03 330 10.592. Subsistence farming 2.1 Small scale agriculture/shifting cultivation 0.4 1.28 525 674.102.2 Fuel-wood and NTFP gathering 0.05 0.16 300 48.153. Wood extraction 3.1 Commercial (legal and illegal) 0.25 0.80 2735 2194.843.2 Fuel-wood/charcoal (traded) 0.05 0.16 100 16.05Total 1 3.21 4869.73 Data in table 5 was estimated based on the remarks in Box 4:
Box 4: With regard to table 5: South, SE Asia and Pacific
Share of total DD Benefits (USD/ha -1) Main direct drivers Remarks Value Remarks Value
1. Commercial Agriculture (%)
1.1 Commercial crops
Commercial crop areas expanding due to high investment interests
24
Palm oil, soybean, rubber, pulp, cobra, groundnut, pineapple: medium of 3 highest priced crops chosen
2500
1.2 Cattle ranching (large scale)
Still marginal, but demand for land might increase considering the ever increasing demand for bovine meat in Asia 1
Figure estimate from a pantropical assessment (FAOSTAT, ILRI documentation)
330
2. Subsistance farming
2.1 Small scale agriculture/shifting cultivation
Different situations in the least development and more developed countries in Asia. High pressure on forest- fringe areas in Mekong region 40
A mix of small-scale agriculture with market access and shifting cultivation, basis: 1.5 USD income per day (CIFOR)
525
2.2 Fuel-wood and NTFP gathering
NTFP gathering of importance in some regions a a major degradation driver 5
Unsustainable high priced NTFP gathering as a main degradation driver in some regions (CIFOR)
300
3. Wood extraction
3.1 Commercial non-sustainable (legal and illegal)
The area where non-sustainable harvesting of wood can lead to important loss of carbon stocks (high % of commercially interesting timber species. Wood extraction is a main driver of DD 25
In many Asian countries highly stocked dipterocarp forests, high degradation potential with high market prices: 180 m3 x 2 per 190 USD , calculated over 25 years (ITTO 2006)
2735
3.2 Fuelwood/Charcoal (traded) Mainly in least development countries 5
As in table 4 100

V. Central America and Mexico The estimates for Central America and Mexico are presented in table 6.
Table 6. Minimum investment flows for REDD based on opportunity cost of forest conversion according to the direct drivers in Central America and Mexico
1 2 3 4 5
Main direct drivers Share of total DD
Area of DD (Million ha)
Benefits (USD/ha-1)
Lowest investment required to compensate the opportunity costs (in Million USD per year)
1. Commercial agriculture 1.1 Commercial crops 0.1 0.06 1900 104.501.2 Cattle ranching (large scale) 0.2 0.11 450 49.502. Subsistence farming 2.1 Small scale agriculture/shifting cultivation 0.45 0.25 350 86.632.2 Fuel-wood and NTFP gathering 0.1 0.06 250 13.753. Wood extraction 3.1 Commercial (legal and illegal) 0.1 0.06 960 52.803.2 Fuel-wood/charcoal (traded) 0.05 0.03 95 2.61Total 1 0.55 309.79 Data in table 6 was estimated based on the remarks in Box 5:
Box 5: With regard to table 6: Central America and Mexico
Share of total DD Benefits (USD/ha -1) Main direct drivers
Remarks Value (%)
Remarks Value
1. Commercial Agriculture
1.1 Commercial crops Limited expansion of commercial crops in forest-fringe areas 10
Banana, tree crops, sugar cane, palm oil, FAOSTAT
1900
1.2 Cattle ranching (large scale)
Traditionally a main DD driver, limited expansion possible if meat market increases as predicted 20
Based on a relative market price of 1.5 USD per kg; potentially higher valued than in South America
450
2. Subsistance farming
2.1 Small scale agriculture/shifting cultivation
Main driver in forest- fringe areas, but mainly in secondary forest zones 45
Based on the USD 1 per day income assessment on 1 ha of productive area
350
2.2 Fuel-wood and NTFP gathering
Fuelwood main energy source in rural areas 10
Shadow market price of fuelwood as basis for fuelwood gathering
250
3. Wood extraction 3.1 Commercial non-sustainable (legal and illegal)
In some of the countries also an underlying cause of deforestation 10
40 m3 in 2 intervals of forest degradation, 300 USD per m3
960
3.2 Fuelwood/Charcoal (traded)
Develops into a formal market in many of the countries 5
Basis: 80 m3 x 2 over 25 years, 15 USD per m3 (FAOFORSTAT)
95

VI. South America
The estimates for South America are presented in table 7.
Table 7. Minimum investment flows for REDD based on opportunity cost of forest conversion according to the direct drivers in South America
1 2 3 4 5
Main direct drivers Share of total DD
Area of DD (Million ha)
Benefits (USD/ha -1)
Lowest investment required to compensate the opportunity costs (in Million USD per year)
1. Commercial agriculture 1.1 Commercial crops 0.2 0.85 2400 2040.001.2 Cattle ranching (large scale) 0.2 0.85 620 527.002. Subsistence farming 2.1 Small scale agriculture/shifting cultivation 0.4 1.70 350 595.002.2 Fuel-wood and NTFP gathering 0.05 0.21 250 53.1253. Wood extraction 3.1 Commercial (legal and illegal) 0.12 0.51 980 499.803.2 Fuel-wood/charcoal (traded) 0.03 0.13 110 14.03Total 1 4.25 3728.95 Data in table 7 was estimated based on the remarks in Box 6:
Box 6: With regard to table 7: South America
Share of total DD Benefits (USD/ha -1) Main direct drivers
References Value (%)
References Value
1. Commercial Agriculture
1.1 Commercial crops
In some of the countries high potential for capita l intensive conversion 20
Soy bean, palm oil, pulp 2400
1.2 Cattle ranching (large scale)
Was a main driver in the past, might become important in the forest- fringe regions if global meat demand increase as predicted 20
Difficult to estimate dollar figures for extensive cattle ranching (estimates vary between 10 and 660 USD)
620
2. Subsistance farming
2.1 Small scale agriculture/shifting cultivation
Colonialization of forest-fringe areas still a major driver of DD
40
Based on the USD 1 per day income assessment on 1 ha of productive area
350
2.2 Fuel-wood and NTFP gathering
NTFP gathering might increase over time as degradation driver 5
Shadow market price of fuelwood as basis for fuelwood gathering
250
3. Wood extraction
3.1 Commercial non-sustainable (legal and illegal)
With more access to forest, there is a considerable higher potential for degradation of carbon stock loss in future 12
35 m3 in 2 intervals of forest degradation, 250 USD per m3
980
3.2 Fuelwood/Charcoal (traded)
Potential to grow into formal markets (bioenergy) 3
Basis: 90 m3 x 2 over 25 years, 15 USD per m3 (FAOFORSTAT)
110
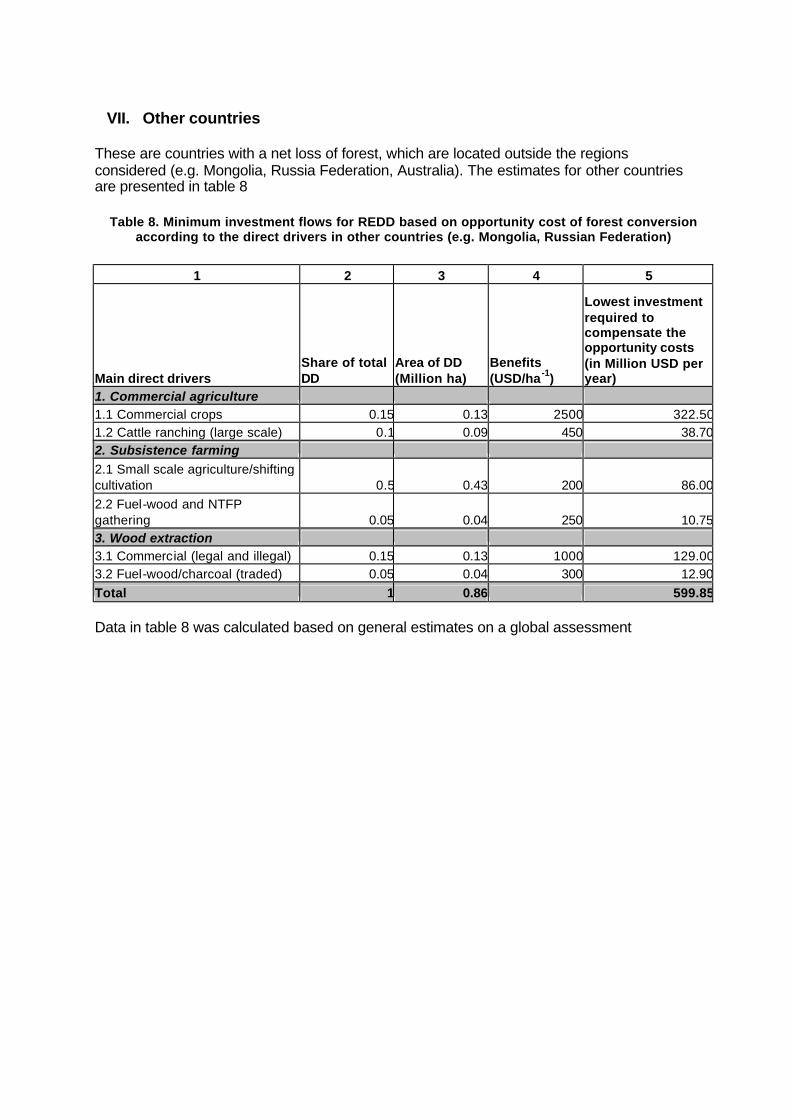
VII. Other countries
These are countries with a net loss of forest, which are located outside the regions considered (e.g. Mongolia, Russia Federation, Australia). The estimates for other countries are presented in table 8
Table 8. Minimum investment flows for REDD based on opportunity cost of forest conversion according to the direct drivers in other countries (e.g. Mongolia, Russian Federation)
1 2 3 4 5
Main direct drivers Share of total DD
Area of DD (Million ha)
Benefits (USD/ha -1)
Lowest investment required to compensate the opportunity costs (in Million USD per year)
1. Commercial agriculture 1.1 Commercial crops 0.15 0.13 2500 322.501.2 Cattle ranching (large scale) 0.1 0.09 450 38.702. Subsistence farming 2.1 Small scale agriculture/shifting cultivation 0.5 0.43 200 86.002.2 Fuel-wood and NTFP gathering 0.05 0.04 250 10.753. Wood extraction 3.1 Commercial (legal and illegal) 0.15 0.13 1000 129.003.2 Fuel-wood/charcoal (traded) 0.05 0.04 300 12.90Total 1 0.86 599.85 Data in table 8 was calculated based on general estimates on a global assessment

2. FOREST MANAGEMENT
2.1. What would it cost to bring tropical production forests under (sustainable forest management, in costs per ha) in the year 2030?
The basic assumption is that the production forest area remains the same as today in the year 2030. The basis for the cost estimates is the ITTO Expert panel report on estimating the costs to achieve the ITTO Year 2000 Objective on Sustainable Forest Management (can be obtained in ITTO, www.itto.or.jp) ; this report was produced in 1995, based on a analysis using Criteria and Indicators for SFM. The report estimated the costs for all tropical production forests in ITTO member countries (about 350 million ha), to US$ 6.25. Considering present values 2007 (5% devaluation factor), this would correspond to about 12 US$ per ha. That figure is used to estimate the costs to bring tropical production forests under SFM by the year 2030. For non-annex tropical and subtropical countries, the cost estimate for achieving (sustainable) forest management would therefore be around 7.3 billion US$. For developing, non-annex 1 countries with temperate and boreal forests that have potential to increase carbon stocks through forest management, the amount of 20 US$ per ha as indicated by Whiteman (cited in TRINES might be appropriate. An additional 1 billion US$ can be estimated as cost of forest management for these countries.
2.2. What is the additional C-sequestration potential of forest management?
Global forest vegetation stores 283 GtC in its biomass and an additional 39 GtC as deadwood, for a total of 322 GtC. Total carbon content of forest including soils to a depth of 1 m is 798 GtC (FAO 2006 figures, in FRA 2005). Unsustainable forest management degrades living biomass and reduces the carbon stocks in forests. Sustainable forest management (SFM) keeps carbon stocks at an optimal level and uses at an optimum the elastic capacity of a given forest ecosystem. The elastic capacity describes the dynamic forest processes within a range of changing vertical forest structure, species composition, biodiversity, carbon stocks and productivity normally associated with the natural forest type expected at a given site. Under managed forests we understand here that a natural forest that is managed for sustainable timber and non-wood harvesting (e.g. through integrated harvesting and silvicultural treatments), wildlife management and other uses have resulted in changes of forest structure and species composition. All major goods and service functions, including the maintenance of carbon stocks, are maintained intact. Through sustainable forest management, additional carbon sequestration can be reached, first through planned silvicultural management, based on optimization of yield and increase of faster growing, light demanding species. Forest restoration is another very important carbon sequestration strategy that could be addressed through forest management, but also through REDD (see main document on Forest Management, sent 1.8.2007). In addition forest management can reduce GHG emissions through reduced impact logging and other measures, including improvements in transport. We estimate here only the sequestration potential that comes from the optimization of the elastic capacity of a given forest ecosystem. Basis is an increased growth (in m3) of timber per region. Each forest ecosystem has its own growth characteristics. Estimates per region
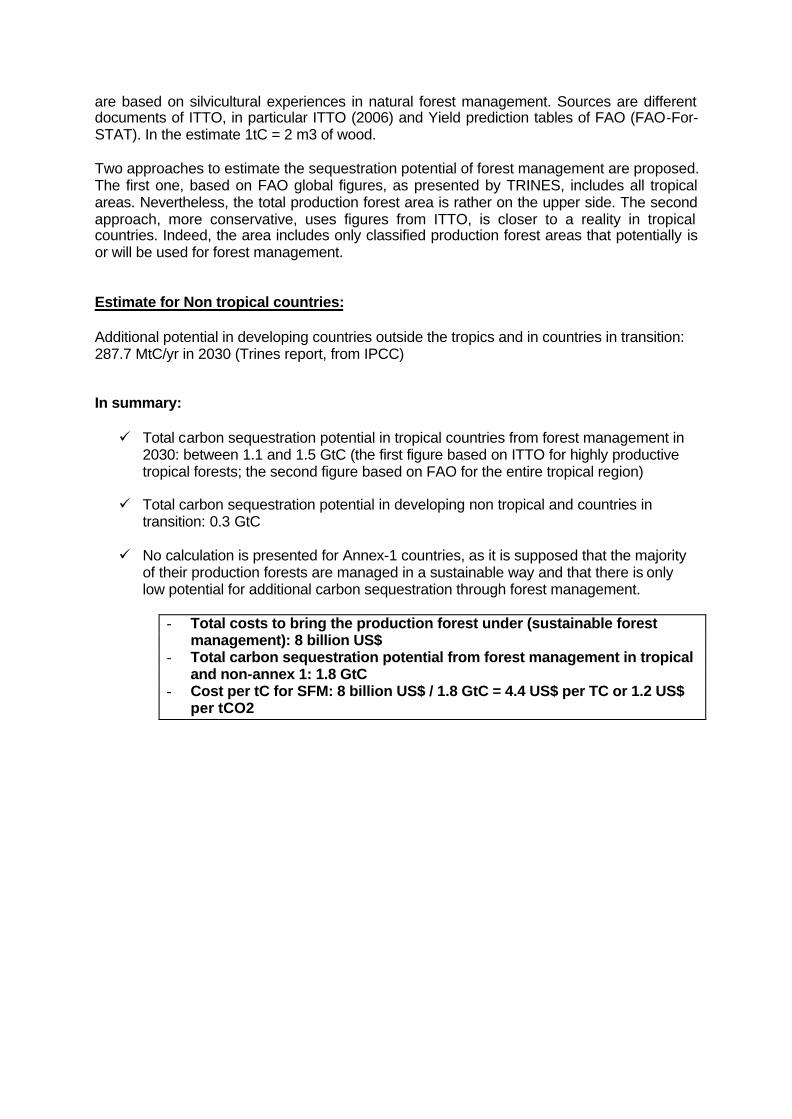
are based on silvicultural experiences in natural forest management. Sources are different documents of ITTO, in particular ITTO (2006) and Yield prediction tables of FAO (FAO-For-STAT). In the estimate 1tC = 2 m3 of wood. Two approaches to estimate the sequestration potential of forest management are proposed. The first one, based on FAO global figures, as presented by TRINES, includes all tropical areas. Nevertheless, the total production forest area is rather on the upper side. The second approach, more conservative, uses figures from ITTO, is closer to a reality in tropical countries. Indeed, the area includes only classified production forest areas that potentially is or will be used for forest management. Estimate for Non tropical countries: Additional potential in developing countries outside the tropics and in countries in transition: 287.7 MtC/yr in 2030 (Trines report, from IPCC)
In summary: ü Total carbon sequestration potential in tropical countries from forest management in
2030: between 1.1 and 1.5 GtC (the first figure based on ITTO for highly productive tropical forests; the second figure based on FAO for the entire tropical region)
ü Total carbon sequestration potential in developing non tropical and countries in
transition: 0.3 GtC ü No calculation is presented for Annex-1 countries, as it is supposed that the majority
of their production forests are managed in a sustainable way and that there is only low potential for additional carbon sequestration through forest management.
- Total costs to bring the production forest under (sustainable forest
management): 8 billion US$ - Total carbon sequestration potential from forest management in tropical
and non-annex 1: 1.8 GtC - Cost per tC for SFM: 8 billion US$ / 1.8 GtC = 4.4 US$ per TC or 1.2 US$
per tCO2

- 23 -
Table 9: Approach 1: Proposed summary of production forests (source for production forest areas FAO 2006, extract from Trines report, 2007)
Area of production
forest (x1000 ha)
Cost estimate for SFM
(US$ per ha)
Global estimate of carbon in biomass
(tC per ha)*
Forest managed area at a 25-years rotation basis
2005-2030 (‘000 ha)
Additional annual growth
potential through SFM (m3 per ha
and yr)
Increased sequestration potential per ha through
FM*** tC
C additional sequestration
potential in the year
2030 (Mt C)
Total Eastern and Southern Africa
43,948 527 million 63.5 1.758 2.8 1.4 62
Total Northern Africa 46,129 554 million 26.0 1.845 0.5 0.25 12 Total Western and Central Africa
123,912 1487 million 155.0 4.956 5.8 2.9 359
Total East Asia 125,369 1505 million 37.3 5.015 3.5 1.75 219 Total South and Southeast Asia
120,046 1440 million 77.0 4.802 7 3.5 420
Total Caribbean, Central America & Mexico
46,645 560 million
119.4 1.866 6 3
140 Total South America 96,459 1158 million 110.0 3.858 5.5 2.75 265 Tropics
602,185 7231
million 84 24.100 4.4 2.2
1477 *Source: Marklund and Schoene, 2006 ***: Expert estimation on the basis of ITTO, 2006 and FAO, 2006.
Table 10: Approach 2: Table using figures of production forests (only natural forests) from ITTO (ITTO 2006)** Total area of
production forests (only natural forests)
Area with Forest Management Plans
Additional costs to bring the production forest under SFM by 2030*
tC of additional sequestration of C through SFM
C additional sequestration potential in the
year 2030

- 24 -
(‘000 ha)
(‘000 ha) (‘000 USD) (tC per year) (Gt C in 2030)
Africa 70.461 10.016 845.000 2.9 0.20 Asia and Pacific 97.377 55.060 1.169.000 3.5 0.34 Tropical America
184.727 31.174 2.217.000 2.875 0.53
TOTAL 352.565 96.250 4.232.000 1.08 * Based on 12 USD per ha (ITTO Expert Panel report 1995, in today’s value) ** 33 tropical timber producing countries, covering about 90% of the humid tropical forest area

- 25 -
3. FOREST RESTORATION What is missing in the actually discussed approaches in forest and climate mitigation is the entire field of restoration, which is indeed probably the most promising option in forestry for restoring carbon stocks. Restoration is a combination of planting trees and human induced natural regeneration within a degraded forest area6 but that has lost most of its carbon stock. Forest restoration hence is a strategy applied in degraded primary forest areas. Forest restoration aims to enhance and accelerate natural processes of forest regeneration (including carbon stocks) in order to regain the elastic capacity of the forest ecosystem. Forest Restoration is an issue in ALL non-annex 1 countries where REDD is also considered. Forest restoration potential: about 850 million ha (see table below). § Considering an average carbon stock of 30 t C/ha in living carbon pools (above and below
ground biomass) in degraded forests this would total to 25 Gt of carbon pantropical § Fully stocked, these 850 million ha would amount to 57 GtC § Hence the maximum potential to restore carbon stocks from forest restoration would amount
to 32 GtC § Taking a price of USD of 12 per t of carbon, as today paid by CDM A/R, there would be an
additional potential of about USD 38 billion which has not been included in the A/R CDM for the first commitment period. Nevertheless, this activity should be considered for a post-2012 forest mitigation regime.
Table 11:Estimated Extent of Degraded Forest Landscapes by Category in Tropical Asia, Tropical America and Tropical Africa (million ha) in Year 2000*. ASIA
17 COUNTRIES
TROP. AMERICA 23
COUNTRIES
AFRICA 37
COUNTRIES
TOTAL
Degraded primary and secondary forest
145 180 175 500
Degraded forest land 125 155 70 350 Total 270 335 245 850 Source: Blaser and Sabogal (2002): ITTO Guidelines for Forest Restoration and Secondary Forest Management *Authors’ estimates. Based on FAO (1982, 1990, 1995, 2001); Sips (1997); Wadsworth (1997); WRI-World Bank (2000). In tropical America, about 38 million ha are classified as secondary forests (second-growth forests). For the other regions it is not possible to distinguish between degraded primary forests and secondary forests Forest restoration can be included as a separate activity or integrated in REDD. In the present document we include forest degradation in analysing the opportunity cost in REDD. It means that the potential emission reduction was considering in this first chapter. The tables presented in this third chapter refer to the sequestration potential of restoration activities. To understand this difference and to consequently promote restoration as a sequestration activity will promote a more effective mitigation path while improvement of livelihood and conservation of biological diversity. Linking REDD, A/R, Forest Restoration and Forest Management is indeed the most promising strategy to address the forest mitigation option! 6 Forest degradation: The reduction of the capacity of a forest to produce goods and services. ‘Capacity’ includes the maintenance of ecosystem structure, functions and carbon stocks

- 26 -
References Achard, F., Belward, A.S., Eva, H.D., Federici, S. Mollicone, D. and Raes, F. 2005. Accounting for avoided conversion of intact and non-intact forest; technical options and a proposal for a policy tool. EU Joint Research Council, presented at COP11, Montreal, Dec 1. Achard, F., H.D. Eva, H.J. Stibig, P. Mayaux., J. Gallego, T. Richards, and J.P. Malingreau. 2002. Determination of deforestation rates of the world’s humid tropical forests. Science 297: 999-1002. Angelsen and Kaimowitz. 2001. Agricultural Technologies and Tropical Deforestation. CABI publishing. Walling ford, UK. The book presents a thorough revision of the link between deforestation and agricutlural technologies in several regions of the world Chomitz, K.; K. Kumari. 1998. The Domestic Benefits of Tropical Forests: A Critical Review. World Bank Res Obs.1998; 13: 13-35. Chomitz, K. 2006. At Loggerheads? Agricultural Expansion, Poverty Reduction and Evnironment in the Tropical Forests. World Bank Policy Research Report, in preparation. Contreras-Hermosilla (2000). The underlying causes of deforestation. Center for International Forestry Research, Ocasional Paper No. 30. Bogor, Indonesia. Defries, R.S Houghton, R.A., Hansen, M.C., Field, C.B., Skole, D., Townshend, J., 2002. Carbon Emissions from tropical deforestation and regrowth based on satellite observations for the 1980s and 1990s. Proceedings of the National Academy of Sciences 99, 14256-114261. DeFries, R., F. Achard, S. Brown, M. Herold. 2006. Reducing greenhouse gas emissions from deforestation in developing countries: considerations for monitoring and measuring. Outcome of GOFC-GOLD workshop on monitoring tropical deforestation for compensated reductions, 21st – 22nd March 2006. DRAFT 17pp. Geist, H. and E. Lambin. 2002. Proximate causes and underlying driving forces of tropical deforestation. BioScience. Vol. 52 No. 2 143-150. FAO, 2004. “Global Forest Resources Assessment Update 2005. Terms and Definitions. (Final version)”. http://www.fao.org/forestry/site/fra2005-terms/en/ FAO 2006. Global Forest Resource Assessment 2005: Progress toward sustainable forest management. FAO Forestry Paper 147. FAO, Rome FAOSTAT, http://faostat.fao.org/default.aspx Fearnside, P. and Laurence W. 2004. Tropical Deforestation and Greenhouse-Gas Emissions. Ecological Applications, 14 (4) 982-986 Fearnside, Ph. 2000. Global warming and tropical land-use change: Greenhouse gas emissions from biomass burning, decomposition and soils in forest conversion, shifting cultivation and secondary vegetation. Climatc Change, 46: 115-158. Forner, C., J. Blaser, F. Jotzo, C. Robledo. 2006. Keeping the forest for the climate’s sake: avoiding deforestation in developing countries under the UNFCCC. Climate Policy 6, 2006. Frey, E. 2002. Tropical deforestation in the Amazon: An Economic Analysis of Rodonia, Brazil. Issues in Political Economy. Vol 11

- 27 -
Grieg-Gran, M. 2006. The Cost of Avoiding Deforestation – Report prepared for the Stern Review of the Economics of Climate Change. International Institute for Environment and Development. London. 18 pages. Grieg-Gran, M. 2006b. Is deforestation a cost-effective mitigation approach? Published by the International Institute for Environment and Development. London IPCC 2003a. Good Practice Guidance for Land Use, Land-Use Change and Forestry, IGES, Hayama, Japan. www.ipcc-nggip.iges.or.jp/public/gpglulucf/gpglulucf.htm IPCC 2007 Climate Change 2007: The physical Science Basis. Contribution of Working Group I to the Fourth Assessment Report of theIntergovernmental Panel on Climate Change. Summary for Policymakers.. IPCC 2007b Climate Change 2007: Climate change impacts, adaptation and vulnerability. Contribution of Working Group II to the Fourth Assesment Report of the Intergovernmental Panel on Climate Change. Summary for Policymakers. IPCC 2007c Climate Change 2007: Mitigation options. Contribution of Working Group III to the Fourth Assesment Report of the Intergovernmental Panel on Climate Change. Chapter 9 – Forestry. Final draft IPCC, 2003. Definitions and methodological options to inventory emissions from human-induced degradation of forest and devegetation of other vegetation types [Penman, J.; M. Gytarsky, T. Hiraishi, T. Krug, D. Krugger, R. Pipatti, L. Buendia, K. Miwa, T. Ngara, K. Tanabe, and F. Wagner (eds)]. IGES. Kanagawa, Japan. IPCC, 2000, Land Use, Land use change, and forestry. A special report of the IPCC. (Watson, R.T., Noble, I.R., Bolin, B., Ravindranath; N. H., Verardo; D. and D. J. Docken (eds)). Cambridge Univesity Press, Cambrigde, United Kingdom and New York, N.Y. USA, 881 pp. IPCC, 2001: “Third Assessment Report of the Intergovernmental Panel on Climate Change [Houghton, J.T., Y. Ding, D.J. Griggs, M. Nouguer, P.J. van der Linden, X. Dai, K. Maskell, and C.a. Johnson (eds)]. Cambridge University Press, Cambridge, United Kingdom and New Your, USA. ITTO, 2006. Status of Tropical Forest Management 2005. ITTO Technical Series No. 24. Yokohama. Japan. Kaimowitz, D and A. Angelsen. 1999. The World Bank and Non-Forest Sector Policies that Affect Forests. Background Paper for the World Bank’s Forest Policy and Strategy. Center for International Forest Research, Bogor, Indonesia. Marklund, L. and D. Schoene, 2006. “Global Assessment of Growing Stock, Biomass and Carbon Sotck”. Forest Resources Assessment Programme Working paper 106/E. Rome 2006 Millennium Ecosystem Assessment, 2005. http://www.millenniumassessment.org/en/Global.aspx Moutinho, P and S. Schwartzam (eds). 2005. Tropical Deforestation and Climate Change. Instituto de Pesquisa Ambiental da Amazônia; Washington DC: Environmental Defense. Mollicone, D.; F. Achard, S. Federici, E. Hugh, G. Grassi, A. Belward, F. Raes, G. Seufert, H. Stibling, G. Mattteucci, E. Schulze. 2006. An incentive mechanism for reducing emissions from conversión of intact and non-intact forest. Climatic Change DOI 10.1007/s10584-006-9231-2 Robledo, C.; Masera, O. (2007). Developments in UNFCCC/IPCC discussions regarding reducing emissions from forest degradation and deforestation and implications for tropical forests and

- 28 -
tropical timber producers. Presented at the XLII Session of the International Tropical Timber Council. Paper No. 9. Port Moresby, Papua New Guinea. Sanitlli, M., Moutinho, P., Schwartzman, S., Nepstad, D., Curran, L. Nobre, C. 2005. Tropical deforestation and the Kyoto Protocol: An editorial essay. Climate Change 71 pp 267-276 Reprinted in Mouthinho, P. and Schwartzman, S. (2005) Tropical Deforestation and Climate Change Belem Brazil: Instituto de Pesquisa Ambiental da Amazonia and Environmental Defense Santilli, M. (2003) Compesated reduction of deforestation. Presented at COP9, Milan Sathaye, J.A., Makundi, W, Dale, L and Chan, P. Accepted in print 2007. GHG Mitigation Potential, Costs and Benefits in Global Forests: A Dynamic Partial Equilibrium Approach. Energy Journal, accepted in Print. Scherr, S; A. Khare and A. White, 2003: “Current status and future potential of markets for ecosystem services of tropical forest”. Report prepared for ITTO. Forest Trends, Washington. Soares-Filho, B.S., D.C. Nepstad, L.M. Curran, G.C. Cerqueira, R.A. Garcia, C.A. Ramos, E. Voll, A. McDonald, P. Lefebvre and P. Schlesinger, 2006. Modelling conservation in the Amazon basin. Nature 440, 520-523. Sohngen B., and R. Beach. 2006. Avoided deforestation as a greenhouse gas Mitigation tool: Economics Issues for considerations. Sohngen, B. and R. Sedjo, 2006. Carbon sequestration costs in global forests. Energy Journal Special Issue Sohngen, B., R. Mendelsohn, R. Sedjo. 1998. The effect of climate on global timber markets. http://www-agecon.ag.ohio-state.edu/people/sohngen.1/forests/globcc.pdf Stern, N. 2006. The Economics of Climate Chang. Stern Report. Cambridge University Press, Cambridge, United Kingdom and New York, NY, USA . 712 p Tavoni, M., B. Sohngen, V. Bosseti. 2006 Forestry and the carbon market response to stabilize climate. http://ideas.repec.org/p/fem/femwpa/2007.15.html Trines, E., Hohne, N., Jung, M., Skutsch, M.,Petsonk A., Silva-Chavez, G., Smith P., Nabuurs Gert-Jan., Verweij, P., Schlamadinger B (2006). Integrating agriculture, forestry and other land use in future climate regimes. Climate change. Scientific assessment and policy analysis . Report 500102002. UNFCCC 2006b. Background paper for the workshop on reducing emissions from deforestation in developing countries. Working paper No.1 (a) (2006). http://unfccc.int/files/methods_and_science/lulucf/application/pdf/part_i_scientific_issues.pdf UNFCCC 2006c. Report of the Subsidiary Body for Scientific and Technological Advice on its twenty-fifth session, held at Nairobi from 6 to 14 November 2006. FCCC/SBSTA/2006/11 http://unfccc.int/resource/docs/2006/sbsta/eng/11.pdf UNFCCC 2006d. Report of COP serving as the meeting of the Parties to the Kyoto Protocol on its first session, held at Montreal from 28 November to 10 December 2005. Add Part two. Action taken by the COP serving as the meeting of the Parties to the Kyoto Protocol t its first session. FCCC/KP/CMP/2005/8/Add.3 http://unfccc.int/resource/docs/2005/cmp1/eng/08a03.pdf#page=3 UNFCCC, 2001. “Marrakech Accords ”, FCCC/CP/2001/13/.

- 29 -
UNFCCC, 2002: COP 8 report and Delhi Declaration, FCCC/CP/2002 UNFCCC, 2003. „Estimation, reporting and accounting of harvested wood products“. FCCC/TP/2003/7 UNFCCC, 2004: COP 9 Report, FCCC/CP/2003/6 UNFCC, 2006. Background paper for the workshop on reducing emissions from deforestation in developing countries. Working Paper 1 by Secretariat. Workshop on REDD. .