inierouice i v civilian radioactive waste management system
TRANSCRIPT

inierouice ~ummmipuvisuu'T Civilian Radioactive Waste Management System I V Wr
Management & Operating Contractor TRW Environmental
Safety Systems Inc.
QA: N/A
Subject: Date: From:
Planning Guidance for EBS May 7, 1999 J.H. Pye
Test Number 3-Drip Shield LV.EBSPM.JHP.05/99-005
Test.
To: cc: Location/Phone
Distribution See Below Sum 1/423 (702) 295-4250
This is a revision of IOC LV.EBSPM.JHP.04/99-004.
This guidance is issued in response to the License Application Design Selection (LADS)
recommendation that the Enhanced Design Alternative 2 (EDA 2) be selected as the License Application
(LA) baseline design for the repository. This option deploys a drip shield and diffusion limiting invert
comprised of gravel fill as apart of the Engineered Barrier System (EBS).
This guidance is intended as a supplement to the Engineered Barrier Systems Test Plan. entitled
"Engineering Plan: Evaluation of Alternative Design Features Engineered Barrier Systems, BBOOOOOO0
01717-4600-00001, Rev 01 A, January 20, 1999". Specifically this guidance is to provide sufficient
direction for the design of the EBS Test H 3 to assess the performance of the drip shield as a means to
prevent water from contacting the simulated waste packages. Conceptual engineering sketches show
how the 2-cm. thick drip shield could be installed in the emplacement drifts are presented in Figure I
and 2.
The primary objectives of the EBS Pilot Scale Test H 3 are to demonstrate, at approximately ¼ scale, the
movement of the moisture (water dripping from the crown of the emplacement drift) in the EBS system.
For this test, the EBS system is defined as the supports for the simulated waste package, the drip shield,
the invert material, and the tunnel walls. The EBS Test H 3 will be performed in the EBS Pilot Scale Test
Facility located in the North Las Vegas DOE complex on Losse Road.
General guidance for conduct of this test is as follow:
A. Test Set Up
An existing Pilot Scale Test Cell will be used for this test. This test cell is fabricated from mild
carbon steel. It has nominal dimensions of 1.4-m diameter and 4-m in length. The cell is predrilled
wirh holes for instrumentation access, water injection ports and wicks to remove water.

L V.Lbý)tL.Jtt~Ufd) vav 7. 1999
Page 2
° Modify test cell as needed by either plugging some of the predrilled holes or drilling additional holes
for removing moisture or for installingt instruments.
, 240 V power will be required for the heaters.
° The invert will be formed from the crushed welded tuff from the Yucca Mountain ECRB excavation.
The particle size for the invert material will have size range from 0.01 87-0.0787 in (material retained
on the sieve #4 and passing through the sieve 10). "* J-13 water from the Yucca Mountain will be used for irrigation. Approximately 500 gallons of J-13
water will be required for the test. "* The simulated waste package will be fabricated from mild carbon steel to a dimension of nominally
39.1-cm (1/4 scale of the 21 PWR waste packages). The pedestal for the simulated waste will be also
fabricated from mild carbon steel and welded in place with a V-shaped support. The base of the V
support will be nominally 21 cm from the bottom of the inner surface of the test cell.
* The simulated drip shield will be constructed from ANSI 304 stainless steel, which has a thermal
conductivity similar to titanium grade 7. The simulated drip shield will be fabricated in three
sections with sleds on each side at the bottom. The segment seam covers will be fabricated from 304
stainless steel and placed over the adjacent drip shield segments. It may be necessary to weld the
seam cover segments to either end of the drip shield segment or slide it over the adjacent section of
the drip shield. "* The final test configuration will be based on a V1 scale dimensional analysis and pretest predictive
modeling. Where necessary simplifying assumptions will be made and documented by Sandia
National Laboratories (Sandia). "• Lawrence Livermore National Laboratory (LLNL) will provide/install 36 metal coupons on the
surface of the simulated waste package and the drip shield. The metal coupons will be installed in
groups of 4 at three different locations along the length of the drip shield. The test coupons will be
installed so that there- is no galvanic coupling with other components of the test apparatus. This can
be accomplished by using electrically insulating washer and sleeves.
"* The coupons will be fabricated by LLNL from Alloy 22, a Ni-Cr-Mo alloy; Ti-Gr 16, a Ti-0.05
Pd alloy, and A516 GR 70, carbon steel. The test coupons will be approximately 5 cm x 5 cm
0. 16 cm thick. * Water samples will be collected by the Test Coordination Office (TCO) from the injection tanks and
the water exiting from the test cell according to the QA procedures listed in the Field Work Package
(FWP). LLNL will analyze the samples and provide information to the test participants.
* LLNL and Los Alamos National Laboratory (LANL), in coordination with the TCO, will also take,
aseptically collected. Chemical samples for microbial activity within the test cell from the invert
material before and after the test in accordance with the applicable QA procedures listed in the FWP.
* Collect five samples of the invert material prior to the start of the test.
* Twenty-five samples, in triplicate. of the invert material are to be collected at the end of the test.

May 7. 1999 Pagle 3
The collected invert material samples will be from the surface of the invert material and approximately 15 cm. below the surface. The samples will be collected from outside boundary of the drip shield. Samples are to be collected from at least five locations below the entire length of the drip shield and from at least five locations from the invert material exposed to the dripping water along the length of the test cell.
"• The collected samples will be placed in double ziplock bags and immediately placed on dry ice and transferred to a -70-C. freezer for further analysis by LANL.
"* The sample size for each of the invert material sample will be approximately 100 gin. "* The sample size of each water sample will be about 10 ml. * The chemistry of water and the invert materials will be determined by LLNL. * USGS will provide the hydrologic properties of the invert materials before and after the test. * UFA Ventures, Inc. will provide the laboratory derived diffusion coefficient for the invert material
on samples provided to the UF A Ventures Inc. by the USGS.
B. Test Conditions
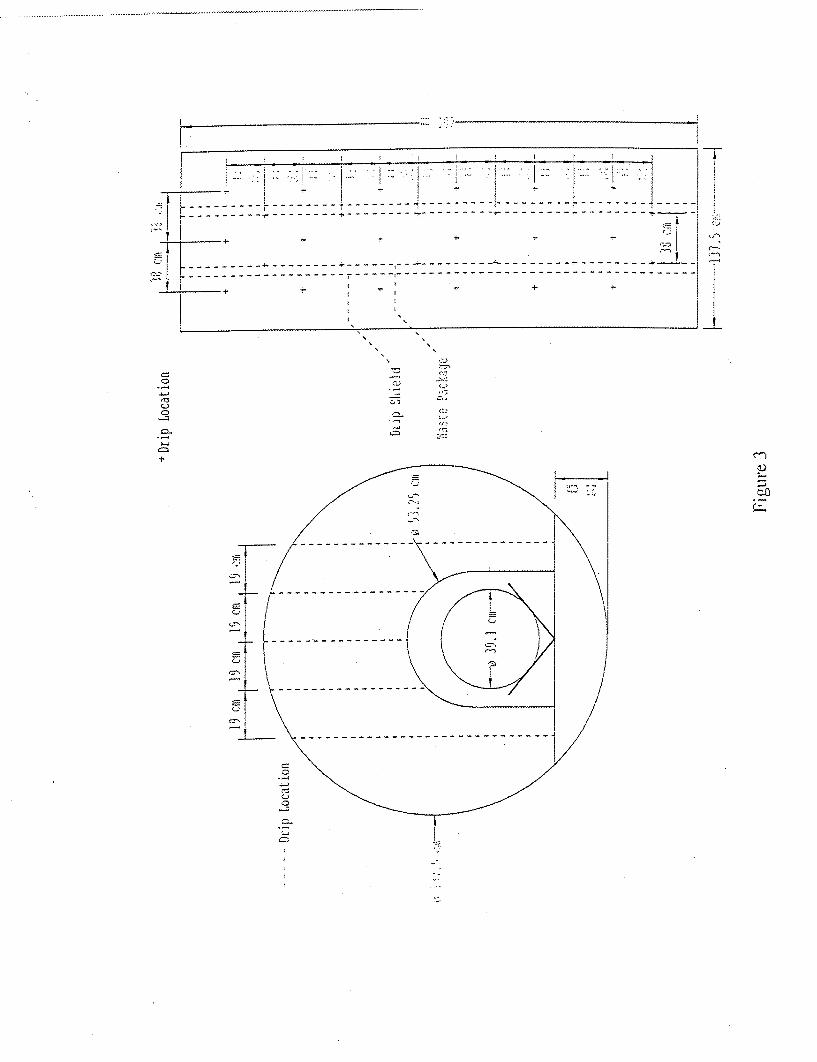
"* The water will be injected on a rectilinear grid covering both waste package and invert, nominal pattern as shown in Figure 3. The configuration of the simulated drip shield and the waste package is presented in Figure 4.
"• The Heating system in the simulated waste package will be capable of raising the simulated waste package to a temperature of 100°C and the test cell canister boundary heaters will be capable of raising the test cell boundary wall temperature to 60'C.
"* The test cell will be insulated to minimize the effects of outside temperature changes on the test. "* As tracer FD&C Blue 1 food color or equivalent will be used in the injected water. This dye is
commercially known as Brilliant Blue FCF, Acid Blue 9. * The water injection rate will be nominally 250 mI/r/n of the length of the test cell. * Initial moisture content of the invert material will be determined by the USGS from the samples
collected as the invert material is placed in the test cell after it has been air-dried. • Sandia will perform the pre and post test analysis of the test. * Camera runs, sampling and observations guidance shall be revised, as necessary, to reflect test
activities for this test as compared to the earlier pilot scale tests performed in the Atlas facility (Test # 1 and 2).
C. Conduct of Test
The EBS Test #3 heating system(s) and heating/irrigation schedule is a very complex issue. Very preliminary analyses by Sandia suggest that large temperature gradients will be present within the
canister if only a single line heat source located within the simulated waste package is used. These calculations showed that with a simulated waste package temperature of 80 degrees C, the drip shield would be at 70 degrees C and the outer canister would be at 45 dicgrees C. The gradient of 35 degrees C
I ........... - -- ...........

Ntvav 7, 1999 Page 4
exceeds by 15 degrees from the target temperature gradient. Therefore. the boundary heaters will be
installed to the outside wall of the test cell to maintain a temperature gradient of approximately 20
degrees C.
The EBS Test #3 will be conducted in two Parts. Part lof the test will evaluate the thermal influence of
the drip shield in the ¼ scale configuration without irrigation. Part 2 of the test will evaluate the
Performance of the drip shield system at elevated temperature.
C. 1 - EBS Test #3-Part 1- Evaluate the Thermal Influence of the Drip Shield
Construct the test with a subset of the instrumentation, Figures 5-9, necessary for the EBS Test #3-Part
This part of the test will primarily concentrate on the thermal instrumentation (RTD's) placed on the
midpoint centerline configuration (Y=2m), Figures 10-14. Both sets of the heaters and controllers will
also be installed. The drip shield and associated instrumentation will not be installed during this portion
of the test. The test will follow the same heating schedule as for the Part 2 of the test as described in
C.2.
"* Initiate Q data collection. "* Set system temperature on both inside and outside to nominally 60'C.
"- Let system come to thermal equilibrium. "* Increase simulated waste package temperature to nominally 80CC in 5'C increments.
", Allow the test to reach equilibrium at each 5°C increment to a final temperature of approximately
80'C inside the simulated waste package and the outside wall of the test cell to approximately 601C.
At the completion of the Part-i of the test, the system will be allowed to cool to approximately ambient
Conditions at which time the front cover from the test cell will be removed and the drip shield and
additional instrumentation will be installed.
C.2 -EBS Test # 3 - Part 2. Start of Dripping Water at Elevated Temperature
"* Install all the remaining instruments and reinstall the front cover.
"° Insulate the test cell. "* Activate the Data Acquisition System. "* Evaluate the heating system prior to beginning the test.
"* Bring system up to operating temperature of nominally 60'C.
"* Evaluate time to "steady-state" and thermal flux through system.
"° Initiate Q data collection. "• Set system temperature on both inside and outside to nominally 60'C.
"* Let system come to thermal equilibrium
LV
May 7, 1999 Page 5
• Increase simulated waste package temperature to nominally 80"C in 51C increments.
"* Let system reach equilibrium at each 5°C increment and at final temperature of nominally 80°C
inside and 60'C to the outside wall of the test cell.
"* Begin irrigation at a rate of nominally 250m/lihr/m length of the test cell.
"* Allow system to equilibrate. "* Increase both inside and outside temperatures in 5'C increments.
"* Allow system to equilibrate at each temperature increment.
"• Perform the water collection and visualization at each increment of the temperature.
"• Collect other samples as required.
The power to each of the inner and outer heater systems may be controlled by a silicon-rectified
controller(s) which "pulse" power or a similar device on an as needed basis. Each of the heaters will
require the use of power monitors connected to the DAS as shown in Figure 15,
D. Data Collection
The data will be collected using data loggers, automatic data collection system from instruments
installed in the invert material and installed inside the test cell. Sandia will establish the instruments to
be installed and their location within the test. The type of instruments that might be installed are listed
below:
Thermocouples Thermocouple Pyschrometers and Vaisala RH gages for relative humidity
Scales for monitoring water balance RTD's Thermistors Heat Dissipation Probes Wicks Lysimeters Cameras Tensiometers Pressure Transducers TDR's
E. Data Reporting
The data will be reported as described in the FWP and the Test Plan. Sandia will prepare a test report
at the conclusion of the test. The report will include data analysis, as built test information conclusions
and recommendations. The data produced by participants other than Sandia will be appended to the
report. The Appendices will include work performed, test data, test results, any conclusions and
recommendations. All data will be submitted to project technical database in accordance with the
current project QA Procedures.

L V. EBS PM JHP.05/99-005 May 7, 1999 Page 6
F. Safety Considerations
Job Safety Analysis (JSA) will be performed by the TCO to identify any hazards related to this test.
Since this test will have hot surfaces and higher voltage power as compared to the EBS Test # I and #
2. the JSA should identify potential hazards and provide required mitigation.
G. Test Termination
Decision to terminate the test will be made by the EBS Performance Testing Department. Sandia and
other participants will be provided test termination guidance. The TCO will receive written guidance
that the scope of the test has been completed so that the Field Record Packages may be closed and
submited.
H. Point of Contact
For questions and clarifications please call Hemi Kalia at (702) 295-4339 or me at (505) 295-4250.
respectively. Thank you.
JHP/HNK/mmc
Distribution: R. W. Andrews, M&O, Las Vegas, NV K. K. Bhattachar~ya, M&O, Las Vegas, NV John Case, M&O, Las Vegas, NV D. A. Chesnut, M&O, Las V egas, NV Veraun Chipman, M&O, Las Vegas, NV James Conca, M&O/LANIL, Las Vegas, NV J. J. Danneels, M&O/SNL, Albuquerque, NM R. E. Finley, M&O/SNL, Albuquerque, NM G. E. Gdowski, M&O/LLNL, Livermore, CA L. E. Hersman, M&OiLANL, Los Alamos, NM R. L. Howard, M&O, Las Vegas, NV H. N. Kalia, M&O/LANL, Las Vegas, NV William Lowry, M&O, Las Vegas, NV M. T. Peters, M&O, Las Vegas, N-V L. D. Rickertson, M&O, Las Vegas, NV R. L. Schreiner, M&O, Las Vegas, NV S. F. Schuermann, QATSS, Las Vegas, NV
Christine Stockman, M&O/LLNL, Livermore, CA
S. H. Swenning, QATSS. Las Vegas, NV D. J. Weaver, M&O, Las Vegas, NV RPC=Total Pages 21

fio 127 (
fa0127a.111"1'
Fi4gure I

50 GAP 170
in t"
Lz rr
-RAIL CUT AWAY TO SHOW WASTE PACKAGE SUPPORTS
o5-OHiLW/OOE LONG TOP OF
f" 212?
LONGITUDINAL SECTION SCALE; NTS
IFaOI27 PP "
Figure 2
0
(2 0
-z
0�
(2
C-)
05
(2
05
S-S
S I) - '-S
(5�
cl-S
(5)
-S <I.'
-- - - - - - - - - - --- -----------------
- ------------------ - --- --- - ---- ---- -
- - - - - - - - - - - - - - - - -
- - - - - - - - - - - - - - - - - - - - - - - - - - - - - -
0 0
-7
5Z2
- - ... .-, -• - -• - - - - - - - -- - -I
"- - - - -- - - - - - - - - - - - - - - .....
----------------------------------
- - - - - - - - - - - - - - -
-------- ~ .--- - - - -
I

[ 4 ..... ............ tu~u 5~E'Z- =4
z
I
I
0
I.-

EBS Canister #3 Phase I Instrum entation Y1. m from front face
RTD
"*I let dissipation prohi.
** ** '
Figure 5

IEBS Canister #3 Phase 1
*o Instrumentation Y=2m from front face
"RTD
*I leat dissipation probe
** **
Figure 6

EBS Canister #3 Phase 1 Instrumentation Y=3m from front face
"* Ileat dissipation probe
-**" ** -
Figure 7

0
CANISTER
HEATER
Backfill Invert 1 I-
Figure 8
EBS Canister #3 Phase I Instrumentation Front Face

EBS Canister #3 Phase 2
"* Instrumentation Y=1m from front face
N[ TC Psychrometer
I adi
"* ln dissipation prole
*1 ea
**k **
Figure 9

EBS Canister #3 Phase 2 Instrumentation Y=3m from front face
*] TC Psychrometer
* I-leat dissipation probe
Akr
** **
Figure 10
m

I EBS Canister #3 Phase 2
* • Instrumentation Y=2m from front face
* TC Psychrometer
* 1Heat dissipation probe
* U@
** **
Figure 11

EBS Canister #3 Phase 2 Instrumentation
Front Face 0
CANISTER
DRIP SHIELD
HEATER
Figure 12
0
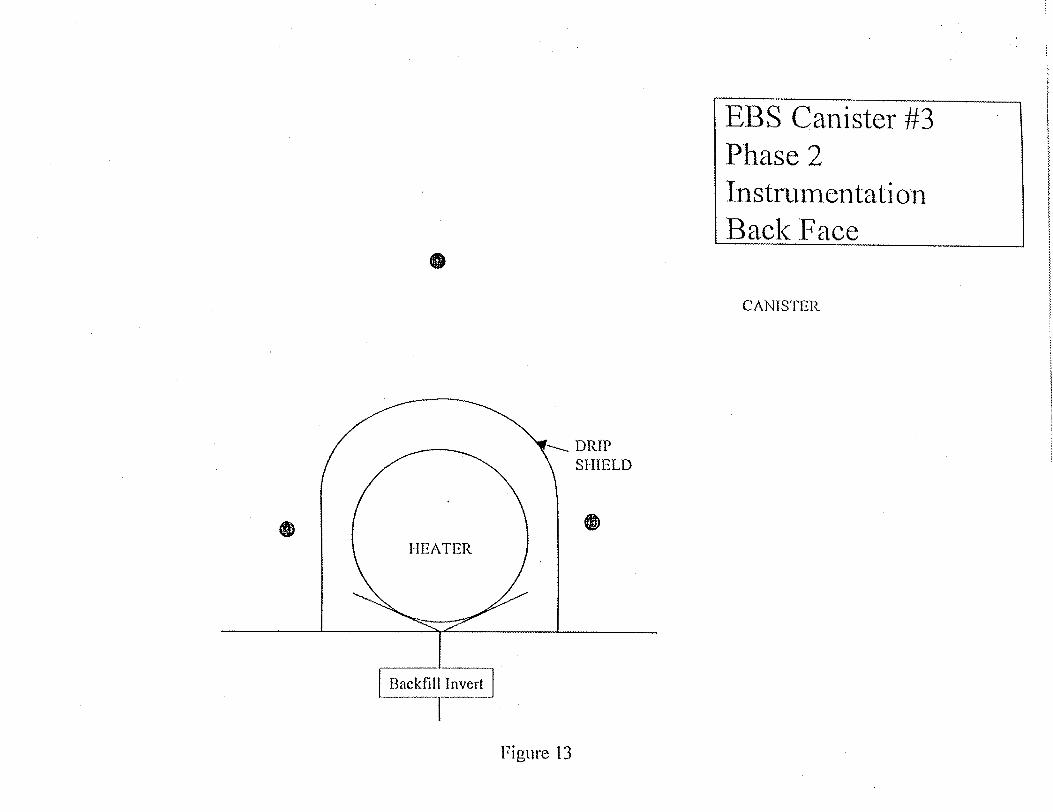
EBS Canister #3 Phase 2 Instrumentation Back Face
0 CANISTER
DRIP SHIELD
HEATER
Backfill Invert] --
1 7igure 13
0

a
CANISTER
HEATER
Figure 14
EBS Canister #3 Phase 1, Instrumentation Back Face

Possible Power Control System
Fizure 15

DRAFT DISCLAIMER
This contractor draft document was prepared for the U.S. Department of Energy (DOE), but has
not undergone programmatic, policy, or publication review, and is provided for information only.
The document provides preliminary information that may change based on new information or
analysis, and is not intended for publication or wide distribution; it is a lower level contractor
document that may or may not directly contribute to a published DOE report.
This document has not undergone technical reviews at the contractor organization, nor has it
undergone a DOE policy review. Therefore, the views and opinions of authors expressed may
not state or reflect. those of the DOE. However, in the interest of the rapid transfer of
information, we are providing this document for your information, per your request.

REVIEW OF THE EXPECTED BEHAVIOUR OF ALPHA TITANIUM
ALLOYS UNDER YUCCA MOUNTAIN CONDITIONS
D.W. SHOESMITH
Department of Chemistry
University of Western Ontario
London, Ontario
Canada N6A 5B7
H A
............ -1ý1111--ý x-- --.... '.- ------------

2
TABLE OF CONTENTS
ABSTRACT
I INTRODUCTION
2 PROPERTIES OF PASSIVE FILMS ON TITANIUM
2-1 Effect of potential
2-2 Effect of temperature
2-3 Effect of pH
3 CRITICAL CORROSION PROCESSES
3-1 Vapour phase corrosion
3-2 Crevice corrosion
3-3 Pitting
3-4 Hydrogen-induced cracking (HIC)
4 CORROSION PROCESSES POSSIBLE UNDER WASTE
REPOSITORY CONDITIONS
4-1 Generation of acidity within creviced sites
4-2 Passive oxide dissolution
4-3 Effect of fluorides
4-4 Galvanic coupling to other materials

3
5 SUMMARY AND CONCLUSIONS
6 REFERENCES
FIGURES AND FIGURE LEGENDS
7 APPENDIX A
7-1 The properties of alloying elements in.ct-titanium alloys and their
ability to catalyze hydrogen absorption
7-2 References
Figures and figure legends
8 APPENDIX B
8-1 The behaviour of the alloying elements, and the key impurity Fe, in
Ti-2, Ti-12, and Ti-16.
8-2 References
Figures and figure legends

4
ABSTRACT
The possible failure processes, crevice corrosion, pitting and hydrogen-induced cracking (HIC) have been reviewed for the candidate titanium alloys (Ti-12, Ti-16 and Ti-7) under anticipated conditions in the Yucca Mountain nuclear waste repository. Both pitting and crevice corrosion are very remote possibilities under these conditions. For Ti-12, a limited amount of crevice corrosion is possible but repassivation will occur. Hydrogen absorption leading to HIC, within an acidified but passive crevice, is the most likely failure mechanism.
Both Ti-12 and Ti-16 have been shown capable of tolerating substantial amounts of hydrogen (-400 pg-g.1 for Ti-12, and > 1000 •tgg" for Ti-16) before any effect on the materials fracture toughness is observed. The rate of absorption to a hydrogen content

5
which exceeds these values will be the key feature determining if, or when, the material
becomes susceptible to cracking.
In order for Ti to absorb hydrogen it is inevitably necessary to subject the material to substantial cathodic polarization, either by coupling to a more active material or by the application of galvanic protection. Absorption occurs when the passive TiO2 is rendered permeable to hydrogen by cathodically inducing redox -transformations in the oxide (Ti4+
-+ Ti3÷). However, the presence of intermetallic particles (Ti2Ni in Ti-12, TixPd in Ti7/Ti-I16) could allow hydrogen absorption at lower, cathodic polarizations since these particles could act as hydrogen absorption "windows" in the oxide. This has been shown to occur for Ti-12 but does not appear to occur for Ti-16. On the contrary, there is speculative evidence to suggest that the intermetallics present in Ti-16 inhibit hydrogen
absorption.
If failure of Ti by hydrogen absorption leading to HIC is to occur then the cathodic titanium must couple to an available anode. For Ti-12, the Ti2Ni intermetallics are corrosive and their corrosion could couple to hydrogen absorption. For Ti-16 the intermetallics are inert and thus do not appear to be a feasible pathway for hydrogen absorption. A second possibility is that in the presence of F- enhanced passive dissolution could couple to hydrogen absorption. The evidence from dental and flue gas scrubber studies suggest this is unlikely, especially with the Pd-containing alloys. The evidence, however, is not totally conclusive. Other anions, SO42• and HCO3", and the species, silica, expected to be present in copious amounts in concentrated groundwaters at Yucca Mountain, are very likely to counterbalance any aggressiveness of F".
The final possibility that could lead to hydrogen absorption by Ti alloys is their coupling to other waste package materials; i.e. Alloy-22 and 316L stainless steel. An active couple between a Ti alloy and Alloy-22 is very unlikely, and for such a couple involving 316L to be active would require the loss of passivity on the steel. This remains a possibility until
tests prove otherwise;
Based on these studies the order of preference of these alloys as materials for waste
packages would be

6
Ti-16 5 Ti-7 >> Ti-12.
However, before a confident recommendation that Ti-16 be chosen over Ti-7, a better
understanding of the presently baffling behaviour of the intermetallic particles in this
material is required.
I INTRODUCTION
Advanced waste package designs are under consideration for use in the Yucca Mountain
Repository. The present reference design employs a dual wall arrangement, in which a 2 cm-thick nickel alloy inner barrier is encapsulated within a 10-cm thick mild steel outer
barrier. The pros and cons of this design have been discussed in detail (Van
Konynenburg 1998) elsewhere and a case for its usage presented (USDOE 1998).
The major corrosion issue with this reference design is the possible formation of hot,
saline ferric ion solutions in contact with the inner barrier alloy (Alloy-22). The source
of this environment is the corrosion of the outer barrier carbon steel. Besides potentially
producing a corrosive environment on the inner barrier corrosion resistant alloy it has
proven difficult to justify that the carbon steel outer barrier itself will provide long term
protection of the inner barrier from corrosion. While many of these reservations are unduly pessimistic, it is judicious to consider alternative materials which avoid these
uncertainties.
With these reservations in mind, it has been proposed that the carbon steel be replaced by
a second corrosion resistant material which will not suffer any common mode corrosion
failure with Alloy-22. While final decisions on package design remain to be made, the
advanced waste package is likely to comprise a combination of Alloy-22 and titanium
alloy corrosion barriers and a supporting structure fabricated from stainless steel, possibly
the 316 grade.
The purpose of this report is to review the corrosion performance of possible titanium
alloys for this application. The alloys under consideration are the Pd-containing alloys
Grades-7 and -16, and, to a lesser degree, the nickel/molybdenum containing Grade-12

7
alloy. The ASTM nominal maximum compositions (expressed as a weight %) for these alloys are given in Table 1. The commercial purity Grade-2 alloy composition is given for comparison, and its corrosion behaviour is often used throughout this report as a reference point against which to discuss the corrosion behaviour of the other alloys.
The review will concentrate on potential corrosion processes possible in aqueous environments at Yucca Mountain. A brief review of passive oxide (TiO2) properties, and how they could be affected by the key environmental variables of redox potential, pH and temperature will be given. Then the key corrosion processes which could occur will be addressed individually. Finally, the expected corrosion performance of these alloys under the specific environmental conditions anticipated at Yucca Mountain will be considered.
Table 1 ASTM Nominal Compositions (weight %) for Various Grades of Titanium
Grade N C H Fe 0 Mo Ni Pd
2 0.03 0.10 0.015 0.30 0.25
12 0.03 0.10 0.015 0.30 0.25 0.3 0.8 7 0.03 0.10 0.015 0.30 0.25 0.2
16 0.03 0.10 0.01 0.30 0.25 0.05
2 PROPERTIES OF PASSIVE FILMS ON TITANIUM It is universally accepted that the protectiveness of the passive oxide film is the key feature which confers on titanium its ability to resist corrosion. Here, a number of pertinent oxide properties, and how they are likely to be affected by environmental variables, are discussed. A more extensive discussion has been presented elsewhere
(Shoesmith and Ikeda 1997).
Figure 1 summarizes the changes expected in passive oxide properties as a function of potential, pH and temperature. Apart from specific features of anticipated groundwater
-- .......... .

8
composition, these three parameters are the most significant under waste repository
conditions.
"The potential experienced by the titanium surface will be dictated by the redox conditions of the exposure environment. These will generally be oxidizing due to the ubiquitous presence of air, but could be affected by the formation of galvanic couples between titanium and the other waste package materials. Reducing conditions could be established within occluded sites to which the access of oxygen is transport
limited.
" The pH, while generally anticipated to be neutral to slightly alkaline could be influenced by minor corrosion processes within occluded sites such as crevices.
" The temperature within the waste repository could range from well over 1 00°C to eventually ambient. From the perspective of aqueous corrosion only temperatures which allow the establishment of aqueous conditions are of significance. For higher temperatures, the unsealed nature of the waste vault will reduce local humidities to low, and hence innocuous, levels. Taking into account the anticipated electrolyte concentration processes possible due to periodic wetting and drying of the waste package surface, a maximum temperature for aqueous conditions of -125°C appears feasible (G. Gordon, personal communication).
2-1 Effect of potential
The passive oxide grown under open-circuit conditions at room temperature may be amorphous or crystalline depending on the conditions of growth. However, the maintenance of an amorphous oxide structure over extremely long exposure times seems unlikely. The thickness of the oxide and its degree of crystalline order may vary spatially (Kuldelka et al. 1995) and a small degree of non-stoichiometry (in the form of oxygen
3+ vacancies (O01) and Ti interstitial ions (Till)) gives the oxide n-type semiconducting
properties.

9
Anodic polarization leads to oxide thickening and a decrease in the number density of
defects. Amorphous films recrystallize to anatase over the potential range 4 to -7 V (vs
SCE') and cracks and faults begin to appear in the oxide (Shibata and Zhu 1995). The
amount of water absorbed by the oxide, which generally leads to an improvement in
passivity, does not increase with increasing applied potential. Films grown
potentiostatically at high potentials (08 to 9 V), and subsequently examined in NaBr
solutions, show an increase in pit generation rate without a corresponding increase in pit
repassivation rate. This pitting process is specific to Br and not observed in CI
solutions. For high anodic potentials, in the region of 8 to 9 V, the breakdown of the film
leads to recrystallization and a more rapid thickening of the film with potential than
observed at lower potentials. Potentials this positive are unattainable under natural
corrosion conditions.
Polarization to cathodic potentials leads to a combination of reductive transformations
within the oxide and the absorption of hydrogen once the potential is sufficiently negative
of the flatband potential for surface degeneracy to be established. For E < -1.0 V (vs
SCE), hydrogen evolution occurs and the formation of surface hydrides is observed.
Measurements of the amount of hydrogen absorbed suggest a potential threshold of-
0.6 V above which no absorption occurs.
2-2 Effect of temperature
The effect of temperature on films grown either electrochemically or under natural
corrosion conditions is similar in many respects to that of potential. A similar +
breakdown/recrystallization process to yield anatase/rutile occurs in the temperature
range 50 0C to 70'C but, in contrast to the effect of potential, is accompanied by the
absorption of water. For T > 70°C, the rate of film thickening increases as observed at
Unless otherwise stated all potentials in this report will be quoted against the saturated calomel electrode
(SCE).

10
high potentials, but the amount of absorbed water also increases markedly. Subsequent
examination at room temperature in NaBr solutions shows this absorption of water
improves the passivity of the oxide as indicated by a marked increase in pitting potential
(Shibata and Zhu 1994).
2-3 Effect of pH
The pH has no effect on oxide stability for E 0 -0.3 V but, for sufficiently acidic
conditions, an active region and an active to passive transition are observed between
-- 0.7 V and -0.3 V (Kelly 1979). At room temperature in chloride solutions, a pH
between I and 0 is required before active conditions can be established (Watanabe et al.
1989). For a temperature of 70'C, a pH < I is required. For natural corrosion conditions,
the dissolution of the oxide film in acidic solutions is slow (-20 gm/y at pH < 0 and
45'C) and in solutions of pH> 1, extremely slow (-2 tm/y at pH-l and 450 C)
(Blackwood et al. 1988). Cathodic polarization in acidic solutions leads to the reductive
dissolution of the oxide (Ti'v (oxide) -- Ti"' (solution)) (Ohtsuka et al. 1987), a process
which is accompanied by the absorption of hydrogen into the oxide.
To avoid the two processes most likely to lead to localized corrosion, crevice corrosion
and hydrogen-induced cracking (HIC), practical operating guidelines have been
established. For crevice corrosion, it is accepted that attack will not occur on titanium
alloys below a temperature of 70'C, regardless of solution pH or chloride concentration.
For HIC a number of criteria must be simultaneously satisfied: a source of hydrogen
atoms must be present; the temperature must be in excess of 80°C; and either the pH
must be < 3 or > 12, or the potential at the surface must be < -0.7 V (Schutz and Thomas
1987). Further consideration of these guidelines will be included when discussing the
corrosion behaviour of the individual alloys.
3 CRITICAL CORROSION PROCESSES
If Ti alloys are to fail rapidly due to corrosion then the most likely processes are crevice
corrosion, pitting, and hydrogen induced cracking (HIC) under either aqueous or vapour

11
phase conditions. Processes such as microbially induced corrosion and radiolytically
induced corrosion are extremely unlikely and have been considered in detail elsewhere
(Shoesmith and Ikeda 1997, Shoesmith and King 1999). The possibility of direct
hydrogen absorption leading to HIC due to radiolysis effects is considered briefly below.
3-1 Vapour phase corrosion
Many aspects of Ti behaviour under vapour phase conditions have been discussed
elsewhere (Shoesmith and Ikeda 1997), and will not be readdressed in any detail here.
The oxide film on Ti has been shown to provide an excellent barrier to corrosive attack
by a wide range of dry and moist gases (Schutz and Thomas 1987). Titanium alloys are
widely used in hydrogen-containing environments and, in the presence of traces of
moisture or oxygen the surface oxide provides a highly effective barrier to hydrogen
absorption (Cotton 1970, Covington 1979).
The possibility of Ti corrosion under vapour phase conditions at Yucca Mountain seems
either remote, or an easily avoidable possibility. If placed on the outside of the waste
package, Ti should not be exposed to the high temperature pressurized steam
environment that could lead to hydrogen absorption. Yucca Mountain is an unsealed site
and very low drift humidities are expected for waste package temperatures over 1000 C.
Only when the temperature drops below 1000C would saturated vapour conditions be
anticipated, and these temperatures would be too low for water decomposition leading to
hydrogen absorption to occur.
If titanium were the inner barrier material, then a number of environmental features could
make the material susceptible to hydrogen absorption. The temperatures would initially
be well above 200'C and any residual water within the package could produce a
pressurized steam environment. This combination, coupled with high gamma radiation
fields within the waste package, could cause hydrogen absorption. The evidence from
studies in aqueous solutions show that hydrogen absorption can occur for gamma dose
rates > 102 Gy/h at these temperatures (Westerman 1990). Absorption occurred more
readily for Ti-12 than for Ti-2. This problem would seem easily avoidable by either
S..................... . . . .....• " , 7=
12
careful drying of the waste form prior to sealing the waste package or by the addition
to the waste package of relatively small amounts of water absorbing materials.
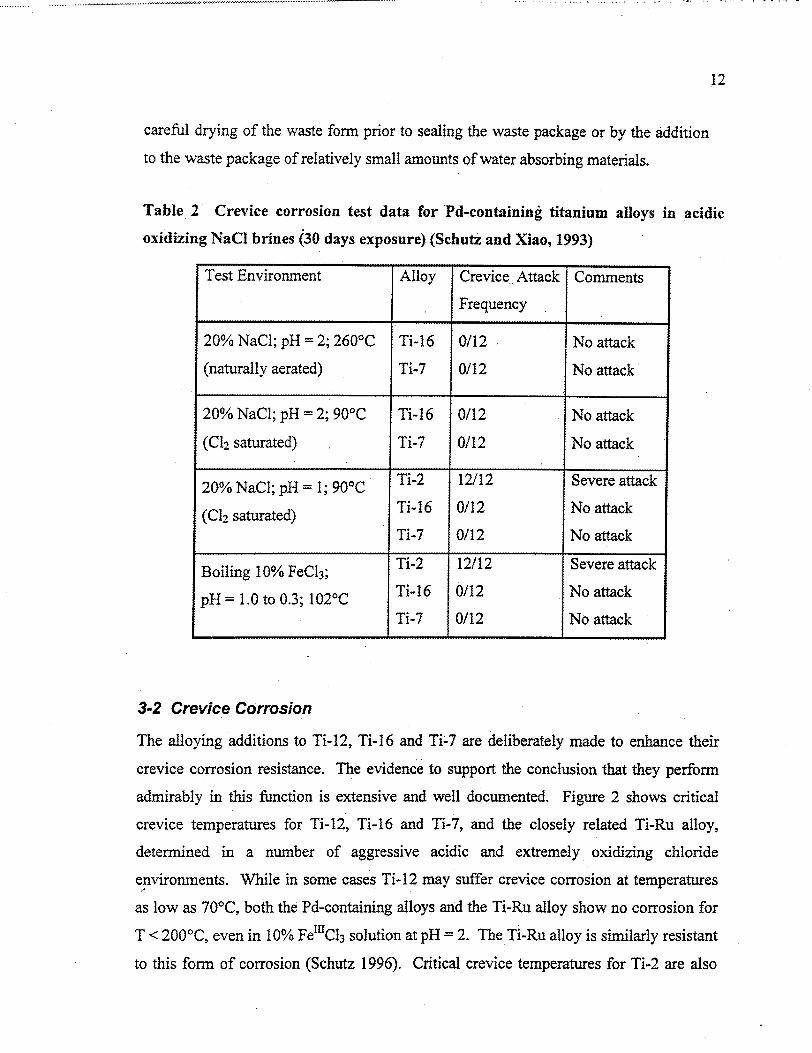
Table 2 Crevice corrosion test data for Pd-containing titanium alloys in acidic
oxidizing NaCI brines (30 days exposure) (Schutz and Xiao, 1993)
Test Environment Alloy Crevice Attack Comments
Frequency
20% NaC1; pH = 2; 260'C Ti-16 0/12 No attack
(naturally aerated) Ti-7 0/12 No attack
20% NaC1; pH =2; 90'C Ti-16 0/12 No attack
(C12 saturated) Ti-7 0/12 No attack
20% NaCl; pH 1; 90 0C Ti-2 12/12 Severe attack
(C12 saturated) Ti-16 0/12 No attack
Ti-7 0/12 No attack
Boiling 10% FeCI3; Ti-2 12/12 Severe attack
pH = 1.0 to 0.3; 1020C Ti-16 0/12 No attack
Ti-7 0/12 No attack
3-2 Crevice Corrosion
The alloying additions to Ti-12, Ti-16 and Ti-7 are deliberately made to enhance their
crevice corrosion resistance. The evidence to support the conclusion that they perform
admirably in this function is extensive and well documented. Figure 2 shows critical
crevice temperatures for Ti-12, Ti-16 and Ti-7, and the closely related Ti-Ru alloy,
determined in a number of aggressive acidic and extremely oxidizing chloride
environments. While in some cases Ti-12 may suffer crevice corrosion at temperatures
as low as 70'C, both the Pd-containing alloys and the Ti-Ru alloy show no corrosion for
T < 200'C, even in 10% Fe"1 C13 solution at pH = 2. The Ti-Ru alloy is similarly resistant
to this form of corrosion (Schutz 1996). Critical crevice temperatures for Ti-2 are also
13
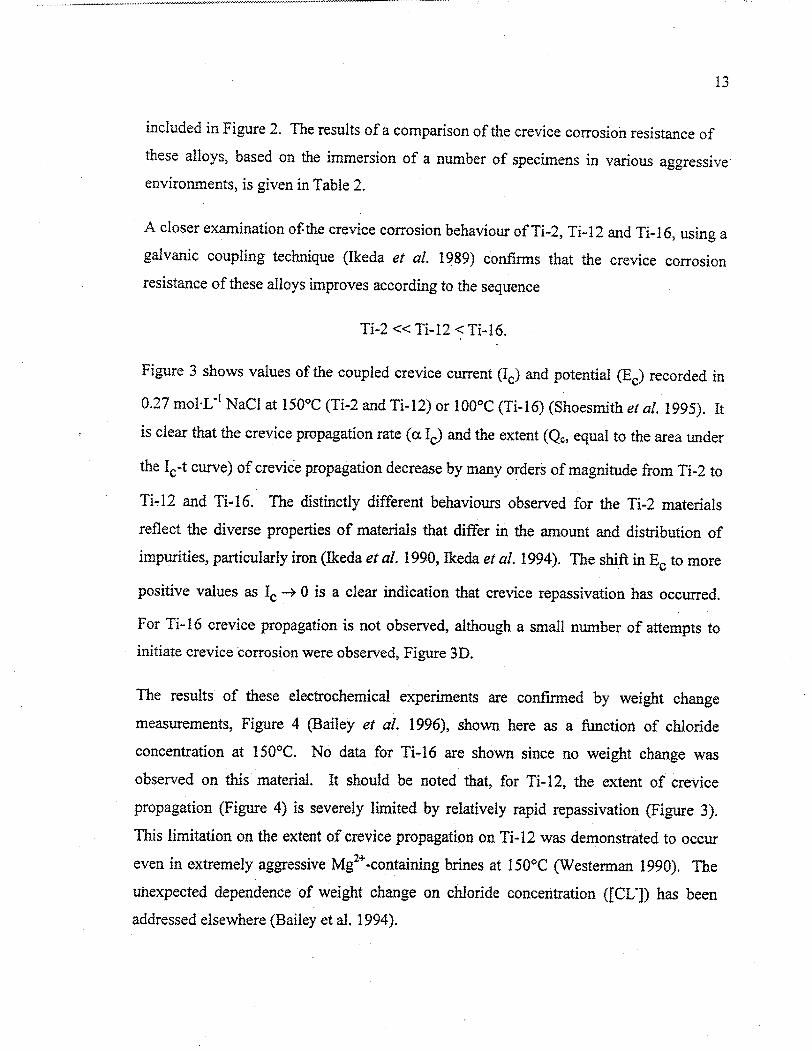
included in Figure 2. The results of a comparison of the crevice corrosion resistance of
these alloys, based on the immersion of a number of specimens in various aggressive
environments, is given in Table 2.
A closer examination of the crevice corrosion behaviour of Ti-2, Ti-12 and Ti-16, using a
galvanic coupling technique (Ikeda et al. 1989) confirms that the crevice corrosion
resistance of these alloys improves according to the sequence
Ti-2 << Ti- 12 < Ti- 16.
Figure 3 shows values of the coupled crevice current (1c) and potential (Ec) recorded in
0.27 mol.L" NaC1 at 150°C (Ti-2 and Ti-12) or 100°C (Ti-16) (Shoesmith et aL 1995). It
is clear that the crevice propagation rate (a Ic) and the extent (Qc, equal to the area under
the Ic-t curve) of crevice propagation decrease by many orders of magnitude from Ti-2 to
Ti-12 and Ti-16. The distinctly different behaviours observed for the Ti-2 materials
reflect the diverse properties of materials that differ in the amount and distribution of
impurities, particularly iron (Ikeda et al. 1990, Ikeda et al. 1994). The shift in Ec to more
positive values as Ic -> 0 is a clear indication that crevice repassivation has occurred.
For Ti-16 crevice propagation is not observed, although a small number of attempts to
initiate crevice corrosion were observed, Figure 3D.
The results of these electrochemical experiments are confirmed by weight change
measurements, Figure 4 (Bailey et al. 1996), shown here as a function of chloride
concentration at 150°C. No data for Ti-16 are shown since no weight change was
observed on this material. It should be noted that, for Ti-12, the extent of crevice
propagation (Figure 4) is severely limited by relatively rapid repassivation (Figure 3).
This limitation on the extent of crevice propagation on Ti-12 was demonstrated to occur
even in extremely aggressive Mg 2÷-containing brines at 150°C (Westerman 1990). The
uhexpected dependence of weight change on chloride concentration ([CL]) has been
addressed elsewhere (Bailey et al. 1994).
... . .......

14
It is generally accepted that the function of the alloying additions (Ni in Ti-12, Pd in
Ti- 16 and Ru in Ti-Ru) is to supply cathodic sites within the creviced area which catalyze
proton reduction in the reducing acidic environment existing at actively propagating sites.
This catalysis of proton reduction pushes the crevice potential into the passive region for
titanium thereby forcing it to repassivate, (Figure 5). While the general nature of the repassivation process is understood, the chemical/electrochemical details are not so well
defined.
The most commonly accepted explanation for both the Ni/Mo-containing Ti-12 and the
Pd-containing Ti-7 and Ti-i 6 is that corrosion of the alloy in the acidic crevice
environment leads to the release of Ni2÷ or Pd2+ which are then subsequently redeposited
to produce Ni or Pd sites which act as proton reduction catalysts (Cotton 1967, Satoh et
al. (1987), Sedriks et al.1972, Hall et al. 1985, Schutz and Xiao 1993, Shida and
Kitayama 1988, Kitayama et al. 1990, McKay 1987). Figure 6A attempts to illustrate
this mechanism schematically.
For Ti- 12, the alternative opinion is that the Ni is localized in Ti2Ni intermetallics which
act as cathodes galvanically-coupled to the surrounding Ti a-grains (Glass 1983, Kido
and Tsujikawa 1989) (Figure 6B). While the evidence for the presence of Ni2> in
solution during passive corrosion in strong acidic solutions (to simulate the crevice
environment) is good, that for dissolved Pd2> is marginal. Cotton (1967) found only
-0.9 gg'g' of dissolved Pd for Ti-6 corroding in boiling H 2 SO 4 . A similar redeposition
mechanism to produce noble metal cathodes has been claimed for Ti-Ru (van der Lingen
and de Villiers Steyn 1994). Again, however, the amount of dissolved Ru found in
solution (-0.4 pg'g') after corrosion in strong acids (10% H2SO 4, 5% HCl) (Sedriks
1975) is marginal.
Although no real evidence is available to prove the point, it is tempting to hypothesize
that Ti-12 and, to a lesser degree Ti-2 with a high Fe content, may be repassivated by a
process involving dissolution of Fe2+ and Ni2+ followed by their redeposition (Figure
6A), whereas Ti-7 and Ti-16 repassivate by the galvanic coupling of intermetallic
precipitates to the titanium matrix, (Figure 6B). The former process might be expected to

15
be less efficient than the latter, thereby accounting for the limited propagation of
crevice corrosion on Ti-12 and Ti-2 (high Fe).
For Pd-containing alloys there is the additional possibility that the alloying element leads
to the anodic ennoblement of the alloy as a consequence of either metal dissolution or
oxide growth. In both cases the preferential oxidation of Ti to produce either soluble
Ti3+/Ti4÷ or TiO2, would lead to enrichment of Pd in the surface of the alloy and, hence to
its ennoblement, Figure 7.
The analytical evidence for the accumulation of Pd in the surface of Pd-containing alloys
after corrosion in acid solutions is indisputable (Hubler and McCafferty 1980, Shida and
Kitayama 1988). Whether this is due to the redeposition of dissolved Pd2+ or the
accumulation of Pd or Pd-containing particles after the preferential dissolution of Ti
(Hubler and McCafferty 1980, Amstrong et al. 1973) is not proven.
Whether or not the fine details of the function of the alloying element in reinforcing
passivity within crevices is important is open to debate, and in the final analysis may not
be. However, whether or not the alloying elements are present in cx-phase solid solution,
P3-phase solid solution and/or intermetallic precipitates could have a significant influence
on the ability of the alloy to absorb hydrogen when exposed to acidic conditions and/or
galvanically coupled to another more easily corrodible material. This possibility is
discussed in detail below.
3-3 Pitting
The pitting of titanium has been studied in some detail (Posey and Bohlmann 1967,
Koizumi and Furuya 1973) and a review has been recently written (Shoesmith and Ikeda
1997). Commercially pure titanium (Ti-2) is extremely resistant to pitting in keeping
with the excellent properties of the passive TiO2 film under oxidizing conditions, Figure
L Commonly pitting potentials at room temperature are in excess of 7 V, and even for
temperatures greater than I50'C are in the region of 2 V.
16
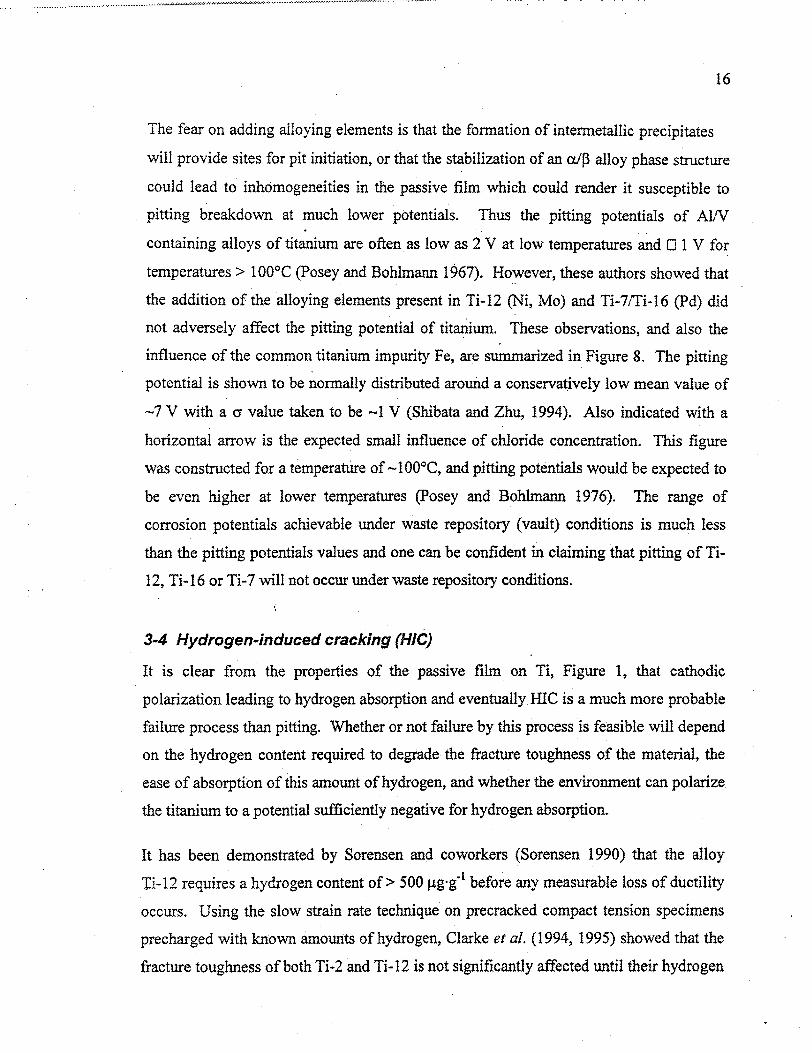
The fear on adding alloying elements is that the formation of intermetallic precipitates
will provide sites for pit initiation, or that the stabilization of an a/W3 alloy phase structure
could lead to inhomogeneities in the passive film which could render it susceptible to
pitting breakdown at much lower potentials. Thus the pitting potentials of Al/V
containing alloys of titanium are often as low as 2 V at low temperatures and ] 1 V for
temperatures > 100'C (Posey and Bohlmann 1967). However, these authors showed that
the addition of the alloying elements present in Ti-12 (Ni, Mo) and Ti-7/Ti-16 (Pd) did
not adversely affect the pitting potential of titanium. These observations, and also the
influence of the common titanium impurity Fe, are summarized in Figure 8. The pitting
potential is shown to be normally distributed around a conservatively low mean value of
-7 V with a a value taken to be -1 V (Shibata and Zhu, 1994). Also indicated with a
horizontal arrow is the expected small influence of chloride concentration. This figure
was constructed for a temperature of-100°C, and pitting potentials would be expected to
be even higher at lower temperatures (Posey and Bohlmann 1976). The range of
corrosion potentials achievable under waste repository (vault) conditions is much less
than the pitting potentials values and one can be confident in claiming that pitting of Ti
12, Ti-16 or Ti-7 will not occur under waste repository conditions.
3-4 Hydrogen-induced cracking (HIC)
It is clear from the properties of the passive film on Ti, Figure 1, that cathodic
polarization leading to hydrogen absorption and eventually HIC is a much more probable
failure process than pitting. Whether or not failure by this process is feasible will depend
on the hydrogen content required to degrade the fracture toughness of the material, the
ease of absorption of this amount of hydrogen, and whether the environment can polarize
the titanium to a potential sufficiently negative for hydrogen absorption.
It has been demonstrated by Sorensen and coworkers (Sorensen 1990) that the alloy
Ti-12 requires a hydrogen content of > 500 gg 1g-1 before any measurable loss of ductility
occurs. Using the slow strain rate technique on precracked compact tension specimens
precharged with known amounts of hydrogen, Clarke et at. (1994, 1995) showed that the
fracture toughness of both Ti-2 and Ti-12 is not significantly affected until their hydrogen

17
contents exceed a critical value (Hc). An example of the data obtained, expressed as a
plot of stress intensity factor as a function of hydrogen concentration is shown in
Figure 9. The as-received materials, containing 20 to 50 gg'g- of hydrogen, are very
tough and under high stress, fail by ductile overload. This ductile tearing is also observed
during slow crack growth for both materials. The value of Hc is the hydrogen
concentration above which slow crack growth is no longer observed and only fast crack
growth occurs. Extensive discussions of such data are available elsewhere (Shoesmith et
al. 1997).
A generalized form of such a plot is shown in Figure 10, illustrating how they can be
used to identify the critical hydrogen content (Hc) above which the fracture toughness is
affected and one cannot then be sure these alloys will not fail by fast crack growth.
Based on such measurements, values of Hc of 500 to 800 pgg-g. (Ti-2) and 400 to
600 ggg'lgg (Ti-12) have been determined. More recent measurements (Ikeda,
unpublished data) show that Hc for Ti-16 is at least 1000 ggg'g and may be much
greater.
To assume fast crack growth is inevitable once Hc is attained is a conservative
assumption. Implicit in this assumption is that the waste package will always be subject
to sufficient stress to lead to cracking. Since some creep of the material might be
expected over long disposal periods this is by no means certain to be the case. A second
assumption is that the hydrogen will be evenly distributed as hydride precipitates
throughout the material.
The criterion for failure by HIC then becomes the time required for the alloy to absorb
this amount of hydrogen. In their ability to enforce repassivation within crevices the
alloying elements must exist as, or create, catalytic cathodic sites. This raises the
question as to whether, and in what form, these elements can catalyze the absorption of
hydrogen into the Ti matrix. While this process could be rapid under propagating crevice
conditions (Noel et aL. 1996, Shoesmith et al. 1997) it will be much slower under passive
- ... ssma-' . ......... -.-

18
conditions but could still be a factor if sufficiently cathodic polarization of titanium
could be achieved.
The absorption of hydrogen into titanium is not readily achieved, since the oxide is
highly impermeable, and it is necessary to induce, by cathodic polarization, redox
transformations within the oxide. It is this need which accounts for the criterion of a
potential < 0.7 V specified by Schutz and Thomas (1987), and demonstrated in long term
hydrogen absorption measurements by Murai et al. (1977), Figure 11. Figure 12 attempts
to illustrate the nature of the parallel oxide redox transformation-hydrogen absorption
process, which occurs once the potential is sufficiently negative of the flatband potential
for surface degeneracy to be established. A more detailed discussion of this process has
been given elsewhere (Shoesmith and Ikeda 1997).
Once the potential is sufficiently negative for these transformations to occur, titanium
hydrides are thermodynamically stable with respect to the metal (Beck 1973) and the
passive film can only be considered as a transport barrier. Beyond this threshold
potential, the rate of absorption of hydrogen by the metal is effectively independent of
potential down to - -1.0 V (vs SCE), Figure 11. Indeed, there is a significant amount of
evidence to claim that hydrogen is not transported through the oxide film at any
significant rate until potentials < -1.0 V (vs SCE) are achieved. This is clearly evident in
electrochemistry-in-situ neutron experiments on titanium, Figure 13. Hydrogen has a
strong negative scattering length for neutrons-and, when present in the oxide, reduces its
scattering length density (Tun et al, 1999). The results in Figure 13 show that hydrogen
is present in the oxide close to the oxide/solution interface but not close to the
metal/oxide interface, and that a cathodic polarization of > -1.0 V is required for
hydrogen to penetrate to the metal/oxide interface when its entry into the metal becomes
inevitable. A fuller discussion of these results is available elsewhere (Tun et al. 1999)
A more definitive demonstration that significant hydrogen transport through TiO2 does
not occur until E < -1.0 V (vs SCE) was obtained using an electrochemically controlled
bilayer system comprising a layer of TiO2 deposited on Pd metal (Pyun and Yoon 1996).
By using this bilayer in back to back electrochemical cells, hydrogen could be injected

19
into the TiO 2 at the TiO 2/solution interface (H+ + e -* Habs), and its transport detected
by its reoxidation (Habs --) H+ + e) at the Pd/solution interface. Any Habs crossing the
boundary from TiO 2 to Pd is subsequently transported very rapidly to the Pd/solution
interface and detected by oxidation. The results in Figure 14 show that no detectable
hydrogen transport through the TiO2 layer into the Pd occurred until the potential applied
to the TiO 2/solution interface was < -1.0 V (vs SCE). These results are consistent with
industrial observations which show significant hydride formation and embrittlement of Ti
is not observed until E < -1.0 V (Schutz and Thomas 1987).
The fear when alloying elements capable of catalyzing proton reduction are added to
titanium is that they will also catalyze hydrogen absorption. If, for instance, intermetallic
precipitates are present, over which a coherent layer of TiO 2 does not act as first a
chemical, then a transport barrier, then possible "hydrogen windows" exist within the
oxide. Under these circumstances, transformation of the redox properties of the passive
oxide may not be a necessary prerequisite for hydrogen absorption which could therefore
occur at potentials more positive than -0.6 V. Whether or not this proves to be the case
would depend on the catalytic properties of the cathodic sites, but, inevitably, the alloying
elements added, Ni, Pd, Ru, are known to facilitate proton reduction (Greef et al.) and to
possess significant solubilities for hydrogen. An attempt to illustrate this scenario
schematically is shown in Figure 15
A substantial body of evidence exists to show that the presence of these alloying elements
can lead to the absorption of hydrogen into titanium. This evidence is summarized,.
referenced, and discussed in Appendix A. The nature and distribution of the alloying
element has a large effect on this behaviour. For Ti-12 (containing both Ni and Fe (as an
impurity)) and Ti-2 (similarly contaminated with Fe) both the corrosion behaviour and
the extent and rate of hydrogen absorption depend on the location and chemical form of
the alloying element (Ni) and impurity element Fe.
Both Ni- and Fe-containing [3-phase and Ti2Ni and TiFe intermetallic particles are
susceptible to corrosion in acidic environments. The evidence in support of this claim is
given in Appendix B. While it remains to be demonstrated whether Ni/Fe P3-phase can

20
act as a catalytic cathode, there is little doubt in the case of the intermetallics, or in
their ability to absorb hydrogen. Consequently, for sufficiently acidic conditions the
corrosion of the j3-phase or intermetallic will lead to hydrogen absorption. It is likely,
however that absorbed H would remain localized at the intermetallic sites unless the
predominately a-phase alloy contains 3-phase ligaments, commonly located along a
phase grain boundaries, which enhance transport of hydrogen into the bulk of the alloy.
An attempt to illustrate this process is given in Figure 16. In the absence of these
transport pathways, the intermetallic particles may become saturated in H, a condition for
which the efficiency of further hydrogen absorption appears to approach zero.
For the Pd-containing alloys the formation of j3-phase is negligible and intermetallic
particles, when present, appear inert to corrosion (Appendix B). The rate and efficiency
of hydrogen absorption increases with increasing Pd content, though, in the absence of
any apparent separation of the Pd into discrete intermetallics (Ti-7) the mechanism of
absorption remains unclear. Electrochemical evidence for catalysis of the proton
discharge step,
H÷ + E - Has
a characteristic feature of proton reduction on noble metals, is clear. Presumably, in the
absence of separated intermetallic particles, this discharge step, and the subsequent H
absorption step, occur at the atomic level. Since absorption can occur for E > -0.6 V
redox transformations within the oxide do not appear to be a prerequisite.
For Ti-16, H absorption was not observed for potentials as low as -1.0 V, despite the
presence of a large number of randomly dispersed intermetallic particles (Appendix A).
While the degree of catalysis of proton discharge and the efficiency of H absorption are
expected to decrease as the Pd content decreases (i.e., from Ti-7 to Ti-16), this
observation is still surprising. Since the material investigated contained a substantial
amount of Fe (as an impurity) it is likely that the particles contain Fe. However, since
they are apparently inert, whereas TiFe is not, there is the possibility that Pd

21
cosegregated to yield TiPdFe particles. The composition and properties of these
particles remain to be elucidated.
CORROSION PROCESSES POSSIBLE UNDER WASTE
REPOSITORY CONDITIONS
From the above discussion it is clear that pitting will not-be a failure mechanism and that
active crevice corrosion, leading to waste package failure, is extremely unlikely for the
alloys chosen. For Ti-12, the initiation of crevice corrosion would be possible but any
significant propagation would be prevented by repassivation of the alloy. This has been
demonstrated even for high temperature conditions in very aggressive Mg a-containing brines. For the Ti-16 and Ti-7 alloys the possibility of active crevice corrosion is
extremely remote.
In the absence of active crevice corrosion, the most likely corrosion scenario for Ti under
repository conditions is that it will absorb H in the occluded areas existing between inner
and outer barrier walls of the waste package. For this to happen the Ti, or at least the
intermetallics within it, must function as cathodes coupled to some anode within the system. For such a couple to be actively established the development of acidic conditions
within these occluded areas would be required.
Three potential anodes appear possible:
(i) the presence in the alloy of a reactive phase or intermetallic; e.g. P-phase and/or
Ti2Ni in Ti-12;
(ii) galvanic coupling to another waste package material. Considering the proposed
waste package design, this would be either nickel alloy-22 or 316 stainless steel;
(iii) general active or enhanced passive corrosion of Ti if the presence in. the
groundwater of F can lead to a significant increase in passive current density.

22
4-1 Generation of acidity within creviced sites
A key question which must be answered when considering these three possibilities is
whether acidic conditions can be generated within creviced (occluded) regions even
though active crevice corrosion conditions cannot be established. Noel (1999) has
already shown that, for tight crevices between Ti and teflon spacers, crevice acidification
did occur at 1 00°C. While these crevices were coupled to large Ti counter electrodes (to
yield an anode/cathode ratio of - 1:40) which could have helped drive the acidification
process, it is clear that the creviced Ti face became etched, Figure 17. This etching was
observed on Ti-2 specimens exposed to neutral NaCI solutions prior to the initiation of
active crevice corrosion and on Ti-2 specimens exposed to neutral sulphate solutions on
which crevice corrosion did not initiate. Etching was also observed on the creviced face
of Ti- 16 specimens in chloride solutions, again despite the maintenance of passivity.
The fall in resistance observed in impedance experiments on Ti-2 and Ti-12 when the
temperature is increased to 5 65°C (Appendix B and Figure B2) can be interpreted to
indicate that a film breakdown/recrystallization process occurs once this temperature is
exceeded. These results and this claim are consistent with those of Shibata and Zhu
(1995). This process leads to the introduction of grain boundaries, and possibly even
more open pathways, by which metal dissolution can occur. Under occluded crevice
conditions, this leads to cation hydrolysis and the development of local acidity as
illustrated schematically in Figure 18. That this development of acidity precedes the
initiation of crevice corrosion on Ti-2 has been clearly demonstrated by Noel (1999), and
is the reason why the industrial guideline for avoiding crevice corrosion, Le., T 0 701C
(Schutz and Thomas 1987), applies. For the Ti-16 and Ti-7 alloys the development of
this occluded acidity does not lead to the initiation of crevice corrosion.
The need for film breakdown/recrystallization to produce localized acidity suggests that
such an acidification process would require temperatures higher than -65'C. However,
even at temperatures in the range 25°C to 35°C, a drop in pH of a few units from neutral
(7) has been observed in laboratory-formed femoral taper crevices between Ti6A14V and
Cr-Co-Mo alloys (Gilbert and Jacobs 1997).

23
4-2 Passive oxide dissolution
Under neutral conditions passive oxide dissolution rates are immeasurable (Mattsson and
Olefjord 1990, Mattsson et al. 1990). Over a 6-year exposure period to water-saturated
bentonite clay at 95°C, the maximum dissolution rate was < 0.4 nm/year. This value
effectively represents an analytical detection limit since no dissolved Ti was found.
For more acidic conditions, Blackw~iood et al. (1988) measured dissolution rates of
passive titanium oxides using electrochemical methods that determined the amount of
oxide removed from the metal surface rather than by attempting to measure the amount of
dissolved Ti3 /Ti4÷ in solution. These rates were measured in acidic sulphate,
perchlorate, phosphate and chloride solutions at 45'C and, generally for pH <2, Table 3).
Dissolution was chemical in nature; i.e., did not involve electrochemical interaction
between the oxide and the substrate metal and led to the uniform thinning (as opposed to
pitting) of the oxide film. The rate was close to first order with respect to proton
concentration. Extrapolation of these rates according to this pH dependence predicts
negligibly small dissolution rates in neutral solutions, consistent with the observations of
Mattsson and coworkers.
Table 3. Rates of Oxide Dissolution at 45CC (from Blackwood et al. 1988)
"Electrolyte Concentration (mol-dn 3) Dissolution Rate (gpi/year)
H2S0 4 3.0 19.53
H2SO 4 1.0 16.12
H2S0 4 0.25 8.15
H 2 S0 4 0.02 2.01
H2SO4/NaHSO 4 1.0/1.0 11.21
H2SO4/K 2SO 4 2.72
H3PO 4 3.0 2.60
HC10 4 3.0 9.2
HCl 3.0 17.17
Oxalic acid 1.0 12.52

24
Table 3. Simulated Corrosion Test Environments for the Yucca Mountain
Repository
Concentration (gg- 1)
"Parameter SDW SDW SCW SCW SAW SAW SCMW
(60°C) (90°C) (60 0 C) (90°C) (600C) (90°C) (60°C)
"pH 9.5 9.9 9.2 9.2 2.7 2.7 7.8
Ca 2+ 3.5 4 16 15 58 58 400
Mg- 1.2 ND 29 3.4 52 53 4
K÷ 36 38 4600 4,500 4,300 4,3000 85
Na+ 430 460 36,000 44,000 43,000 43,000 10
Si 17 16 18 58 30 50 10
S142- 170 180 13,000 13,000 41,000 40,000 1,200
CI" 68 74 7,4000 7,500 28,000 27,000 11
N0 3" 62 64 7,000 7,200 23,000 24,000 10
F 14 15 300 1,400 0 0 <0.I
-HCO3" 720 700 44,000 51,000 0 0 <t
Equiv. NaCI 112 122 1-2,199 12,363 46,157 44,508 18
ND - not detected
SDW- simulated dilute well water (OxJ-13)

25
SCW - Simulated concentrated well water (I OOOxJ-13)
SAW - simulated acidified well water
SCMW - simulated cement-modified water
Table 5. Expected Groundwater Concentrations After Wetting/Evaporation Cycles
Concentration (mg/L)
Ion J-13 Long Term Test Beaker Evaporation 900 C/85%RH
Solution IO0Ox 1000x
SO 4 18.4 13000 15700 29500
Cl 7.14 7200 6120 14800
NO3 8.78 6440 6730 14200
F 2.18 1580 1520 3400
HCO3 128.9 47326 31471
Na 45.8 42500 37700 77400
K 5.04 3580 3720 9700
Ca 13.0 3 7 25
Mg 2.01 1 0 0
SiO2(aq) 61.0 109.14 7124 22500
pH 7.4 10.1 9.9 10
Long term test solution - similar to SCW in Table 4
Beaker evaporation - J-13 solution evaporated to 100ox concentration in the presence of crushed tuff
90oC/85%RH - Evaporation performed for a constant relative humidity
..... .-- -----

26
Within an acidified crevice (at 45°C), these rates indicate that a maximum rate of
10-20 grm/year for a pH - 1 falling to < 1-2 ýLm/y for pH - 2 would be possible. Clearly,
substantial and enduring acidification would be required for passive dissolution rates at
creviced sites to reach significant values.
4-3 Effect of fluorides
The corrosion of Ti and its alloys in the presence of F- has mainly been studied for dental
and flue gas scrubber applications. In the first application the environment is saline and
neutral, but low temperature, and in the second much more aggressively saline, hot
(> 1000 C) and potentially acidic. For the low temperature dental applications, Ti-2 was
tested in 1% NaC1 solutions ranging in pH from 6 to -3 containing between 1000 and
100 pg/g of F" (Reclaru and Meyer 1988). For flue gas scrubber applications the
environments tested were much more concentrated with Ca and MgC12 concentrations
between 0.1 and 12.7% (i.e., [CI1] up to 15,700 gg'g, with [SO 42 "] in the range 9000 to
26,000 pgg"g-). The temperature was up to 177*C and the pH down to -1. Fluoride
concentrations were in the range 0 to 12,000 ±g-g- (Thomas and Bomberger 1983,
Schutz and Grauman 1986). These concentrations are similar to those used in corrosion
testing, Table 4 and those established in J-13 well water evaporation tests, Table 5.
In the dentistry related studies in 1% NaCl containing 1 1000 p.g-g' of F- passivity was
maintained, and the galvanic currents generated by coupling to various Au/Ag dental
alloys were insignificant (1 to 10 nA-cnf 2) (Reclaru and Meyer 1988). Although it is not
made specifically clear it appears that Ti formed the cathode in these couples. When
galvanically coupled to 316L stainless steel a galvanic current of - 400 nA'cm 2 was
obtained with Ti acting as the anode. As will be seen when discussing the galvanic
coupling of Ti below, this observation (i.e., Ti acting as the anode) is not uncommon. In
the absence and presence of P the potential of this couple was 9 mV and -30 mV (vs
SCE), respectively. In neither case is the potential sufficiently negative to allow H
absorption by Ti-2. When the pH is decreased, the presence of P leads to an increase in
passive current density, and, under creviced conditions the potential drops to much more

27
negative values, indicating that in the presence of F-, crevice corrosion of Ti-2 could
occur even at low temperatures.
In the simulated flue gas scrubber environments, the influence of F- was much more
muted (Thomas and Bomberger 1983, Schutz and Grauman 1986). As observed in the
dental studies, the passivity of Ti-2 was lost for pH < 3 when F- was present. For Ti- 12
this pH-threshold for the loss of passivity was < 1.5. Although Ti-16 and Ti-7 were not
tested, it would follow from these observations that an even lower pH would be required
before FP exerted any significant influence on these two alloys. An interesting synergism
was observed between Ci" and F-, the influence of FP on corrosion decreasing as [Cl-]
increased (Thomas and Bomberger 19830. This was attributed to a common ion effect
with Ca2+ leading to the precipitation of CaF2 . The presence of flyash eliminated any
influence of the FP ion, an effect attributed to the introduction of Fe3 +, a known inhibitor
of Ti corrosion, and to the presence of SiO 2 which would complex P thereby reducing its
free concentration drastically.
At FP concentrations of- 100 gg.g-g, Schutz and Grauman (1986) found that FP did not
influence the electrochemically-determined repassivation potentials for Ti-2, Ti-12 and
Ti-7 at 82°C for pH values as low as 1.5. Values remained > 7 V (vs SCE). Crevice
corrosion tests showed no susceptibility except at 177 0C, and for Ti-7 passivity was
maintained even at this temperature. In tests involving a galvanic couple to carbon steel,
only Ti-12 showed any significant H absorption. Some enhancement of H absorption
was noticed for Ti-7 galvanically-coupled to carbon steel, but only when the couple was
driven under oxidizing conditions and presumably when the additional demand for
cathodic current was partially met by proton reduction.
More general laboratory studies have concentrated on strongly acidic solutions, when the
influence of fluoride (as HF) is significant in the millimolar range (10-100 pgg'g-).
Wilhelmsen and Grande (1987) concluded that acidic fluoride (HF) stimulated the
passive dissolution of titanium at these concentrations but that the FP ion had no effect on
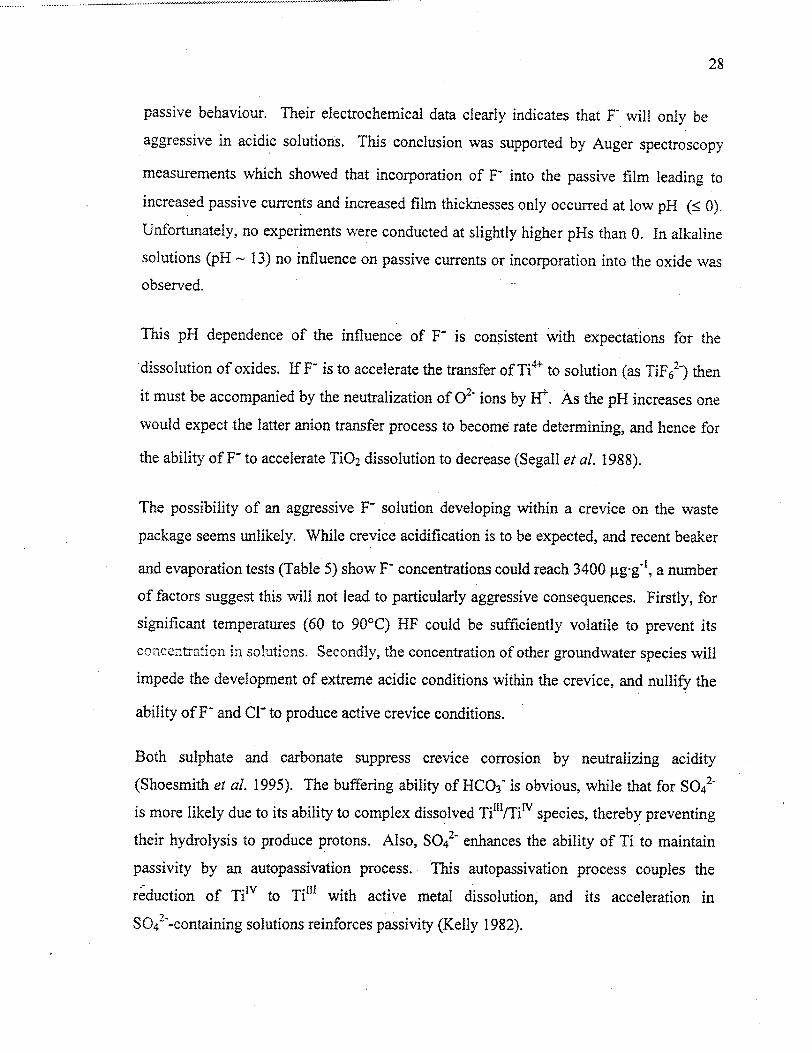
28
passive behaviour. Their electrochemical data clearly indicates that F" will only be
aggressive in acidic solutions. This conclusion was supported by Auger spectroscopy
measurements which showed that incorporation of P into the passive film leading to
increased passive currents and increased film thicknesses only occurred at low pH (< 0).
Unfortunately, no experiments were conducted at slightly higher pHs than 0. In alkaline
solutions (pH - 13) no influence on passive currents or incorporation into the oxide was
observed.
This pH dependence of the influence of F- is consistent with expectations for the
dissolution of oxides. If F- is to accelerate the transfer of Ti4÷ to solution (as TiF 62-) then
it must be accompanied by the neutralization of 02- ions by H+. As the pH increases one
would expect the latter anion transfer process to become rate determining, and hence for
the ability of F to accelerate TiO2 dissolution to decrease (Segall et al. 1988).
The possibility of an aggressive F- solution developing within a crevice on the waste
package seems unlikely. While crevice acidification is to be expected, and recent beaker
and evaporation tests (Table 5) show P concentrations could reach 3400 gg-g'-, a number
of factors suggest this will not lead to particularly aggressive consequences. Firstly, for
significant temperatures (60 to 90'C) HF could be sufficiently volatile to prevent its
concentration in solutions. Secondly, the concentration of other groundwater species will
impede the development of extreme acidic conditions within the crevice, and nullify the
ability of P and CI" to produce active crevice conditions.
Both sulphate and carbonate suppress crevice corrosion by neutralizing acidity
(Shoesmith et al. 1995). The buffering ability of HCO3 " is obvious, while that for S0 4a2
is more likely due to its ability to complex dissolved Till/TiWv species, thereby preventing
their hydrolysis to produce protons. Also, SO 42- enhances the ability of Ti to maintain
passivity by an autopassivation process. This autopassivation process couples the
reduction of Tilv to Ti"' with active metal dissolution, and its acceleration in
SO42--containing solutions reinforces passivity (Kelly 1982).
.... .. .........
29
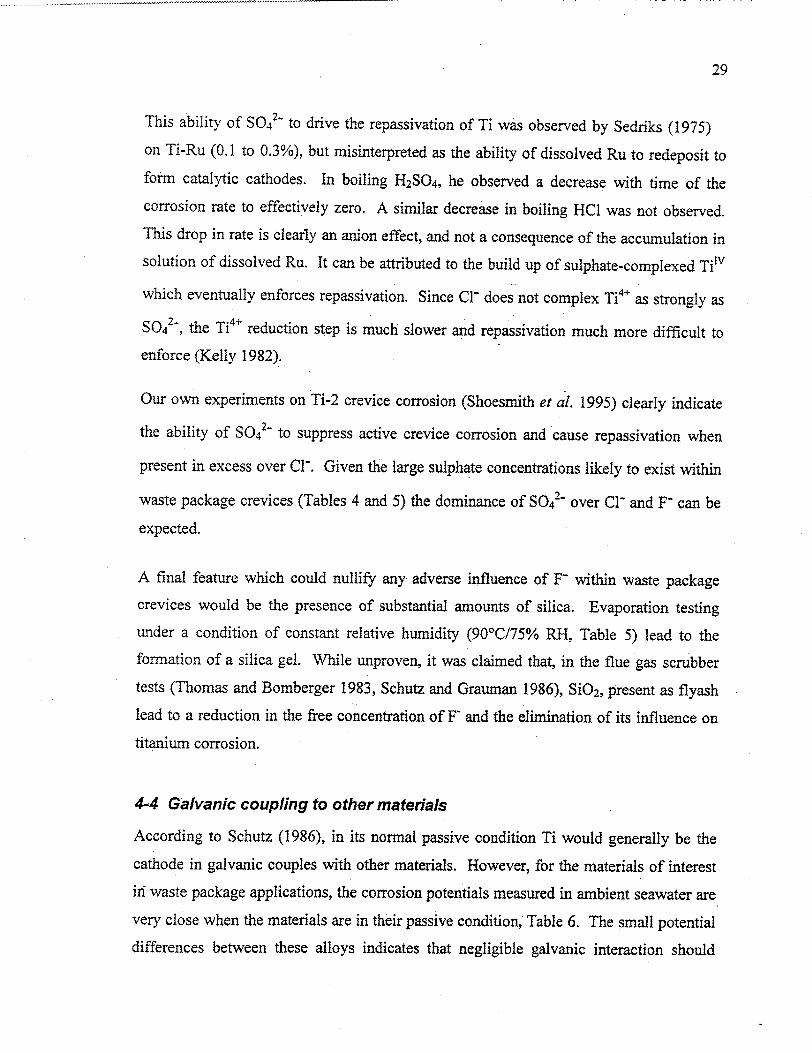
This ability of SO42- to drive the repassivation of Ti was observed by Sedriks (1975)
on Ti-Ru (0.1 to 0.3%), but misinterpreted as the ability of dissolved Ru to redeposit to
form catalytic cathodes. In boiling H2S04, he observed a decrease with time of the
corrosion rate to effectively zero. A similar decrease in boiling HCl was not observed.
This drop in rate is clearly an anion effect, and not a consequence of the accumulation in solution of dissolved Ru. It can be attributed to the build up of sulphate-complexed Ti"v
which eventually enforces repassivation. Since C1- does not complex Ti4+ as strongly as
S042-, the Ti4÷ reduction step is much slower and repassivation much more difficult to
enforce (Kelly 1982).
Our own experiments on Ti-2 crevice corrosion (Shoesmith et aL 1995) clearly indicate
the ability of S042- to suppress active crevice corrosion and cause repassivation when
present in excess over Cl'. Given the large sulphate concentrations likely to exist within
waste package crevices (Tables 4 and 5) the dominance of SOt42 over CI" and F- can be
expected.
A final feature which could nullify any adverse influence of F- within waste package crevices would be the presence of substantial amounts of silica. Evaporation testing
under a condition of constant relative humidity (90C/75% RH, Table 5) lead to the
formation of a silica gel. While unproven, it was claimed that, in the flue gas scrubber
tests (Thomas and Bomberger 1983, Schutz and Grauman 1986), SiO2 , present as flyash
lead to a reduction in the free concentration of F and the elimination of its influence on
titanium corrosion.
4-4 Galvanic coupling to other materials
According to Schutz (1986), in its normal passive condition Ti would generally be the cathode in galvanic couples with other materials. However, for the materials of interest
iii waste package applications, the corrosion potentials measured in ambient seawater are
very close when the materials are in their passive condition, Table 6. The small potential
differences between these alloys indicates that negligible galvanic interaction should

30
occur as long as passivity is maintained. Also, it is not surprising that, given the
similarity of expected potential values under passive conditions, Ti can sometimes
function as the anode as observed by Reclaru and Meyer (1998). Other factors important
in determining which is the anode and cathode in a galvanic couple include the relative
surface areas and geometry of the coupled materials as well as the conductivity of the
coupling environment. More generally Schutz (1988) has reported that the coupling of Ti
to many materials in hot chloride brines can often lead to an enhanced resistance to
crevice corrosion of the more crevice susceptible member of the couple. Such behaviour
was reported for nickel alloys (Monel, 625, C-276) and for stainless steels (304, 316).
Table 4. Galvanic Series in Flowing Seawater (4mrs) at 24'C (from Schutz (1986))
Wang et al. (1999) also reported that Ti-2 could form the anode or cathode when coupled
to various materials in hot (50'C to 90'C) 6% NaC1. Brass and alloy 600 were found to
anodically polarize Ti, while 316 stainless steel and Monel could polarize Ti either
anodically or cathodically depending on temperature and pH. However, the reliability of
•Iiesc iast results is wicernaia since it is not clear whether the pretreatment of the
specimens used in the experiments caused their surface hydriding or not, or whether
Material Corrosion Potential
(V vs SCE)
Ti -0.10
316 SS (passive) -0.05
304 SS (passive) -0.08
Alloy C (passive) -0.08
316 SS (active) -0.18
314 SS (active) -0.53

31
similarly polarized couples would be obtained for alternative geometries and coupled
surface areas.
Foroulis (1989) also found that Ti could form the anode or cathode in galvanic couples
depending on the aggressiveness of the solution to which the couple was exposed,
although the test environments used were not really relevant to waste repository
conditions. The tests were generally conducted in hot (80°C) acidic sulphate and
sulphidic solutions (pH = 0.5 to 5) or in ammonium sulphide solutions (pH 9-10.6).
Whether or not the Ti was the anode or cathode depended on whether chlorides or
cyanides were present. When these ions were present Ti tended to be more cathodic by
200 to 300 mV. This was attributed to the loss of passivity on the coupled material due,
in this case to the breaking of a sulphide film, when CI" was present. In sulphidic
solutions containing CN" and CIE, the Ti tended to be cathodic and the corrosion rates of
carbon steel, 304 stainless steel and 1-600 were enhanced by a factor of 1 to 2. In
solutions free of CN-, Ti was anodic to these materials and no adverse corrosion effects
were observed on either of the materials in the couple.
What is clear from this discussion is that galvanic couples involving Ti and other passive
materials are unlikely to lead to significant corrosion of either material. The prospect of a
galvanic couple between titanium and alloy-22 leading to any significant damage of
either material can be judged remote. However, given the corrosion potential for 304
stainless steel when active in seawater (Table 6) the possibility of Ti being the cathode in
a couple with this material is a possibility in an acidified crevice containing a
concentrated groundwater, eg., SAW in Table 3. Whether or not stainless steel can
become active under these conditions remains to be determined. For significantly
negative potentials (-0.53 V vs SCE, Table 6) to be established would require the active
crevice corrosion of the stainless steel not just the establishment of low density pitting, a
condition for which such negative potentials should not be established. However, it
would be judicious, given this possibility, to choose a stainless steel resistant to crevice
corrosion, if the possibility of a crevice with Ti is unavoidable.

5 SUMMARY AND CONCLUSIONS
The possible failure processes, crevice corrosion, pitting and hydrogen-induced cracking (HIC) have been reviewed for the candidate titanium alloys (Ti- 12, Ti- 16 and Ti-7) under anticipated conditions in the Yucca Mountain nuclear waste repository. Both pitting and crevice corrosion are extremely remote possibilities under these conditions for these alloys. For Ti-12 it is possible that a limited amount of crevice corrosion could occur but repassivation has inevitably been observed after - 1 mm of penetration in even the most
aggressive of saturated brines.
All three alloys could suffer hydrogen absorption making the possibility of hydrogeninduced cracking worth investigation. Based on slow strain rate testing of pre-hydrided compact tension specimens, both Ti-12 and Ti-16 have been shown capable of tolerating a substantial hydrogen concentration before any decrease in fracture toughness is
observed. For Ti-12 the fracture toughness starts to decrease once the hydrogen content
reaches a value of- 400 ag-g"', whereas for Ti-16 this threshold is at least - 1000 jtg-g'.
It may be larger for Ti-16 but testing has so for been limited.
The feature which determines whether this degradation in fiacture toughness will lead to waste package failuZ- is the rate of hydrogen absorption by the alloy. For the commercially pure Ti-2 hydrogen absorption is extremely slow, and probably negligible, for potentials more positive than -0.6 V (vs SCE). This potential coincides with that required to induce the redox transformation, Ti4+ to Ti3 +, in the passive TiO 2 oxide, a process that renders the oxide conductive and permeable to hydrogen. Generally, such a potential is only achieved when titanium is over-protected cathodically, or galvanically
coupled to an actively corroding metal such as carbon steel.
However, the presence of intermetallics in the alloys being considered (and possibly also
P3-phase in Ti-12) could allow hydrogen absorption into the metal at potentials less negative than this -0.6 V threshold. Both Ti-12 and Ti-7 have been shown to absorb hydrogen at potentials above this threshold, but the few experiments performed to date on Ti-16 indicate that no absorption occurs until < -1.OV. This last alloy definitely contains many randomly dispersed intermetallic particles. To date their identity has not been

33
elucidated, and why they do not appear to act as hydrogen absorption sites not
determined.
From this review it was concluded that the only feasible failure mechanism for these titanium alloys would be hydrogen absorption leading to HIC within an acidified crevice under passive conditions. For this to occur the titanium would need to act as a cathodic site and would require a coupled cathode. The titanium could supply its own anode in
two ways.
(1) The intermetallic could be corrosive under' the acidified crevice conditions thereby acting as both anode and cathode. The intermetallic Ti2Ni (in Ti-12) has been demonstrated capable of acting in this manner and Ti-12 has been shown to more readily absorb hydrogen than the commercial alloy Ti-2. However, the intermetallic particles in Ti- 16 appear to be inert, a claim based on impedance
measurements. Consequently, they would not be expected to be corrosive in the
same manner as Ti2Ni in Ti-12, and hence incapable of providing an anodic site.
(2) The presence of F" in the concentrated groundwaters anticipated at Yucca
Mountain could accelerate passive dissolution, and hydrogen could be absorbed at the cathodic intermetallic site. For this to be feasible, the pH would have to be 0] 3
(for Ti-2) with substantial amounts of F present. The evidence from dental and flue gas scrubber experiments indicates that this can occur but is unlikely in the presence of the other groundwater anions expected to be present, particularly SO 4
2- and HC0 3", and in the presence of substantial amounts of silica. These last
three species inhibit the development of acidity within crevices and, in the case of silica, appear to remove F- from the solution. There is also the possibility that, under acidic elevated temperature conditions, F- may be removed as the volatile
HF. For the alloy Ti-12, a pH < 1.5 appears necessary before F exerts any measurable influence on the passive corrosion rate. Although not tested one would, therefore, expect an even lower pH threshold for the Ti-16 and Ti-7 alloys.
While one can be optimistic that, at the levels anticipated on the waste packages in
Yucca Mountain, F- will not exert a significant influence on the corrosion of Ti-
..... . .....

34
12, Ti-7 and Ti-16, definitive proof that this anion will have no influence is
presently unavailable.
The third potential anode would be provided by the coupling of a more active material
to the passive titanium. Within the present waste package design this would be either
Alloy 22 or 316L stainless steel. If all the three materials remain passive, then it is
possible the Ti alloys could be either anodes or cathodes in the couple. Evidence
exists to show both combinations are possible and that the activities of the couples are
generally innocuously low. However, the test environments have not been as
aggressive as those anticipated at Yucca Mountain. While it is unlikely that Alloy 22
will form an active anode, the possibility cannot presently be ruled out with stainless
steels. In environments where the passivity of the stainless steel can be degraded
(sulphidic environments have been tested), galvanic couples to Ti were observed and
the steel corrosion rates accelerated, but only by a factor of 1 to 2.
The formation of such a galvanic couple would be expected to lead to the absorption
of hydrogen by the Ti-12 and Ti-7 alloys but possibly not by the Ti-16 alloy. For Ti
12, absorption would be expected to be more extensive than with the other alloys, and
the transport of absorbed hydrogen into the bulk of the alloy facilitated by the
presence of P3-phase ligaments along predominantly a-phase grain boundaries. Since
the efficiency of hydrogen absorption decreases as the Pd content of the alloy
decreases, Ti-16 would be expected to absorb hydrogen less readily than the Ti-7
alloy. Indeed, some speculative evidence exists suggesting that the intermetallic
particles presence in Ti- 16 may prevent absorption.
Based on these studies the order of preference of these alloys as candidate materials
for waste packages at Yucca Mountain would be
Ti-16 [] Ti-7 >> Ti-I2
However, before a confident recommendation that Ti-16 be chosen over Ti-7, a real
understanding of the presently baffling behaviour of the intermetallic particles in this
material is required.

35
REFERENCES
T. Watanabe. T. Shindo and H. Naito. 1988. Effect of iron content on the breakdown
potential for pitting of titanium in NaCi solutions. In Proceedings of the Sixth World
Conference on Titanium, Cannes, France, 1988, June 6-9, 1735-1740.
S. Kitayama, Y. Shida and M. Oshiyama. 1990. Development of new crevice corrosion
resistant Ti alloys. Sumitomo Search 41, 23-32.
T. Shibata and Y.-C. Zhu. 1995. The effect of film formation conditions on the structure
and composition of anodic oxide films on titanium. Corrosion Science 37(2), 253-270.
J. L. Gilbert and J. J. Jacobs. 1997. The mechanical and electrochemical processes
associated with taper fretting crevice corrosion: A review. In Modularity of Orthopedic
Inplants (editors D. E. Marlowe, J. E. Parr and M. B. Mayor) ASTM STP 1301, 45-59,
American Society for Testing and Materials, Philadelphia, PA.
J. J. NoeI. 1999. The electrochemistry of titanium corrosion. Ph. D. Thesis, University
of Manitoba.
R. Greef, R. Peat, L.M. Peter, D. Pletcher, J. Robinson. 1985. Instrumental methods in
Electrochemistry. Ellis Horwood Ltd. Chichester, U. K.
T. M. Murai, M. Ishikawa and C. Miura. 1977. Absorption of hydrogen and titanium
under cathodic polarization. Boshoku Gijutsu. 26, 177-183.
T. R. Beck. 1973. Electrochemistry of freshly-generated titanium surfaces - I. Scraped
rotating-disk experiments. Electrochimica Acta 18, 807-814.
S-I Pyun and Y-G Yoon. 1996. Hydrogen transport through TiO2 films prepared by
plasma enhanced chemical vapour deposition (PECVD) method. In Hydrogen Effects in
Materials (edited by A. W. Thompson and N. R. Moody), The Minerals, Metals and
Materials Society, 261-269.
~~~~~~~~~~~~~~ .. ...... '••... .••= •= •I•••i•• .. ........... -- •....

36
Z. Tun, J. J. Noel and D. W. Shoesmith. 1999. Electrochemical modification of the
passive oxide layer on a Ti film observed by in-situ neutron reflectometry. J.
Electrochem. Soc. 146, 988-994.
C. F. Clarke, D. Hardie and B. M. Ikeda. 1994. the effect of hydrogen content on the
fracture of pre-cracked titanium specimens. Corrosion Science 36, 487-509.
C. F. Clarke, D. Hardie and B. M. Ikeda. 1995. Hydrogen induced cracking of Grade-2
titanium, Atomic Energy of Canada Ltd. Report, AECL- 11284, COG-95 -113.
D. W. Shoesmith, D. Hardie, B. M. Ikeda and J. J. Noel. 1997. Hydrogen absorption and
the lifetime performance of titanium nuclear waste containers. Atomic Energy of Canada
Ltd. Report, AECL-1 1770, COG-97-035-I.
J. J. Nodl, M. G. Bailey, J. P. Crosthwaite, B. M. Ikeda, S. R. Ryan and D. W. Shoesmith.
1996. Hydrogen absorption by Grade-2 Titanium. Atomic Energy of Canada Ltd.
Report, AECL-1 1608, COG-96-249.
R. W. Schutz and D. E. Thomas. 1987. Corrosion of titanium and titanium alloys. In
Metals Handbook, Ninth edition, volume 13 (corrosion), ASM International, Metals Park,
OH, 669-706.
D. W. Shoesmith and B. M. Ikeda. 1997. The resistance of titanium to pitting,
microbially induced corrosion, and corrosion in unsaturated conditions. Atomic Energy
of Canada Ltd. Report, AECL-1 1709, COG-95-557-1.
F. A. Posey and E. G. Bohlman. 1967. Pitting of titanium alloys in saline waters.
Desalination 3, 269-279.
T. Koizumi and S. Furuya. 1973. Pitting corrosion of titanium in high temperature
halide solution. In Proceedings of the Second International Conference; Titanium
Science and Technology (edited by R. I. Jaffe and H. M. Burte), Plenum Press, New
York, NY, 2383-2393.

37
N. R. Sorensen. 1990. Laboratory studies of the corrosion and mechanical properties
of titanium Grade-12 under WIPP repository conditions. In Corrosion of Nuclear Fuel Waste Containers. Proceedings of a Workshop, Winnipeg, Feb. 9-10 (1988) (edited by
D. W. Shoesmith), Atomic energy of Canada Ltd. Report, AECL- 10121, 29-44.
T. Kido and S. Tsujikawa. 1989. Effect of Ni and Mo on initial conditions for crevice
corrosion of low alloy titanium, Japanese J. of Iron and Steel, 75(8), 96-.
E. van der Lingen and H. de villiers Steyn. 1994. Titanium Applications Conference,
Boulder, CO, Oct. 2-5, 1994, Titanium Development Association, Boulder, CO, USA,
450-461.
A. J. Sedriks. 1975. Corrosion resistance to Ti-Ru alloys. Corrosion 31(2), 60-65.
G. K. Hubler and E. McCafferty. 1980. The corrosion behaviour and RBS analysis of
Pd-implanted titanium. Corrosion Science, 20, 103-116.
R. D. Armstrong, R. E. Firman and H. R. Thirsk. 1973. Ring-disc studies of Ti-Pd alloy
corrosion. Corrosion Science 13, 409-420.
R. E. Westerman. 1990. Hydrogen absorption and crevice corrosion behaviour of
titanium Grade-12 during exposure to irradiated brine at 150°C. In Corrosion of nuclear fuel waste containers: Proceedings of a workshop. Atomic Energy of Canada Ltd.
Report, AECL-10121, 67-84.
J. B. Cotton. 1967. The role of palladium in enhancing corrosion resistance of titanium.
Platinum Metals Rev. 11, 50-52.
K. Satoh, K. Shimogori and F. Kamikubo. 1987. The crevice corrosion resistance of
some titanium materials. A review of the beneficial effects of palladium. Platinum
Metals Review, 31(3), 115-121.
A. J. Sedriks, J. A. S. Green and D. L. Novak. 1972. Electrochemical behaviour of Ti-Ni
alloys in acidic solutions. Corrosion 28(4) 137-142.
---------------

38
J. A. Hall, D. Banerjee and T. L. Wardlaw. 1985. The relationships of structure and corrosion behaviour of TiO.3MoO.8Ni (Ticode-12). In Titanium, Science and Technology, Proceedings of the Fifth International Conference of Titanium (edited by G. Litijering, U. Zwickler and W. Bunk), Sept. 10-14 (1984), Munich, Germany, 2603-2610.
B. M. Ikeda, M. G. Bailey, D. C. Cann and D. W. Shoesmith. 1990. Effect of iron
content and microstructure on the crevice corrosion of.Grade-2 titanium under nuclear waste vault conditions; In Advances in Localized Corrosion (edited by H. S. Isaacs, U.
Bertocci, J. Kruger and S. Smialowska), 439-444, NACE International, Houston, TX.
D. W. Shoesmith, F. King and B. M. Ikeda. 1995. An assessment of the feasibility of indefinite containment of Canadian nuclear fuel wastes. Atomic Energy of Canada Ltd.
Report, AECL-10972, COG-94-534.
M. G. Bailey, B. M. Ikeda, M. J. Quinn and D. W. Shoesmith. 1996. Crevice corrosion
behaviour of titanium Grades-2 and -12 in hot aqueous chloride solution - The effect of
chloride concentration. Atomic Energy of Canada Ltd. Report, AECL-10971, COG-95
279.
B. M. Ikeda, M. G. Bailey, C. F. Clarke and D. W. Shoesmith. 1989. Crevice corrosion of titanium under nuclear fuel waste conditions, Atomic Energy of Canada Ltd. Report,
AECL-9568 (1989).
B. M. Ikeda, R. C. Styles, M. G. Bailey and D. W. Shoesmith. 1994. The effect of
material purity on crevice corrosion of titanium in NaCI solution. In Compatibility of Biomedical Implants, (edited by P. Kovacs and N. S. Istephanous), Electrochemical
Society Proceedings, Vol. 94-15, Electrochemical Society, Pennington, NJ, 368-380.
J. B. Cotton. 1970. Using titanium in the chemical plant. Chemical Engineering
Progress, 66(10), 57-62.
L. C. Covington. 1979. The influence of surface condition and environment on the
hydriding of titanium. Corrosion 35(8), 378-382.

39
T. Murai, M. Ishikawa and C. Miura. 1977. Absorption of hydrogen into titanium
under cathodic polarization. Boshoku Gijutsu 26, 177-183.
T. Shibata and Y.-C. Zhu. 1994. The effect of film formation temperature on the
stochastic processes of pit generation on anodized titanium. Corrosion Science 36(10),
1735-1749.
E. J. Kelly. 1979. Anodic dissolution and passivation of titanium in acidic media. J.
Electrochem. Soc. 126, 2064-2074.
T. Watanabe, M. Kondo, H. Naito and K. Sakai. 1989. Electrochemical properties and
corrosion characteristics of titanium in chloride solutions. Nippon Steel Technical Report
39/40, 29-35.
D. J. Blackwood, L. M. Peter and D. E. Williams. 1988. Stability and open circuit
breakdown of the passive oxide film on titanium. Electrochimica Acta 33, 1143-1149.
T. Ohtsuka, M. Masuda and N. Sato. 1987. Cathodic reduction of anodic oxide films
formed on titanium. J. Electrochem. Soc. 134, 2406-2410.
A. J. Sedriks. 1975. Corrcs'ncnj:.Sitance of Ti-Ru alloys. Corrosion, 31, 60-65.
R. W. Schutz. 1986. Titanium. In Process Industries Corrosion. The Theory and
Practice, National Association of Corrosion Engineers, Houston, TX, 503-527.
R. W. Schutz. 1988. Titanium alloy crevice corrosion: Influencing factors and methods
of prevention. In Proceedings of the Sixth International Conference on Titanium, (edited
by P. Lacombe, R. Tricot and G. Beranger) June 6-9, 1988, Cannes, France. Societd
Frangaise de Mdtallurgie, Les Ulis Cedex, France; Vol. IV, 1917-1922.
Z. W. Wang, C. L. Briant and K. S. Kumar. 1999. Electrochemical, galvanic, and
mechanical responses of Grade-2 Titanium in 6% sodium chloride solution. Corrosion,
55, 128-138.
...........

40
Z. A. Foroulis. 1989. Corrosion and hydrogen embrittlement of titanium in aqueous
sulphate and sulphidic solutions. Anti-corrosion Methods and Materials, June 1989, 4-9.
W. Wilhelmsen and A. P. Grande. 1987. The influence of hydrofluoric acid and fluoride
on the corrosion and passive behaviour of titanium. Electrochimica Acta 32, 1469-1474.
R. L. SegalI, R. St. C. Smart and P. S. Turner. 1988. Oxide surfaces in solution. In
Surface and Near-surface Chemistry of Oxide Materials (edited by J. Nowotny and L.-C.
Dufour), Elsivier Science Publishers, Amsterdam, 527-576.
D. W. Shoesmith, B. M. Ikeda, M. G. Bailey, M. J. Quinn and D. M. LeNeveu, 1995. A
model for predicting the lifetimes of Grade-2 titanium nuclear waste containers. Atomic
Energy of Canada Ltd. Report, AECL-10973, COG-94-558.
E. J. Kelly. 1982. Electrochemical behaviour of titanium. In Modem Aspects of
Electrochemistry (edited by J. 0. M. Boikrs, B. E. Conway, and R. E. White), Plenum
Press, New York, 14, 319-424.
H. Mattson and I. Olefjord. 1990. Analysis of oxide formed on Ti during exposure in
bentonite clay-I. The oxide growth. Werkstoffe and Korrosion, 41, 383-390.
H. Mattsson, C. Li and I. Olefjord. 1990. Analysis of oxide formed on Ti during
exposure in bentonite clay-II. The structure of the oxide. Werkstoffe and Korrosion 41,
578-584.
R. W. Schutz. 1996. Ruthenium enhanced titanium alloys. Minor ruthenium additions
produce cost effective corrosion resistant commercial titanium alloys. Platinum Metals
Rev. 40(2), 54-61.
D. W. Shoesmith and F. King. 1999. The effects of gamma radiation on the corrosion of
candidate materials for the fabrication of nuclear waste packages. Atomic Energy of
Canada Ltd. Report. AECL- 11999.
L. Reclaru and J-M. Meyer. 1988. Effects of fluorides on titanium and other dental
alloys in dentistry. Biomaterials 19, 85-92.
. ......... .. ...........
41
D. E. Thomas and H. B. Bomberger. 1983. The effect of chlorides and fluorides on
titanium alloys in simulated scrubber environments. Materials Performance, Nov. 1983,
29-36.
R. W. Schutz and J. S. Grauman. 1986. Corrosion behaviour of titanium and other alloys
in laboratory FGD scrubber environments. Materials Performance, April 1986, 35-42.
US Department of Energy, Office of Civilian Radioactive Waste Management. 1988.
Viability Assessment of a Repository at Yucca Mountain; volume 3: Total System
Performance Assessment, DOE/RW-058/V3, Yucca Mountain Site Characterization
Office, North Las Vegas, NV.
R. A. Van Konynenburg, R. D. McCright, A. K. Roy and D. A. Jones. 1988. Engineered
Materials Characterization Report for the Yucca Mountain Site Characterization Project.
Lawrence Livermore National Laboratory Report, UCRL-ID-1 19564.
S. Kudelka, A. Michaelis and J. W. Schultze. 1995. Electrochemical characterization of
oxide layers on single grains of a polycrystalline Ti-sample. Ber. Bunsenges. Phys.
Chem. 99, 1020-1027.
R. W. Schutz and M. Xiao. 1993. Optimized Lean-Pd titanium alloys for aggressive
reducing acid and halide service environments. Proceedings of 12 'h International
Corrosion Congress, Sept. 1993, Vol. 3A, 1213-1225, NACE International, Houston, TX.
Y. Shida and S. Kitayama. 1988. Effect of Pd addition on the crevice corrosion
resistance of titanium. Proceedings of 6th International Conference on Titanium, 1988.
P. McKay. 1987. Crevice corrosion kinetics on titanium and a Ti-Ni-Mo alloy in
chloride solutions at elevated temperature. In Corrosion Chemistry Within Pits Crevices
and Cracks (edited by A. Turmbull) National Physical Laboratory, Teddington, UK, 101
127.
R. S. Glass. 1983. Effect of intermetallic Ti2Ni on the electrochemistry of Ticode-12 in
hydrochloric acid. Electrochimica Acta, 28(11), 1507-1513.

42
LEGENDS TO FIGURES
Figure 1. Summary of the changes expected in passive oxide properties as a function of
pH, potential and temperature.
Figure 2. Critical crevice temperatures for Ti- 12, Ti- 16 and Ti-7, and the closely related
Ti-Ru alloy, determined in a number of aggressive acidic and extremely oxidizing
chloride environments (reported from Schutz (1995)).
Figure 3. Coupled currents (IQ) and crevice potentials (Ec) measured in 0.27 mol-L-1
NaCl on artificially formed crevices of various Ti-alloys: (A) Ti-2 (Fe-0.024 wt%) at
150'C; (B) Ti-2 (Fe-0.13 wt%) at 150'C; (C) Ti-12 at 150'C; (D) Ti-16 at 100°C (from
Shoesmith et aL. 1997).
Figure 4. Weight changes due to crevice corrosion for Ti-2 ((, low iron content), Ti-2 (o,
high iron content) and Ti-12 (±) as a function of chloride concentration at 150'C (from
Bailey et al. 1996)
Figure 5. Schematic illustrating the polarization curve for titanium and its relationship to
the cathodic polarization curves for proton reduction on Ti-2 and on a titanium alloy
containing a catalytic alloying element (e.g., Ti-12, Ti-16).
Figure 6. Schematics illustrating the two mechanisms proposed to explain the crevice
corrosion resistance conferred on Ti by alloying with Ni (Ti- 12) or Pd (Ti-7, Ti- 16):
(A) redeposition of dissolved alloying element to produce a galvanically-coupled
catalytic site for H+ reduction;
(B) galvanic coupling of an inert catalytic site for H+ reduction.
Figure 7. Schematic illustrating the anodic ennoblement of a Pd-containing Ti-alloy due
to surface enrichment by Pd of temporarily active or passive sites.
Figure 8. Summary of the effect of various parameters on the pitting potential for Ti
(from Shoesmith et al. 1997)

43
Figure 9. Variation of the critical stress intensity factor with hydrogen content for Ti
2 (transverse-longitudinal (T-L) orientation): o - slow crack growth (Ks); e - fast fracture
(KH) (from Clarke et al. 1994).
Figure 10. Schematic showing the combinations of stress intensity factor and hydrogen
concentration leading either to fast crack growth (brittle failures (KH)), slow crack growth
(Ks) due to either sustained load cracking or ductile rupture, or to no failure (from
Shoesmith et al. 1995).
Figure 11. The hydrogen absorption rate as a function of applied potential measured on
Ti-2 electrodes in flowing artificial seawater with a flow velocity of 2.0 ms" at 30'C
(from Murai et al. 1977).
Figure 12. Schematic illustrating the cathodic transformations occurring in TiO2 films
which lead to the absorption of hydrogen.
Figure 13. Profiles of scattering length density (SLD) as a function of depth recorded by
in-situ neutron reflectometry on an anodically treated (2.OV) sputter-deposited Ti film in
neutral 0.2 mol-L'NaCl. While the SLD was being measured the electrode was
potentiostatted at the indicated potentials. The differently shaded areas show the oxide
region free of hydrogen and that containing hydrogen (from Tun et al. 1999).
Figure 14. The ratio of the input current to output current as a function of the potential
applied across a TiO2,1ayer deposited on Pd metal. The ratio was measured in 0.1 mol.L"
NaOH. The input current is the current measured for H+ reduction at the TiO2/solution
interface. The output current is that measured for H oxidation across the Pd/solution
interface (from Pyun and Yoon 1996).
Figure 15. Schematic illustrating the low efficiency of hydrogen absorption under
passive conditions and the possibility of a much more highly efficient absorption process
through catalytic intermetallic windows in the passive oxide.
Figure 16. Schematic illustrating how the corrosion of a Ti2Ni intermetallic particle can
lead to the absorption of hydrogen and how the presence of P-phase ligaments along ct-
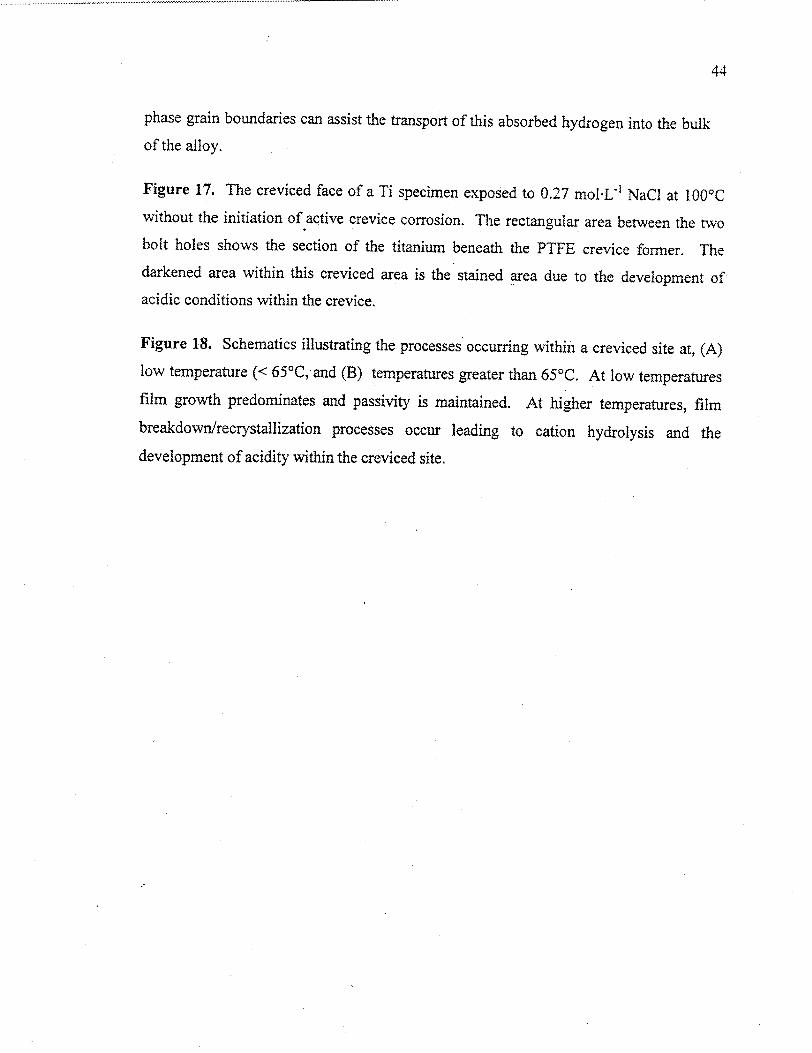
44
phase grain boundaries can assist the transport of this absorbed hydrogen into the bulk
of the alloy.
Figure 17. The creviced face of a Ti specimen exposed to 0.27 mol.L"1 NaCI at 100°C without the initiation of active crevice corrosion. The rectangular area between the two bolt holes shows the section of the titanium beneath the PTFE crevice former. The darkened area within this creviced area is the stained area due to the development of
acidic conditions within the crevice.
Figure 18. Schematics illustrating the processes occurring within a creviced site at, (A)
low temperature (< 65°C, and (B) temperatures greater than 65°C. At low temperatures film growth predominates and passivity is maintained. At higher temperatures, film
breakdown/recrystallization processes occur leading to cation hydrolysis and the
development of acidity within the creviced site.
.. ........... ..........

45

Crevice, Fi Corrosion •Development of Acidity/
SOxide Dissolution
Active Corrosion Under W
Occluded Conditions
4Ti3÷ Dissolution in Acidic Solution
Ti"v --- Til' (Oxide)
Im Brea kdown/Recrystallization/ Ranid Thickening
TTemperature
Rutile, Formation H2O
Absorption
Till, (-1.0 V) TiOOH (-0.65 V) (-0.54 V) E,,, iO 2 (8-9 V)
4 A L t I - A.s..
112 Evolution H Absorption In Metal
Threshold for H Absorption
In Oxide
(Tiu,' P" V - yst"llin) (Tilmt, Ov") iatta Foakrmaion
Film Growth (HFIC) Film Breakdown/ SRecrystallization/ ND Decreases Rapid Thickening
Hydrogen-Induced Cracking EFB (Acidic Solution)
46
Figure 1
n esiC

400
J 350 0
o.300
250
._o 200
"¢ 150
S100
C) 50
020% NaCi pH=2 (aerated)
25% NaCI pH=3 (deaerated)
10% FeCI 3 or 20% NaCI (C12 sat'd) pH=2
Figure 2
47

48
5.2 40 Z - 4 U)
IvC
3.9 -120 C 1 0
2.6 -280 C 0- 0
0
-440 'S
80 160 240 Time /h
600 +180 iU
400 +20 E C
CU
200 14.. 0 C o 0
o0
60 120 Time /h
Figure 3A and 3B

Crevice Current (Ig) (pA)
-4 0 0 4)
0
Crevice Current (Ij) (pA)
Cl' 0
0=
-4
0
0
-4
00 0 0 -4
0
04
Crevice Potential (Ej) (mV vs. SHE) Crevice Potential (Eq) (mV vs. SHE)
.1b
4:4

600
500
400
300
200
100
0 0 1 2 3 4
Chloride concentration (molL-1)
Figure 4
50
5
o..--.......- ............. - -- .......

51

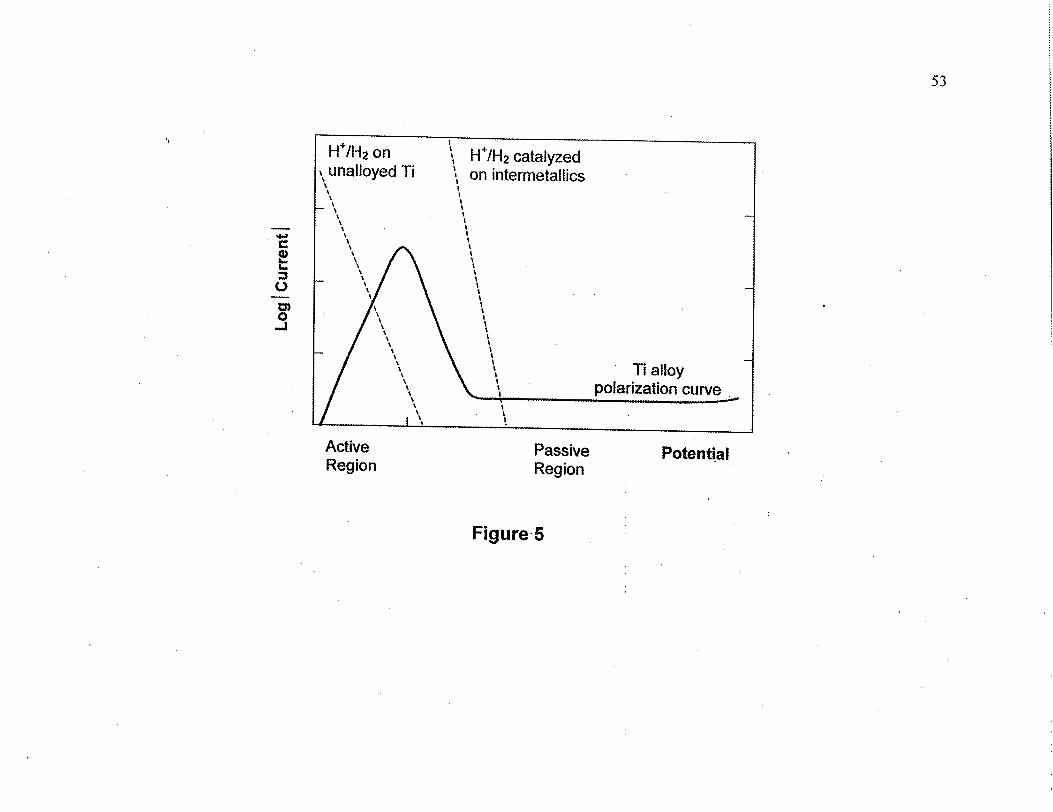
I I I \
0
I It Ti alloy I polarization curve
Active Passive Potential Region Reaion
Figure-5
53
v

54
A H2 "Ni2+
• k•L .. TiO2
Hi2
i B
Figure 6
........................... 1- 1
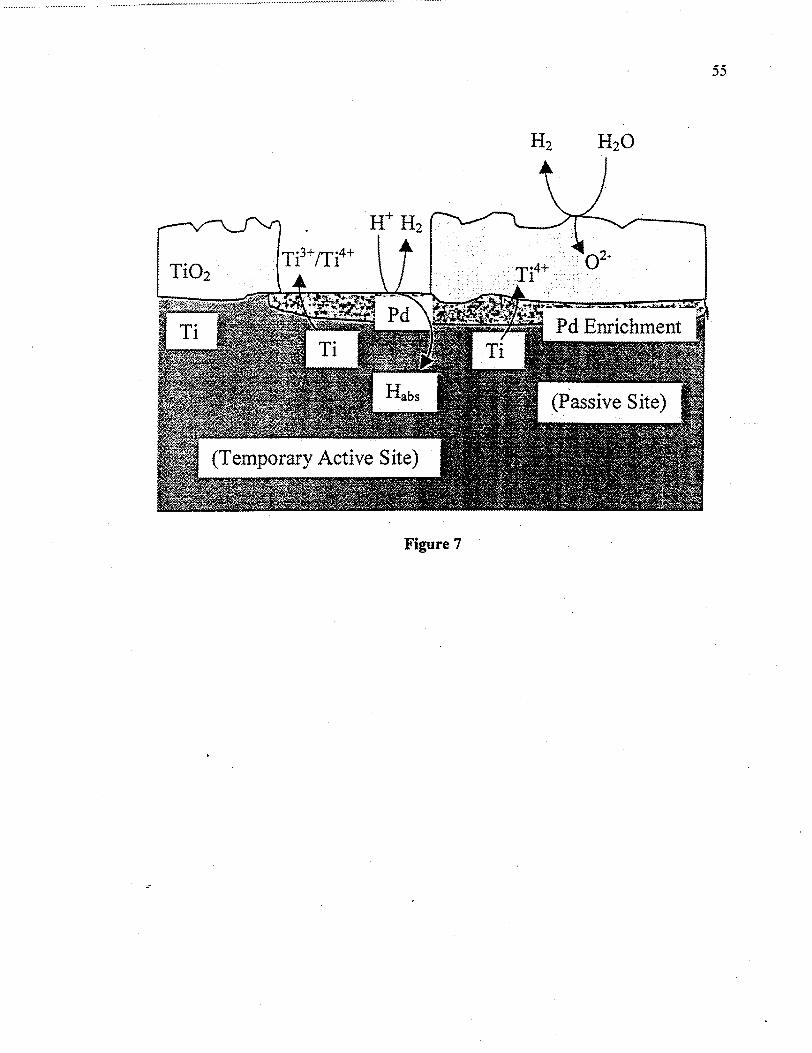
55
H2
Figure 7

0
Range of Corrosion Potentials Expected Under Waste Vault
Conditions
2 4
Potential (V vs. Si
68
CE) T
Pitting Potential (Measured Electrochemically as a
Repassivation Potential) in 0.5 mol-L-1 NaCi at 100°C
Figure 8
56
. .V for 10 [CI'] 1 > 10V at 500C
2V for 6AI4VTI
High , Low Fe Fe
Ni, Mo, Pd
I All
-2

57
100 1 T
a 80 0
0 L
0 0 0 LL 60 - 0 K
0 0 0 0. 00
-- 40
U) U)
Q00
o 20 Slow Crack Ductile Rupture Growth Foled ra
by Fast Crack Growth Only Growth
I I 0 .. . I II I I I .I
0 200 400 600 800 1000 1200
Hydrogen Concentration (pgog 1)
F4 gur-. 9

KH
At Slow " Crack Fast
Growth Fracture LL
IIi Hn
[H]0 Hydrogen Concentration-*
Figure 10
58

59
4
I;:
$ 3
CL
0
'c: 2
1~
1I
-0.6 -0.8 -1.0 -1.2
Applied Potential (V.vs SCE)
Figure 11
-- -.......... - ..... . ......

60
Water Reduction
H20 H2 Aqueous Environment
Passive Oxide
Figure 12

Hydrogen-free oxide.Hydrogen-containing oxide
6 C
.I
0
"0 U-
0 200 400 S00 800 0 200 400 600 800
Depth (A)
Figure 13
61
-0.4V
3
2
1
0
-1
-2
3
2
0
-~1
-2
0 200 400 600 Soo
3
-0 qV 2,
0 200 400 600 800
0
-1

0.4
0.3
0.2
0.1
0.0 -1300 -1200 -1100
Applied Potential (mV vs SCE)
Figure 14
62
0� C
0� I.
0
-1000

E >-0.6 V E <-0.6 V
HW H2
Figure 15
63

64

65
Figure 16

67
A. LOW TEMPERATURES
Crevice gap
B. TEMPERATURE > 65 0C
Crevice gap
Ti4+
Ti(OH)x(4-y-' +
xH"
Figure 18

68
APPENDIX A
THE PROPERTIES OF ALLOYING ELEMENTS IN a-TITANIUM
ALLOYS AND THEIR ABILITY TO CATALYZE HYDROGEN
ABSORPTION
While the addition of alloying elements such as Ni (in-Ti-12) and Pd (in Ti-16 and Ti-7)
are generally beneficial in maintaining the passivity of the alloys their cathodic properties
make them potential catalysts for hydrogen absorption into the alloy.
A substantial body of evidence exists to show that the presence of these alloying elements
leads to the absorption of hydrogen. Based on polarization curves determined in acidic
solutions, Figure Al, Glass (1983) clearly showed that Ti2Ni and titanium could couple
galvanically. In a subsequent experiment, in which commercially pure Ti was coupled to
Ti2Ni in boiling HC1, he showed that the dissolution of Ti was accompanied by the
embrittlement of the Ti2Ni, and concluded that the cathodic kinetics on Ti-12 (containing
Ti2Ni) would be dominated by Ti2Ni providing a sufficient surface area of the
intermetallic were available. Okada (1983) showed that Ni-plated (by electrodeposition)
or Pt-coated (by sputter deposition) titanium electrodes readily absorbed hydrogen for
pH 0 3, efficiencies of up to 60% being obtained in acidic solutions at 25°C, Figure A2.

electrochemical desorption step consistent with the catalytic behaviour observed on
noble metals such as Pd (Greef et al. 1985). This observation of catalyzed proton
reduction at less negative potentials is clear evidence that the need for redox
transformations in the oxide is not a prerequisite for proton absorption into the metal
matrix. The behaviour observed is consistent with the existence of intermetallics, rich in
noble metal content, which can function as "hydrogen windows" in the oxide.
Schutz and Xiao (1993) observed similar effects for proton reduction on Ti-2, Ti-7, and
Ti-16. The Tafel slope for Ti-16 (100 mV"l) was larger than that obtained for Ti-7
(80 mV-1) indicating that the ability to catalyze proton reduction decreases as the Pd
content of the titanium decreases.
This is consistent with the observation of Fukuzuka et al. (1980), that the efficiency of H
absorption into the Ti also decreases with decreasing Pd content, Figure A3. As shown in
the figure, the difference in measured absorption efficiency between Ti-2 and Ti-7 is less
than a factor of 5 over the measured region. An even lower difference would be expected
between Ti-2 and Ti-16.
Our own cathodic polarization studies on Ti-2, Ti-12 and Ti-16 specimens have shown
interesting differences in the hydrogen absorption behaviour of these alloys. Figure A4
shows cathodic polarization curves recorded potentiostatically on Ti-2 in 0.27 mol.L"U
NaCL (pH ~ 1) at 95°C (Noal et al. 1996). In a separate set of experiments, the amount of
hydrogen absorbed as a function of applied potential was measured. The hydrogen
absorption behaviour can be separated into two distinct regions, denoted A and B on the
figure. In region A (> -0.6 V) no hydrogen absorption into the metal was observed, while
72
for more negative potentials in region B it was. This observation is consistent with the
demonstrated existence of a hydrogen absorption threshold at (- -0.6 V) (Murai et al.
1977) discussed above (Figure I1).
For Ti-12, absorption was observed at more positive potentials than -0.6 V consistent
with the presence of hydrogen absorption windows Which allow absorption to occur
before redox transformations occur in the oxide. In view of the results of Fukuzuka et al.
(1980) for Ti-lPd and Ti-7, we would have anticipated similar behaviour for Ti-16.
However, no absorption of hydrogen into the metal was observed until E was 0 -1.0 V
(vs. SCE). This observation was even more baffling since microscopic examination of
the Ti-16 revealed the existence of a large number of randomly dispersed intermetallic
particles, suggesting the separation of Pd into catalytic cathodes (Noel 1999), Figure A5.
A hypothesis advanced by Ikeda (private communication) is that the intermetallic
particles act as point conductors within an insulating TiO 2 oxide. At cathodic potentials
the low resistance to current flow at these sites prevents polarization of the surrounding
oxide, and the potential at the intermetallic must reach -1.0 V before a potential of -0.6 V
becomes applied across the oxide. For this situation to prevent H absorption into the
alloy, the cathodic intermetallics must either be unable to absorb H or capable of
saturating with H and rapidly forcing its absorption efficiency to zero. If behaving in the
latter mode the intermetallics would be acting as hydrogen storage sites which in the
absence of any P3-phase in the bulk of the alloy retain the hydrogen at the surface of the
alloy. Since they are small and few in number their hydrogen content may be
undetectable by bulk analyses.

73
To date, the nature and properties of these intermetallics present in Ti- 16 have not been
elucidated. Accotding to the phase diagram for Ti-Pd, a Pd content of 0.05 wt% is
insufficient to exceed the Pd solubility and, hence, to cause phase separation as an
intermetallic. This appeared to be confirmed by Kitayama et a!. (1990) who showed that
Ti-16 had a large grained equiaxed microstructure containing no separated intermetallics.
However, when 0.3 wt% Co was added to the alloy, a much smaller grained equiaxed
structure containing a fine dispersion of particulates was obtained. The presence of these
particulates, assumed to be TiCo led to further increases in the alloy's resistance to
corrosion in hot reducing acid solutions.
The Ti-16 specimens used in impedance experiments (Figure B2) and cathodic
polarization/hydrogen absorption experiments (Figure A4) contained -0.1 wt% Fe, a
concentration in excess of the -0.03 wt% solubility limit above which Watanabe et al.
1988 showed TixFe particles precipitated. As discussed in Appendix B, TiFe would be a
reactive intermediate and expected to behave in a manner similar to that observed for
Ti2Ni in Ti-12. However, the impedance results, discussed in Appendix B, clearly show
the intermetallic precipitates present in Ti-I16 to be inert.
Two alternative explanations appear possible. The particulates could be TixFe and
simply difficult to activate for hydrogen absorption as discussed by Wu (1984). This
would not account for their inertness at temperatures (> 650C) at which they would be
expected to be reactive. Alternatively, the co-separation of Pd to yield a TiPdFe
intermetallic particle could explain both their inertness and their ability to function as
catalytic cathodes without causing significant H absorption. To function in this last

74
manner they would have to act as hydrogen saturated storage alloys with zero
efficiency for the absorption of further hydrogen once saturated. Presently, no
experimental evidence exists to evaluate these possibilities.
REFERENCES
T. Watanabe. T. Shindo and H. Naito. 1988. Effect of iron content on the breakdown
potential for pitting of titanium in NaCI solutions. In Proceedings of the Sixth World
Conference on Titanium, Cannes, France, 1988, June 6-9, 1735-1.740.
S. Kitayama, Y. Shida and M. Oshiyama. 1990. Development of new crevice corrosion
resistant Ti alloys. Sumitomo Search 41, 23-32.
J.B.C. Wu. 1984. Effect of iron content on hydrogen absorption and passivity
breakdown of commercially pure titanium in aqueous solutions. In Titanium, Science
and Technology, Proceedings of the Fifth International Conference on titanium, Munich,
Germany, Sept. 10-14, 1984 (edited by G. LUtjering, U. Zwickler and W. Bunk), vol. 4.,
2595-2602.
R. Greef, R. Peat, L.M. Peter, D. Pletcher, J. Robinson. 1985. Instrumental methods in
Electrochemistry. Ellis Horwood Ltd. Chichester, U. K.
R. S. Glass. 1983. Effect of intermetallic Ti2 Ni on the electrochemistry of Ticode-12 in
hydrochloric acid. Electrochimica Acta, 28 (11), 1507-1513.
T. Okada. 1983. Factors influencing the cathodic charging efficiency of hydrogen
modified titanium electrodes. Electrochimica Acta, 28(8) 113-1120.

75
Y. J. Kim and R. A. Oriani. 1987. Corrosion properties of the oxide film formed on
Grade-12 titanium in brine under gamma radiation. Corrosion. 43, 85-91.
T. Fukuzuka, K. Shimogori and H. Satoh. 1980. Role of palladium in hydrogen
absorption of Ti-Pd alloy. In titanium '80, Science and Technology (edited by H. Kimura
and 0. Izumi), The metallurgical Society of AIME, Warrendale, PA.
J. J. No£1, M. G. Bailey, J. P. Crosthwaite, B. M. Ikeda, S. R. 'Ryan and D. W. Shoesmith.
1996. Hydrogen absorption by Grade-2 Titanium. Atomic Energy of Canada Ltd.
Report, AECL-l 1608, COG-96-249.
T. Murai, M. Ishikawa and C. Miura. 1977. Absorption of hydrogen into titanium under
cathodic polarization. Boshoku Gijutsu 26, 177-183.
D. W. Shoesmith and F. King. 1999. The effects of gamma radiation on the corrosion of
candidate materials for the fabrication of nuclear waste packages. Atomic Energy of
Canada Ltd. Report. AECL- 11999.
R. W. Schutz and M. Xiao. 1993. Optimized Lean-Pd titanium alloys for aggressive
reducing acid and halide service environments. Proceedings of 12± International
Corrosion Congress, Sept. 1993, Vol. 3A, 1213-1225, NACE International, Houston, TX.
LEGENDS FOR FIGURES IN APPENDIX A
Figure Al. Polarization curves recorded (separately) for commercially-pure Ti (o, Ti-2)
and the intermetallic compound Ti2Ni (±) in boiling deaerated IM HCl (from Glass
1983).

76
Figure A2. Effect of pH on the current efficiency for hydrogen absorption by Ti (o),
Ni-modified Ti f) and Pt-modified Ti (±) recorded galvanostatically at a current density
of 0.5 mA-cm-2 at 25'C for 2 hours (from Okada 1983).
Figure A3. Relationship between the amount of hydrogen absorbed and the corrosion
rate of Ti(o) and titanium containing 1% Pd (+) and 0.15% Pd (*) (from Fukuzuka et al.
1980).
Figure A4. Potentiostatically recorded polarization curves for Ti-2 in 0.1 mol.L"1 HCI +
0.27 molL) NaC1 at 95TC. The curves denoted by the symbols Ii and o correspond to
polarization curves recorded after an open-circuit transient in which the potential (Eoc)
initially shifted to negative values before reclimbing to -- -0.3 V. The curve denoted by
the symbol ® was recorded after Eo0 fell to negative values (- -0.6 V) and did not
subsequently reclimb. A and B indicate the two segments of the polarization curves
discussed in the text (from Noel et al. 1996).
Figure A5. Photomicrograph showing the large number of randomly dispersed
intermetallic particles in Ti-16 (from Noel 1999).
-- .......... -.- -

0.2 0.0 -0.2 -0.4 -0.6 Potential (V vs SCE)
Figure Al
10000
77
1000
100
10
0
a,
C:
09
1 0.4 -0.8 -1.0

80
0
a,
uj
0)
C)
0 . - T , _ ,, _ _
0 1 2 3 4 5pH
Figure A2
78

0.0010 Corrosion
0.0100 Rate (mm/y)
Figure A3
1000
79
E 0.
(D
L..
0 (0 L-
U,.
C) 0) o
"I
100
10
* 11 . 1111 I |I
" Ti-1Pd * Ti-0.15Pd 0 Pure Ti
A
I 1111 1 ! rl 1 I I III
0.0001 0.1000I1

80
6
"5-B E
<4-A
>"3 C
-'2
4.
o0
-2 -2.0 -1.5 -1.0 -0.5 0.0
Potential (V)
Figure A4

81
Figure A5

82
APPENDIX B
BEHAVIOUR OF THE ALLOYING ELEMENTS AND THE KEY
IMPURITY, Fe, IN Ti-2, Ti-12, Ti-16
In an attempt to understand the properties of these alloys, in particular the properties of
those sites at which the oxide film may be breached and hydrogen absorbed, we
undertook an impedance study of a series of titanium alloys, including Ti-2, Ti-12 and Ti
16 in neutral 0.27 mol-L"1 NaCI as a function of temperature (ambient to 80'C)
(Shoesmith et al. 1997, Noel 1999). For Ti-2, the impedance behaviour as a function of
temperature showed a decrease in film resistance for T 0 65°C, and could be interpreted
in terms of a simple equivalent circuit of a parallel combination of a capacitor and a
resistance (i.e., a single time constant circuit). The decrease in film resistance as the
temperature increases is consistent with the film breakdown/recrystallization process
known to occur for TO 65WC (Shoesmith and Ikeda 1997). The absence of a second time
constant in the impedance response indicates that this breakdown is general, e.g. the
generation of many lower resistance pathways at grain boundaries in the recrystallized
oxide, and not the formation of discrete breakdown sites.
For the Ti-12 and Ti-16 alloys, however, the impedance results fit a model in which it is
assumed that pores (or cracks and other faults) existed in the passive oxide film
protecting the alloy. These faults were modeled using an equivalent circuit comprising
an interfacial impedance (Zi) in series with a pore resistance (RPRE) both in parallel with
a capacitance used to represent the properties of the passive film on non-faulted sites in

83
the oxide, Figure B 1. This model fitted the experimental data very well as discussed in
detail elsewhere (Shoesmith et al. 1997, Noel 1999).
The calculated values of the interfacial resistance (the resistive component of Z1 which
comprises a parallel combination of this resistance and a double layer capacitance), taken
to be the polarization resistance (R,,) at the base of the pore, and the pore resistance are
plotted in Figures B2A and B2B. For Ti-12, the polarization resistance decreases with
temperature, especially above - 650 C. By contrast no significant drop in polarization
resistance is observed for Ti-16 up to 80TC. For both alloys the pore resistance (RpoRE)
decreases slightly with an increase in temperature, but the absolute values for Ti-1 6 are
about an order of magnitude lower than those for Ti-12.
A rational conclusion from these results is that, as the temperature increases, Ti-12
develops reactive sites (low Zi) at the bottom of relatively narrow, highly resistive pores
(high RpoRE). By contrast, the sites at the bottom of relatively open pores/faults (low
RpoRE) in Ti-16 remain inert (high Zi) over the whole temperature range. This last
interpretation is consistent with the photomicrograph in Figure A5. From the impedance
results we would conclude that these particles are inert. For Ti-12, however, it is more
reasonable to conclude that exposed sites within the passive oxide are reactive and that
these sites coincide with the location of Ti2Ni intermetallic particles or reactive f3-phase
in the underlying predominantly ct-Ti matrix.
I support of this argument that the Ti2Ni intermetallics in Ti- 12 will be reactive if acidic
conditions can be established are the results of Glass (1983) who has clearly shown in
polarization experiments, Figure Al, that Ti2Ni is very reactive in hot acidic solutions.

84
These polarization curves show that not only is Ti2Ni a good catalyst for proton
reduction but that it also does not passivate when anodically polarized and hence is
susceptible to rapid corrosion under acidic conditions. A similar susceptibility to
corrosion has been demonstrated for P-phase Ti when its Ni content is high (Hall et al.
1985).
We would conclude from this evidence that it is possible for hydrogen absorption into
Ti-12 to be facilitated by the coexistence of anodes and cathodes located at Ti2Ni or
Ni-containing 13-phase at imperfections in the passive TiO 2 film. In the situation
analyzed in impedance experiments this acidity will be localized at the film breakdown
sites which appear in the oxide as the temperature increases. As within any occluded site
a combination of metal dissolution, dissolved cation hydrolysis and limited transport
would yield acidity.
Since the solubility of hydrogen in Ti2Ni, and to a lesser degree the 13-phase, will be
substantially higher than in the ca-phase it would be expected that this reactivity would
enhance hydrogen absorption into the titanium matrix. An additional feature of the Ti-12
which would aid this process is the presence of P3-phase which tends to occur as
ligaments along the a-Ti grain boundaries (Glass 1983). This geometry, coupled with the
higher diffusion rate of H in the 13-phase (reported to be 105 times that in the cc-phase
(Wang et al. 1999)) would facilitate the transport of H into the bulk of the alloy, Figure
16.
The most common impurity in titanium alloys with the potential to exert a major
influence on H absorption behaviour is Fe. Many studies of the influence of Fe on the

85
corrosion of, and hydrogen absorption by, Ti have been undertaken with conflicting
results (Cotton 1970, Covington and Schutz 1981, Schutz et aL. 1984). Of particular
interest in the present context is the ability of Fe-containing phases and intermetallic
particles to absorb hydrogen. The influence of Fe would be expected to be similar to that
of Ni in Ti-12 since it can both separate into intermetallic precipitates and stabilize the ]3
phase. It is likely that many of the inconsistencies for the influence of Fe on Ti corrosion
can be attributed to variations in its distribution within the metal matrix.
Cotton (1970) clearly showed that H more rapidly diffused in Ti-2 as the Fe content was
increased from 0.05 wt % to 0.12 wt %. This observation would be consistent with an
increase in the P3-phase content of the alloy with increasing Fe content. These results
appear to be at odds with those of Covington and Schutz (1981) which showed that, for
cathodic charging conditions (9.6 mA-cm"2 in 1% NaCi (pH = 1) at 90'C) the efficiency
of H absorption decreased from - 30% for [Fe] < 0.04 wt % to - 15% for [Fe] 0 0.20%.
While no attempt to explain this apparent inconsistency was offered, it is likely that the
decreased efficiency can be attributed to the separation of the Fe into TixFe intermetallic
precipitates at the higher Fe contents. A number of authors (Wu 1984. Ikeda et aL. 1990,
Watanabe et al. 1988) have clearly shown that as the Fe content of Ti-2 increases the ac
grain size decreases and Ti×Fe intermetallics are formed. According to Watanabe et at.
(1988) this occurs once [Fe] is 0 350 j.g/g (0.035 wt %).
While the intermetallic TixFe has been shown to be a hydrogen absorber it is claimed to
be difficult to activate for hydrogen storage (Wu 1984). Hence, despite its presence at
Fg-- -ecnt!ý--1+.z-- it crovuld actually impede hydrogen absorption despite acting as a H+

86
reduction catalyst. According to Wu, the hydride formed on this intermetallic
possesses less lattice distortion than that formed on a-Ti, a feature which would retard
the diffusion of hydrogen. Similar speculations have been offered by Schutz et al.
(1984). Such mechanistic features would lead to decreased H absorption with increasing
Fe content.
That Fe present in 13-phase leads to enhanced susceptibility to corrosion has been
demonstrated by Ikeda et.al. (1994) for Ti-2 and by Ruppen et al. (1983) for Ti-12. In
both cases it appeared that if the Fe were located in 13-phase it led to an increase in anodic
current, and in corrosion experiments, an increase in corrosion current. However, when"
separated into TiFe intermetallics, corrosion rates decreased and passivity was easier to
maintain.
From these results it is clear that the distribution and local concentration of the alloying
element Ni and the impurity element Fe will have a major influence on both the corrosion
behaviour of Ti- 12 (containing both Ni and Fe) and Ti-2 (similarly contaminated with Fe)
and their ability to absorb hydrogen. Both Ni and Fe containing 13-phase and Ti2Ni and
TixFe intermetallic particles are susceptible to anodic dissolution in acidic environments.
While it remains to be demonstrated whether Ni/Fe 13-phase can also act as catalytic
cathodes, there is little doubt in the case of the intermetallics, or in their ability to absorb
hydrogen. It is likely, however, that absorbed H would remain localized at the
intermetallic site unless the predominantly a-phase alloy contains 1-phase ligaments
which enhance transport of hydrogen into the bulk of the alloy. In the absence of these

87
transport pathways the intermetallic particles may become saturated in H, a condition
for which the efficiency of further H absorption approaches zero.
For the Ti-16 alloy the presence of Pd in intermetallic particles would be expected to
provide excellent hydrogen absorption "windows" thereby allowing hydrogen absorption
to occur at potentials less than the -0.6 V required to induce the redox transformations in
the oxide which render it permeable to hydrogen. While the H absorption efficiency has
been shown to decrease as the Pd content decreases (Fukuzuka et al. 1980, Figure A3 ) it
was still surprising to discover that the absorption of H into this alloy was undetectable
until potentials 0 -1.0 V.
REFERENCES
T. Watanabe. T. Shindo and H. Naito. 1988. Effect of iron content on the breakdown
potential for pitting of titanium in NaC1 solutions. In Proceedings of the Sixth World
Conference on Titanium, Cannes, France, 1988, June 6-9, 1735-1740.
R. W. Schutz, J. S. Grauman and J. A. Hall. 1984. Effect of solid solution iron on the
corrosion behaviour of titanium. In Titanium, Science and Technology, Proceedings of
the Fifth International Conference on Titanium, Sept 10-14 (1984), Munich, Germany,
(edited by G. Liltjering, U. Zwickler and W. Bunk), 2617-2624.
J. A. Ruppen, R. B. Diegle, R. S. Glass and T. J. Headley. 1983. Some effects of
microstructure and chemistry on corrosion and hydrogen embrittlement of Ti-12. Mat.
Res. Soc. Symp. Proc. 15, 685-693.
------- ----------- . ...............

88
J. J. Noel. 1999. The electrochemistry of titanium corrosion. Ph. D. Thesis,
University of Manitoba.
L. C. Covington and R. W. Schutz. 1981. Effects of iron on the corrosion resistance of
titanium. In Industrial applications of Titanium and Zirconium, ASTM 728, (ed. E. W.
Kleefisch) 163-180.
J.B.C. Wu. 1984. Effect of iron content on hydrogen absorption and passivity
breakdown of commercially pure titanium in aqueous solutions. In Titanium, Science
and Technology, Proceedings of the Fifth International Conference on titanium, Munich,
Germany, Sept. 10-14, .1984 (edited by G. Ldtijering, U. Zwickler and W. Bunk), vol. 4.,
2595-2602.
R. S. Glass. 1983. Effect of intermetallic Ti2Ni on the electrochemistry of Ticode- 12 in
hydrochloric acid. Electrochimica Acta, 28 (11), 1507-1513.
T. Fukuzuka, K. Shimogori and H. Satoh. 1980. Role of palladium in hydrogen
absorption of Ti-Pd alloy. In titanium '80, Science and Technology (edited by H. Kimura
and 0. Izumi), The metallurgical Society of AIME, Warrendale, PA.
D. W. Shoesmith, W. H. Hocking, B. M. Ikeda, F. King, J. J. Noel and S. Sunder. 1997.
Application of electrochemical methods in the development of models for fuel
dissolution and container corrosion under nuclear waste disposal conditions. Can. J.
Chem. 75(11), 1566-1584.

89
D. W. Shoesmith and B. M. Ikeda. 1997. The resistance of titanium to pitting.
microbially induced corrosion, and corrosion in unsaturated conditions. Atomic Energy
of Canada Ltd. Report, AECL- 11709, COG-95-557- 1.
J. A. Hall, D. Banerjee and T. L. Wardlaw. 1985. The relationships of structure and
corrosion behaviour of TiO.3MoO.8Ni (Ticode-12).-- In Titanium, Science and
Technology, Proceedings of the Fifth International Conference of Titanium (edited by G.
Liitjering, U. Zwickler and W. Bunk), Sept. 10-14 (1984), Munich, Germany, 2603-2610.
B. M. Ikeda, M. G. Bailey, D. C. Cann and D. W. Shoesmith. 1990. Effect of iron
content and microstructure on the crevice corrosion of Grade-2 titanium under nuclear
waste vault conditions; In Advances in Localized Corrosion (edited by H. S. Isaacs, U.
Bertocci, J. Kruger and S. Smialowska), 439-444, NACE International, Houston, TX.
B. M. Ikeda, R. C. Styles, M. G. Bailey and D. W. Shoesmith. 1994. The effect of
material purity on crevice corrosion of titanium in NaCI solution. In Compatibility of
Biomedical Implants, (edited by P. Kovacs and N. S. Istephanous), Electrochemical
Society Proceedings, Vol. 94-15, Electrochemical Society, Pennington, NJ, 368-380.
J. B. Cotton. 1970. Using titanium in the chemical plant. Chemical Engineering
Progress, 66(10), 57-62.

90
FIGURE LEGENDS FOR APPENDIX B r~gure 1. Ecjuivalent circuit used to a:=:.vz! & ch". zizi impedance
spectroscopy data for titanium alloys.
Figure B2. The calculated values of the interfacial. resistance, Rp, (the resistive
component of Zi (Figure BI) which comprises a parallel combination of this resistance
and a double 'layer capacitance) and the pore resistance, RpoRE (Figure B I), as functions
of temperature for Ti-12 (-+) and Ti-16 (°). The impedance data were recorded in
0.27 mol.L 1 NaC1 after 24 hours on open circuit.

91
Figure BI

6000000
40000 S0 oo
E 30000 0
S200001
01 1 1 ' I I 10 20 30 40 50 60 70 80 90
Temperature (°C)
E 200000
E
L.9 0 0. 100000
20 30 40 50 60 70 80 90 Temperature (0C)
Figure B2
92