inhibitionofnicotinamidephosphoribosyltransferase (nampt ... ·...
TRANSCRIPT
Inhibition of Nicotinamide Phosphoribosyltransferase(NAMPT), an Enzyme Essential for NAD� Biosynthesis, Leadsto Altered Carbohydrate Metabolism in Cancer Cells*
Received for publication, December 12, 2014, and in revised form, May 3, 2015 Published, JBC Papers in Press, May 5, 2015, DOI 10.1074/jbc.M114.632141
Bo Tan‡, Sucai Dong§, Robert L. Shepard§, Lisa Kays§, Kenneth D. Roth‡, Sandaruwan Geeganage§,Ming-Shang Kuo‡1, and Genshi Zhao§2
From §Cancer Research and ‡Discovery Chemistry, Lilly Research Laboratories, Eli Lilly and Co., Indianapolis, Indiana 46285
Background: NAMPT inhibition leads to attenuation of glycolysis in cancer cells.Results: NAMPT inhibition also perturbs other carbohydrate metabolism, resulting in elevated fructose 1-phosphate, sedohep-tulose 1-phosphate, glyceraldehyde, and erythrose levels.Conclusion: Condensation of dihydroxyacetone phosphate/glyceraldehyde and dihydroxyacetone phosphate/erythrose byaldolase leads to increased fructose 1-phosphate and sedoheptulose 1-phosphate, respectively.Significance: NAMPT plays a key role in regulating glycolysis-related carbohydrate metabolism in cancer cells.
Nicotinamide phosphoribosyltransferase (NAMPT) has beenextensively studied due to its essential role in NAD� biosynthe-sis in cancer cells and the prospect of developing novel thera-peutics. To understand how NAMPT regulates cellular metab-olism, we have shown that the treatment with FK866, a specificNAMPT inhibitor, leads to attenuation of glycolysis by blockingthe glyceraldehyde 3-phosphate dehydrogenase step (Tan, B.,Young, D. A., Lu, Z. H., Wang, T., Meier, T. I., Shepard, R. L.,Roth, K., Zhai, Y., Huss, K., Kuo, M. S., Gillig, J., Parthasarathy,S., Burkholder, T. P., Smith, M. C., Geeganage, S., and Zhao, G.(2013) Pharmacological inhibition of nicotinamide phosphori-bosyltransferase (NAMPT), an enzyme essential for NAD� bio-synthesis, in human cancer cells: metabolic basis and potentialclinical implications. J. Biol. Chem. 288, 3500 –3511). Due totechnical limitations, we failed to separate isotopomers of phos-phorylated sugars. In this study, we developed an enablingLC-MS methodology. Using this, we confirmed the previousfindings and also showed that NAMPT inhibition led to accu-mulation of fructose 1-phosphate and sedoheptulose 1-phos-phate but not glucose 6-phosphate, fructose 6-phosphate, andsedoheptulose 7-phosphate as previously thought. To investi-gate the metabolic basis of the metabolite formation, we carriedout biochemical and cellular studies and established the follow-ing. First, glucose-labeling studies indicated that fructose1-phosphate was derived from dihydroxyacetone phosphate andglyceraldehyde, and sedoheptulose 1-phosphate was derivedfrom dihydroxyacetone phosphate and erythrose via an aldolasereaction. Second, biochemical studies showed that aldolaseindeed catalyzed these reactions. Third, glyceraldehyde- anderythrose-labeling studies showed increased incorporation of
corresponding labels into fructose 1-phosphate and sedoheptu-lose 1-phosphate in FK866-treated cells. Fourth, NAMPT inhi-bition led to increased glyceraldehyde and erythrose levels inthe cell. Finally, glucose-labeling studies showed accumulatedfructose 1,6-bisphosphate in FK866-treated cells mainly derivedfrom dihydroxyacetone phosphate and glyceraldehyde 3-phos-phate. Taken together, this study shows that NAMPT inhibitionleads to attenuation of glycolysis, resulting in further perturba-tion of carbohydrate metabolism in cancer cells. The potentialclinical implications of these findings are also discussed.
The NAD� cofactor is essential for a number of enzymes andregulatory proteins involved in a variety of cellular processes. Inmammals, NAD� can be synthesized from nicotinamide, nico-tinic acid, or tryptophan (2–5). However, the nicotinamide sal-vage pathway represents the major route to NAD� biosynthesisin mammals (6 – 8). NAMPT,3 a rate-limiting enzyme in theconversion of nicotinamide to NAD� (9 –10) in cancer cells, iscrucial to several physiological processes, including metabo-lism, energy generation, survival, apoptosis, DNA repair, andinflammation (2, 11–13).
NAMPT is overexpressed in several types of tumors (14 –17),and its expression is associated with tumor progression (18).The down-regulation of NAMPT suppresses tumor cell growthin vitro and in vivo and sensitizes cells to oxidative stress andDNA-damaging agents (8, 14, 17, 19 –21). The inhibition ofNAMPT also leads to the attenuation of tumor growth andinduction of apoptosis due to NAD� depletion (8, 20 –23).Taken together, NAMPT represents a promising therapeutictarget for the development of potential novel cancer drugs(24 –26).
NAD� is a substrate for dehydrogenases, poly(ADP-ribose)polymerases, sirtuins (SIRT), mono ADP-ribosyltransferases,and ADP-ribosyl cyclases (2, 4, 11). In most cancer cells, poly-
* This work was supported by Eli Lilly and Co. The authors declare that theyhave no conflicts of interest with the contents of this article.
1 To whom correspondence may be addressed: Cancer Research, LillyResearch Laboratories, Eli Lilly and Co., DC0434, Indianapolis, IN 46285.Tel.: 317-651-3921; Fax: 317-276-5431; E-mail: [email protected].
2 To whom correspondence may be addressed: Cancer Research, LillyResearch Laboratories, Eli Lilly and Co., DC0434, Indianapolis, IN 46285.Tel.: 317-276-2040; Fax: 317-276-1414; E-mail: [email protected].
3 The abbreviations used are: NAMPT, nicotinamide phosphoribosyltrans-ferase; MRM, multiple-reaction monitoring; DHAP, dihydroxyacetonephosphate.
THE JOURNAL OF BIOLOGICAL CHEMISTRY VOL. 290, NO. 25, pp. 15812–15824, June 19, 2015© 2015 by The American Society for Biochemistry and Molecular Biology, Inc. Published in the U.S.A.
15812 JOURNAL OF BIOLOGICAL CHEMISTRY VOLUME 290 • NUMBER 25 • JUNE 19, 2015
by guest on February 2, 2019http://w
ww
.jbc.org/D
ownloaded from
(ADP-ribose) polymerase is activated due to DNA damage andgenome instability (2, 26 –28). The activation of poly(ADP-ri-bose) polymerases leads to NAD� depletion in cancer cells (2, 8,26 –28). Similarly, aberrant expression of SIRT, mono(ADP-ribosyl) transferases, and ADP-ribosyl cyclases can lead to con-sumption of NAD� in cancer cells (2, 4, 11).
To better understand the metabolic basis of NAMPT inhibi-tion, we have recently shown that inhibition of NAMPT leads toattenuation of glycolysis at the glyceraldehyde-3-phosphate de-hydrogenase step (1). The attenuation of glycolysis results in anaccumulation of glycolytic intermediates before and at the glyc-eraldehyde 3-phosphate dehydrogenase step (1). The attenua-tion of glycolysis also leads to a decrease of glycolytic interme-diates after the glyceraldehyde-3-phosphate dehydrogenasestep (1). However, due to throughput considerations and tech-nical difficulties, we were unable to separate isomers of glyco-lytic intermediates, such as glucose 6-phosphate and fructose6-phosphate, and glyceraldehyde 3-phosphate and dihydroxy-acetone phosphate, or their geometrical isomers, such as glu-cose 1-phosphate and fructose 1-phosphate. To further inves-tigate the effects of NAMPT inhibition on cancer cellmetabolism, we developed an LC-MS method enabling us toseparate each isomer. This new method also resolves sedohep-tulose 7-phosphate from its 1-isomer and glyceraldehyde3-phosphate from dihydroxyacetone phosphate, which allowsus to identify the source of triose. We now report that NAMPTinhibition leads to an accumulation of fructose 1-phosphateand sedoheptulose 1-phosphate, but not fructose 6-phosphateand sedoheptulose 7-phosphate, in different cancer cells andtumors. Glucose-labeling studies indicated that increased levelsof fructose 1-phosphate and sedoheptulose 1-phosphate arederived from dihydroxyacetone phosphate and glyceraldehydeand from erythrose, respectively, via an aldolase condensationreaction, a hypothesis later confirmed by biochemical anddirect labeling studies. The addition of uniformly labeled glyc-eraldehyde and erythrose led to the formation of 3-carbon-la-beled fructose 1-phosphate and four-carbon-labeled sedohep-tulose 1-phosphate, respectively, in the cell. Consistent withthis, NAMPT inhibition also led to an accumulation of glycer-aldehyde and erythrose in cancer cells and tumors. Takentogether, these studies suggest that NAMPT inhibition leads toattenuation of glycolysis, resulting in further alteration of car-bohydrate metabolism in the cell. The findings from this studyalso have potential clinical implications because increased for-mation of fructose 1-phosphate and sedoheptulose 1-phos-phate can be used as PD markers for evaluating NAMPT inhib-itors in the clinic.
Experimental Procedures
Materials—The following materials were purchased fromSigma-Aldrich: formic acid (MS/HPLC grade), 1-ethyl-3-(3-imethylaminopropyl)carbodiimide, glucose, O-benzylhy-droxylamine, sedoheptulose 7-phosphate lithium salt, glyc-eraldehyde 3-phosphate solution, fructose 1,6-bisphosphatetrisodium salt, glucose 6-phosphate sodium salt, fructose6-phosphate disodium salt, glucose 1-phosphate, fructose1-phosphate, hydrochloric acid (12.1 M HCl), D-erythrose,and dihydroxyacetone phosphate (hemimagnesium salt).
D-Glyceraldehyde, D-[1,2,3-13C3]glyceraldehyde, D-[U-13C4]erythrose, and D-[U-13C6]glucose were purchased fromOmicron Biochemicals (South Bend, IN). Ethyl acetate andmethanol (HPLC grade) were purchased from VWR Interna-tional (Plainview, NY). Water (OptimaTM LC/MS grade) waspurchased from Thermo Fisher Scientific. Tissue Lyser (II) andstainless steel beads (5 mm) were purchased from Qiagen(Hilden, Germany). RPMI 1640, Dulbecco’s modified Eagle’smedium (DMEM), fetal bovine serum (FBS), and dialyzed FBSwere purchased from Life Technologies, Inc. The cancer cellline KM-12 was purchased from NCI, and other cell lines werepurchased from ATCC. HCT-116 was cultured in McCoy’s 5AMedium modified (Hyclone) containing 10% FBS, NCI-H1155,and DMEM (25 mM glucose) in the presence of 10% FBS and 5%CO2 at 37 °C. Other cell lines were cultured in RPMI containing10% FBS. Athymic nude mice (female) were purchased fromHarlan Laboratories (Indianapolis, IN). FK866 was obtainedand formulated as described (1).
Preparation of Cellular Extracts—Cancer cells (50,000/wellin 100 �l) were seeded in 96-well plates and cultured overnightas described above. Cells were rinsed with DMEM or McCoy’s5A containing 10% dialyzed FBS (Gibco) three times asdescribed above and treated with FK866 (0 –100 nM) in thesame medium (150 �l/well) for 24 h. For metabolite analysis,cultural medium was discarded, and metabolites wereextracted with 80% methanol as described below. For 13C-label-ing studies, the culture medium was replaced with a freshlyprepared medium containing the following: 0.0 –100 nM ofFK866, 12.5 mM glucose, and 10% dialyzed FBS as well as 1.0 mM
D-[1,2,3-13C3]glyceraldehyde, 1.0 mM D-[U-13C4]erythrose, or12.5 mM D-[U-13C6]glucose, as indicated. Cells were incubatedfor 0.25– 6 h. At each time point, 80% methanol (100 �l each)was added to each well to extract the metabolites after theremoval of the medium. After incubation at room temperaturefor 15 min, the methanol extracts were transferred to a 96-deepwell plate and rinsed with 100% methanol (100 �l/well). Sam-ples were dried under a stream of nitrogen at 40 °C using ahomemade 96-well plate dryer and reconstituted in 100 �l ofwater. The extracts were ready for further analysis.
Preparation of Tumor Samples—NCI-H1155 cells (ATCC)were grown as described above. The cells (106 cells/animal)were mixed with Matrigel (1:1) and implanted subcutaneouslyinto the rear flank of the mice (female CB17 SCID, CharlesRiver). The implanted tumor cells grew as solid tumors. Theanimals (6 animals/group) were dosed orally with 5 and 10mg/kg of FK866 in 20% Captisol and 25 mM phosphate buffer,pH 2, twice a day for 6 days after tumors reached 500 mm3. Thetumor volume and body weight were measured twice a week(1). The tumor samples (�50 mg) were homogenized in 1 ml ofice-cold 80% methanol for 30 s with a TissueLyser II and 5-mmstainless steel beads at 4 °C. The homogenates were centrifugedat 4,000 � g for 10 min at 5 °C (5417C Centrifuge, Eppendorf,Westbury, NY). The pellets were discarded, and the tumorextracts were collected into a 96-deep well plate (2 ml). Thetumor extracts (100 �l) were dried under nitrogen at 40 °C asdescribed above and reconstituted in 100 �l of water. Theextracts were ready for further analysis.
NAMPT Inhibition Alters Carbohydrate Metabolism
JUNE 19, 2015 • VOLUME 290 • NUMBER 25 JOURNAL OF BIOLOGICAL CHEMISTRY 15813
by guest on February 2, 2019http://w
ww
.jbc.org/D
ownloaded from
Determination of Cellular Protein Concentrations—Fordetermination of protein concentrations, an extra set of plateswas used. Cells were grown and treated as described before andonly used for protein determination. After treatment, growthmedium was removed, and cells were washed three times withPBS buffer (200 �l each). Then 75 �l of a lysis buffer (1% TritonX-100, 25 mM Tris, pH 7.5, 150 mM NaCl, 1 mM EDTA, and 1mM EGTA) containing 1� protease inhibitor mixture (Com-plete, Mini, EDTA-free, Roche Applied Science) was added toeach well. The plate was kept on ice for 10 min, followed byshaking (750 rpm) for 10 s. Protein concentrations were deter-mined using a BCA protein assay kit (Pierce) according to themanufacturer’s instructions.
Detection and Quantitation of Erythrose and Glycer-aldehyde—Pyridine buffer (pH 5.0) was prepared by combining12.1 M HCl (5.4 ml), pyridine (8.6 ml), and water (86 ml). Thereconstituted cell extracts and tumor extracts (100 �l) in waterwere mixed with 1 M O-benzylhydroxylamine (50 �l) and 1 M
1-ethyl-3-(3-imethylaminopropyl)carbodiimide (50 �l) in thepyridine buffer. After incubation at room temperature for 1 h,ethyl acetate (300 �l) was added, and the plates were shaken for10 min (VWR� multitube vortexer). The organic layer wastaken into a 96-deep well plate (2 ml). Then the aqueous layerwas extracted again with ethyl acetate (300 �l each). Theorganic layers were combined into a 96-deep well plate (2 ml).The 96-deep well plate was dried as described above and recon-stituted in 100 �l of 10% methanol/water. The derivatized sam-ples (10 �l) were injected onto an LC-triple quadrupole massspectrometer (Qtrap 5500, AB Sciex, Framingham, CA), cou-pled with a pair of Shimadzu 10ADVP pumps, and a ShimadzuSIL-20A autosampler (Shimadzu, Columbia, MD). Sampleswere separated by HPLC using a Waters Xbridge 2.1 � 50-mmC18 column (Waters, Milford, MA) with a two-solvent system(A, water with 0.1% formic acid; B, methanol) at a flow rate of0.6 ml min�1. The gradient was programmed as follows: 0 –1.0min, 0 –30% B; 1.0 –5.5 min, 30 – 85% B; 5.5–5.6 min, 85–98% B;5.6 – 6.5 min, 98% B; and 6.5– 8.0 min, 0% B. The MS acquisitionmethods used positive electrospray ionization and analysis in amultiple-reaction monitoring (MRM) mode. MRM transitionsfor derivatized glyceraldehyde and erythrose are 196/91 and226/91. MRM transitions for isotopomers (M1–M3) of deriva-tized glyceraldehyde are 197/91, 198/91, and 199/91. MRMtransitions for isotopomers (M1–M4) of derivatized erythroseare 227/91, 228/91, 229/91, and 230/91. The collision energyparameters are 15. Ion spray voltage was 4,500 V. Nebulizer gas(GS1), auxiliary gas (GS2), curtain gas (CUR), and collision gas(CAD) were 70, 70, 30, and 5 (arbitrary units), respectively. Theion source temperature was maintained at 600 °C. The curtainand collision gas was nitrogen. Declustering potential, entrancepotential, and cell exit potential were 60, 10, and 15,respectively.
Analysis of Sugar Phosphates and NAD(H)—The reconsti-tuted cell and tumor extracts (100 �l) in water were injectedinto an LC-triple quadrupole mass spectrometer (API 4000, ABSciex, Framingham, CA), coupled with a pair of Shimadzu10ADVP pumps, and a Shimadzu SIL-20A autosampler (Shi-madzu, Columbia, MD). Samples were separated by HPLCusing a Waters T3 2.1 � 50-mm column with a two-solvent
system (A, 10 mM tributyl amine and 15 mM acetic acid in 3%methanol/water; B, methanol) at a flow rate of 0.6 ml min�1.The gradient was programmed as follows: 0 – 0.5 min, 0% B;0.5–1.8 min, 0 –70% B; 1.8 –3.0 min, 90% B; and 3.0 – 6.0 min,0% B. The injection volume was 10 �l, and the method usednegative electrospray ionization mode. The MRM transitionsfor glucose 6-phosphate/fructose 6-phosphate, fructose1-phosphate/glucose 1-phosphate, fructose 1,6-bisphosphate,dihydroxyacetone phosphate/glyceraldehyde 3-phosphate,sedoheptulose 1-phosphate/sedoheptulose 7-phosphate, phos-phoglycerate, and phosphoenolpyruvate are 259/97, 259/241,339/79, 169/79, 289/97, 185/97, and 165/97, respectively. Col-lision energies are �20, �16, �86, �46, �26, �49, and �25,respectively. Structural isomers were separated based on reten-tion time. MRM transitions for isotopomers generated from[13C]glucose labeling experiments were adjusted based on thenumbers of 13C- labeled carbons. Ion spray voltage was �4,500V. Nebulizer gas (GS1), auxiliary gas (GS2), curtain gas (CUR),and collision gas (CAD) were 60, 60, 30, and 6 (arbitrary units),respectively. The ion source temperature was maintained at600 °C. The curtain and collision gas was nitrogen. Decluster-ing potential, entrance potential, and cell exit potential were�40, �10, and �10, respectively. The analysis of NAD(H) wasdescribed previously (1). Commercial standards were used forquantification of endogenous metabolites.
Enzymatic Synthesis of Sedoheptulose 1-Phosphate and Fruc-tose 1-Phosphate as Standards—Synthesis of sedoheptulose1-phosphate was carried out as described (30) by couplingaldolase, transketolase, and triose-phosphate isomerase exceptthat rabbit muscle aldolase (Sigma) was used. Sedoheptulose1-phosphate and fructose 1-phosphate were also synthesizedusing an aldolase under the following conditions. For synthesisof sedoheptulose 1-phosphate, reaction mixtures (100 �l each)contained aldolase (�0.01 mg or 1.25 units/ml), 50 mM Tris-HCl, pH 7.4, 250 mM erythrose, 0.0 – 40 mM dihydroxyacetonephosphate or 100 mM dihydroxyacetone phosphate, and 0.0 –250 mM erythrose. The reaction mixtures were incubated at37 °C for 60 min. For the synthesis of fructose 1-phosphate,reaction mixtures (100 �l each) contained 0.00082 mg or 0.1units/ml aldolase, 50 mM Tris-HCl, pH 7.4, 50 mM glyceralde-hyde, 0.0 – 40 or 50 mM dihydroxyacetone phosphate, and0.0 –50 mM glyceraldehyde. The reaction mixtures were incu-bated at 37 °C for 30 min. The products formed were confirmedby LC-MS/MS analysis. The structural identification of sedo-heptulose 1-phosphate from the aldolase reactions has beenreported previously (29). Fructose 1-phosphate formed fromthe enzymatic reaction exhibited the same retention time andMS/MS spectra as the commercial standard (fructose 1-phos-phate). Sedoheptulose 1-phosphate synthesized using the twodifferent methods also exhibited the same retention times andMS/MS spectra as reported previously (29). Fructose 1-phos-phate formed from the enzymatic reaction exhibited the sameretention time and MS/MS spectra as the commercial standard(fructose 1-phosphate). Sedoheptulose 1-phosphate synthe-sized using the two different methods also exhibited the sameretention times and MS/MS spectra as reported previously (29).The commercial standard of fructose 1-phosphate was used forquantification of the endogenous metabolic intermediates. The
NAMPT Inhibition Alters Carbohydrate Metabolism
15814 JOURNAL OF BIOLOGICAL CHEMISTRY VOLUME 290 • NUMBER 25 • JUNE 19, 2015
by guest on February 2, 2019http://w
ww
.jbc.org/D
ownloaded from

concentrations of synthetic sedoheptulose 1-phosphate stan-dard after enzymatic reaction were calculated using sedohep-tulose 7-phosphate due to structural similarity. The syntheticsedoheptulose 1-phosphate standards made from 40 mM dihy-droxyacetone phosphate (DHAP) and 250 mM erythrose wereused to quantify the endogenous metabolite levels.
Statistical Analysis—Data analysis was performed usingMultiQuant version 2.1 (AB Sciex). Calibration curves were cal-culated by least-squares linear regression with 1/x weighting.The metabolites were quantified using the analyte peak areafrom the standard curves. Comparisons between groups weremade with one-way analysis of variance, followed by Dunnett’st test using JMP version 9.0 software. p � 0.05 was considered asthe significant level of difference.
Results
NAMPT Inhibition Led to Accumulation of Fructose 1-Phos-phate and Sedoheptulose 1-Phosphate as Well as Fructose 1,6-Bisphosphate and Dihydroxyacetone Phosphate—We haveshown previously that NAMPT inhibition results in the block-ade of glyceraldehyde 3-phosphate dehydrogenase, a keyenzyme in glycolysis dependent on NAD� for activity (1). As aresult, this leads to an accumulation in glycolytic intermediatesbefore and at the glyceraldehyde 3-phosphate dehydrogenasestep and a decrease in intermediates after the step (1). Using themethodology developed at the time, we were unable to resolveisomers or their geometrical isomers, such as glucose 6-phos-phate/fructose 6-phosphate, dihydroxyacetone phosphate/glycer-aldehyde 3-phosphate, and sedoheptulose 7-phosphate/sedohep-tulose 1-phosphate. To further confirm this hypothesis, wedeveloped an LC-MS methodology (see “Experimental Proce-dures”) enabling us to separate and detect these isomers. Further,this new method also allowed us to separate the two geometricalisomers (1- versus -6) for each sugar phosphate. Using this meth-odology, we were able to detect and quantify fructose 6-phosphate,fructose 1-phosphate, glucose 6-phosphate, glucose 1-phosphate,dihydroxyacetone phosphate, glyceraldehyde 3-phosphate (datanot shown), sedoheptulose 7-phosphate, and sedoheptulose1-phosphate synthesized biochemically or produced in cells andtumor xenografts treated with FK866, a specific NAMPT inhibitor(data not shown). To further validate this methodology, we treatedHCT-116 cells with FK866 as described (see “Experimental Proce-dures”) and analyzed the glycolytic and pentose phosphate path-way intermediates in the cell. We observed a significant increase infructose 1,6-bisphosphate and dihydroxyacetone phosphate levelsand a decrease in 1,3-bisphosphoglycerate, 2- and 3-phosphoglyc-erate, and phosphoenolpyruvate levels (data not shown) asreported before (1). To our surprise, we also observed a significantincrease in fructose 1-phosphate and sedoheptulose 1-phosphatebut not glyceraldehyde 3-phosphate, fructose 6-phosphate, glu-cose 6-phosphate, and sedoheptulose 7-phosphate (data notshown) as previously thought (1).
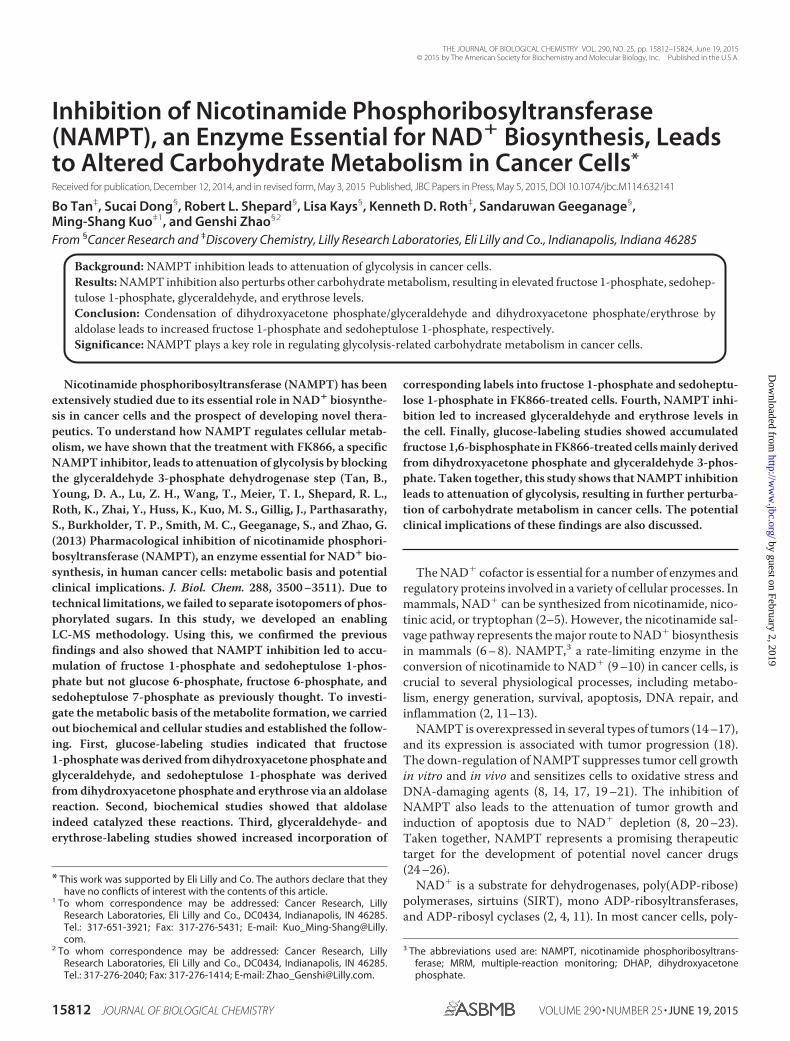
To confirm that these observed metabolic changes wereindeed due to NAMPT inhibition, we treated NCI-H1155, aNAPRT-negative cell line, and HCT-116, a NAPRT-positivecell line (1), with different concentrations of FK866 for 24 h inthe presence or absence of nicotinic acid and analyzed themetabolite levels as described above. We showed that FK866
alone caused a dose-dependent increase in fructose 1,6-bisphos-phate, dihydroxyacetone phosphate, fructose 1-phosphate, andsedoheptulose 1-phosphate levels (Fig. 1, A and B), and adecrease in phosphoglycerate, phosphoenolpyruvate, NAD�,and NADH levels in both cell lines (Fig. 1, C and D). The addi-tion of nicotinic acid completely abolished these effectsobserved in HCT-116 (Fig. 1, B and D) but not in NCI-H1155(Fig. 1, A and C). This is expected because HCT-116, but notNCI-H1155, can use nicotinic acid to produce NAD� (6, 7),thereby bypassing the NAMPT-mediated pathway. Together,these studies have confirmed the previous finding that NAMPTinhibition attenuates glycolysis at the glyceraldehyde 3-phos-phate dehydrogenase step and have also shown that NAMPTinhibition leads to increased fructose 1-phosphate and sedo-heptulose 1-phosphate levels in cancer cells.
Elevated Levels of Fructose 1-Phosphate and Sedoheptulose1-Phosphate in Cancer Cells in Response to NAMPT InhibitionAre Derived from Dihydroxyacetone Phosphate and Glyceralde-hyde and from Erythrose, Respectively, via an Aldolase Conden-sation Reaction; Evidence from the Glucose-labeling Study—To investigate how NAMPT inhibition leads to increasedfructose 1-phosphate and sedoheptulose 1-phosphate levels inthe cell, we carried out a glucose-labeling study. In this study,we treated HCT-116 cells with FK866 for 24 h and then incu-bated the cells in the presence of U-13C6-labeled and unlabeledglucose (1:1). By doing so, we were able to discern the metabolicfates of trioses produced from fructose 1,6-bisphosphate viaaldolase by taking advantage of their facile interconversionthrough the analysis of metabolite isotope labeling patterns. Asshown in Fig. 2A, isotopomers of fructose 1-phosphate weremainly present as a mixture of M0 (0 carbon labeled), M3 (3carbons labeled), and M6 (6 carbons labeled) in the FK866-treated cells. Significantly, the three isotopomers were distrib-uted roughly at a ratio of 1:2:1 (M0/M3/M6), indicating thatfructose 1-phosphate was synthesized from two trioses (1:1 forM0 and M3), such as dihydroxyacetone phosphate and glycer-aldehyde. The treatment with FK866 led to a dose-dependentincrease in M0, M3, and M6 of fructose 1-phosphate (Fig. 2B).Similarly, sedoheptulose 1-phosphate was mainly present asM0, M3, M4, and M7 (Fig. 2A). Interestingly, and also morerevealingly, the isotopomers are roughly distributed at a ratio of2:1:2:2:1:2 for M0, M1, M3, M4, M6, and M7. No M2 or M5 wasdetected (data not shown). The M0, M3, M4, and M7 pattern isconsistent with sedoheptulose 1-phosphate being synthesizedfrom two precursors, one being a triose (1:1 for M0 and M3),such as dihydroxyacetone phosphate, and another being atetraose (1:1 for M0 and M4), such as erythrose. Furthermore,the data also revealed that there was a minor pool of M1 and M6isotopomers for sedoheptulose 1-phosphate. The ratio betweenthe major (M0 and M7) and the minor forms (M1 and M6) ofsedoheptulose 1-phosphate is �2:1. The interpretation of theisotopomer distribution of the sedoheptulose 1-phosphate willbe addressed in detail under “Discussion.” The treatment withFK866 also led to a dose-dependent increase in M0, M3, M4,and M7 (Fig. 2B). Interestingly, fructose 1,6- bisphosphate wasfound to exhibit exactly the same pattern as fructose 1-phos-phate (i.e. M0, M3, and M6 present at a ratio of �1:2:1) (Fig.2A), again indicating that the majority of fructose 1,6-bisphos-
NAMPT Inhibition Alters Carbohydrate Metabolism
JUNE 19, 2015 • VOLUME 290 • NUMBER 25 JOURNAL OF BIOLOGICAL CHEMISTRY 15815
by guest on February 2, 2019http://w
ww
.jbc.org/D
ownloaded from
phate was originated from two trioses: dihydroxyacetone phos-phate and glyceraldehyde 3-phosphate in the treated cells. Thetreatment with FK866 led to a dose-dependent increase in M0,M3, and M6 (Fig. 2B). As expected, dihydroxyacetone phos-phate was solely present as M0 and M3 (1:1) (Fig. 2A), and thetreatment with FK866 led to a dose-dependent increase in M0and M3 (Fig. 2B).
To further investigate the kinetics of the isotopomer forma-tion, we carried out a time course study. In this study, we firsttreated HCT-116 cells with FK866 for 24 h and then U-13C6-labeled glucose and unlabeled glucose (1:1) for a differentperiod of time. For fructose 1-phosphate, the addition oflabeled glucose caused a rapid decrease in M0 (from �45 to �5nmol/mg protein) in the first 2 h followed by a rebound (Fig.2C). At 6 h, fructose 1-phosphate was mainly present as M0,M3, and M6 (�1:2:1) (Fig. 2C). These results indicated that theformation of fructose 1-phosphate from two trioses was veryrapid and reversible. After the first 2 h, the metabolite pools ofM0 and M6 reached to the equilibrium (Fig. 2C). Similarly forsedoheptulose 1-phosphate, the addition of labeled glucose
caused a time-dependent decrease in M0 (from �16 to �1nmol/mg protein) but a slow increase in M3, M4, and M7. At6 h, M0, M3, M4, and M7 were the most abundant isomerspresent at similar levels (Fig. 2C). These results indicated thatthe formation of sedoheptulose 1-phosphate was much slowerthan that of fructose 1-phosphate. Consistent with this, themetabolite pools of M0, M3, M4, and M7 reached equilibriumafter 6 h (Fig. 2C). For fructose 1,6-bisphosphate, the additionof labeled glucose caused a very rapid decrease in M0 in the first15 min (from �170 to �10 nmol/mg protein) followed with aslow rebound (Fig. 2C). At 6 h, M3 was about twice amount ofM0 and M6 (Fig. 2C), indicating that the majority of fructose1,6-bisphosphate was derived from glyceraldehyde 3-phos-phate and dihydroxyacetone phosphate. Consistent with this,the rate of M3 increase was higher than those of M0 and M6(Fig. 2C). Finally, for dihydroxyacetone phosphate, the additionof labeled glucose caused a very rapid decrease in M0 (from�110 to �40 nmol/mg protein) in the first 15 min accompa-nied with an increase in M3 (Fig. 2C). On the basis of theseresults and the fact that dihydroxyacetone phosphate is also
FIGURE 1. NAMPT inhibition leads to an increase in fructose 1,6-bisphosphate (FBP), DHAP, fructose 1-phosphate (F1P), and sedoheptulose 1-phos-phate (S1P) and a decrease in phosphoglycerate (PG), phosphoenolpyruvate (PEP), NAD�, and NADH. NCI-H1155 (B and D) and HCT-116 cells (A and C)were grown and treated with FK866 (0 –100 nM) and with or without nicotinic acid (NA) (10 �M) in duplicates as described (see “Experimental Procedures”). Afterthe treatment, cells were processed for the analysis of metabolites by LC-MS as described (see “Experimental Procedures”). The metabolites measured wereexpressed as nmol/mg total cellular protein. Error bars, S.D.
NAMPT Inhibition Alters Carbohydrate Metabolism
15816 JOURNAL OF BIOLOGICAL CHEMISTRY VOLUME 290 • NUMBER 25 • JUNE 19, 2015
by guest on February 2, 2019http://w
ww
.jbc.org/D
ownloaded from

accumulated, we hypothesized that fructose 1-phosphate isderived from the elevated levels of dihydroxyacetone phos-phate and glyceraldehyde and that sedoheptulose 1-phosphateis derived from the elevated levels of dihydroxyacetone phos-phate and erythrose via an aldolase condensation reaction.
Increased Levels of Fructose 1-Phosphate and Sedoheptulose1-Phosphate in Cancer Cells in Response to NAMPT InhibitionAre Derived from Elevated Levels of Dihydroxyacetone Phos-phate and Glyceraldehyde and of Erythrose, Respectively, via anAldolase Condensation Reaction; Evidence from the Biochemi-cal Studies—To test this hypothesis, we carried out biochemicalstudies using an aldolase (see “Experimental Procedures”). Asshown in Fig. 3A, when the enzymatic reactions were carriedout in the presence of glyceraldehyde and dihydroxyacetonephosphate, the formation of fructose 1-phosphate, but notsedoheptulose 1-phosphate, was observed and increased withdihydroxyacetone phosphate concentrations to about 9.0 mM
and then plateaued. Similar results were obtained when reac-tions were carried out at a fixed concentration of dihydroxyac-
etone phosphate and various concentrations of glyceraldehyde(Fig. 3A). When the enzymatic reactions were carried out in thepresence of erythrose and dihydroxyacetone phosphate, theformation of sedoheptulose 1-phosphate, but not fructose1-phosphate, was observed and increased with dihydroxyac-etone phosphate concentrations to about 10.0 mM and thenplateaued (Fig. 3B). Similar results were obtained when reac-tions were carried out at a fixed concentration of dihydroxyac-etone phosphate and various concentrations of erythrose (Fig.3B). On the basis of these kinetic results, the rate of formationfor fructose 1-phosphate is much higher (7–20-fold) than thatfor sedoheptulose 1-phosphate. To confirm the identity ofthese enzymatic products, we showed that the fructose 1-phos-phate formed exhibited a retention time and MS/MS spectraidentical to those of the standard of fructose 1-phosphate. Sim-ilarly, the sedoheptulose 1-phosphate synthesized was alsoshown to exhibit a retention time and MS/MS spectra identicalto those previously reported (29). In addition, these productsexhibited retention times and MS/MS spectra identical to those
FIGURE 2. Glucose-labeling studies suggest that fructose 1-phosphate (F1P) and sedoheptulose 1-phosphate (S1P) are derived from DHAP andglyceraldehyde and from erythrose, respectively, via aldolase. A, HCT-116 cells were grown and treated with FK866 (100 nM) in triplicates for 24 h. After thetreatment, the growth medium was removed and replaced with a freshly prepared medium containing FK866 (100 nM) and 13C-labeled glucose and unlabeledglucose (1:1) as described (see “Experimental Procedures”). The cells were incubated for 6 h. After the treatment, cells were collected and processed for theanalysis of fructose 1,6-bisphosphate (FBP), DHAP, F1P, and S1P levels by LC-MS (see “Experimental Procedures”). B, HCT-116 cells were grown in a mediumcontaining 13C-labeled glucose and unlabeled glucose (1:1), treated with FK866 (0.0 –100 nM) in triplicates for 24 h and processed for the analysis of metaboliteas described above. C, HCT-116 cells were grown and treated with FK866 (100 nM) in triplicates for 24 h. After the treatment, the growth medium was removedand replaced with a freshly prepared medium containing FK866 (100 nM) and 13C-labeled and unlabeled glucose (1:1) as described (see “ExperimentalProcedures”). The cells were incubated for a different period of time (0.25– 6 h) and processed for the analysis of metabolites as described above. M0 –M7,metabolites with 0 –7 carbons labeled. The metabolites measured were expressed as nmol/mg total cellular protein. Error bars, S.D.
NAMPT Inhibition Alters Carbohydrate Metabolism
JUNE 19, 2015 • VOLUME 290 • NUMBER 25 JOURNAL OF BIOLOGICAL CHEMISTRY 15817
by guest on February 2, 2019http://w
ww
.jbc.org/D
ownloaded from
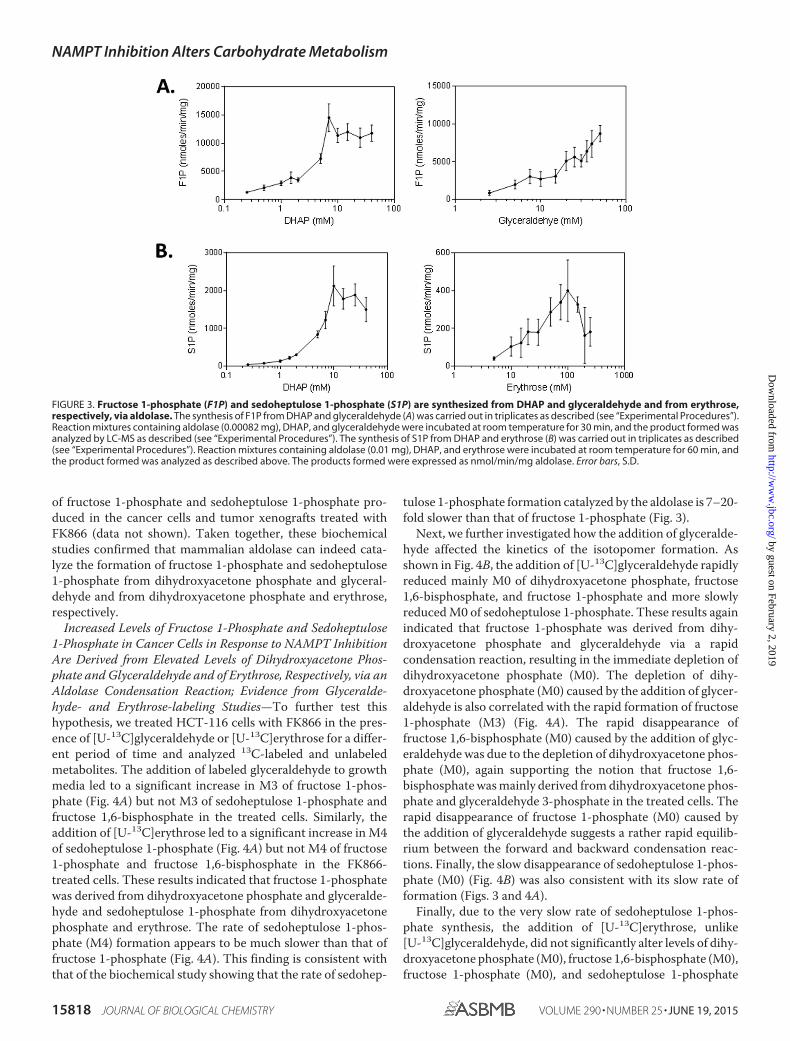
of fructose 1-phosphate and sedoheptulose 1-phosphate pro-duced in the cancer cells and tumor xenografts treated withFK866 (data not shown). Taken together, these biochemicalstudies confirmed that mammalian aldolase can indeed cata-lyze the formation of fructose 1-phosphate and sedoheptulose1-phosphate from dihydroxyacetone phosphate and glyceral-dehyde and from dihydroxyacetone phosphate and erythrose,respectively.
Increased Levels of Fructose 1-Phosphate and Sedoheptulose1-Phosphate in Cancer Cells in Response to NAMPT InhibitionAre Derived from Elevated Levels of Dihydroxyacetone Phos-phate and Glyceraldehyde and of Erythrose, Respectively, via anAldolase Condensation Reaction; Evidence from Glyceralde-hyde- and Erythrose-labeling Studies—To further test thishypothesis, we treated HCT-116 cells with FK866 in the pres-ence of [U-13C]glyceraldehyde or [U-13C]erythrose for a differ-ent period of time and analyzed 13C-labeled and unlabeledmetabolites. The addition of labeled glyceraldehyde to growthmedia led to a significant increase in M3 of fructose 1-phos-phate (Fig. 4A) but not M3 of sedoheptulose 1-phosphate andfructose 1,6-bisphosphate in the treated cells. Similarly, theaddition of [U-13C]erythrose led to a significant increase in M4of sedoheptulose 1-phosphate (Fig. 4A) but not M4 of fructose1-phosphate and fructose 1,6-bisphosphate in the FK866-treated cells. These results indicated that fructose 1-phosphatewas derived from dihydroxyacetone phosphate and glyceralde-hyde and sedoheptulose 1-phosphate from dihydroxyacetonephosphate and erythrose. The rate of sedoheptulose 1-phos-phate (M4) formation appears to be much slower than that offructose 1-phosphate (Fig. 4A). This finding is consistent withthat of the biochemical study showing that the rate of sedohep-
tulose 1-phosphate formation catalyzed by the aldolase is 7–20-fold slower than that of fructose 1-phosphate (Fig. 3).
Next, we further investigated how the addition of glyceralde-hyde affected the kinetics of the isotopomer formation. Asshown in Fig. 4B, the addition of [U-13C]glyceraldehyde rapidlyreduced mainly M0 of dihydroxyacetone phosphate, fructose1,6-bisphosphate, and fructose 1-phosphate and more slowlyreduced M0 of sedoheptulose 1-phosphate. These results againindicated that fructose 1-phosphate was derived from dihy-droxyacetone phosphate and glyceraldehyde via a rapidcondensation reaction, resulting in the immediate depletion ofdihydroxyacetone phosphate (M0). The depletion of dihy-droxyacetone phosphate (M0) caused by the addition of glycer-aldehyde is also correlated with the rapid formation of fructose1-phosphate (M3) (Fig. 4A). The rapid disappearance offructose 1,6-bisphosphate (M0) caused by the addition of glyc-eraldehyde was due to the depletion of dihydroxyacetone phos-phate (M0), again supporting the notion that fructose 1,6-bisphosphate was mainly derived from dihydroxyacetone phos-phate and glyceraldehyde 3-phosphate in the treated cells. Therapid disappearance of fructose 1-phosphate (M0) caused bythe addition of glyceraldehyde suggests a rather rapid equilib-rium between the forward and backward condensation reac-tions. Finally, the slow disappearance of sedoheptulose 1-phos-phate (M0) (Fig. 4B) was also consistent with its slow rate offormation (Figs. 3 and 4A).
Finally, due to the very slow rate of sedoheptulose 1-phos-phate synthesis, the addition of [U-13C]erythrose, unlike[U-13C]glyceraldehyde, did not significantly alter levels of dihy-droxyacetone phosphate (M0), fructose 1,6-bisphosphate (M0),fructose 1-phosphate (M0), and sedoheptulose 1-phosphate
FIGURE 3. Fructose 1-phosphate (F1P) and sedoheptulose 1-phosphate (S1P) are synthesized from DHAP and glyceraldehyde and from erythrose,respectively, via aldolase. The synthesis of F1P from DHAP and glyceraldehyde (A) was carried out in triplicates as described (see “Experimental Procedures”).Reaction mixtures containing aldolase (0.00082 mg), DHAP, and glyceraldehyde were incubated at room temperature for 30 min, and the product formed wasanalyzed by LC-MS as described (see “Experimental Procedures”). The synthesis of S1P from DHAP and erythrose (B) was carried out in triplicates as described(see “Experimental Procedures”). Reaction mixtures containing aldolase (0.01 mg), DHAP, and erythrose were incubated at room temperature for 60 min, andthe product formed was analyzed as described above. The products formed were expressed as nmol/min/mg aldolase. Error bars, S.D.
NAMPT Inhibition Alters Carbohydrate Metabolism
15818 JOURNAL OF BIOLOGICAL CHEMISTRY VOLUME 290 • NUMBER 25 • JUNE 19, 2015
by guest on February 2, 2019http://w
ww
.jbc.org/D
ownloaded from

(M0) (Fig. 4B). Taken together, these results support thehypothesis that the increased formation of fructose 1-phos-phate and sedoheptulose 1-phosphate in cancer cells inresponse to NAMPT inhibition is derived from elevated levelsof dihydroxyacetone phosphate and glyceraldehyde and oferythrose, respectively.
On the basis of these results, we reasoned that NAMPT inhi-bition may also lead to increased formation of glyceraldehydeand erythrose in the cell, which also contributes to increasedformation of fructose 1-phosphate and sedoheptulose 1-phos-phate, respectively. To test this, we treated HCT-116 cellswith FK866 in the presence or absence of NA (10 �M) andanalyzed glyceraldehyde and erythrose levels. As shown inFig. 5, the treatment with FK866 alone indeed led to a dose-dependent increase in glyceraldehyde and erythrose levels,whereas the addition of NA abolished the effects, showingthat the increased glyceraldehyde and erythrose were due toNAMPT inhibition. The level of glyceraldehyde was �4-foldhigher than that of erythrose, consistent with a lower level ofsedoheptulose 1-phosphate detected in the cell. Together,these results further support the hypothesis that the
increased formation of fructose 1-phosphate and sedohep-tulose 1-phosphate that is derived from the elevated levels ofdihydroxyacetone phosphate and glyceraldehyde and of ery-throse, respectively.
Inhibition of NAMPT Led to Increased Formation of Fructose1-Phosphate and Sedoheptulose 1-Phosphate in Other Types ofCancer Cell Lines—We have assessed the metabolic conse-quences of NAMPT inhibition in HCT-116 and NCI-H1155cells. To further investigate whether NAMPT inhibitionleads to similar metabolic changes in other types of cancercells, we treated the following cancer cell lines with FK866(0 –100 nM) for 24 h and analyzed fructose 1-phosphate,sedoheptulose 1-phosphate, and other glycolytic intermedi-ate levels as described above: A2780 (ovarian cancer), KM-12(colon cancer), HGC27 and SNU 484 (stomach cancer); PC-3(prostate cancer); and SK-N-SH (neuroblastoma). NAMPTinhibition also led to accumulation of fructose 1-phosphate,sedoheptulose 1-phosphate, and other glycolytic intermedi-ates in these cells (data not shown). These results indicatethat the physiological function of NAMPT is conserved indifferent types of cancer cells.
FIGURE 4. Inhibition of NAMPT leads to formation of corresponding labeled fructose 1-phosphate (F1P) and sedoheptulose 1-phosphate (S1P) fromlabeled glyceraldehyde and erythrose in cancer cells. HCT-116 cells were grown and treated in triplicates with FK866 (100 nM) for 24 h. After the treatment,the growth medium was replaced with a freshly prepared medium containing FK866 (100 nM), [13C]glyceraldehyde (1.0 mM), or [13C]erythrose (1.0 mM). Thecells were incubated for a different period of time as described (see “Experimental Procedures”). After the treatment, cells were processed for analysis of theeffects of glyceraldehyde and erythrose on the formation of fructose 1-phosphate (M3) and sedoheptulose 1-phosphate (M4) (A) and unlabeled F1P, S1P,fructose 1,6-bisphosphate (FBP), and DHAP (B) as described (see “Experimental Procedures”). The metabolites measured were expressed as nmol/mg totalcellular protein. Error bars, S.D.
NAMPT Inhibition Alters Carbohydrate Metabolism
JUNE 19, 2015 • VOLUME 290 • NUMBER 25 JOURNAL OF BIOLOGICAL CHEMISTRY 15819
by guest on February 2, 2019http://w
ww
.jbc.org/D
ownloaded from
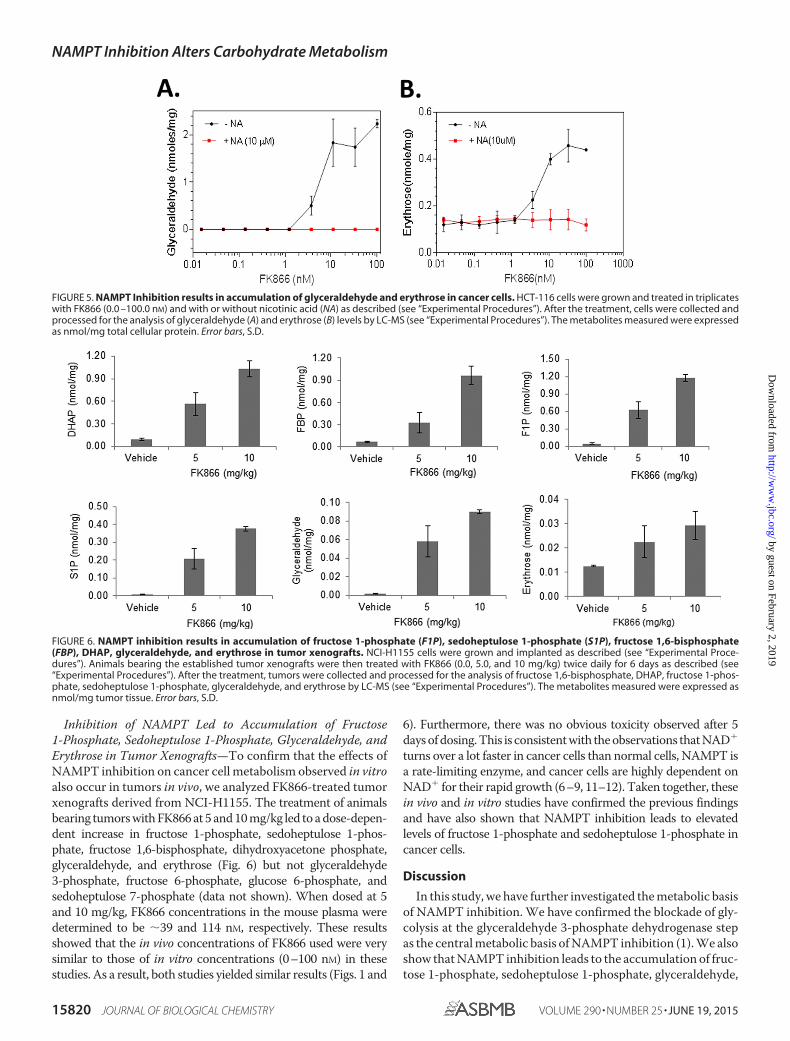
Inhibition of NAMPT Led to Accumulation of Fructose1-Phosphate, Sedoheptulose 1-Phosphate, Glyceraldehyde, andErythrose in Tumor Xenografts—To confirm that the effects ofNAMPT inhibition on cancer cell metabolism observed in vitroalso occur in tumors in vivo, we analyzed FK866-treated tumorxenografts derived from NCI-H1155. The treatment of animalsbearing tumors with FK866 at 5 and 10 mg/kg led to a dose-depen-dent increase in fructose 1-phosphate, sedoheptulose 1-phos-phate, fructose 1,6-bisphosphate, dihydroxyacetone phosphate,glyceraldehyde, and erythrose (Fig. 6) but not glyceraldehyde3-phosphate, fructose 6-phosphate, glucose 6-phosphate, andsedoheptulose 7-phosphate (data not shown). When dosed at 5and 10 mg/kg, FK866 concentrations in the mouse plasma weredetermined to be �39 and 114 nM, respectively. These resultsshowed that the in vivo concentrations of FK866 used were verysimilar to those of in vitro concentrations (0–100 nM) in thesestudies. As a result, both studies yielded similar results (Figs. 1 and
6). Furthermore, there was no obvious toxicity observed after 5days of dosing. This is consistent with the observations that NAD�
turns over a lot faster in cancer cells than normal cells, NAMPT isa rate-limiting enzyme, and cancer cells are highly dependent onNAD� for their rapid growth (6–9, 11–12). Taken together, thesein vivo and in vitro studies have confirmed the previous findingsand have also shown that NAMPT inhibition leads to elevatedlevels of fructose 1-phosphate and sedoheptulose 1-phosphate incancer cells.
Discussion
In this study, we have further investigated the metabolic basisof NAMPT inhibition. We have confirmed the blockade of gly-colysis at the glyceraldehyde 3-phosphate dehydrogenase stepas the central metabolic basis of NAMPT inhibition (1). We alsoshow that NAMPT inhibition leads to the accumulation of fruc-tose 1-phosphate, sedoheptulose 1-phosphate, glyceraldehyde,
FIGURE 5. NAMPT Inhibition results in accumulation of glyceraldehyde and erythrose in cancer cells. HCT-116 cells were grown and treated in triplicateswith FK866 (0.0 –100.0 nM) and with or without nicotinic acid (NA) as described (see “Experimental Procedures”). After the treatment, cells were collected andprocessed for the analysis of glyceraldehyde (A) and erythrose (B) levels by LC-MS (see “Experimental Procedures”). The metabolites measured were expressedas nmol/mg total cellular protein. Error bars, S.D.
FIGURE 6. NAMPT inhibition results in accumulation of fructose 1-phosphate (F1P), sedoheptulose 1-phosphate (S1P), fructose 1,6-bisphosphate(FBP), DHAP, glyceraldehyde, and erythrose in tumor xenografts. NCI-H1155 cells were grown and implanted as described (see “Experimental Proce-dures”). Animals bearing the established tumor xenografts were then treated with FK866 (0.0, 5.0, and 10 mg/kg) twice daily for 6 days as described (see“Experimental Procedures”). After the treatment, tumors were collected and processed for the analysis of fructose 1,6-bisphosphate, DHAP, fructose 1-phos-phate, sedoheptulose 1-phosphate, glyceraldehyde, and erythrose by LC-MS (see “Experimental Procedures”). The metabolites measured were expressed asnmol/mg tumor tissue. Error bars, S.D.
NAMPT Inhibition Alters Carbohydrate Metabolism
15820 JOURNAL OF BIOLOGICAL CHEMISTRY VOLUME 290 • NUMBER 25 • JUNE 19, 2015
by guest on February 2, 2019http://w
ww
.jbc.org/D
ownloaded from
and erythrose but not glucose 6-phosphate, fructose 6-phos-phate, and sedoheptulose 1-phosphate as previously thought(1). Furthermore, our combined biochemical and cellular stud-ies indicate that the increased formation of fructose 1-phos-phate and sedoheptulose 1-phosphate is derived from elevatedlevels of dihydroxyacetone phosphate and glyceraldehyde andof erythrose, respectively, via an aldolase activity. Together, thisstudy shows that inhibition of NAMPT leads to significantchanges in carbohydrate metabolism, and these metabolicchanges, such as elevated levels of fructose 1-phosphate andsedoheptulose 1-phosphate, may be used as unique pharmaco-dynamics markers for evaluating on-target effects of NAMPTinhibitors in tumors in the clinic.
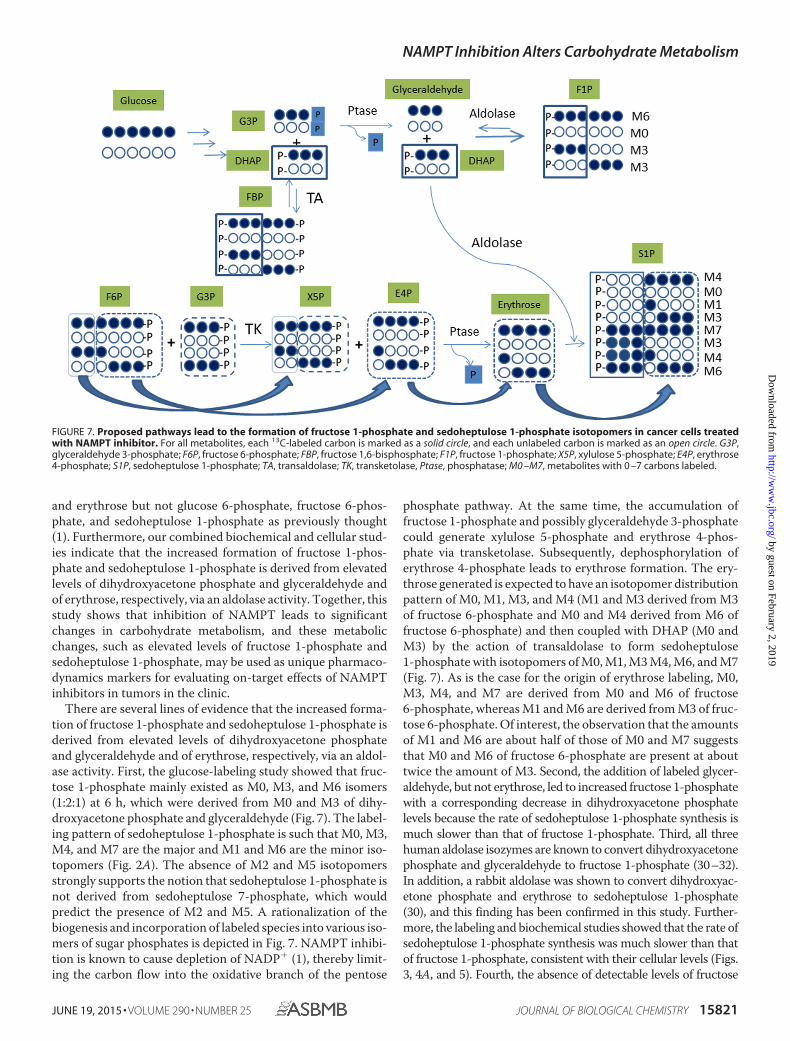
There are several lines of evidence that the increased forma-tion of fructose 1-phosphate and sedoheptulose 1-phosphate isderived from elevated levels of dihydroxyacetone phosphateand glyceraldehyde and of erythrose, respectively, via an aldol-ase activity. First, the glucose-labeling study showed that fruc-tose 1-phosphate mainly existed as M0, M3, and M6 isomers(1:2:1) at 6 h, which were derived from M0 and M3 of dihy-droxyacetone phosphate and glyceraldehyde (Fig. 7). The label-ing pattern of sedoheptulose 1-phosphate is such that M0, M3,M4, and M7 are the major and M1 and M6 are the minor iso-topomers (Fig. 2A). The absence of M2 and M5 isotopomersstrongly supports the notion that sedoheptulose 1-phosphate isnot derived from sedoheptulose 7-phosphate, which wouldpredict the presence of M2 and M5. A rationalization of thebiogenesis and incorporation of labeled species into various iso-mers of sugar phosphates is depicted in Fig. 7. NAMPT inhibi-tion is known to cause depletion of NADP� (1), thereby limit-ing the carbon flow into the oxidative branch of the pentose
phosphate pathway. At the same time, the accumulation offructose 1-phosphate and possibly glyceraldehyde 3-phosphatecould generate xylulose 5-phosphate and erythrose 4-phos-phate via transketolase. Subsequently, dephosphorylation oferythrose 4-phosphate leads to erythrose formation. The ery-throse generated is expected to have an isotopomer distributionpattern of M0, M1, M3, and M4 (M1 and M3 derived from M3of fructose 6-phosphate and M0 and M4 derived from M6 offructose 6-phosphate) and then coupled with DHAP (M0 andM3) by the action of transaldolase to form sedoheptulose1-phosphate with isotopomers of M0, M1, M3 M4, M6, and M7(Fig. 7). As is the case for the origin of erythrose labeling, M0,M3, M4, and M7 are derived from M0 and M6 of fructose6-phosphate, whereas M1 and M6 are derived from M3 of fruc-tose 6-phosphate. Of interest, the observation that the amountsof M1 and M6 are about half of those of M0 and M7 suggeststhat M0 and M6 of fructose 6-phosphate are present at abouttwice the amount of M3. Second, the addition of labeled glycer-aldehyde, but not erythrose, led to increased fructose 1-phosphatewith a corresponding decrease in dihydroxyacetone phosphatelevels because the rate of sedoheptulose 1-phosphate synthesis ismuch slower than that of fructose 1-phosphate. Third, all threehuman aldolase isozymes are known to convert dihydroxyacetonephosphate and glyceraldehyde to fructose 1-phosphate (30–32).In addition, a rabbit aldolase was shown to convert dihydroxyac-etone phosphate and erythrose to sedoheptulose 1-phosphate(30), and this finding has been confirmed in this study. Further-more, the labeling and biochemical studies showed that the rate ofsedoheptulose 1-phosphate synthesis was much slower than thatof fructose 1-phosphate, consistent with their cellular levels (Figs.3, 4A, and 5). Fourth, the absence of detectable levels of fructose
FIGURE 7. Proposed pathways lead to the formation of fructose 1-phosphate and sedoheptulose 1-phosphate isotopomers in cancer cells treatedwith NAMPT inhibitor. For all metabolites, each 13C-labeled carbon is marked as a solid circle, and each unlabeled carbon is marked as an open circle. G3P,glyceraldehyde 3-phosphate; F6P, fructose 6-phosphate; FBP, fructose 1,6-bisphosphate; F1P, fructose 1-phosphate; X5P, xylulose 5-phosphate; E4P, erythrose4-phosphate; S1P, sedoheptulose 1-phosphate; TA, transaldolase; TK, transketolase, Ptase, phosphatase; M0 –M7, metabolites with 0 –7 carbons labeled.
NAMPT Inhibition Alters Carbohydrate Metabolism
JUNE 19, 2015 • VOLUME 290 • NUMBER 25 JOURNAL OF BIOLOGICAL CHEMISTRY 15821
by guest on February 2, 2019http://w
ww
.jbc.org/D
ownloaded from
and sedoheptulose in the FK866-treated cells (data not shown)ruled out a direct phosphorylation event involving enzymes likeketohexokinase and sedoheptulokinase (33, 34). In addition, theexpression of ketohexokinase is diminished in the human clear celltype of renal cell carcinoma (35). Taken together, these resultsindicate that NAMPT inhibition leads to accumulation of fructose1-phosphate and sedoheptulose 1-phosphate synthesized via analdolase condensation reaction (Fig. 7).
The increased glyceraldehyde and erythrose levels in cancercells have been reported and are metabolically intriguing. Theinterconversion of dihydroxyacetone phosphate and glyceral-dehyde 3-phosphate is catalyzed by triose-phosphate isomer-ase, one of the most efficient enzymes (36, 37). In the forwarddirection, the kcat for the enzyme is near 500 s�1, and in thereverse direction, it is about 5,000 s�1 (37). Based on this, the
overall equilibrium constant calculated from the total dihy-droxyacetone phosphate/glyceraldehyde 3-phosphate ratio is22 (37). Thus, the physiological concentration of glyceralde-hyde 3-phosphate is only a fraction of dihydroxyacetone phos-phate. This might have explained why glyceraldehyde 3-phos-phate is barely detectable in either FK866-treated or untreatedcells. However, due to the significant accumulation of dihy-droxyacetone phosphate in the treated cells, this may push theequilibrium toward glyceraldehyde 3-phosphate formation,resulting in dephosphorylation to glyceraldehyde. Similarly, theaccumulation of erythrose 4-phosphate (1) may also lead to itsdephosphorylation to erythrose because erythrose 4-phosphateis an intermediate of the pentose phosphate pathway and has noother metabolic function. Finally, the significant absence of M1,M2, M4, and M5 of fructose 1,6-bisphosphate (data not shown)
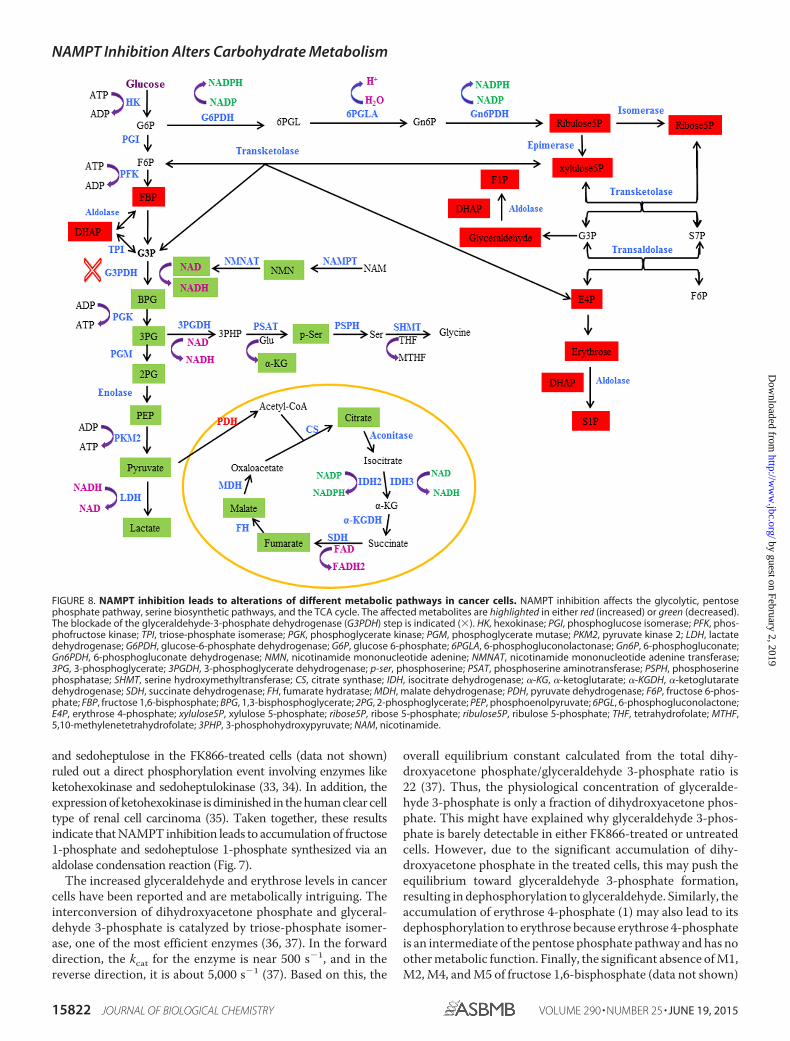
FIGURE 8. NAMPT inhibition leads to alterations of different metabolic pathways in cancer cells. NAMPT inhibition affects the glycolytic, pentosephosphate pathway, serine biosynthetic pathways, and the TCA cycle. The affected metabolites are highlighted in either red (increased) or green (decreased).The blockade of the glyceraldehyde-3-phosphate dehydrogenase (G3PDH) step is indicated (�). HK, hexokinase; PGI, phosphoglucose isomerase; PFK, phos-phofructose kinase; TPI, triose-phosphate isomerase; PGK, phosphoglycerate kinase; PGM, phosphoglycerate mutase; PKM2, pyruvate kinase 2; LDH, lactatedehydrogenase; G6PDH, glucose-6-phosphate dehydrogenase; G6P, glucose 6-phosphate; 6PGLA, 6-phosphogluconolactonase; Gn6P, 6-phosphogluconate;Gn6PDH, 6-phosphogluconate dehydrogenase; NMN, nicotinamide mononucleotide adenine; NMNAT, nicotinamide mononucleotide adenine transferase;3PG, 3-phosphoglycerate; 3PGDH, 3-phosphoglycerate dehydrogenase; p-ser, phosphoserine; PSAT, phosphoserine aminotransferase; PSPH, phosphoserinephosphatase; SHMT, serine hydroxymethyltransferase; CS, citrate synthase; IDH, isocitrate dehydrogenase; �-KG, �-ketoglutarate; �-KGDH, �-ketoglutaratedehydrogenase; SDH, succinate dehydrogenase; FH, fumarate hydratase; MDH, malate dehydrogenase; PDH, pyruvate dehydrogenase; F6P, fructose 6-phos-phate; FBP, fructose 1,6-bisphosphate; BPG, 1,3-bisphosphoglycerate; 2PG, 2-phosphoglycerate; PEP, phosphoenolpyruvate; 6PGL, 6-phosphogluconolactone;E4P, erythrose 4-phosphate; xylulose5P, xylulose 5-phosphate; ribose5P, ribose 5-phosphate; ribulose5P, ribulose 5-phosphate; THF, tetrahydrofolate; MTHF,5,10-methylenetetrahydrofolate; 3PHP, 3-phosphohydroxypyruvate; NAM, nicotinamide.
NAMPT Inhibition Alters Carbohydrate Metabolism
15822 JOURNAL OF BIOLOGICAL CHEMISTRY VOLUME 290 • NUMBER 25 • JUNE 19, 2015
by guest on February 2, 2019http://w
ww
.jbc.org/D
ownloaded from

indicates that the contribution from the oxidative branch of thepentose phosphate pathway to the formation of fructose 1,6-bisphosphate is very limited. This also indicates that the con-tribution from the non-oxidative branch of the pathway is themain source of the formation of fructose 1,6-bisphosphate,especially M3. Therefore, the significant conversion of fructose6-phosphate to glyceraldehyde 3-phosphate and erythrose4-phosphate (Fig. 7) may have explained why fructose 1,6-bis-phosphate was accumulated but fructose 6-phosphate was not.
Fructose 1-phosphate has been reported in renal cell carci-noma (38), but sedoheptulose 1-phosphate, to our knowledge,has not been reported in any cancer cells. The physiologicalrelevance of these metabolites to cancer cells is therefore notclear. Fructose 1-phosphate is well known for its important rolein regulating glucokinase activity in the liver by binding to theregulatory protein of glucokinase (39). The binding of fructose1-phosphate to the regulatory protein prevents the regulatoryprotein from inhibiting glucokinase activity, thereby promot-ing glucose phosphorylation (39). It is possible that fructose1-phosphate may play a similar role in cancer cells to increaseglucose phosphorylation in order to compensate for thereduced glycolytic activity as the blockade at the glyceraldehyde3-phosphate dehydrogenase step imposed by NAMPT inhibi-tion significantly reduces glycolysis.
The findings from this study may have significant clinicalimplications. To effectively assess a molecule in the clinic, it isessential to have a robust clinical diagnostic assay for identify-ing appropriate patient populations and also a reliable pharma-codynamics biomarker assay for evaluating effects of the mole-cule on its intended target in tumors. As proposed previously(1), the altered metabolite levels, such as increased fructose1,6-bisphosphate and dihydroxyacetone phosphate levels, anddecreased 2(3)-phosphoglycerate and pyruvate level in tumorscan be used to assess on-target effects of NAMPT inhibitors inthe clinic. This study suggests that the altered metabolite levels,especially those of fructose 1-phosphate and sedoheptulose1-phosphate, can be used as ideal pharmacodynamics biomark-ers as compared with other altered metabolites because thesemetabolites are highly elevated upon treatment and yet almostabsent in untreated cells. Thus, implementing the LC-MSmethodology for detecting and quantifying these metabolites inthe clinic may enhance our understanding of the mechanism ofaction of NAMPT inhibitors in the clinic and subsequentlyaccelerate their clinical development.
In summary (see Fig. 8), the previous study (1) shows thatNAMPT inhibition leads to attenuation of glycolysis at the glyc-eraldehyde 3-phosphate dehydrogenase step due to thereduced availability of NAD� for the enzyme. The attenuationof glycolysis results in the accumulation of glycolytic interme-diates before and at the glyceraldehyde 3-phosphate dehydro-genase step, as evidenced by the increased levels of intermedi-ates, such as fructose 1,6-bisphosphate and dihydroxyacetonephosphate. The attenuation of glycolysis also causes decreasedglycolytic intermediates, such as 2(3)-phosphoglycerate andpyruvate, after the glyceraldehyde 3-phosphate dehydrogenasestep, thereby reducing carbon flow into serine biosynthesis andthe TCA cycle. This study shows that inhibition of NAMPT alsoleads to the accumulation of fructose 1-phosphate, sedoheptu-
lose 1-phosphate, glyceraldehyde, and erythrose in multiplecancer cell lines and tumor xenografts but not glucose 6-phos-phate, fructose 6-phosphate, and glyceraldehyde 3-phosphateas previously thought (1). The increased levels of fructose1-phosphate and sedoheptulose 1-phosphate are probablyderived from elevated levels of dihydroxyacetone phosphateand glyceraldehyde and of erythrose, respectively, via an aldol-ase reaction.
Acknowledgments—We thank Jake Starling, Alfonso De Dios, TimBurkholder, and Gregory D. Plowman for support, guidance, and crit-ical review of the manuscript.
References1. Tan, B., Young, D. A., Lu, Z. H., Wang, T., Meier, T. I., Shepard, R. L., Roth,
K., Zhai, Y., Huss, K., Kuo, M. S., Gillig, J., Parthasarathy, S., Burkholder,T. P., Smith, M. C., Geeganage, S., and Zhao, G. (2013) Pharmacologicalinhibition of nicotinamide phosphoribosyltransferase (NAMPT), an en-zyme essential for NAD� biosynthesis, in human cancer cells: metabolicbasis and potential clinical implications. J. Biol. Chem. 288, 3500 –3511
2. Garten, A., Petzold, S., Korner, A., Imai, S., and Kiess, W. (2009) Nampt:linking NAD� biology, metabolism and cancer. Trends Endocrinol.Metab. 20, 130 –138
3. Kirkland, J. B. (2009) Niacin status, NAD distribution and ADP-ribosemetabolism. Curr. Pharm. Des. 15, 3–11
4. Magni, G., Amici, A., Emanuelli, M., Orsomando, G., Raffaelli, N., andRuggieri, S. (2004) Enzymology of NAD� homeostasis in man. Cell Mol.Life Sci. 61, 19 –34
5. Sauve, A. A. (2008) NAD� and vitamin B3: from metabolism to therapies.J. Pharmacol. Exp. Ther. 324, 883– 893
6. Olesen, U. H., Thougaard, A. V., Jensen, P. B., and Sehested, M. (2010) Apreclinical study on the rescue of normal tissue by nicotinic acid in high-dose treatment with APO866, a specific nicotinamide phosphoribosyl-transferase inhibitor. Mol. Cancer Ther. 9, 1609 –1617
7. Olesen, U. H., Christensen, M. K., Björkling, F., Jäättelä, M., Jensen, P. B.,Sehested, M., and Nielsen, S. J. (2008) Anticancer agent CHS-828 inhibitscellular synthesis of NAD. Biochem. Biophys. Res. Commun. 367,799 – 804
8. Watson, M., Roulston, A., Bélec, L., Billot, X., Marcellus, R., Bédard, D.,Bernier, C., Branchaud, S., Chan, H., Dairi, K., Gilbert, K., Goulet, D.,Gratton, M. O., Isakau, H., Jang, A., Khadir, A., Koch, E., Lavoie, M.,Lawless, M., Nguyen, M., Paquette, D., Turcotte, E., Berger, A., Mitchell,M., Shore, G. C., and Beauparlant, P. (2009) The small moleculeGMX1778 is potent inhibitor of NAD� biosynthesis: strategy for en-hanced therapy in nicotinic acid phosphoribosyltransferase 1-deficienttumors. Mol. Cell. Biol. 29, 5872–5888
9. Revollo, J. R., Grimm, A. A., and Imai, S. (2004) The NAD biosynthesispathway mediated by nicotinamide phosphoribosyltransferase regulatesSir2 activity in mammalian cells. J. Biol. Chem. 279, 50754 –50763
10. Rongvaux, A., Galli, M., Denanglaire, S., Van Gool, F., Drèze, P. L., Szpirer,C., Bureau, F., Andris, F., and Leo, O. (2008) Nicotinamide phosphoribosyltransferase/pre-B cell colony-enhancing factor/visfatin is required forlymphocyte development and cellular resistance to genotoxic stress. J. Im-munol. 181, 4685– 4695
11. Imai, S. (2009) Nicotinamide phosphoribosyltransferase (NAMPT): A linkbetween NAD biology, metabolism, and diseases. Curr. Pharm. Des. 15,20 –28
12. Khan, J. A., Forouhar, F., Tao, X., and Tong, L. (2007) Nicotinamide ade-nine dinucleotide metabolism as an attractive target for drug discovery.Expert Opin. Ther. Targets 11, 695–705
13. Luk, T., Malam, Z., and Marshall, J. C. (2008) Pre-B cell colony-enhancingfactor (PBEF)/visfatin: a novel mediator of innate immunity. J. Leukoc.Biol. 83, 804 – 816
14. Bi, T. Q., Che, X. M., Liao, X. H., Zhang, D. J., Long, H. L., Li, H. J., andZhao, W. (2011) Overexpression of Nampt in gastric cancer and chemo-
NAMPT Inhibition Alters Carbohydrate Metabolism
JUNE 19, 2015 • VOLUME 290 • NUMBER 25 JOURNAL OF BIOLOGICAL CHEMISTRY 15823
by guest on February 2, 2019http://w
ww
.jbc.org/D
ownloaded from

potentiating effects of the Nampt inhibitor FK866 in combination withfluorouracil. Oncol. Rep. 26, 1251–1257
15. Hufton, S. E., Moerkerk, P. T., Brandwijk, R., de Bruıne, A. P., Arends,J. W., Hoogenboom, H. R. (1999) A profile of differentially expressed genesin primary colorectal cancer using suppression subtractive hybridization.FEBS Lett. 463, 77– 82
16. Van Beijnum, J. R., Moerkerk, P. T., Gerbers, A. J., De Bruıne, A. P., Ar-ends, J. W., and Hoogenboom, H. R., and Hufton, S. E. (2002) Targetvalidation for genomics using peptide-specific phage antibodies: a study offive gene products overexpressed in colorectal cancer. Int. J. Cancer 101,118 –127
17. Wang, B., Hasan, M. K., Alvarado, E., Yuan, H., Wu, H., and Chen, W. Y.(2011) NAMPT overexpression in prostate cancer and its contribution totumor cell survival and stress response. Oncogene 30, 907–921
18. Nakajima, T. E., Yamada, Y., Hamano, T., Furuta, K., Gotoda, T., Katai, H.,Kato, K., Hamaguchi, T., and Shimada, Y. (2009) Adipocytokine levels ingastric cancer patients: resistin and visfatin as biomarkers of gastric can-cer. J. Gastroenterol. 44, 685– 690
19. Busso, N., Karababa, M., Nobile, M., Rolaz, A., Van Gool, F., Galli, M., Leo,O., So, A., and De Smedt, T. (2008) Pharmacological inhibition of nicotin-amide phosphoribosyltransferase/visfatin enzymatic activity identifies anew inflammatory pathway linked to NAD. PLoS One 3, e2267
20. Hasmann, M., and Schemainda, I. (2003) FK866, a highly specific non-competitive inhibitor of nicotinamide phosphoribosyltransferase, repre-sents a novel mechanism for induction of tumor cell apoptosis. CancerRes. 63, 7436 –7442
21. Yang, H., Yang, T., Baur, J. A., Perez, E., Matsui, T., Carmona, J. J., Lam-ming, D. W., Souza-Pinto, N. C., Bohr, V. A., Rosenzweig, A., de Cabo, R.,Sauve, A. A., and Sinclair, D. A. (2007) Nutrient-sensitive mitochondrialNAD� levels dictate cell survival. Cell 130, 1095–1107
22. Drevs, J., Loser, R., Rattel, B., and Esser, N. (2003) Antiangiogenic potencyof FK866/K22.175, a new inhibitor of intracellular NAD biosynthesis, inmurine renal cell carcinoma. Anticancer Res. 23, 4853– 4858
23. Muruganandham, M., Alfieri, A. A., Matei, C., Chen, Y., Sukenick, G.,Schemainda, I., Hasmann, M., Saltz, L. B., Koutcher, J. A. (2005) Metabolicsignatures associated with a NAD synthesis inhibitor-induced tumorapoptosis identified by 1H-decoupled-31P magnetic resonance spectros-copy. Clin. Cancer Res. 11, 3503–3513
24. Giannetti, A. M., Zheng, X., Skelton, N. J., Wang, W., Bravo, B. J., Bair,K. W., Baumeister, T., Cheng, E., Crocker, L., Feng, Y., Gunzner-Toste, J.,Ho, Y. C., Hua, R., Liederer, B. M., Liu, Y., Ma, X., O’Brien, T., Oeh, J.,Sampath, D., Shen, Y., Wang, C., Wang, L., Wu, H., Xiao, Y., Yuen, P. W.,Zak, M., Zhao, G., Zhao, Q., and Dragovich, P. S. (2014) Fragment-basedidentification of amides derived from trans-2-(pyridin-3-yl)cyclopropane-carboxylic acid as potent inhibitors of human nicotinamide phosphoribosyl-transferase (NAMPT). J. Med. Chem. 57, 770–792
25. Zheng, X., Bauer, P., Baumeister, T., Buckmelter, A. J., Caligiuri, M., Clod-felter, K. H., Han, B., Ho, Y. C., Kley, N., Lin, J., Reynolds, D. J., Sharma, G.,Smith, C. C., Wang, Z., Dragovich, P. S., Gunzner-Toste, J., Liederer, B. M.,Ly, J., O’Brien, T., Oh, A., Wang, L., Wang, W., Xiao, Y., Zak, M., Zhao, G.,Yuen, P. W., and Bair, K. W. (2013) Structure-based discovery of novelamide-containing nicotinamide phosphoribosyltransferase (nampt) in-
hibitors. J. Med. Chem. 56, 6413– 643326. Du, L., Zhang, X., Han, Y. Y., Burke, N. A., Kochanek, P. M., Watkins, S. C.,
Graham, S. H., Carcillo, J. A., Szabó, C., and Clark, R. S. (2003) Intra-mitochondrial poly(ADP-ribosylation) contributes to NAD� depletionand cell death induced by oxidative stress. J. Biol. Chem. 278,18426 –18433
27. Pillai, J. B., Isbatan, A., Imai, S., and Gupta, M. P. (2005) Poly(ADP-ribose)polymerase-1-dependent cardiac myocyte cell death during heart failureis mediated by NAD� depletion and reduced Sir2� deacetylase activity.J. Biol. Chem. 280, 43121– 43130
28. Yu, S. W., Wang, H., Poitras, M. F., Coombs, C., Bowers, W. J., Federoff,H. J., Poirier, G. G., Dawson, T. M., and Dawson, V. L. (2002) Mediation ofpoly(ADP-ribose) polymerase-1-dependent cell death by apopto-sis-inducing factor. Science 297, 259 –263
29. Clasquin, M. F., Melamud, E., Singer, A., Gooding, J. R., Xu, X., Dong, A.,Cui, H., Campagna, S. R., Savchenko, A., Yakunin, A. F., Rabinowitz, J. D.,and Caudy, A. A. (2011) Riboneogenesis in yeast. Cell 145, 969 –980
30. Rellos, P., Sygusch, J., and Cox, T M. (2000) Expression, purification, andcharacterization of natural mutants of human aldolase B: role of quater-nary structure in catalysis. J. Biol. Chem. 275, 1145–1151
31. Kitajima, Y., Takasaki, Y., Takahashi, I., and Hori, K. (1990) Constructionand properties of active chimeric enzymes between human aldolases Aand B: analysis of molecular regions which determine isozyme-specificfunctions. J. Biol. Chem. 265, 17493–17498
32. Kusakabe, T., Motoki, K., and Hori, K. (1994) Human aldolase C: charac-terization of the recombinant enzyme expressed in E. coli. J. Biochem. 115,1172–1177
33. Bais, R., James, H. M., Rofe, A. M., and Conyers, R. A. (1985) The purifi-cation and properties of human liver ketohexokinase: a role for keto-hexokinase and fructose-bisphosphate aldolase in the metabolic produc-tion of oxalate from xylitol. Biochem. J. 230, 53– 60
34. Kardon, T., Stroobant, V., Veiga-da-Cunha, M., and Schaftingen, E. V.(2008) Characterization of mammalian sedoheptulokinase and mecha-nism of formation of erythritol in sedoheptulokinase deficiency. FEBSLett. 582, 3330 –3334
35. Hwa, J. S., Kim, H. J., Goo, B. M., Park, H. J., Kim, C. W., Chung, K. H., Park,H. C., Chang, S. H., Kim, Y. W., Kim, D. R., Cho, G. J., Choi, W. S., Kang,K. R. (2006) The expression of ketohexokinase is diminished in humanclear cell type of renal cell carcinoma. Proteomics 6, 1077–1084
36. Albery, W. J., and Knowles, J. R. (1976) Evolution of enzyme function andthe development of catalytic efficiency. Biochemistry 15, 5631–5640
37. Wierenga, R. K., Kapetaniou, E. G., and Venkatesan, R. (2010) Triosephos-phate isomerase: a highly evolved biocatalyst. Cell Mol. Life Sci. 67,3961–3982
38. Catchpole, G., Platzer, A., Weikert, C., Kempkensteffen, C., Johannsen,M., Krause, H., Jung, K., Miller, K., Willmitzer, L., Selbig, J., and Weikert, S.(2011) Metabolic profiling reveals key metabolic features of renal cell car-cinoma. J. Cell Mol. Med. 15, 109 –118
39. Beck, T., and Miller, B. G. (2013) Structural basis for regulation ofhuman glucokinase by glucokinase regulatory protein. Biochemistry52, 6232– 6239
NAMPT Inhibition Alters Carbohydrate Metabolism
15824 JOURNAL OF BIOLOGICAL CHEMISTRY VOLUME 290 • NUMBER 25 • JUNE 19, 2015
by guest on February 2, 2019http://w
ww
.jbc.org/D
ownloaded from

Geeganage, Ming-Shang Kuo and Genshi ZhaoBo Tan, Sucai Dong, Robert L. Shepard, Lisa Kays, Kenneth D. Roth, Sandaruwan
Cancer Cells Biosynthesis, Leads to Altered Carbohydrate Metabolism in+Essential for NAD
Inhibition of Nicotinamide Phosphoribosyltransferase (NAMPT), an Enzyme
doi: 10.1074/jbc.M114.632141 originally published online May 5, 20152015, 290:15812-15824.J. Biol. Chem.
10.1074/jbc.M114.632141Access the most updated version of this article at doi:
Alerts:
When a correction for this article is posted•
When this article is cited•
to choose from all of JBC's e-mail alertsClick here
http://www.jbc.org/content/290/25/15812.full.html#ref-list-1
This article cites 39 references, 14 of which can be accessed free at
by guest on February 2, 2019http://w
ww
.jbc.org/D
ownloaded from