inhaled product characterization - copley scientific job 147_inhaled produ… · inhaled product...
TRANSCRIPT

Particle Characterization
Cascade impaction is mandated by the regulators for the measurement of aerodynamic particle size for all orally inhaled and nasal drug products (OINDPs). Multistage cascade impactors are used
to size-fractionate a sample on the basis of particle inertia, uniquely enabling measurement of the particle-size distri-bution of the active ingredient, rather than of the complete formulation. The resulting information is crucial when as-sessing the likely deposition behavior of the drug during inhalation and is also widely taken to be an in vitro indicator of delivery efficiency.
Through development and into quality control (QC), cas-cade impaction generates significant amounts of data. For newcomers to the technique, understanding how to process and use data for comparative testing can be a significant challenge. On the other hand, those leading the industry are currently involved in an active debate over the best metrics for characterizing OINDP particle size and the optimal way of measuring them.
Beginning with an introduction to the technique of mul-tistage cascade impaction, this article discusses analysis of the resulting data. A particular focus is the different cal-culation methods used to determine mass median aerody-namic diameter (MMAD). MMAD is one of the metrics most widely adopted as a single number descriptor of aero-dynamic particle-size distribution (APSD), and the topic of a recent Pharmacopoeial Forum Stimuli article (1). We con-clude with a review of current industry thinking as to the most appropriate way to characterize OINDP particle size, outlining abbreviated impactor measurement (AIM) and the thinking behind efficient data analysis (EDA).
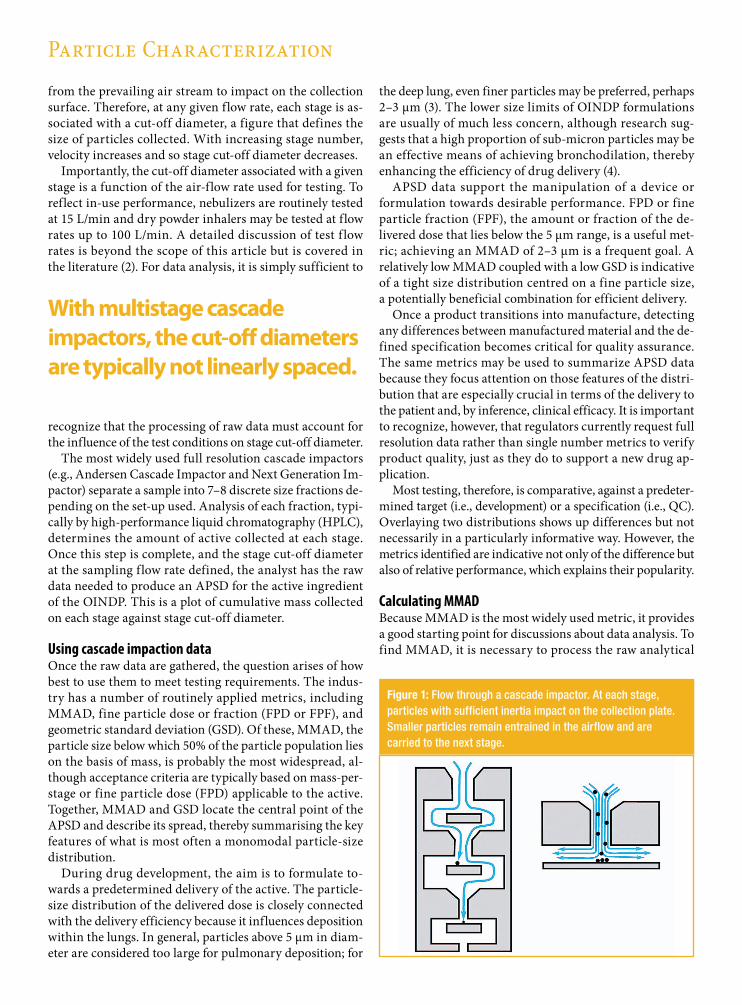
Multistage cascade impactionMultistage cascade impactors separate an incoming sample into discrete fractions on the basis of particle inertia, which is a function of particle size and velocity. These precision instruments consist of a series of stages each comprising a plate with a specific nozzle arrangement and collection surface. As nozzle size and total nozzle area both decrease with increasing stage number, the velocity of the sample-laden air increases as it proceeds through the instrument. At each stage, particles with sufficient inertia break free
Inhaled Product CharacterizationCalculating Particle-Size Distribution MetricsDavid Lewis and Mark Copley
Cascade impaction is mandatory for the measurement of aerodynamic particle size in all orally inhaled and nasal drug products (OINDPs). It provides information that is crucial when assessing the likely deposition behavior of the drug during inhalation and is used as an in vitro indicator of delivery efficiency. There is widespread interest in and considerable discussion about the best approach to streamlining analysis of the data that multistage cascade impaction generates. Beginning with an introduction to the technique, the authors discuss the analysis of the resulting data, focusing on methods for the calculation of mass median aerodynamic diameter, one of the metrics routinely used for comparative testing. It concludes with a review of current industry thinking as to the most appropriate way to characterize OINDP particle size.
David Lewis is managing director at 3DI Solutions, and Mark Copley* is sales director at Copley Scientific, Colwick Quays Business Park, Private Road No. 2, Colwick, Nottingham, NG4 2JY, UK, tel: +44 115.961.6229, fax: +44 115.961.7637, [email protected]
*To whom all correspondence should be addressed.
Particle Characterization
from the prevailing air stream to impact on the collection surface. Therefore, at any given flow rate, each stage is as-sociated with a cut-off diameter, a figure that defines the size of particles collected. With increasing stage number, velocity increases and so stage cut-off diameter decreases.
Importantly, the cut-off diameter associated with a given stage is a function of the air-flow rate used for testing. To reflect in-use performance, nebulizers are routinely tested at 15 L/min and dry powder inhalers may be tested at flow rates up to 100 L/min. A detailed discussion of test f low rates is beyond the scope of this article but is covered in the literature (2). For data analysis, it is simply sufficient to
recognize that the processing of raw data must account for the influence of the test conditions on stage cut-off diameter.
The most widely used full resolution cascade impactors (e.g., Andersen Cascade Impactor and Next Generation Im-pactor) separate a sample into 7–8 discrete size fractions de-pending on the set-up used. Analysis of each fraction, typi-cally by high-performance liquid chromatography (HPLC), determines the amount of active collected at each stage. Once this step is complete, and the stage cut-off diameter at the sampling flow rate defined, the analyst has the raw data needed to produce an APSD for the active ingredient of the OINDP. This is a plot of cumulative mass collected on each stage against stage cut-off diameter.
Using cascade impaction dataOnce the raw data are gathered, the question arises of how best to use them to meet testing requirements. The indus-try has a number of routinely applied metrics, including MMAD, fine particle dose or fraction (FPD or FPF), and geometric standard deviation (GSD). Of these, MMAD, the particle size below which 50% of the particle population lies on the basis of mass, is probably the most widespread, al-though acceptance criteria are typically based on mass-per-stage or fine particle dose (FPD) applicable to the active. Together, MMAD and GSD locate the central point of the APSD and describe its spread, thereby summarising the key features of what is most often a monomodal particle-size distribution.
During drug development, the aim is to formulate to-wards a predetermined delivery of the active. The particle-size distribution of the delivered dose is closely connected with the delivery efficiency because it influences deposition within the lungs. In general, particles above 5 µm in diam-eter are considered too large for pulmonary deposition; for
the deep lung, even finer particles may be preferred, perhaps 2–3 µm (3). The lower size limits of OINDP formulations are usually of much less concern, although research sug-gests that a high proportion of sub-micron particles may be an effective means of achieving bronchodilation, thereby enhancing the efficiency of drug delivery (4).
APSD data support the manipulation of a device or formulation towards desirable performance. FPD or fine particle fraction (FPF), the amount or fraction of the de-livered dose that lies below the 5 µm range, is a useful met-ric; achieving an MMAD of 2–3 µm is a frequent goal. A relatively low MMAD coupled with a low GSD is indicative of a tight size distribution centred on a fine particle size, a potentially beneficial combination for efficient delivery.
Once a product transitions into manufacture, detecting any differences between manufactured material and the de-fined specification becomes critical for quality assurance. The same metrics may be used to summarize APSD data because they focus attention on those features of the distri-bution that are especially crucial in terms of the delivery to the patient and, by inference, clinical efficacy. It is important to recognize, however, that regulators currently request full resolution data rather than single number metrics to verify product quality, just as they do to support a new drug ap-plication.
Most testing, therefore, is comparative, against a predeter-mined target (i.e., development) or a specification (i.e., QC). Overlaying two distributions shows up differences but not necessarily in a particularly informative way. However, the metrics identified are indicative not only of the difference but also of relative performance, which explains their popularity.
Calculating MMADBecause MMAD is the most widely used metric, it provides a good starting point for discussions about data analysis. To find MMAD, it is necessary to process the raw analytical
With multistage cascade impactors, the cut-off diameters are typically not linearly spaced.
Figure 1: Flow through a cascade impactor. At each stage, particles with sufficient inertia impact on the collection plate. Smaller particles remain entrained in the airflow and are carried to the next stage.
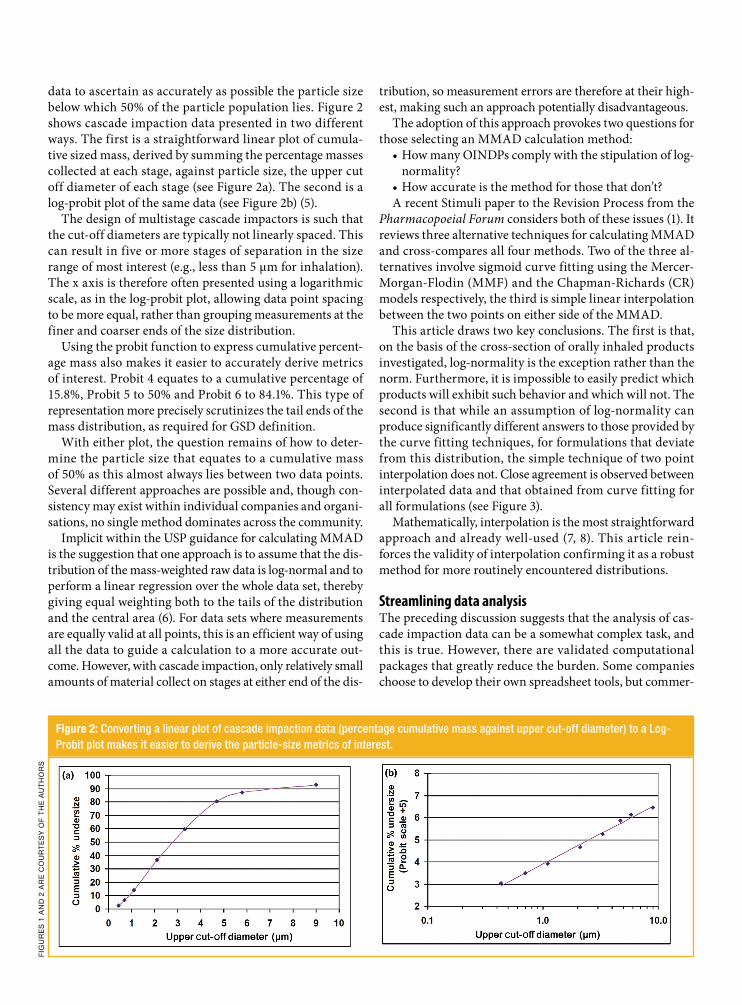
data to ascertain as accurately as possible the particle size below which 50% of the particle population lies. Figure 2 shows cascade impaction data presented in two different ways. The first is a straightforward linear plot of cumula-tive sized mass, derived by summing the percentage masses collected at each stage, against particle size, the upper cut off diameter of each stage (see Figure 2a). The second is a log-probit plot of the same data (see Figure 2b) (5).
The design of multistage cascade impactors is such that the cut-off diameters are typically not linearly spaced. This can result in five or more stages of separation in the size range of most interest (e.g., less than 5 µm for inhalation). The x axis is therefore often presented using a logarithmic scale, as in the log-probit plot, allowing data point spacing to be more equal, rather than grouping measurements at the finer and coarser ends of the size distribution.
Using the probit function to express cumulative percent-age mass also makes it easier to accurately derive metrics of interest. Probit 4 equates to a cumulative percentage of 15.8%, Probit 5 to 50% and Probit 6 to 84.1%. This type of representation more precisely scrutinizes the tail ends of the mass distribution, as required for GSD definition.
With either plot, the question remains of how to deter-mine the particle size that equates to a cumulative mass of 50% as this almost always lies between two data points. Several different approaches are possible and, though con-sistency may exist within individual companies and organi-sations, no single method dominates across the community.
Implicit within the USP guidance for calculating MMAD is the suggestion that one approach is to assume that the dis-tribution of the mass-weighted raw data is log-normal and to perform a linear regression over the whole data set, thereby giving equal weighting both to the tails of the distribution and the central area (6). For data sets where measurements are equally valid at all points, this is an efficient way of using all the data to guide a calculation to a more accurate out-come. However, with cascade impaction, only relatively small amounts of material collect on stages at either end of the dis-
tribution, so measurement errors are therefore at their high-est, making such an approach potentially disadvantageous.
The adoption of this approach provokes two questions for those selecting an MMAD calculation method:•How many OINDPs comply with the stipulation of log-
normality?•How accurate is the method for those that don’t? A recent Stimuli paper to the Revision Process from the
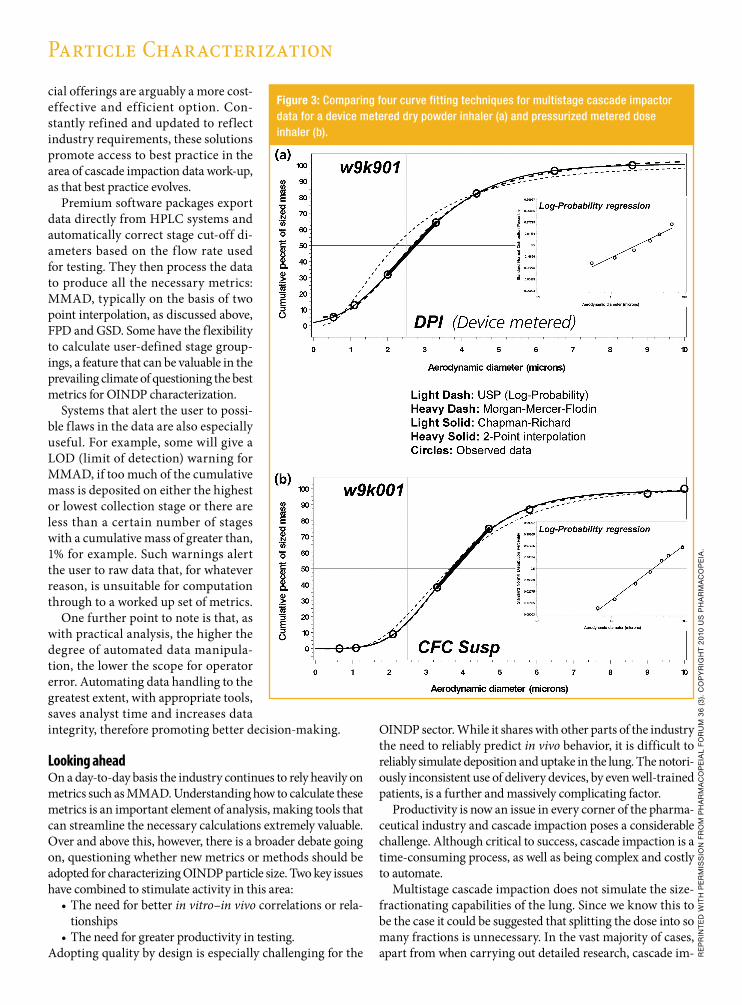
Pharmacopoeial Forum considers both of these issues (1). It reviews three alternative techniques for calculating MMAD and cross-compares all four methods. Two of the three al-ternatives involve sigmoid curve fitting using the Mercer-Morgan-Flodin (MMF) and the Chapman-Richards (CR) models respectively, the third is simple linear interpolation between the two points on either side of the MMAD.
This article draws two key conclusions. The first is that, on the basis of the cross-section of orally inhaled products investigated, log-normality is the exception rather than the norm. Furthermore, it is impossible to easily predict which products will exhibit such behavior and which will not. The second is that while an assumption of log-normality can produce significantly different answers to those provided by the curve fitting techniques, for formulations that deviate from this distribution, the simple technique of two point interpolation does not. Close agreement is observed between interpolated data and that obtained from curve fitting for all formulations (see Figure 3).
Mathematically, interpolation is the most straightforward approach and already well-used (7, 8). This article rein-forces the validity of interpolation confirming it as a robust method for more routinely encountered distributions.
Streamlining data analysisThe preceding discussion suggests that the analysis of cas-cade impaction data can be a somewhat complex task, and this is true. However, there are validated computational packages that greatly reduce the burden. Some companies choose to develop their own spreadsheet tools, but commer-
Figure 2: Converting a linear plot of cascade impaction data (percentage cumulative mass against upper cut-off diameter) to a Log-Probit plot makes it easier to derive the particle-size metrics of interest.
FIG
UR
eS
1 a
ND
2 a
Re
Co
UR
Te
SY
oF
Th
e a
UT
ho
RS
Particle Characterization
cial offerings are arguably a more cost-effective and efficient option. Con-stantly refined and updated to reflect industry requirements, these solutions promote access to best practice in the area of cascade impaction data work-up, as that best practice evolves.
Premium software packages export data directly from HPLC systems and automatically correct stage cut-off di-ameters based on the f low rate used for testing. They then process the data to produce all the necessary metrics: MMAD, typically on the basis of two point interpolation, as discussed above, FPD and GSD. Some have the flexibility to calculate user-defined stage group-ings, a feature that can be valuable in the prevailing climate of questioning the best metrics for OINDP characterization.
Systems that alert the user to possi-ble flaws in the data are also especially useful. For example, some will give a LOD (limit of detection) warning for MMAD, if too much of the cumulative mass is deposited on either the highest or lowest collection stage or there are less than a certain number of stages with a cumulative mass of greater than, 1% for example. Such warnings alert the user to raw data that, for whatever reason, is unsuitable for computation through to a worked up set of metrics.
One further point to note is that, as with practical analysis, the higher the degree of automated data manipula-tion, the lower the scope for operator error. Automating data handling to the greatest extent, with appropriate tools, saves analyst time and increases data integrity, therefore promoting better decision-making.
Looking aheadOn a day-to-day basis the industry continues to rely heavily on metrics such as MMAD. Understanding how to calculate these metrics is an important element of analysis, making tools that can streamline the necessary calculations extremely valuable. Over and above this, however, there is a broader debate going on, questioning whether new metrics or methods should be adopted for characterizing OINDP particle size. Two key issues have combined to stimulate activity in this area:•The need for better in vitro–in vivo correlations or rela-
tionships•The need for greater productivity in testing.
Adopting quality by design is especially challenging for the
OINDP sector. While it shares with other parts of the industry the need to reliably predict in vivo behavior, it is difficult to reliably simulate deposition and uptake in the lung. The notori-ously inconsistent use of delivery devices, by even well-trained patients, is a further and massively complicating factor.
Productivity is now an issue in every corner of the pharma-ceutical industry and cascade impaction poses a considerable challenge. Although critical to success, cascade impaction is a time-consuming process, as well as being complex and costly to automate.
Multistage cascade impaction does not simulate the size-fractionating capabilities of the lung. Since we know this to be the case it could be suggested that splitting the dose into so many fractions is unnecessary. In the vast majority of cases, apart from when carrying out detailed research, cascade im-
Figure 3: Comparing four curve fitting techniques for multistage cascade impactor data for a device metered dry powder inhaler (a) and pressurized metered dose inhaler (b).
Re
PR
INT
eD
wIT
h P
eR
mIS
SIo
N F
Ro
m P
ha
Rm
aC
oP
eIa
l F
oR
Um
36
(3).
Co
PY
RIG
hT
201
0 U
S P
ha
Rm
aC
oP
eIa
.

paction data are actually used to answer relatively simple ques-tions: Has the FPD or MMAD gone down or up? Is this batch the same as the last or equivalent to that used in clinical trials to approve the product? The focus of current debate is therefore whether fewer mass groupings and/or different metrics are the way forward for the bulk of testing.
This idea is alluded to in the Pharmacopeia Forum Stimuli paper, which notes that the constants derived by fitting curves with either the CR or MMF models may be sensitive metrics for differentiating APSDs (1). Elsewhere, work by the International Pharmaceutical Aerosol Consortium on Regulation and Sci-ence (IPAC-RS) on efficient data analysis suggests that highly differentiating analysis is possible if the emitted dose is simply considered as two mass fractions—one fine, one coarse (9). The cut-off between these two fractions can be varied from for-mulation to formulation for maximum sensitivity, with results suggesting that a cut-off close to the MMAD of the formulation is the optimum.
Physical representations of the abbreviated impactor measure-ment (AIM) concept are also now available, for example the Fast Screening Impactor (MSP Corporation) and the Fast Screening Andersen (Copley Scientific). AIM systems divide a dose into just 2–3 fractions rather than the 7–8 obtained with full resolution cascade impaction. Estimated productivity gains are substantial and solvent usage savings are also encouraging (10).
Early experimental work suggests that for metered dose inhalers and nebulizers close agreement is observed between AIM data and corresponding metrics measured using full reso-lution multistage cascade impaction. With dry powder inhalers the story is currently less clear with more research required to clarify the causes of systematic differences between data sets (10). However, recently published work indicates good progress in understanding these differences and compensating for them (11). Nevertheless, it is still early days for these new approaches,
and the regulators remain to be convinced of their validity—an essential step towards greater uptake.
What is clear is that inertial impaction methods will remain pivotal to the development and quality control of OINDPs. Un-derstanding these techniques, how to use them, and how to manipulate the resulting data are therefore core skills for those working in the sector.
References 1. Stimuli to the Revision Process, “Generalized Simplified Approaches
for Mass Median Aerodynamic Determination,” Pharmacopeial Forum 36 (3) (2010).
2. M. Copley and J. McDonald, Inhalation 3 (11), 14–17 (2009) 3. W.C. Hinds, Aerosol Technology, Properties, Behavior, and Measure-
ment of Airborne Particles (John Wiley & Sons, 2nd ed., 1999). 4. T.K. Church et al., Proc. Respiratory Drug Deliv. XII, 2, 509–509–512
(2010). 5. D.J. Finney, Probit Analysis (Cambridge University Press, Cambridge,
1971). 6. USP 34–NF 29, Physical Tests and Determinations <601> “Aerosols,
Nasal Sprays, Metered-dose Inhalers, and Dry Powder Inhalers,” pp. 237–239.
7. D. Lewis, Inhalation (August 2008). 8. Inhalation Report, “How do you calculate MMAD,” (2010), www.
inhalationreport.com, accessed 10 Oct. 2011. 9. Tougas et al., AAPS Pharm. Sci. Technol., 10 (4) 1276–1285 (2009) 10. Proceedings of EPAG AIM Workshop at DDL 21 (Edinburgh Inter-
national Conference Center, Dec. 8–10, 2010). 11. P.N. Pantelides et al., proceedings of RDD Europe (Berlin, 2011), pp.
391–395. PT
Call for PapersPharmaceutical Technology and Pharmaceutical Technology Europe cover all aspects of pharmaceutical drug development and manufacturing, including API sourcing and synthesis, formulation, drug-delivery technologies, analytical technologies, process development and scale-up, manufacturing technologies, fill/finish, packaging, business, and regulatory issues for all pharmaceutical drug classes, including traditional small-molecule drugs, biopharmaceuticals, cells for cell therapies, nanotechnologies, and other emerging and traditional drug classes.
We are currently seeking novel research articles for our peer-reviewed journals as well as manuscripts for our special issues. For peer-reviewed papers, members of our Editorial Advisory Board and other industry experts review manuscripts on technical and regulatory topics. The review process is double-blind. Manuscripts are reviewed on a rolling basis.
Our single-themed issues, which include literature reviews and tutorials, address excipients and ingredients, analytical testing, outsourcing, solid dosage, and more.
Please visit our website, www.PharmTech.com, to view our full Author Guidelines and upcoming topics. Manuscripts may be sent to [email protected].
Articles Reprinted from © November 2011 issue of
The Authorit y on Drug Dev elopment & Manufac turing
PharmTech.com