ingrid bonde, cfo13 may 2016: long-term a3 rating and baa2 junior subordinated debt ratings...
TRANSCRIPT

Ingrid Bonde, CFO
Vattenfall Capital Markets Day, 19 September 2016
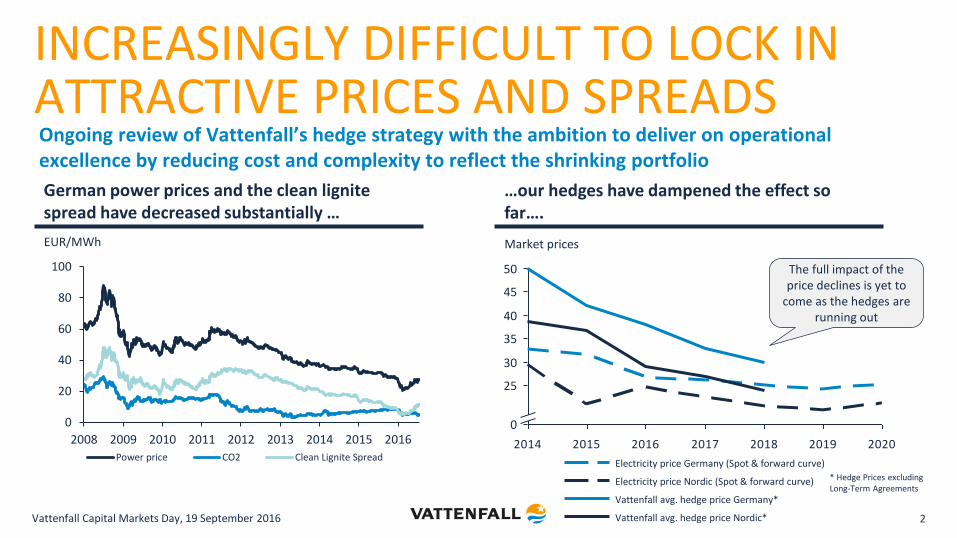
INCREASINGLY DIFFICULT TO LOCK IN ATTRACTIVE PRICES AND SPREADS
2014 2015 2016 2017 2018 2019 2020
45
25
50
40
30
35
0
Vattenfall avg. hedge price Nordic*
Vattenfall avg. hedge price Germany*
Electricity price Germany (Spot & forward curve)
Electricity price Nordic (Spot & forward curve)
Market prices
* Hedge Prices excluding Long-Term Agreements
Ongoing review of Vattenfall’s hedge strategy with the ambition to deliver on operational excellence by reducing cost and complexity to reflect the shrinking portfolio
0
20
40
60
80
100
2008 2009 2010 2011 2012 2013 2014 2015 2016
Power price CO2 Clean Lignite Spread
German power prices and the clean lignite spread have decreased substantially …
…our hedges have dampened the effect so far….
The full impact of the price declines is yet to
come as the hedges are running out
EUR/MWh
Vattenfall Capital Markets Day, 19 September 2016 2
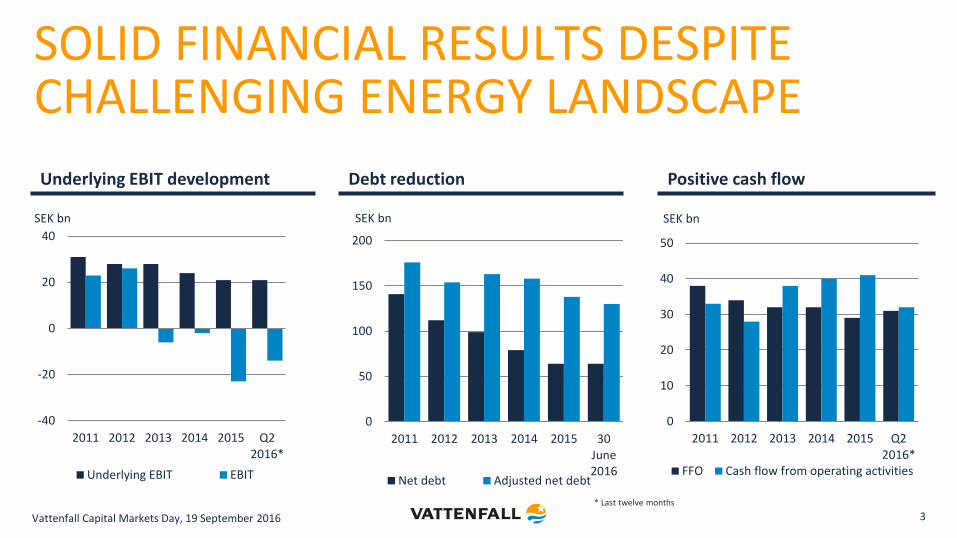
SOLID FINANCIAL RESULTS DESPITE CHALLENGING ENERGY LANDSCAPE
Vattenfall Capital Markets Day, 19 September 2016 3
0
50
100
150
200
2011 2012 2013 2014 2015 30June2016
SEK bn
Net debt Adjusted net debt
Debt reduction Positive cash flow
0
10
20
30
40
50
2011 2012 2013 2014 2015 Q22016*
SEK bn
FFO Cash flow from operating activities
* Last twelve months
-40
-20
0
20
40
2011 2012 2013 2014 2015 Q22016*
SEK bn
Underlying EBIT EBIT
Underlying EBIT development

CUMULATIVE IMPAIRMENTS
Vattenfall Capital Markets Day, 19 September 2016 4 * Impairment of goodwill ** Impairment of assets and goodwill
With cumulative impairments of approx. EUR 16.6bn between 2009-2016, Vattenfall has been transparent and timely in cleaning up the balance sheet under changing market conditions
11,4% EUR 700bn
Total Assets avg. 2010-20152
Peer group1
19,1%
Total Assets avg. 2010-20152
Vattenfall
Total impairment
2010-2015
EUR 80bn EUR 70bn
1) Selected peer group: Engie, Enel, Eon, RWE, Fortum 2) Source: Bloomberg
Total impairment
2010-2015
EUR 13bn
21.5
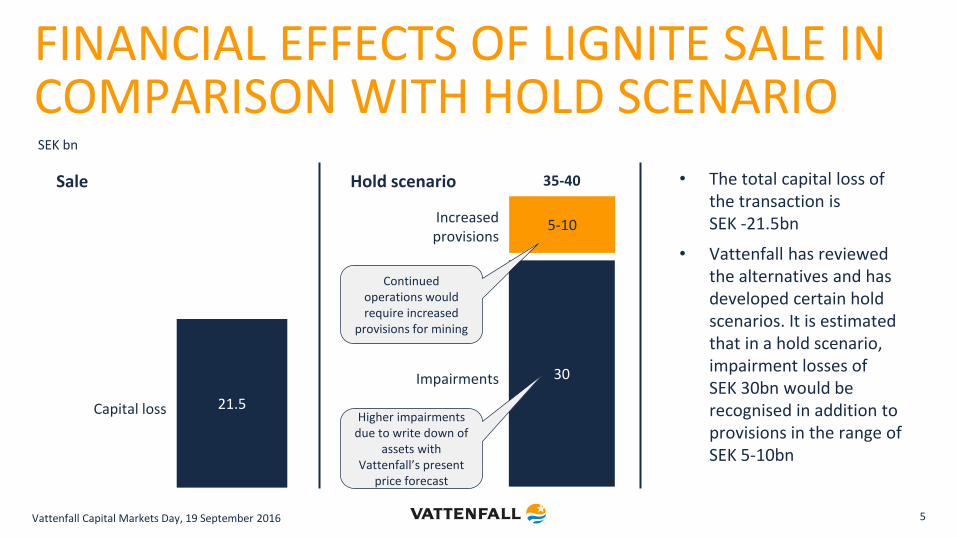
FINANCIAL EFFECTS OF LIGNITE SALE IN COMPARISON WITH HOLD SCENARIO
5
Sale Hold scenario
Capital loss
5-10
30
• The total capital loss of the transaction is SEK -21.5bn
• Vattenfall has reviewed the alternatives and has developed certain hold scenarios. It is estimated that in a hold scenario, impairment losses of SEK 30bn would be recognised in addition to provisions in the range of SEK 5-10bn
Impairments
35-40
Increased provisions
SEK bn
Higher impairments due to write down of
assets with Vattenfall’s present
price forecast
Continued operations would require increased
provisions for mining
Vattenfall Capital Markets Day, 19 September 2016
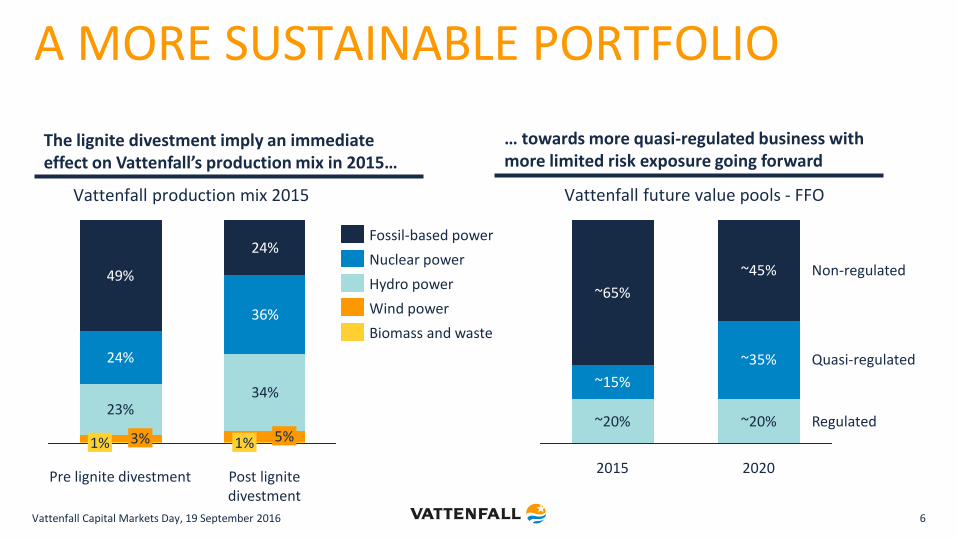
A MORE SUSTAINABLE PORTFOLIO
Vattenfall Capital Markets Day, 19 September 2016 6
Regulated
Quasi-regulated
Non-regulated
2020
~20%
~35%
~45%
2015
~20%
~15%
~65%
23%34%
24%
36%
49%
24%
Post lignite divestment
1% 5%
Pre lignite divestment
1% 3%
The lignite divestment imply an immediate effect on Vattenfall’s production mix in 2015…
… towards more quasi-regulated business with more limited risk exposure going forward
Vattenfall production mix 2015 Vattenfall future value pools - FFO
Biomass and waste
Nuclear power
Wind power
Hydro power
Fossil-based power
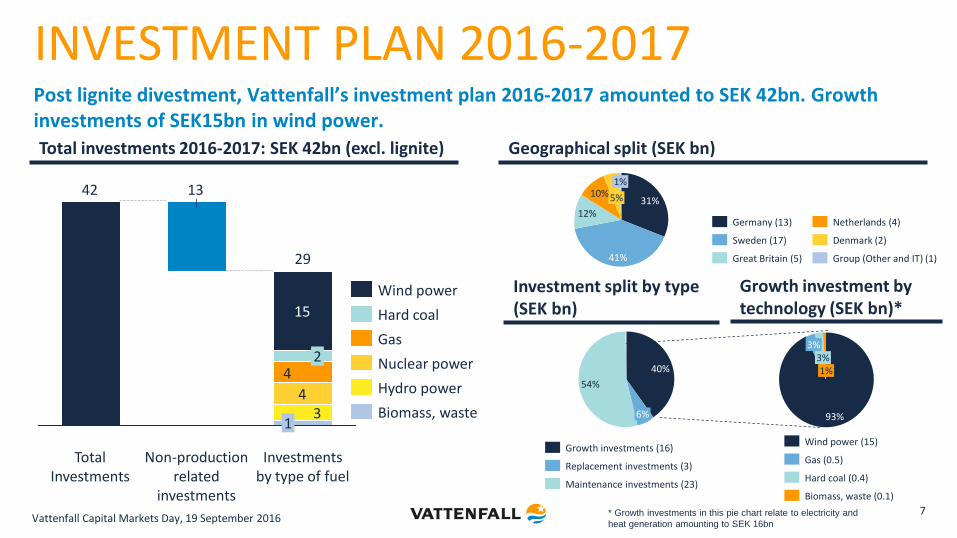
Post lignite divestment, Vattenfall’s investment plan 2016-2017 amounted to SEK 42bn. Growth investments of SEK15bn in wind power.
Hard coal (0.4)
Gas (0.5)
Wind power (15)
Biomass, waste (0.1)
1% 3%
3%
93%
INVESTMENT PLAN 2016-2017
7
34
4
15
1342
Investments by type of fuel
29
1
2
Non-production related
investments
Total Investments
Maintenance investments (23)
Replacement investments (3)
Growth investments (16)
1%
5% 10%
12%
41%
31%
Group (Other and IT) (1)
Denmark (2)
Netherlands (4)
Great Britain (5)
Sweden (17)
Germany (13)
54%
6%
40%
* Growth investments in this pie chart relate to electricity and
heat generation amounting to SEK 16bn Vattenfall Capital Markets Day, 19 September 2016
Hydro power
Biomass, waste
Nuclear power
Gas
Hard coal
Wind power
Total investments 2016-2017: SEK 42bn (excl. lignite) Geographical split (SEK bn)
Investment split by type (SEK bn)
Growth investment by technology (SEK bn)*
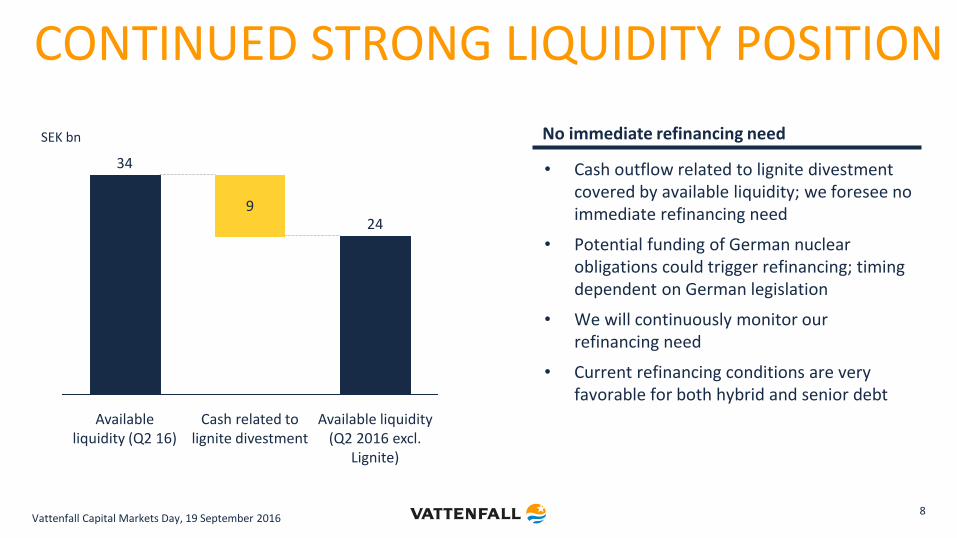
CONTINUED STRONG LIQUIDITY POSITION
8 Vattenfall Capital Markets Day, 19 September 2016
24
Available liquidity (Q2 2016 excl.
Lignite)
Cash related to lignite divestment
9
Available liquidity (Q2 16)
34
SEK bn
• Cash outflow related to lignite divestment covered by available liquidity; we foresee no immediate refinancing need
• Potential funding of German nuclear obligations could trigger refinancing; timing dependent on German legislation
• We will continuously monitor our refinancing need
• Current refinancing conditions are very favorable for both hybrid and senior debt
No immediate refinancing need
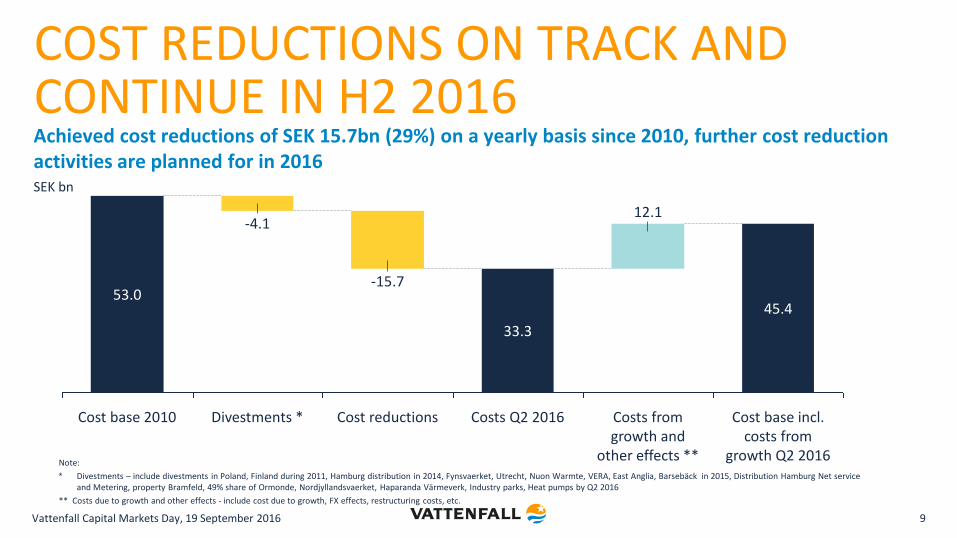
COST REDUCTIONS ON TRACK AND CONTINUE IN H2 2016
Vattenfall Capital Markets Day, 19 September 2016 9
Achieved cost reductions of SEK 15.7bn (29%) on a yearly basis since 2010, further cost reduction activities are planned for in 2016
Costs Q2 2016
33.3
Cost base incl. costs from
growth Q2 2016
45.4
Costs from growth and
other effects **
12.1
Cost reductions
-15.7
Divestments *
-4.1
Cost base 2010
53.0
Note:
* Divestments – include divestments in Poland, Finland during 2011, Hamburg distribution in 2014, Fynsvaerket, Utrecht, Nuon Warmte, VERA, East Anglia, Barsebäck in 2015, Distribution Hamburg Net service and Metering, property Bramfeld, 49% share of Ormonde, Nordjyllandsvaerket, Haparanda Värmeverk, Industry parks, Heat pumps by Q2 2016
** Costs due to growth and other effects - include cost due to growth, FX effects, restructuring costs, etc.
SEK bn

CREDIT RATINGS
Vattenfall Capital Markets Day, 19 September 2016 10
Factors that could lead to an upgrade
• A positive outcome on production taxes
• Vattenfall continues to make progress on its shift toward more regulated and contracted earnings
• The company‘s financial profile were to stabilise within guidance
Factors that could revise the outlook to stable
• Vattenfall to maintain its FFO to debt above 20%
• No longer foresee market and regulatory risks as presenting immediate downside risks for the company
Moody’s
13 May 2016: Long-term A3 rating and Baa2 junior subordinated debt ratings confirmed. The outlook for Vattenfall’s rating is negative.
Standard & Poor’s
19 May 2016: Long-term BBB+ rating affirmed. Short term K-1 Nordic regional scale rating and short term A-2 rating also affirmed. The outlook for Vattenfall’s rating is negative
Company S&P Moody's
Rating Outlook Rating Outlook
E.ON BBB+ negative Baa1 negative
Fortum BBB+ stable -- --
RWE BBB- negative Baa3 stable
Vattenfall BBB+ negative A3 negative
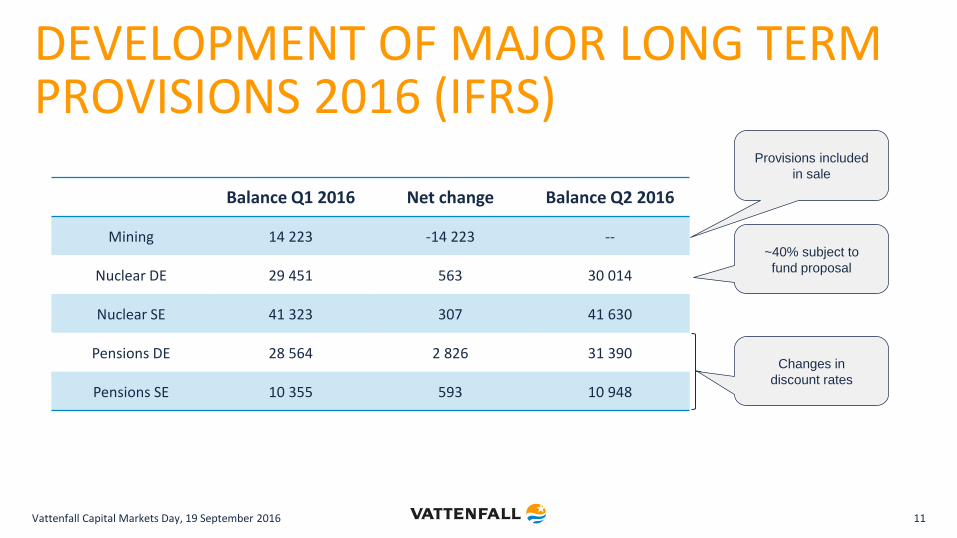
DEVELOPMENT OF MAJOR LONG TERM PROVISIONS 2016 (IFRS)
Vattenfall Capital Markets Day, 19 September 2016 11
Balance Q1 2016 Net change Balance Q2 2016
Mining 14 223 -14 223 --
Nuclear DE 29 451 563 30 014
Nuclear SE 41 323 307 41 630
Pensions DE 28 564 2 826 31 390
Pensions SE 10 355 593 10 948
Provisions included
in sale
~40% subject to
fund proposal
Changes in
discount rates
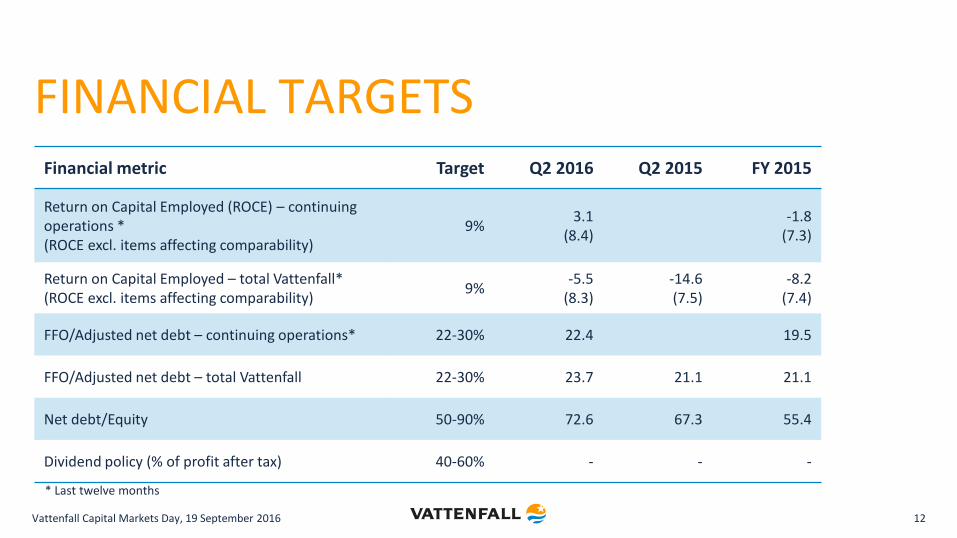
FINANCIAL TARGETS Financial metric Target Q2 2016 Q2 2015 FY 2015
Return on Capital Employed (ROCE) – continuing operations * (ROCE excl. items affecting comparability)
9% 3.1
(8.4)
-1.8 (7.3)
Return on Capital Employed – total Vattenfall* (ROCE excl. items affecting comparability)
9% -5.5
(8.3) -14.6 (7.5)
-8.2 (7.4)
FFO/Adjusted net debt – continuing operations* 22-30% 22.4 19.5
FFO/Adjusted net debt – total Vattenfall 22-30% 23.7 21.1 21.1
Net debt/Equity 50-90% 72.6 67.3 55.4
Dividend policy (% of profit after tax) 40-60% - - -
12
* Last twelve months
Vattenfall Capital Markets Day, 19 September 2016
APPENDIX
13
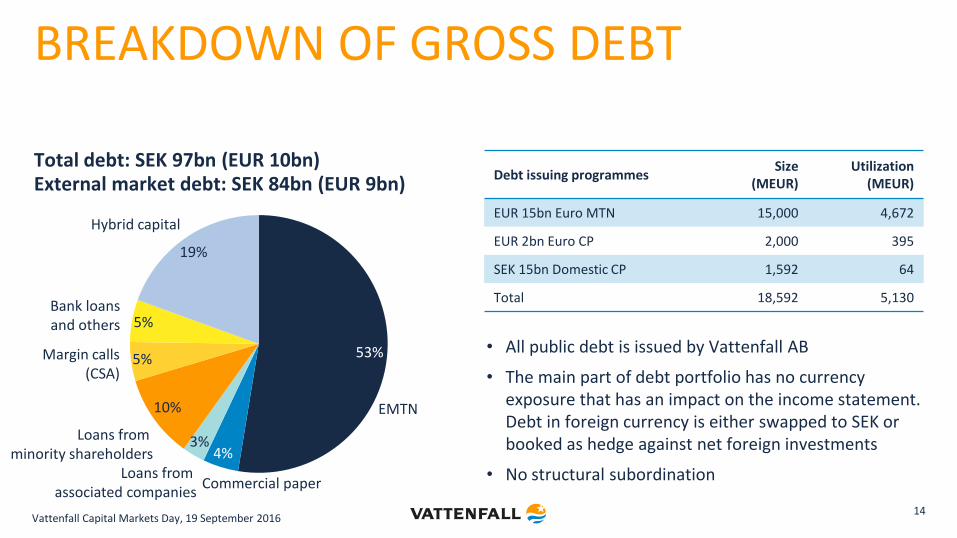
BREAKDOWN OF GROSS DEBT Total debt: SEK 97bn (EUR 10bn) External market debt: SEK 84bn (EUR 9bn)
53%
19%
5%
Hybrid capital
Bank loans and others
Loans from minority shareholders
3%
10%
5%
Loans from associated companies
Margin calls (CSA)
Commercial paper
4%
EMTN
Debt issuing programmes Size
(MEUR) Utilization
(MEUR)
EUR 15bn Euro MTN 15,000 4,672
EUR 2bn Euro CP 2,000 395
SEK 15bn Domestic CP 1,592 64
Total 18,592 5,130
• All public debt is issued by Vattenfall AB
• The main part of debt portfolio has no currency exposure that has an impact on the income statement. Debt in foreign currency is either swapped to SEK or booked as hedge against net foreign investments
• No structural subordination
14 Vattenfall Capital Markets Day, 19 September 2016
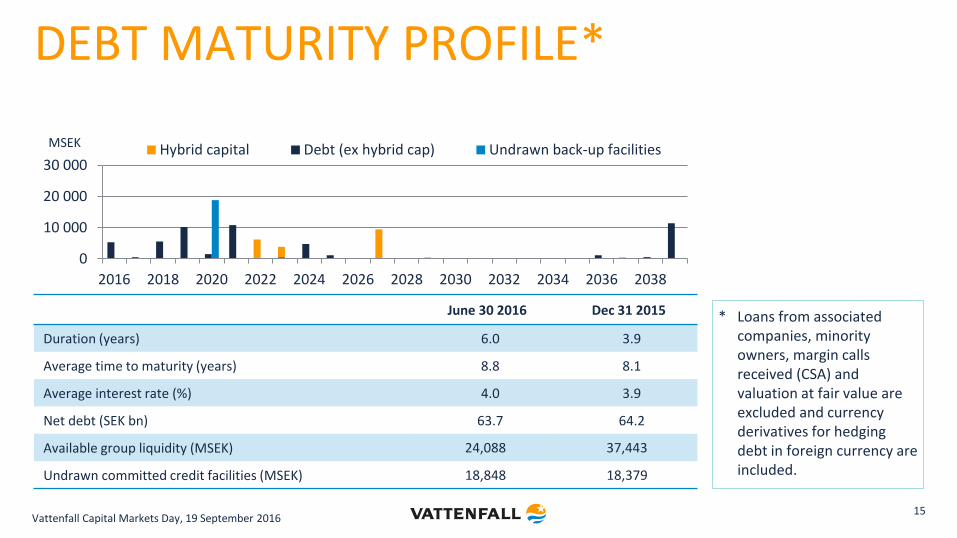
* Loans from associated companies, minority owners, margin calls received (CSA) and valuation at fair value are excluded and currency derivatives for hedging debt in foreign currency are included.
DEBT MATURITY PROFILE*
0
10 000
20 000
30 000
2016 2018 2020 2022 2024 2026 2028 2030 2032 2034 2036 2038
Hybrid capital Debt (ex hybrid cap) Undrawn back-up facilitiesMSEK
June 30 2016 Dec 31 2015
Duration (years) 6.0 3.9
Average time to maturity (years) 8.8 8.1
Average interest rate (%) 4.0 3.9
Net debt (SEK bn) 63.7 64.2
Available group liquidity (MSEK) 24,088 37,443
Undrawn committed credit facilities (MSEK) 18,848 18,379
15 Vattenfall Capital Markets Day, 19 September 2016
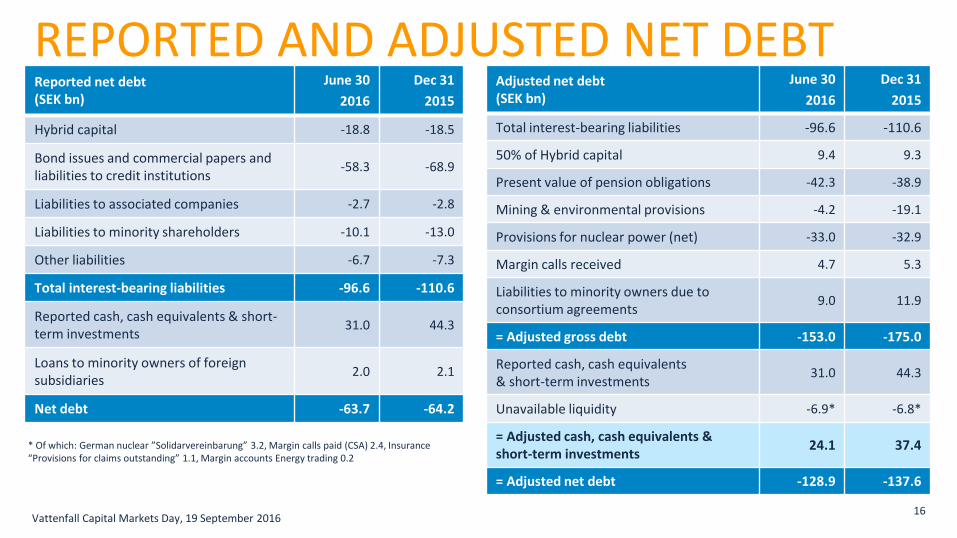
REPORTED AND ADJUSTED NET DEBT Reported net debt (SEK bn)
June 30
2016
Dec 31
2015
Hybrid capital -18.8 -18.5
Bond issues and commercial papers and liabilities to credit institutions
-58.3 -68.9
Liabilities to associated companies -2.7 -2.8
Liabilities to minority shareholders -10.1 -13.0
Other liabilities -6.7 -7.3
Total interest-bearing liabilities -96.6 -110.6
Reported cash, cash equivalents & short-term investments
31.0 44.3
Loans to minority owners of foreign subsidiaries
2.0 2.1
Net debt -63.7 -64.2
Adjusted net debt (SEK bn)
June 30
2016
Dec 31
2015
Total interest-bearing liabilities -96.6 -110.6
50% of Hybrid capital 9.4 9.3
Present value of pension obligations -42.3 -38.9
Mining & environmental provisions -4.2 -19.1
Provisions for nuclear power (net) -33.0 -32.9
Margin calls received 4.7 5.3
Liabilities to minority owners due to consortium agreements
9.0 11.9
= Adjusted gross debt -153.0 -175.0
Reported cash, cash equivalents & short-term investments
31.0 44.3
Unavailable liquidity -6.9* -6.8*
= Adjusted cash, cash equivalents & short-term investments
24.1 37.4
= Adjusted net debt -128.9 -137.6
* Of which: German nuclear ”Solidarvereinbarung” 3.2, Margin calls paid (CSA) 2.4, Insurance “Provisions for claims outstanding” 1.1, Margin accounts Energy trading 0.2
16 Vattenfall Capital Markets Day, 19 September 2016

CDS spread 5-years
STABLE CDS SPREAD DEVELOPMENT
17
bp
0
20
40
60
80
100
120
140
Jan-15 Apr-15 Jul-15 Oct-15 Jan-16 Apr-16
Itraxx Main
VATTENFALL
ENERGY PEERS (INCLVATTENFALL)
Vattenfall Capital Markets Day, 19 September 2016