-ing savings
TRANSCRIPT
Demand Side Management2 0 1 6 A N N U A L R E P O R T
-ing Savings

Susie SmithDemand Side Management
Analyst
Mike RampleySenior Vice President
Marketing and Business Development
Wes McFarlandManager of Marketing
Holly YenselResidential Energy
Consultant
Tom LottEnergy Efficiency
Program Coordinator,Commercial and Industrial
Specialist
Aimee SkrzekutEnergy Efficiency
Program Coordinator,Residential Specialist
Renee CampbellKey Accounts Manager
Jim WittmanKey Accounts Manager
Mike OwensKey Accounts Manager
2 DSM Lineup
3 DSM Summary 2016 Year in Review
4-6 ReStore-ing Appliance Recycling
7 Commercial and Industrial Programs
Residential Lighting Program
8 Residential HVAC Rebates
Attic Insulation and Duct Sealing
9 Touchstone Energy® HomeSM Program
Energy Management Savings Switch Program
10-13 Appendix A
14-18 Appendix B
19 Hoosier Energy Power Network
Hoosier Energy 2016 DSM Lineup
Table of Contents

WINTER PEAK MW SAVINGS
15.65MW
SUMMER PEAK MW SAVINGS
11.83MW
Implementation of the Energy Efficiency Collaborative Platform (EECP) software with member systems to track DSM programs was a significant accomplishment. EECP is a workflow automation application that allows members to independently configure and track participation, costs and savings. It provides a single source to collect and store program data for analysis and reporting.
To keep up with residential lighting trends, energy efficiency kits were redesigned by adding light emitting diode (LED) lamps and information to help consumers understand lighting needs. Cardboard containers were eliminated in favor of a reusable canvas bag. These changes help reduce packaging waste, are responsive to consumer demand for LEDs, and provide better information on how consumers can order from the cooperative online store.
Cooperative branded lighting stores offer LED lamps with instant rebates of up to $10 per lamp and free
DSM Summary
2016 Year In Review
The Demand Side Management (DSM) program provided by member systems and Hoosier Energy since 2008 offers a unique “win-win-win” opportunity for consumers, distribution co-op’s and the G&T. Program measures provide consumers with tools to manage electric usage and bills, enable distribution cooperatives to reduce wholesale power costs, and provide Hoosier Energy with an economical long-term
Annual MWh Savings and Summer & Winter Peak MW Savings are the savings estimated for one year from measures installed in 2016
alternative to manage demand and avoid adding generating capacity. End-use efficiency and DSM measures are an important component of an “all of the above” power supply strategy, along with fossil fuels and renewable resources, that will help maintain reliable and affordable energy for consumers well into the future.
ANNUAL MWH SAVINGS
57,802MWh
MEASURES INSTALLED
113,475
shipping to residential and agricultural consumers. The agricultural store was also expanded to include access for small commercial customers.
The appliance recycling program was restarted in early 2016 as a pilot program with local Habitat for Humanity ReStores providing pick-up service and delivery to recyclers. The pilot program was created as a way to fill a void when the previous vendor unexpectedly ceased operations.
DSM programs continue to thrive under the “Team Up” brand with innovative and eye catching marketing materials, e-newsletters, weekly social media posts, and access to graphics and articles that members use to promote efficiency programs.
DSM programs in 2016 showed overall growth of 13% compared to 2015 results. Summarized 2016 data for specific programs is presented in this report.
Appliance Recycling
ResidentialLighting
Commercial & IndustrialEnergy Efficiency
Weatherization
Other Savings
Residential HVAC
LED Security Lighting
Touchstone Energy Home
DSM MEASURES 2016 DSM PORTFOLIO TOTALS
DSM measures installed from 2009 through the end of 2016 are expected to save 233,644 MWh
2016 DSM ANNUAL REPORT3
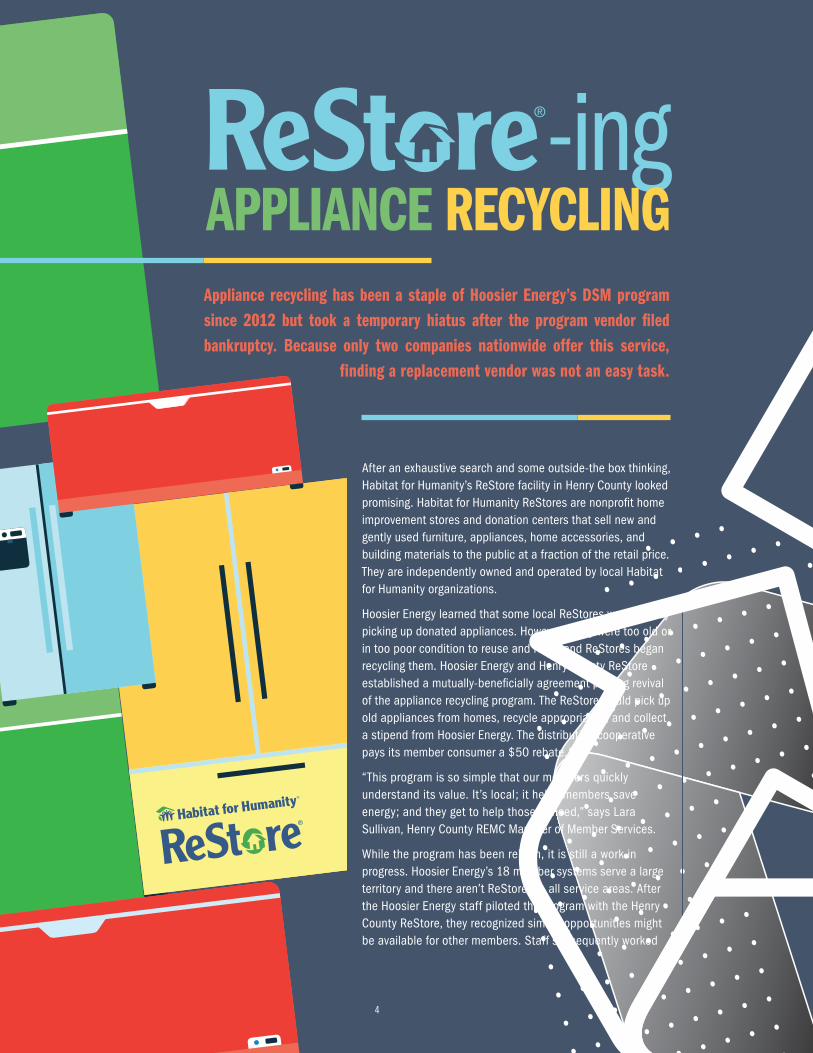
After an exhaustive search and some outside-the box thinking, Habitat for Humanity’s ReStore facility in Henry County looked promising. Habitat for Humanity ReStores are nonprofit home improvement stores and donation centers that sell new and gently used furniture, appliances, home accessories, and building materials to the public at a fraction of the retail price. They are independently owned and operated by local Habitat for Humanity organizations.
Hoosier Energy learned that some local ReStores were already picking up donated appliances. However, many were too old or in too poor condition to reuse and resell and ReStores began recycling them. Hoosier Energy and Henry County ReStore established a mutually-beneficially agreement piloting revival of the appliance recycling program. The ReStore would pick up old appliances from homes, recycle appropriately, and collect a stipend from Hoosier Energy. The distribution cooperative pays its member consumer a $50 rebate.
“This program is so simple that our members quickly understand its value. It’s local; it helps members save energy; and they get to help those in need,” says Lara Sullivan, Henry County REMC Manager of Member Services.
While the program has been reborn, it is still a work in progress. Hoosier Energy’s 18 member systems serve a large territory and there aren’t ReStores in all service areas. After the Hoosier Energy staff piloted the program with the Henry County ReStore, they recognized similar opportunities might be available for other members. Staff subsequently worked
Appliance recycling has been a staple of Hoosier Energy’s DSM program since 2012 but took a temporary hiatus after the program vendor filed bankruptcy. Because only two companies nationwide offer this service,
finding a replacement vendor was not an easy task.
-ingAPPLIANCE RECYCLING
4

2016 PROGRAM SUMMARY
ENERGYSAVINGS
673MWh
SUMMER PEAK REDUCTION
.059MW
NUMBER OF UNITS
702
2016 DSM ANNUAL REPORT5

with other ReStores that have agreed to pick up appliances outside their normal area to cover the Power Network.
Currently, four ReStores serve 16 member systems and have collected more than 700 appliances since the program began. Options for serving the two remaining service territories are under development.
Benefits speak for themselves. Consumers win by reducing their electric bill, recycling an old appliance without having to leave their home, and receiving a financial incentive. The distribution co-op wins through reducing wholesale power costs and continuing to offer a recycling rebate as a member benefit. And ReStores win because they get the collection fee and increase awareness of Habitat programs among co-op consumers. Homeowners often donate other items to the ReStore while the truck is there to pick up the appliance.
This mutually-beneficial relationship also gets to the heart of what cooperatives are all about – commitment to community. The program now puts funds into local Habitat for Humanity organizations rather than a for-profit recycling business.
“Members feel good when they recognize the name of the business on the truck that shows up at their home. This is an added bonus co-ops love,” said Susie Smith, Hoosier Energy Demand Side Management Analyst.
Program growth is up 20 percent at participating cooperatives proving the recycling program has indeed been “Restored.”
6
Commercial and Industrial Programs
Residential Lighting Program
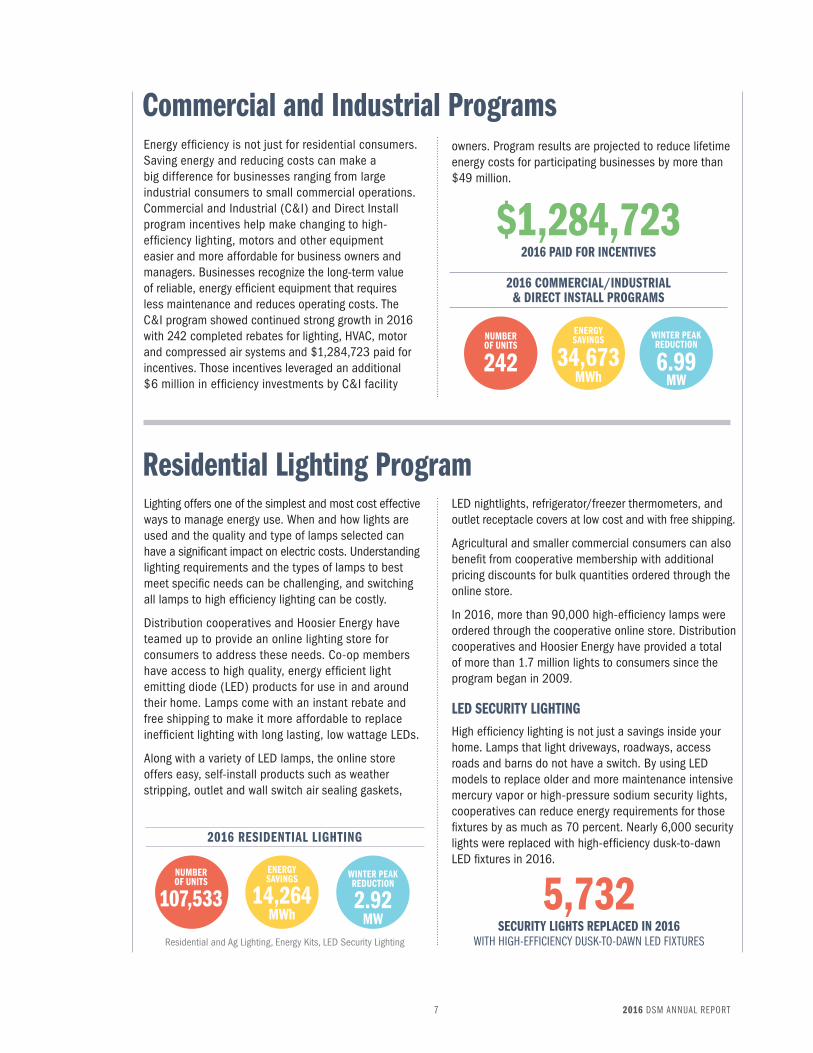
Energy efficiency is not just for residential consumers. Saving energy and reducing costs can make a big difference for businesses ranging from large industrial consumers to small commercial operations. Commercial and Industrial (C&I) and Direct Install program incentives help make changing to high-efficiency lighting, motors and other equipment easier and more affordable for business owners and managers. Businesses recognize the long-term value of reliable, energy efficient equipment that requires less maintenance and reduces operating costs. The C&I program showed continued strong growth in 2016 with 242 completed rebates for lighting, HVAC, motor and compressed air systems and $1,284,723 paid for incentives. Those incentives leveraged an additional $6 million in efficiency investments by C&I facility
Lighting offers one of the simplest and most cost effective ways to manage energy use. When and how lights are used and the quality and type of lamps selected can have a significant impact on electric costs. Understanding lighting requirements and the types of lamps to best meet specific needs can be challenging, and switching all lamps to high efficiency lighting can be costly.
Distribution cooperatives and Hoosier Energy have teamed up to provide an online lighting store for consumers to address these needs. Co-op members have access to high quality, energy efficient light emitting diode (LED) products for use in and around their home. Lamps come with an instant rebate and free shipping to make it more affordable to replace inefficient lighting with long lasting, low wattage LEDs.
Along with a variety of LED lamps, the online store offers easy, self-install products such as weather stripping, outlet and wall switch air sealing gaskets,
WINTER PEAK REDUCTION
2.92MW
ENERGYSAVINGS
14,264MWh
NUMBER OF UNITS
107,533 5,732 SECURITY LIGHTS REPLACED IN 2016
WITH HIGH-EFFICIENCY DUSK-TO-DAWN LED FIXTURES
$1,284,7232016 PAID FOR INCENTIVES
WINTER PEAK REDUCTION
6.99MW
ENERGYSAVINGS
34,673MWh
NUMBER OF UNITS
242
2016 COMMERCIAL/INDUSTRIAL & DIRECT INSTALL PROGRAMS
2016 RESIDENTIAL LIGHTING
Residential and Ag Lighting, Energy Kits, LED Security Lighting
LED nightlights, refrigerator/freezer thermometers, and outlet receptacle covers at low cost and with free shipping.
Agricultural and smaller commercial consumers can also benefit from cooperative membership with additional pricing discounts for bulk quantities ordered through the online store.
In 2016, more than 90,000 high-efficiency lamps were ordered through the cooperative online store. Distribution cooperatives and Hoosier Energy have provided a total of more than 1.7 million lights to consumers since the program began in 2009.
LED SECURITY LIGHTINGHigh efficiency lighting is not just a savings inside your home. Lamps that light driveways, roadways, access roads and barns do not have a switch. By using LED models to replace older and more maintenance intensive mercury vapor or high-pressure sodium security lights, cooperatives can reduce energy requirements for those fixtures by as much as 70 percent. Nearly 6,000 security lights were replaced with high-efficiency dusk-to-dawn LED fixtures in 2016.
owners. Program results are projected to reduce lifetime energy costs for participating businesses by more than $49 million.
2016 DSM ANNUAL REPORT7

Residential HVAC Rebates
Attic Insulation and Duct Sealing
How a consumer chooses to heat and cool their home makes a big difference in comfort and energy costs with up to 60% annual savings available to consumers who select high-efficiency equipment. The residential heating, ventilation and air conditioning (HVAC) program provides incentives to homeowners to upgrade to more efficient systems. More than 4,300 HVAC, attic insulation and duct sealing rebates were paid in 2016 to consumers who installed qualifying equipment. Geothermal heat pump rebates rose slightly from prior years, likely in anticipation of expiration of a 30% income tax credit for equipment placed in service by the end of 2016.
Cooperative rebates for geothermal systems will continue in 2017 but fewer new systems are expected
Insulation is a major factor in maintaining comfort levels in a home. Adequate insulation, particularly in attics, prevents exterior heat or cold from transferring into living spaces making it easier and more cost effective to comfort condition homes.
Ensuring proper air sealing on HVAC duct work is another way consumers can improve comfort in their home while easing the workload and energy requirements of heating and cooling systems. Preventing air leakage through the duct system can improve efficiency and energy savings, maintaining the comfort homeowners seek.
Rebates for duct sealing and attic insulation jumped dramatically in 2016 with 1,901 installations. Difficulties attracting qualified contractors in several areas and related quality control concerns presented significant challenges that contributed to a decision to eliminate these programs in future years.
WINTER PEAK REDUCTION
4.36MW
SUMMER PEAK REDUCTION
1.25MW
SUMMER PEAK REDUCTION
0.97MW
ENERGYSAVINGS
5,613MWh
ENERGYSAVINGS
1,404MWh
ENERGYSAVINGS
946MWh
NUMBER OF UNITS
2,443
NUMBER OF UNITS
584
NUMBER OF UNITS
1,317
2016 RESIDENTIAL HVAC REBATES
2016 ATTIC INSULATION
2016 DUCT SEALING
as a result of termination of the tax credit. Dual fuel heat pump rebates showed 29% percent growth in 2016 while air source heat pumps and heat pump water heaters experienced steady installation rates.
8

Touchstone Energy® HomeSM Program
Energy Management Savings Switch Program
Building a Touchstone Energy® HomeSM offers substantial benefits for homeowners. Rebates are available to help consumers pay for high-efficiency water heating and HVAC equipment, and efficient high quality construction provides protection from weather extremes, consistent comfort, and makes the home more affordable by reducing energy bills.
There were fewer new homes registered in 2016 but the number of completed homes held steady as a result of builder-friendly weather. The redesigned website has proved successful with many new inquiries and requests coming through the contact page. Prospective homeowners are also using the convenient “Find a Builder” feature to locate building professionals in their area making the process easier for consumers and benefiting registered builders.
The cost of electricity varies based upon when it is used during the day or during the year. Managing the timing of consumer energy use provides a valuable means to control and reduce power supply costs. As demand for energy rises in periods of peak usage, generating plants must produce more electricity to meet that demand or power must be purchased in energy markets. The added cost of providing energy during high demand periods directly impacts electric rates paid by consumers.
Cooperatives offer an energy management switch program to alleviate demand by briefly cycling the flow of power to air conditioning and water heaters. Members installed 611 switches in 2016 controlling
SUMMER PEAK REDUCTION
0.05MW
SUMMER PEAK REDUCTION
0.68MW
ENERGYSAVINGS
230MWh
DEVICES CONTROLLED
842
NUMBER OF UNITS
43
NUMBER OF UNITS
611
2016 TOUCHSTONE ENERGY HOME PROGRAM
2016 ENERGY MANAGEMENT SAVINGS SWITCH PROGRAM
842 heat pump, AC and water heater units. Hoosier Energy notifies members in advance of load control events, allowing them to activate switches on consumer-owned devices. Member cooperatives may also incentivize consumers to participate in energy management programs through bill credits or rebates.
2016 DSM ANNUAL REPORT9

Measures for the C&I Energy Efficiency Program are listed in terms of rebate applications paid.
2016 Residential Lighting ProgramAppendix A
2016 C&I Energy Efficiency Program
Cooperative Total Measures Installed
Annual MWh Savings
Summer Peak MW Savings
Winter Peak MW Savings
Bartholomew County REMC 3771 140 0.014 0.032
Clark County REMC 5637 209 0.021 0.048
Daviess-Martin County REMC 3261 121 0.012 0.028
Decatur County REMC 1569 58 0.006 0.013
Dubois REC, Inc. 21727 806 0.082 0.186
Harrison REMC 7798 289 0.024 0.067
Henry County REMC 517 19 0.002 0.004
Jackson County REMC 4940 183 0.008 0.042
Johnson County REMC 4772 177 0.018 0.041
Orange County REMC 2267 84 0.009 0.019
RushShelby Energy 1579 59 0.006 0.014
South Central Indiana REMC 7210 267 0.027 0.062
Southeastern Indiana REMC 2577 96 0.010 0.022
Southern Indiana Power 3447 128 0.013 0.030
Utilities District of Western Indiana REMC 9754 362 0.037 0.084
Wayne-White Counties Electric Cooperative 6987 259 0.026 0.060
Whitewater Valley REMC 724 27 0.003 0.006
WIN Energy REMC 1764 65 0.007 0.015
Total 90,301 3,349 0.325 0.773
Cooperative RebateApplications
Annual MWh Savings
Summer Peak MW Savings
Winter Peak MW Savings
Bartholomew County REMC 27 12,896 2.481 2.630
Clark County REMC 10 716 0.098 0.104
Daviess-Martin County REMC 9 566 0.162 0.172
Decatur County REMC 11 632 0.131 0.139
Dubois REC, Inc. 19 665 0.194 0.206
Harrison REMC 11 224 0.043 0.046
Henry County REMC 3 45 0.013 0.014
Jackson County REMC 25 104 0.044 0.047
Johnson County REMC 19 3,335 0.568 0.602
Orange County REMC 2 98 0.024 0.025
RushShelby Energy 10 2,097 0.508 0.538
South Central Indiana REMC 28 760 0.177 0.188
Southeastern Indiana REMC 8 602 0.116 0.123
Southern Indiana Power 13 563 0.071 0.075
Utilities District of Western Indiana REMC 13 7,452 1.150 1.219
Wayne-White Counties Electric Cooperative 3 1,035 0.358 0.379
Whitewater Valley REMC 10 308 0.067 0.071
WIN Energy REMC 21 2,575 0.387 0.410
Total 242 34,673 6.592 6.988
10

Other Savings includes Energy Kits.
2016 Energy Management Savings Switch Program
2016 Other Savings
Cooperative Total Devices Controlled
Annual MWh Savings
Summer Peak MW Savings
Winter Peak MW Savings
Bartholomew County REMC 0 0 0.00 0.00
Clark County REMC 0 0 0.00 0.00
Daviess-Martin County REMC 0 0 0.00 0.00
Decatur County REMC 0 0 0.00 0.00
Dubois REC, Inc. 367 0 0.31 0.13
Harrison REMC 0 0 0.00 0.00
Henry County REMC 0 0 0.00 0.00
Jackson County REMC 128 0 0.11 0.05
Johnson County REMC 0 0 0.00 0.00
Orange County REMC 178 0 0.13 0.09
RushShelby Energy 8 0 0.01 0.00
South Central Indiana REMC 0 0 0.00 0.00
Southeastern Indiana REMC 65 0 0.04 0.04
Southern Indiana Power 65 0 0.06 0.01
Utilities District of Western Indiana REMC 31 0 0.02 0.03
Wayne-White Counties Electric Cooperative 0 0 0.00 0.00
Whitewater Valley REMC 0 0 0.00 0.00
WIN Energy REMC 0 0 0.00 0.00
Total 842 0 0.68 0.35
Cooperative Total Devices Controlled
Annual MWh Savings
Summer Peak MW Savings
Winter Peak MW Savings
Bartholomew County REMC 500 344 0.03 0.07
Clark County REMC 1000 687 0.06 0.14
Daviess-Martin County REMC 500 344 0.03 0.07
Decatur County REMC 500 344 0.03 0.07
Dubois REC, Inc. 500 344 0.03 0.07
Harrison REMC 1100 756 0.07 0.15
Henry County REMC 500 344 0.03 0.07
Jackson County REMC 500 344 0.03 0.07
Johnson County REMC 1000 687 0.06 0.14
Orange County REMC 500 344 0.03 0.07
RushShelby Energy 500 344 0.03 0.07
South Central Indiana REMC 1000 687 0.06 0.14
Southeastern Indiana REMC 1000 687 0.06 0.14
Southern Indiana Power 500 344 0.03 0.07
Utilities District of Western Indiana REMC 900 618 0.05 0.12
Wayne-White Counties Electric Cooperative 0 0 0.00 0.00
Whitewater Valley REMC 500 344 0.03 0.07
WIN Energy REMC 500 344 0.03 0.07
Total 11,500 7,906 0.69 1.60
Appendix A
2016 DSM ANNUAL REPORT11

Data includes attic insulation and duct sealing.
2016 Residential HVAC Incentives Program
2016 Touchstone Energy® HomeSM Program
Cooperative Total Measures Installed
Annual MWh Savings
Summer Peak MW Savings
Winter Peak MW Savings
Bartholomew County REMC 147 265 0.126 0.172
Clark County REMC 344 1029 0.346 0.372
Daviess-Martin County REMC 100 209 0.065 0.174
Decatur County REMC 75 84 0.032 0.132
Dubois REC, Inc. 284 500 0.292 0.448
Harrison REMC 1089 1490 1.061 0.751
Henry County REMC 55 145 0.055 0.164
Jackson County REMC 574 826 0.437 0.426
Johnson County REMC 166 625 0.119 0.217
Orange County REMC 170 225 0.143 0.091
RushShelby Energy 123 148 0.056 0.198
South Central Indiana REMC 450 222 0.120 0.152
Southeastern Indiana REMC 194 432 0.158 0.500
Southern Indiana Power 117 899 0.229 0.561
Utilities District of Western Indiana REMC 202 363 0.114 0.243
Wayne-White Counties Electric Cooperative 87 193 0.071 0.288
Whitewater Valley REMC 57 118 0.035 0.215
WIN Energy REMC 110 189 0.062 0.210
Total 4,344 7,962 3.521 5.314
Cooperative Homes Registered
Annual MWh Savings
Summer Peak MW Savings
Winter Peak MW Savings
Bartholomew County REMC 0 0 0.000 0.000
Clark County REMC 3 0 0.000 0.000
Daviess-Martin County REMC 0 0 0.000 0.000
Decatur County REMC 3 29 0.007 0.004
Dubois REC, Inc. 4 43 0.010 0.007
Harrison REMC 13 77 0.018 0.011
Henry County REMC 0 0 0.000 0.000
Jackson County REMC 4 51 0.012 0.007
Johnson County REMC 0 0 0.000 0.000
Orange County REMC 0 0 0.000 0.000
RushShelby Energy 4 0 0.000 0.000
South Central Indiana REMC 2 30 0.007 0.004
Southeastern Indiana REMC 6 0 0.000 0.000
Southern Indiana Power 2 0 0.000 0.000
Utilities District of Western Indiana REMC 2 0 0.000 0.000
Wayne-White Counties Electric Cooperative 0 0 0.000 0.000
Whitewater Valley REMC 0 0 0.000 0.000
WIN Energy REMC 0 0 0.000 0.000
Total 43 230 0.054 0.033
Appendix A
12

2016 Appliance Recycling Program
2016 LED Security Lighting Program
Cooperative Total UnitsCollected
Annual MWh Savings
Summer Peak MW Savings
Winter Peak MW Savings
Bartholomew County REMC 12 10 0.001 0.001
Clark County REMC 0 0 0.000 0.000
Daviess-Martin County REMC 0 0 0.000 0.000
Decatur County REMC 13 12 0.001 0.001
Dubois REC, Inc. 176 146 0.014 0.012
Harrison REMC 0 0 0.000 0.000
Henry County REMC 102 89 0.008 0.007
Jackson County REMC 47 89 0.008 0.005
Johnson County REMC 0 0 0.000 0.000
Orange County REMC 5 5 0.000 0.000
RushShelby Energy 80 73 0.006 0.005
South Central Indiana REMC 116 106 0.009 0.008
Southeastern Indiana REMC 0 0 0.000 0.000
Southern Indiana Power 33 37 0.003 0.002
Utilities District of Western Indiana REMC 83 75 0.006 0.006
Wayne-White Counties Electric Cooperative 0 0 0.000 0.000
Whitewater Valley REMC 35 31 0.003 0.002
WIN Energy REMC 0 0 0.000 0.000
Total 702 673 0.059 0.049
Cooperative Total Measures Installed
Annual MWh Savings
Summer Peak MW Savings
Winter Peak MW Savings
Bartholomew County REMC 14 7 0.000 0.001
Clark County REMC 0 0 0.000 0.000
Daviess-Martin County REMC 0 0 0.000 0.000
Decatur County REMC 305 160 0.000 0.029
Dubois REC, Inc. 188 99 0.000 0.018
Harrison REMC 373 196 0.000 0.035
Henry County REMC 503 264 0.000 0.048
Jackson County REMC 581 305 0.000 0.055
Johnson County REMC 466 245 0.000 0.044
Orange County REMC 126 66 0.000 0.012
RushShelby Energy 178 93 0.000 0.017
South Central Indiana REMC 109 57 0.000 0.010
Southeastern Indiana REMC 847 445 0.000 0.080
Southern Indiana Power 530 278 0.000 0.050
Utilities District of Western Indiana REMC 319 167 0.000 0.030
Wayne-White Counties Electric Cooperative 481 253 0.000 0.045
Whitewater Valley REMC 568 298 0.000 0.054
WIN Energy REMC 144 76 0.000 0.014
Total 5,732 3,009 0.000 0.542
Appendix A
2016 DSM ANNUAL REPORT13

Analysis of Measures Installed: 2009-2016
Estimated Benefits and Costs for all Measures Installed: 2009–20161,2
1 Appendix B measures are shown at generation levels. A 9% transmission and distribution loss is factored into estimates.2 Other basic program assumptions are available upon request from Susannah Smith at [email protected] Hoosier Weatherization Program includes 1,393 homes on member systems weatherized through the ARRA program 2009-2011.4 Other Savings include deferred weatherization benefits and energy efficiency kits.
* Formula for cost per kWh is (Hoosier Energy Cost + Participant Cost) / (Estimated Lifetime MWh Savings * 1000) Example: ($30,281,884 + $26,661,273) / (3,435,028 * 1000) = $0.0166
** Formula for TRC is Lifetime Economic Benefit / Hoosier Energy Cost + Participant Cost Example: $144,741,192 / ($30,281,884 + $26,661,273) = $2.54 or TRC ratio 2.54 to 1
The average lifetime cost of energy conserved to date through DSM measures is less than $0.02 per kWh, well below the cost to provide power from traditional resources.*
DSM programs are evaluated using a Total Resource Cost (TRC) test that compares avoided energy and capacity savings to the costs of the efficiency measure or program including cost borne by consumers.
Benefits detailed in the TRC test include avoided supply costs such as reductions in capital and O&M costs for
generation, transmission and distribution facilities and operations.
A TRC ratio higher than 1.0 indicates program benefits exceed program costs. For all programs to date, lifetime economic benefits outweighed costs by a ratio of 2.54 to 1.**
This ratio suggests that $2.54 in long-term benefits were obtained for each $1 invested in efficiency programs.
Appendix B
Total Measures Installed to Date
Cumulative MWh Savings to Date
Estimated Lifetime
MWh Savings
Cumulative Summer Peak MW
Savings to Date
Cumulative Winter Peak MW Savings to Date
Residential Lighting 1,759,656 47,009 662,793 5.10 12.51
Commercial & Industrial Energy Efficiency 778 103,716 1,555,740 14.27 15.12
Weatherization3 4,061 19,285 479,329 4.81 3.28
Load Control 16,380 - - 12.33 7.83
Other Savings4 31,558 12,042 84,301 2.00 3.76
Residential HVAC 31,601 36,259 471,022 12.16 40.97
Touchstone Energy Home 512 2,424 48,460 0.57 0.19
Appliance Recycling 7,941 5,297 40,958 0.44 0.37
LED Security Lighting 14,476 7,611 92,425 0.00 0.36
Total 1,866,963 233,644 3,435,028 51.68 84.39
Hoosier Energy Costs
Participant Costs
Lifetime Economic Benefits
Cost/kWh Total Resource Cost (TRC)
Residential Lighting $2,951,703 $0 $21,092,259 0.01 7.15
Commercial & Industrial Energy Efficiency $3,414,752 $12,904,442 $69,281,491 0.01 4.64
Weatherization $9,078,275 $0 $15,084,780 0.02 1.66
Load Control $2,808,624 $0 $5,829,794 0.00 2.08
Other Savings $2,031,327 $0 $2,372,473 0.00 1.05
Residential HVAC $7,402,587 $10,579,252 $22,810,492 0.04 1.27
Touchstone Energy Home $539,977 $644,279 $1,466,397 0.03 1.24
Appliance Recycling $968,939 $0 $1,375,006 0.02 1.42
LED Security Lighting $1,085,700 $2,533,300 $5,428,500 0.02 1.24
Total $30,281,884 $26,661,273 $144,741,192 0.02 2.54
14

Residential Lighting Program
C&I Energy Efficiency Program
Cooperative Total Measures Installed
Cumulative MWh Savings
Estimated Lifetime
MWh Savings
Cumulative Summer Peak MW Savings
Cumulative Winter Peak MW Savings
Lifetime Economic Benefits
Bartholomew County REMC 114,083 3,730 32,934 0.38 0.87 $1,374,921
Clark County REMC 325,635 9,447 94,251 0.95 2.42 $4,101,974
Daviess-Martin County REMC 105,101 1,574 30,409 0.16 0.43 $1,368,906
Decatur County REMC 37,765 903 10,924 0.09 0.23 $474,225
Dubois REC, Inc. 118,696 3,457 34,256 0.35 0.80 $1,410,773
Harrison REMC 119,698 0 34,608 0.37 0.91 $1,422,235
Henry County REMC 63,513 1,680 18,355 0.17 0.41 $808,119
Jackson County REMC 106,754 3,239 30,736 0.32 0.86 $1,303,299
Johnson County REMC 90,000 2,801 25,982 0.28 0.66 $1,072,358
Orange County REMC 67,863 2,204 19,643 0.22 0.56 $800,111
RushShelby Energy 59,088 1,433 171,101 0.14 0.38 $755,378
South Central Indiana REMC 58,210 1,533 16,816 0.16 0.37 $674,978
Southeastern Indiana REMC 104,000 2,937 30,114 0.29 0.76 $1,258,318
Southern Indiana Power 111,137 3,081 32,071 0.32 0.71 $1,398,314
Utilities District of Western Indiana REMC 110,742 3,835 32,271 0.39 0.93 $1,284,236
Wayne-White Counties Electric Cooperative 63,791 2,173 18,407 0.22 0.50 $326,801
Whitewater Valley 75,183 2,003 21,721 0.20 0.48 $947,228
WIN Energy 28,397 979 8,194 0.10 0.23 $310,085
Total 1,759,656 47,009 662,793 5.10 12.51 $21,092,259
Measures for the C&I Energy Efficiency Program are listed in terms of rebate applications paid.
Appendix B
Cooperative Rebate Applications
Cumulative MWh Savings
Estimated Lifetime
MWh Savings
Cumulative Summer Peak MW Savings
Cumulative Winter Peak MW Savings
Lifetime Economic Benefits
Bartholomew County REMC 54 15,738 236,070 2.852 2.976 $10,375,098
Clark County REMC 46 3,890 58,350 0.591 0.665 $2,366,530
Daviess-Martin County REMC 24 1,304 19,560 0.261 0.260 $1,302,099
Decatur County REMC 31 3,773 56,595 0.531 0.545 $2,719,252
Dubois REC, Inc. 57 3,933 58,995 0.494 0.581 $2,324,699
Harrison REMC 40 5,260 78,900 0.650 0.686 $3,445,326
Henry County REMC 22 928 13,920 0.182 0.205 $801,577
Jackson County REMC 99 2,121 31,815 0.359 0.353 $1,688,366
Johnson County REMC 71 7,656 114,840 1.208 1.310 $6,076,196
Orange County REMC 12 1,064 15,960 0.160 0.146 $733,130
RushShelby Energy 31 8,160 122,400 0.876 0.918 $2,878,979
South Central Indiana REMC 69 3,238 48,570 0.403 0.442 $2,210,877
Southeastern Indiana REMC 31 3,439 51,585 0.519 0.538 $3,836,039
Southern Indiana Power 47 7,913 118,695 0.872 0.914 $5,283,696
Utilities District of Western Indiana REMC 48 21,953 329,295 2.593 2.813 $15,285,531
Wayne-White Counties Electric Cooperative 19 1,516 22,740 0.410 0.432 $316,718
Whitewater Valley 24 1,975 29,625 0.256 0.262 $1,191,460
WIN Energy 53 9,855 147,825 1.054 1.077 $6,445,918
Total 778 103,716 1,555,740 14.271 15.123 $69,281,491
2016 DSM ANNUAL REPORT15

DSM Annual Report | 15
CooperativeTotal
Devices Controlled
Cumulative MWh Savings
Estimated Lifetime
MWh Savings
Cumulative Summer Peak MW Savings
Cumulative Winter Peak MW Savings
Lifetime Economic Benefits
Bartholomew County REMC 195 0 0 0.145 0.095 $69,760
Clark County REMC 0 0 0 0.000 0.000 $0
Daviess-Martin County REMC 1,191 0 0 0.993 0.442 $468,404
Decatur County REMC 200 0 0 0.089 0.178 $42,332
Dubois REC, Inc. 540 0 0 0.455 0.194 $217,344
Harrison REMC 1,885 0 0 1.496 0.798 $707,899
Henry County REMC 958 0 0 0.783 0.375 $371,423
Jackson County REMC 1,090 0 0 0.912 0.399 $423,844
Johnson County REMC 0 0 0 0.000 0.000 $0
Orange County REMC 1,822 0 0 1.248 1.035 $588,916
RushShelby Energy 1,175 0 0 0.956 0.467 $454,931
South Central Indiana REMC 2,018 0 0 1.170 1.429 $549,233
Southeastern Indiana REMC 2,151 0 0 1.651 0.986 $785,476
Southern Indiana Power 1,837 0 0 1.478 0.750 $695,895
Utilities District of Western Indiana REMC 1,309 0 0 0.948 0.676 $452,101
Wayne-White Counties Electric Cooperative 0 0 0 0.000 0.000 $0
Whitewater Valley REMC 8 0 0 0.004 0.006 $2,041
WIN Energy REMC 1 0 0 0.000 0.001 $195
Total 16,380 0 0 12.328 7.831 $5,829,794
CooperativeTotal
Measures Installed
Cumulative MWh Savings
Estimated Lifetime
MWh Savings
Cumulative Summer Peak MW Savings
Cumulative Winter Peak MW Savings
Lifetime Economic Benefits
Bartholomew County REMC 1,421 679 4,755 0.08 0.17 $117,582
Clark County REMC 1,986 612 4,286 0.07 0.17 $58,797
Daviess-Martin County REMC 937 337 2,361 0.04 0.09 $37,081
Decatur County REMC 939 339 2,371 0.04 0.09 $37,624
Dubois REC, Inc. 947 344 2,410 0.04 0.09 $39,106
Harrison REMC 3,511 1,420 9,941 0.24 0.44 $303,849
Henry County REMC 1,511 743 5,200 0.08 0.19 $133,296
Jackson County REMC 1,300 554 3,875 0.06 0.14 $92,166
Johnson County REMC 2,800 1,212 8,486 0.14 0.31 $197,288
Orange County REMC 1,431 692 4,844 0.08 0.17 $120,967
RushShelby Energy 1,268 501 3,504 0.06 0.13 $78,698
South Central Indiana REMC 4,563 1,106 7,744 0.67 0.86 $615,532
Southeastern Indiana REMC 3,242 1,429 10,005 0.16 0.36 $252,336
Southern Indiana Power 1,010 318 2,227 0.04 0.09 $32,328
Utilities District of Western Indiana REMC 1,955 613 4,291 0.07 0.17 $68,758
Wayne-White Counties Electric Cooperative 37 26 183 0.00 0.01 $6,642
Whitewater Valley REMC 1,600 735 5,146 0.08 0.18 $131,121
WIN Energy REMC 1,100 382 2,672 0.05 0.10 $49,302
Total 31,558 12,042 84,301 2.00 3.76 $2,372,473
Energy Management Savings Switch Program
Other Savings
Other Savings includes energy efficiency kits and Deferred Weatherization program benefits. Savings for installed measures will continue to contribute to program savings for the duration of deemed useful life.
Appendix B
16

Residential HVAC Incentives Program
Touchstone Energy® HomeSM Program
CooperativeTotal
Measures Installed
Cumulative MWh Savings
Estimated Lifetime
MWh Savings
Cumulative Summer Peak MW Savings
Cumulative Winter Peak MW Savings
Lifetime Economic Benefits
Bartholomew County REMC 1,493 1,529 21,364 0.55 1.22 $1,046,510
Clark County REMC 3,907 4,366 49,636 1.97 3.07 $2,455,237
Daviess-Martin County REMC 916 1,145 15,808 0.33 1.51 $772,610
Decatur County REMC 496 854 13,319 0.20 1.72 $682,150
Dubois REC, Inc. 1,941 2,219 30,070 0.69 3.35 $1,604,505
Harrison REMC 3,421 4,137 41,166 2.17 3.07 $1,849,411
Henry County REMC 557 859 12,172 0.24 1.35 $624,459
Jackson County REMC 2,215 2,622 29,867 1.01 2.44 $1,339,723
Johnson County REMC 1,540 2,039 24,867 0.57 1.55 $1,184,331
Orange County REMC 896 701 7,658 0.26 0.48 $326,467
RushShelby Energy 800 1,058 15,871 0.27 1.64 $816,763
South Central Indiana REMC 4,014 3,162 49,119 0.87 3.94 $2,450,635
Southeastern Indiana REMC 2,707 2,884 42,216 0.68 4.45 $2,129,669
Southern Indiana Power 1,221 2,417 25,237 0.69 2.12 $1,045,079
Utilities District of Western Indiana REMC 1,880 2,427 35,867 0.66 2.81 $1,681,094
Wayne-White Counties Electric Cooperative 958 1,133 15,429 0.34 2.07 $733,254
Whitewater Valley REMC 808 1,090 16,915 0.24 2.09 $849,619
WIN Energy REMC 1,831 1,617 24,441 0.42 2.09 $1,218,977
Total 31,601 36,259 471,022 12.16 40.97 $22,810,493
Cooperative Homes Registered
Cumulative MWh Savings
Estimated Lifetime
MWh Savings
Cumulative Summer Peak MW Savings
Cumulative Winter Peak MW Savings
Lifetime Economic Benefits
Bartholomew County REMC 6 28 568 0.01 0.00 $20,627
Clark County REMC 48 227 4,543 0.05 0.03 $152,365
Daviess-Martin County REMC 5 24 473 0.01 0.00 $16,877
Decatur County REMC 21 99 1,988 0.02 0.01 $62,531
Dubois REC, Inc. 91 431 8,613 0.10 0.06 $292,932
Harrison REMC 136 644 12,872 0.15 0.09 $414,948
Henry County REMC 4 19 379 0.00 0.00 $14,281
Jackson County REMC 63 298 5,963 0.07 0.04 $202,334
Johnson County REMC 1 5 95 0.00 0.00 $2,887
Orange County REMC 2 10 189 0.00 0.00 $6,368
RushShelby Energy 41 194 3,880 0.05 0.03 $138,205
South Central Indiana REMC 28 133 2,650 0.03 0.02 $87,038
Southeastern Indiana REMC 15 70 1,420 0.02 0.01 $47,619
Southern Indiana Power 33 156 3,123 0.04 0.02 $108,633
Utilities District of Western Indiana REMC 16 76 1,514 0.02 0.01 $51,793
Wayne-White Counties Electric Cooperative 0 0 0 0.00 0.00 $0
Whitewater Valley REMC 1 5 95 0.00 0.00 $3,435
WIN Energy REMC 1 5 95 0.00 0.00 $3,279
Total 512 2,424 48,460 0.57 0.32 $1,626,152
Appendix B
Data includes attic insulation and duct sealing.
2016 DSM ANNUAL REPORT17

Cooperative Total Units Collected
Cumulative MWh Savings
Estimated Lifetime
MWh Savings
Cumulative Summer Peak MW Savings
Cumulative Winter Peak MW Savings
Lifetime Economic Benefits
Bartholomew County REMC 256 190 1,315 0.016 0.014 $43,153
Clark County REMC 794 468 4,102 0.039 0.033 $143,191
Daviess-Martin County REMC 211 139 1,091 0.012 0.010 $37,072
Decatur County REMC 208 144 1,070 0.012 0.010 $35,575
Dubois REC, Inc. 893 637 4,626 0.053 0.045 $150,827
Harrison REMC 614 436 3,160 0.036 0.031 $102,840
Henry County REMC 344 299 1,747 0.025 0.021 $54,251
Jackson County REMC 621 431 3,172 0.036 0.031 $104,143
Johnson County REMC 174 180 899 0.015 0.013 $26,018
Orange County REMC 7 29 143 0.002 0.002 $4,296
RushShelby Energy 489 335 2,502 0.028 0.024 $82,530
South Central Indiana REMC 755 497 3,892 0.041 0.035 $131,213
Southeastern Indiana REMC 1,044 445 5,388 0.037 0.032 $198,930
Southern Indiana Power 399 209 2,039 0.017 0.012 $72,844
Utilities District of Western Indiana REMC 419 309 2,144 0.026 0.022 $69,416
Wayne-White Counties Electric Cooperative 247 170 1,271 0.014 0.012 $41,641
Whitewater Valley REMC 306 215 1,578 0.018 0.015 $51,803
WIN Energy REMC 160 164 819 0.014 0.012 $25,263
Total 7,941 5,297 40,958 0.441 0.374 $1,375,006
CooperativeTotal
Measures Installed
Cumulative MWh Savings
Estimated Lifetime
MWh Savings
Cumulative Summer Peak MW Savings
Cumulative Winter Peak MW Savings
Lifetime Economic Benefits
Bartholomew County REMC 242 127 2,410 0.000 0.009 $90,750
Clark County REMC 0 0 0 0.000 0.000 $0
Daviess-Martin County REMC 0 0 0 0.000 0.000 $0
Decatur County REMC 436 229 1,385 0.000 0.005 $163,500
Dubois REC, Inc. 435 229 2,611 0.000 0.010 $163,125
Harrison REMC 1,513 796 12,050 0.000 0.047 $567,375
Henry County REMC 1,041 547 5,687 0.000 0.022 $390,375
Jackson County REMC 1,439 756 9,069 0.000 0.035 $539,625
Johnson County REMC 1,237 651 8,149 0.000 0.032 $463,875
Orange County REMC 373 196 2,611 0.000 0.010 $139,875
RushShelby Energy 402 211 2,368 0.000 0.009 $150,750
South Central Indiana REMC 734 386 6,606 0.000 0.008 $275,250
Southeastern Indiana REMC 2,037 1,071 12,578 0.000 0.049 $763,875
Southern Indiana Power 733 385 2,146 0.000 0.026 $274,875
Utilities District of Western Indiana REMC 786 413 4,936 0.000 0.019 $294,750
Wayne-White Counties Electric Cooperative 1,044 549 5,951 0.000 0.015 $391,500
Whitewater Valley 936 492 3,890 0.000 0.023 $351,000
WIN Energy 1,088 573 9,978 0.000 0.039 $408,000
Total 14,476 7,611 92,425 0.000 0.358 $5,428,500
Appliance Recycling Program
LED Security Lighting Program
Appendix B
Data reflects units collected between 3/1/2010 — 12/31/2016.
18

Wayne-WhiteCounties EC
WINEnergyREMC
Daviess-MartinCounty REMC
UDWI REMC
South CentralIndiana REMC
RushShelby Energy
Decatur CountyREMC
WhitewaterValleyREMC
HenryCountyREMC
SoutheasternIndiana REMC
Clark County REMC
HarrisonREMC
SouthernIndiana Power
Dubois REC
JohnsonCountyREMC
OrangeCountyREMC
BartholomewCounty REMC
Jackson CountyREMC
THE HOOSIER ENERGY POWER NETWORKHoosier Energy is a generation and transmission cooperative providing electric power to 18 member distribution cooperatives in central and southern Indiana and southeast Illinois. Based in Bloomington, Hoosier Energy operates coal, natural gas and renewable energy power plants and delivers power through a 1,700-mile transmission network.
2016 DSM ANNUAL REPORT19

HOOSIER ENERGY | P.O. Box 908 | Bloomington, IN 47402 | 2501 South Cooperative Way | Bloomington, IN 47403
TeamUpToSave.com