ing relazione sulla gestione 30 06 12 ver 10 08 financial....2 disclaimer this document contains...
TRANSCRIPT

HALF-YEAR FINANCIAL REPORT AT 30 JUNE 2012
PRYSMIAN GROUP

. 2
DisclaimerThis document contains forward-looking statements, specifically in the sections entitled "Subsequent events" and
"Business outlook", that relate to future events and the operating, economic and financial results of the Prysmian
Group. By their nature, forward-looking statements involve risk and uncertainty because they depend on the
occurrence of future events and circumstances. Therefore, actual future results may differ materially from what is
expressed in forward-looking statements as a result of a variety of factors.

PRYSMIAN GROUP l CONTENTS
. 3
CONTENTS
Interim Directors’ ReportDirectors and auditors page 5Summary of consolidated financial information page 7Significant events during the period page 8Group performance and results page 10Segment performance page 14Group statement of financial position page 30Alternative performance indicators page 34Subsequent events page 39Business outlook page 39Foreseeable risks in 2012 page 40Stock option plans page 45Related party transactions page 45
Half-Year Condensed Consolidated Financial StatementsConsolidated statement of financial position page 47Consolidated income statement page 48Consolidated statement of comprehensive income page 49Consolidated statement of changes in equity page 49Consolidated statement of cash flows page 50Explanatory notes page 51Appendix A – Scope of consolidation page 88Certification letter page 97Audit Report page 100

INTERIM DIRECTORS’ REPORT

PRYSMIAN l INTERIM DIRECTORS’ REPORT
. 5
Board of Directors Chairman Massimo Tononi (*) (2)
Chief Executive Officer &
General Manager Valerio Battista
Directors Maria Elena Cappello (*) (**) (1) Pier Francesco Facchini
Cesare d'Amico (*) (**) Fritz Fröhlich (*) (**) (1)
Claudio De Conto(*) (**) (1) (2) Fabio Ignazio Romeo
Giulio Del Ninno (*) (**) (2) Giovanni Tamburi (*) (**)
Frank Dorjee
Board of Statutory
Auditors
Chairman
Marcello Garzia
Standing Statutory Auditors Luigi Guerra Paolo Burlando
Alternate Statutory Auditors Luciano Rai Giovanni Rizzi
Independent Auditors PricewaterhouseCoopers S.p.A.
(**)Independent directors as per Self-Regulatory Code
(2)Members of the Compensation and Nominations Committee
(*)Independent directors as per Italy's Unified Financial Act (T.U.F.)
(1)Members of the Internal Control Committee
DIRECTORS AND AUDITORS

PRYSMIAN l INTERIM DIRECTORS’ REPORT
. 6
Foreword
This Half-Year Financial Report at 30 June 2012 (Interim management statement pursuant to art. 154-ter of
Italian Legislative Decree 58/1998) has been drawn up and prepared:
- in compliance with art. 154-ter of Italian Legislative Decree 58/1998 and subsequent amendments and with
the Issuer Regulations published by Consob (Italy's securities regulator);
- in compliance with the International Financial Reporting Standards (IFRS) issued by the International
Accounting Standards Board (IASB) and endorsed by the European Union, and in accordance with IAS 34
– Interim Financial Reporting, applying the same accounting standards and policies adopted to prepare the
consolidated financial statements at 31 December 2011, except as described in the Half-Year Condensed
Consolidated Financial Statements in the paragraph entitled "Accounting standards, amendments and
interpretations applied from 1 January 2012".
The Half-Year Condensed Consolidated Financial Statements, included in the present Half-Year Financial
Report, have been the subject of a limited review by the independent auditors.
PRYSMIAN l INTERIM DIRECTORS’ REPORT
. 7
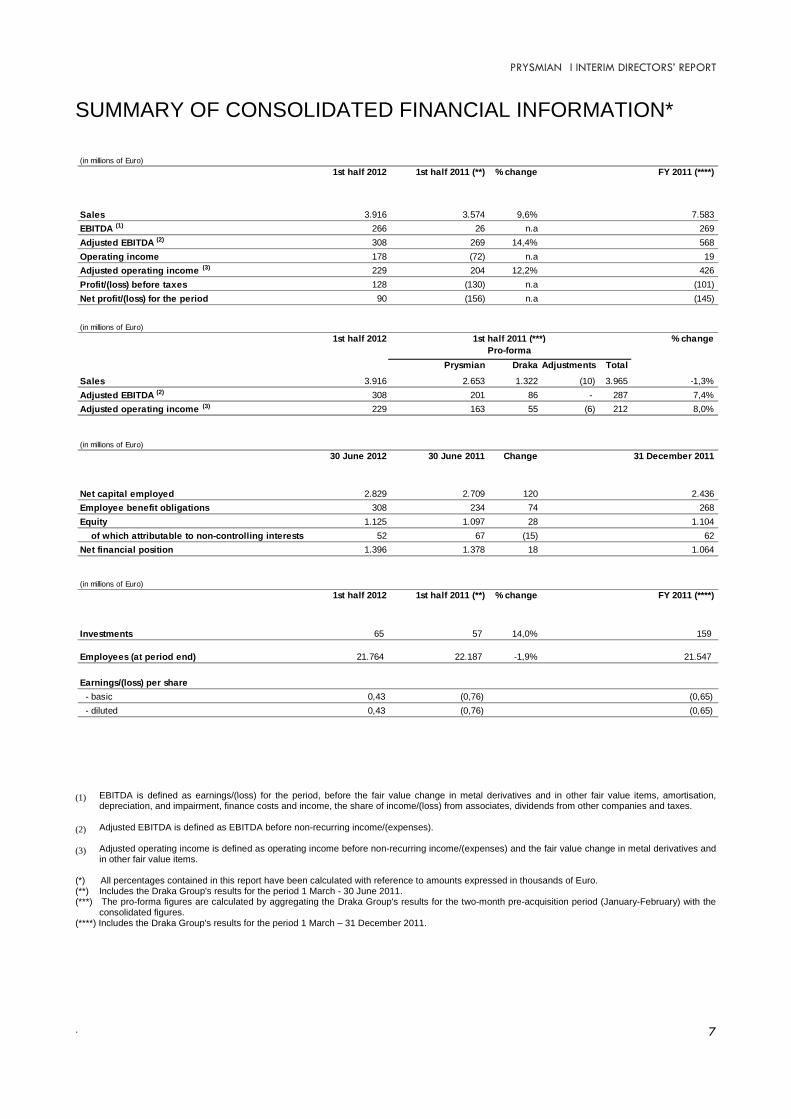
SUMMARY OF CONSOLIDATED FINANCIAL INFORMATION*
(1) EBITDA is defined as earnings/(loss) for the period, before the fair value change in metal derivatives and in other fair value items, amortisation,depreciation, and impairment, finance costs and income, the share of income/(loss) from associates, dividends from other companies and taxes.
(2) Adjusted EBITDA is defined as EBITDA before non-recurring income/(expenses).
(3) Adjusted operating income is defined as operating income before non-recurring income/(expenses) and the fair value change in metal derivatives andin other fair value items.
(*) All percentages contained in this report have been calculated with reference to amounts expressed in thousands of Euro.(**) Includes the Draka Group's results for the period 1 March - 30 June 2011.(***) The pro-forma figures are calculated by aggregating the Draka Group's results for the two-month pre-acquisition period (January-February) with the
consolidated figures.(****) Includes the Draka Group's results for the period 1 March – 31 December 2011.
(in millions of Euro)
1st half 2012 1st half 2011 (**) % change FY 2011 (****)
Sales 3.916 3.574 9,6% 7.583
EBITDA (1) 266 26 n.a 269
Adjusted EBITDA (2) 308 269 14,4% 568
Operating income 178 (72) n.a 19
Adjusted operating income (3) 229 204 12,2% 426
Profit/(loss) before taxes 128 (130) n.a (101)
Net profit/(loss) for the period 90 (156) n.a (145)
(in millions of Euro)
1st half 2012 % change
Prysmian Draka Adjustments Total
Sales 3.916 2.653 1.322 (10) 3.965 -1,3%
Adjusted EBITDA (2) 308 201 86 - 287 7,4%
Adjusted operating income (3) 229 163 55 (6) 212 8,0%
(in millions of Euro)
30 June 2012 30 June 2011 Change 31 December 2011
Net capital employed 2.829 2.709 120 2.436
Employee benefit obligations 308 234 74 268
Equity 1.125 1.097 28 1.104
of which attributable to non-controlling interests 52 67 (15) 62
Net financial position 1.396 1.378 18 1.064
(in millions of Euro)
1st half 2012 1st half 2011 (**) % change FY 2011 (****)
Investments 65 57 14,0% 159
Employees (at period end) 21.764 22.187 -1,9% 21.547
Earnings/(loss) per share
- basic 0,43 (0,76) (0,65)
- diluted 0,43 (0,76) (0,65)
1st half 2011 (***)
Pro-forma

PRYSMIAN l INTERIM DIRECTORS’ REPORT
. 8
SIGNIFICANT EVENTS DURING THE PERIOD
PRINCIPAL PROJECTS ACQUIRED AND COMMERCIAL INITIATIVES IN THE PERIOD
At the start of February 2012, the Prysmian Group secured a record contract worth approximately Euro 800
million - the highest ever reported in the cable industry – for the Western HVDC Link project to develop a
new submarine power line between Scotland and England. The entire turnkey project will be carried out by a
consortium between Prysmian and Siemens, with the latter responsible for the converter stations. The total
value of the contract awarded to the consortium by NGET/SPT Upgrades Ltd, a joint venture between
National Grid Electricity Transmission, the British grid operator, and Scottish Power Transmission, the
Scottish grid operator, is about Euro 1.1 billion. The project is scheduled to be completed by the second half
of 2015.
The Western HVDC Link is strategic for the upgrade of the entire British transmission grid in view of the UK’s
drive to make growing use of energy from renewable sources. The project represents a milestone not only in
value but also in technological terms. The interconnection, designed as a low loss HVDC (High Voltage
Direct Current) transmission system, will operate at a record voltage of 600 kV, the highest ever reached by
an insulated cable (the record to date is 500 kV) with a rating of 2200 MW, both of which levels currently
unmatched by existing long-distance systems. The main purpose of the new link is to connect renewable
generation sources in Scotland to consumption centres in England, while nonetheless allowing a bi-
directional flow of the power transmitted. The choice of a submarine route rather than a land one will make
the speed of project approval and execution faster.
Draka Elevator, a Prysmian Group brand, has been selected by two major OEM specialist elevator
manufacturers to supply high-tech cables and accessories for the elevators in the new World Trade Center in
New York City. Buildings 1 and 4 are currently under construction. The contracts entail supplying a wide
range of standard and custom-designed cables and related accessories for installation in more than 100
elevators. One World Trade Center will reach a height of 1776 feet (over 634 metres). Draka Elevator’s
cables will be used to provide power for elevator buttons, communications and emergency safety devices
and more. Some of the cables include fibre optic sub-units, which will be used for high-speed
communications throughout the World Trade Center complex. The cables and accessories are being
manufactured at Draka Elevator’s Rocky Mount plant in North Carolina.
At the end of March Prysmian announced the start of work on a contract worth more than Euro 50 million to
supply 203 km of high voltage 220 kV AC cable and related network components to upgrade the electricity
grids operated by GECOL (General Electric Company of Libya) in Tripoli and Benghazi. The contract, due to
be carried out for PEWCO (Public Works Electric Company), also includes the supply of optical cables for
grid monitoring. The cables are scheduled to be delivered between 2012 and 2013. The project in question
had been cancelled during 2011 due to the outbreak of war.
In May, the Vietnamese utility company EVNSPC (Southern Power Corporation under Vietnam Electricity)
awarded the Prysmian Group a contract worth Euro 67 million. The Group will design, manufacture, install

PRYSMIAN l INTERIM DIRECTORS’ REPORT
. 9
and commission a new submarine power line linking Phu Quoc island, located 45 km west of the town of Ha
Tien, in Kien Giang province in southern Vietnam, to the national power grid.
Phu Quoc island is home to some of the most beautiful beaches in Vietnam and the submarine cable link will
play a strategic role in developing the island's tourism. Once completed, the Phu Quoc link will be the first
submarine power line installed by a utility company in Vietnam.
The Phu Quoc link will require some 58 km of high voltage submarine cable, which, under the contract, will
also be laid and subsequently protected. The interconnection is scheduled for completion in the first half of
2014. Prysmian secured this contract after successfully beating stiff competition from Far Eastern
manufacturers.
FINANCE AND M&A ACTIVITIES
On 27 February 2012, the squeeze-out, permitted under art. 2:359c of the Dutch Civil Code, was completed
in order to purchase the 478,878 ordinary shares of Draka Holding N.V., for which the acceptance was not
obtained during the public mixed exchange and cash offer for all the Draka Holding N.V. ordinary shares.
The successful conclusion of the squeeze-out means that Prysmian Group now holds the entire share
capital of Draka Holding N.V..
On 5 April 2012, Prysmian Group finalised the acquisition of 50% of the shares in Telcon Fios e Cabos para
Telecomunicaçoes S.A. and of 30% of the shares in Draktel Optical Fibre S.A., thereby becoming the sole
shareholder of these two Brazilian telecom cable and optical fibre companies, which had joined the Group
following the acquisition of Draka in 2011. The cash outlay for the acquisition amounts to approximately Euro
25 million (Euro 23 million for Telcon Fios e Cabos para Telecomunicaçoes S.A. and Euro 2 million for
Draktel Optical Fibre S.A.).
The credit agreement signed on 18 April 2007 ("Credit Agreement"), under which Prysmian S.p.A. and some
of its subsidiaries had been granted an initial total of Euro 1,700 million in loans and credit facilities, was
repaid on 3 May 2012. The Group repaid on this maturity date the residual balance of Euro 670 million
relating to the Term Loan Facility and Euro 5.2 million in amounts drawn down against the Revolving Credit
Facility. The Bonding Facility for Euro 300 million had been cancelled on 10 May 2011 in advance of its
natural maturity.
This credit agreement has been replaced by the Forward Start Credit Agreement (henceforth termed "Credit
Agreement 2010"), a long-term credit agreement for Euro 1,070 million, entered into on 21 January 2010
with a pool of major national and international banks which have made available Euro 670 million in loans
(Term Loan Facility 2010) and Euro 400 million in credit facilities (Revolving Credit Facility 2010). More
details can be found in Note 9 to the Half-Year Condensed Consolidated Financial Statements.
On 11 May 2012, Draka Comteq Finland OY acquired the entire 25% non-controlling interest in Neva Cables
Ltd, a Russian company that is now wholly owned by the Group.

PRYSMIAN l INTERIM DIRECTORS’ REPORT
. 10
GROUP PERFORMANCE AND RESULTS
(*) Includes the Draka Group's results for the period 1 March – 30 June 2011.(**) Includes the Draka Group's results for the period 1 March – 31 December 2011.
(in millions of Euro)
1st half 2012 1st half 2011 (*) % change FY 2011 (**)
Sales 3.916 3.574 9,6% 7.583
Adjusted EBITDA 308 269 14,4% 568
% of sales 7,9% 7,5% 7,5%
EBITDA 266 26 n.a 269
% of sales 6,8% 0,7% 3,4%
Fair value change in metal derivatives 1 (33) (62)
Remeasurement of minority put option liability - - (1)
Fair value stock options (9) - (7)
Amortisation, depreciation and impairment (80) (65) 21,5% (180)
Operating income 178 (72) n.a 19
% of sales 4,5% -2,0% 0,3%
Net finance income/(costs) (58) (62) (129)
Share of income from investments in associates and dividends
from other companies 8 4 9
Profit/(loss) before taxes 128 (130) n.a (101)
% of sales 3,3% -3,7% -1,3%
Taxes (38) (26) 45,7% (44)
Net profit/(loss) for the period 90 (156) n.a (145)
% of sales 2,3% -4,4% -1,9%
Attributable to:
Owners of the parent 90 (156) (136)
Non-controlling interests - - (9)
Operating income 178 (72) n.a 19
EBITDA (B) 266 26 n.a 269
Non-recurring expenses/(income):
Company reorganisation 27 12 56
Antitrust 3 200 205
Draka integration costs 3 6 12
Tax inspections 3 - -
Environmental remediation and other costs 1 - 5
Italian pensions reform 1 - -
Other non-recurring expenses 5 - -
Draka acquisition costs - 6 6
Effects of Draka change of control - 2 2
Release of Draka inventory step-up - 14 14
Business interruption Libya - 4 -
Gains on disposal of assets held for sale (1) (1) (1)
Total non-recurring expenses/(income) (C) 42 243 299
Fair value change in metal derivatives (D) (1) 33 62
Fair value stock options (E) 9 - 7
Remeasurement of minority put option liability (F) - - 1
Impairment of assets (G) 1 - 38
Adjusted operating income (A+C+D+E+F+G) 229 204 12,2% 426
Adjusted EBITDA (B+C) 308 269 14,4% 568
Reconciliation of Operating income / EBITDA to Adjusted Operating income / Adjusted EBITDA

PRYSMIAN l INTERIM DIRECTORS’ REPORT
. 11
(***) The pro-forma figures are calculated by aggregating the Draka Group's results for the two-month pre-acquisition period (January-
February) with the consolidated figures.
In accordance with the integration process, started last year, as from the current year, the Group's results
are being analysed as a whole (without distinguishing any more between the two Prysmian and Draka
groups). The figures for the first half of 2012 are compared with those from the half year consolidated
financial statements at 30 June 2011, and, in the case of the key performance indicators, with those
presented on a pro-forma basis in which Draka's results are reported as if they had been consolidated from
1 January 2011.
The Prysmian Group's sales in the first half of 2012 came to Euro 3,916 million, compared with Euro 3,574
million in the half year ended 30 June 2011.
The change of Euro 342 million (+9.6%) is largely attributable to the consolidation of the Draka Group's
results from 1 March 2011, excluding the first two months of last year (equal to Euro 391 million).
In contrast, first-half sales in 2012 were down on the 2011 pro-forma figure of Euro 3,965 million, reporting
a decrease of Euro 49 million (-1.3%).
Assuming a consistent comparative period and excluding changes in metal prices and exchange rates, the
organic change in sales was zero, analysed between the two operating segments as follows:
- Energy - 0.4%;
- Telecom +1.7%.
The above change excludes for the Telecom segment, the consolidation of the remaining 50% of Telcon
Fios e Cabos para Telecomunicaçoes S.A. for the period 1 April – 30 June 2012, and for the Energy
segment, the consolidation of the results of Ravin Cables Limited (India) and Power Plus Cable CO LLC
(Middle East) for the second quarter of 2011. It has been impossible for the Prysmian Group to be able to
obtain reliable, updated financial information about these last two companies since the second quarter of
this year; as a result, the consolidation includes their figures only up until 31 March 2012.
The Energy segment managed to make up for the contraction in volumes in the Trade & Installers, Power
Distribution and High Voltage business areas reported in Central and South European markets, thanks to
major international submarine projects and the recovery in demand in North and South America. Growth for
the Telecom Segment came from the optical fibre cables business and particularly from North and South
America.
(in millions of Euro)
1st half 2012 % change
Prysmian Draka Adjustments Total
Sales 3.916 2.653 1.322 (10) 3.965 -1,3%
Adjusted EBITDA 308 201 86 - 287 7,4%
% of sales 7,9% 7,6% 6,5% 7,2%
Adjusted operating income 229 163 55 (6) 212 8,0%
% of sales 5,9% 6,1% 4,2% 5,3%
1st half 2011 (***)
Pro-forma

PRYSMIAN l INTERIM DIRECTORS’ REPORT
. 12
Group Adjusted EBITDA (before Euro 42 million of net non-recurring expenses) came to Euro 308 million,
posting an increase of Euro 39 million (+14.4%) on the corresponding figure at 30 June 2011 of Euro 269
million, and an increase of Euro 21 million (+7.4%) on the 2011 pro-forma figure. The change against pro-
forma reflects increased contributions by both the Energy and Telecom segments, partly due to targeted
actions to rationalise and contain cost structures.
INCOME STATEMENT
The Group's sales came to Euro 3,916 million at the end of the first half of 2012, compared with Euro 3,574
million at 30 June 2011, posting a positive change of Euro 342 million (+9.6%). Compared with the pro-
forma figure of Euro 3,965 million, the Group's sales posted a negative change of Euro 49 million (-1.3%).
This decrease was due to the following factors:
- positive exchange rate effects of Euro 68 million (+1.9%);
- negative change of Euro 116 million (-3.2%) in sales prices due to fluctuations in metal prices
(copper, aluminium and lead);
- organic decrease in sales of Euro 1 million.
The stable sales performance, affected by growing uncertainties in European markets in the past six
months, has nonetheless confirmed the strategic validity of the Draka Group's acquisition and integration. In
fact, the enlargement of the Group's perimeter has resulted in a better geographical distribution of sales, in
favour of markets in Northern Europe, North America and Asia in general, as well as an extension of the
product range offered. This has allowed to neutralise the reduction in demand in Southern Europe and in
lower value-added businesses, like Trade & Installers and Power Distribution. The Group’s enhanced ability
to satisfy customer demands, combined with technological innovation, quality improvements and increased
flexibility of production in its high value-added businesses (High Voltage, Submarine, Industrial Cables)
have enabled the Company to promptly exploit market opportunities, which are increasingly confined to
certain geographical areas or characterised by high competition.
Adjusted EBITDA amounted to Euro 308 million, up 14.4% from Euro 269 million in the prior year equivalent
period and up 7.4% from the pro-forma figure of Euro 287 million at 30 June 2011. The like-for-like increase
is attributable to positive performances, particularly by the Energy segment’s Industrial business area and
Submarine business line and by the entire Telecom segment, and to the Group's ability to reduce its cost
structure, especially thanks to the contribution of synergies from integrating the Draka Group.
EBITDA includes Euro 42 million in non-recurring expenses (Euro 243 million at 30 June 2011), mainly
attributable to the following factors:
- Euro 27 million in costs for reorganisation projects and to improve the Group's industrial efficiency;
- Euro 3 million in costs associated with the Draka Group's integration process;
- Euro 3 million in costs connected with the antitrust investigations.

PRYSMIAN l INTERIM DIRECTORS’ REPORT
. 13
Group operating income was a positive Euro 178 million at 30 June 2012, compared with a negative Euro
72 million at 30 June 2011, marking an improvement of Euro 250 million.
Net finance costs, inclusive of the share of income/(loss) from associates and dividends from other
companies, were Euro 50 million at 30 June 2012, 13.8% below the consolidated figure of Euro 58 million at
the end of the first half of 2011. The reduction of Euro 8 million is mainly due to the positive performance of
currency derivatives.
Taxes of Euro 38 million, estimated on the basis of the expected rate for the full year, accounted for around
30% of pre-tax profit.
The net result for the first half of 2012 was a profit of Euro 90 million, compared with a consolidated loss of
Euro 156 million at 30 June 2011.
Adjusted net profit1
was Euro 130 million, compared with Euro 113 million in the first six months of 2011.
1 Adjusted net profit is defined as net profit before non-recurring income and expenses, the fair value change in metal derivatives and in other fair value
items, the effect of currency and interest rate derivatives, exchange rate differences and the related tax effects.

PRYSMIAN l INTERIM DIRECTORS’ REPORT
. 14
SEGMENT PERFORMANCE
ENERGY
(*) Includes the Draka Group's results for the period 1 March – 30 June 2011.(**) Includes the Draka Group's results for the period 1 March – 31 December 2011.
(in millions of Euro)
1st half 2012 1st half 2011 (*) %
change
FY 2011 (**)
Sales to third parties 3.170 2.989 6,1% 6.268
Adjusted EBITDA 229 215 6,5% 447
% of sales 7,2% 7,1% 7,1%
EBITDA 206 (2) n.a 186
% of sales 6,5% -0,1% 2,9%
Amortisation and depreciation (54) (47) 14,9% (99)
Adjusted operating income 175 168 4,2% 348
% of sales 5,5% 5,6% 5,5%
Reconciliation of EBITDA to Adjusted EBITDA
EBITDA (A) 206 (2) n.a 186
Non-recurring expenses/(income):
Company reorganisation 14 6 42
Antitrust 3 200 205
Draka integration costs 1 - 2
Tax inspections 1 - -
Environmental remediation and other costs 1 - 5
Italian pensions reform 1 - -
Other non-recurring expenses 3 - -
Release of Draka inventory step-up - 8 8
Business interruption Libya - 4 -
Gains on disposal of assets held for sale (1) (1) (1)
Total non-recurring expenses/(income) (B) 23 217 261
Adjusted EBITDA (A+B) 229 215 6,5% 447

PRYSMIAN l INTERIM DIRECTORS’ REPORT
. 15
(***) The pro-forma figures are calculated by aggregating the Draka Group's results for the two-month pre-acquisition period (January-
February) with the consolidated figures.
At the end of the first half of 2012 sales to third parties by the Energy segment amounted to Euro 3,170
million, compared with Euro 2,989 million at 30 June 2011, posting an increase of Euro 181 million (+6.1%).
Compared with the pro-forma figure of Euro 3,264 million, Energy sales to third parties posted a decrease
of Euro 94 million (-2.9%).
This negative change is mainly attributable to the following principal factors:
- negative change of Euro 111 million (-3.4%) in sales prices due to fluctuations in metal prices;
- negative change of Euro 16 million (-0.5%) due to failure to consolidate the results of Ravin Cables
Limited (India) and Power Plus Cable CO LLC (Middle East – 49% consolidated) for the period 1
April – 30 June 2012;
- organic decrease in sales of Euro 13 million (-0.4%);
- positive exchange rate effects of Euro 46 million (+1.4%).
Adjusted EBITDA came to Euro 229 million at 30 June 2012, posting an increase of Euro 14 million (+6.5%)
on the corresponding figure at 30 June 2011 of Euro 215 million, and an increase of Euro 4 million (+1.8%)
on the 2011 pro-forma figure.
The following paragraphs describe market trends and financial performance in each of the Energy segment's
business areas.
The results of each business area are compared with the pro-forma figures for the corresponding prior year
period and with the pro-forma figures for full year 2011. Some reclassifications have been made to the pro-
forma figures within each business area in order to make them fully comparable with the 2012 figures. Given
the limited usefulness and lack of significance for comparative purposes, it was decided not to present the
consolidated figures for 1st half 2011 by business area (which included Draka for only the period March-
June).
(in millions of Euro)
1st half 2012 %
change
Prysmian Draka Adjustments Total
Sales to third parties 3.170 2.383 890 (9) 3.264 -2,9%
Adjusted EBITDA 229 178 47 - 225 1,8%
% of sales 7,2% 7,5% 5,3% 6,9%
Adjusted operating income 175 144 30 (1) 173 1,2%
% of sales 5,5% 6,0% 3,4% 5,3%
1st half 2011 (***)
Pro-forma

PRYSMIAN l INTERIM DIRECTORS’ REPORT
. 16
UTILITIES
(*) The pro-forma figures are calculated by aggregating the Draka Group's results for the two-month pre-acquisition period (January-February)
with the consolidated figures.
The Utilities business area encompasses the Prysmian Group's Energy segment activities involving the
engineering, production and installation of cables and accessories for power transmission and distribution,
both at power stations and within primary and secondary distribution grids.
The following business lines can be identified within the Utilities business area:
Power transmission systems (High Voltage)
Prysmian Group engineers, produces and installs high and extra high voltage cables for power transmission
both from power stations and within the transmission and primary distribution grids. This business line mainly
focuses on providing turnkey solutions tailored to meet customer specifications. Products include cables
insulated with oil or fluid-impregnated paper for voltages up to 1,100 kV and extruded polymer insulated
cables for voltages below 500 kV. Products are highly customised and have a high technological content.
This business line provides its customers with installation and post-installation services, as well as grid
management and maintenance services, including grid performance monitoring, grid cable repair and
maintenance, and emergency services, such as reinstatement of service following damage.
Submarine power transmission and distribution systems (Submarine)
Prysmian Group engineers, produces and installs turnkey submarine power transmission and distribution
systems.
The Group has used specific submarine power transmission and distribution technology to develop cables
and accessories featuring its exclusive proprietary technology for installation at depths of up to 2,000 metres.
These cables offer different types of insulation: cables insulated with oil or fluid-impregnated paper for
transmission of up to 500 kV in direct and alternating current; extruded polymer insulated cables for
transmission of up to 400 kV in alternating current and up to 300 kV in direct current. Installation, engineering
and other services are of particular importance in this business, with the Group able to offer quality solutions
that satisfy the strictest international standards (SATS/IEEE, IEC, NEK). In particular, as far as installation is
(in millions of Euro)
1st half 2012 1st half 2011 (*)
Pro-forma
% change % organic
sales change
FY 2011 (*)
Pro-forma
Sales to third parties 1.073 1.125 -4,7% -2,4% 2.318
Adjusted EBITDA 117 135 264
% of sales 10,9% 12,0% 11,4%
Adjusted operating income 100 115 238
% of sales 9,3% 10,3% 10,3%
PRYSMIAN l INTERIM DIRECTORS’ REPORT
. 17
concerned, Prysmian Group can offer the services of the Giulio Verne, one of the largest and most
technologically advanced cable-laying vessels in the world.
Power distribution cables and systems (Power Distribution)
In the field of power distribution cables and systems, Prysmian Group produces medium voltage cables and
systems for the connection of industrial and/or residential buildings to primary distribution grids and low
voltage cables and systems for power distribution and the wiring of buildings. All Prysmian Group products in
this category comply with international standards regarding insulation, fire resistance, smoke emissions and
halogen levels.
Network accessories and components (Network Components)
Prysmian Group also produces accessories such as joints and terminations for low, medium, high and extra
high voltage cables, as well as accessories to connect cables with each other and with other network
equipment, suitable for industrial, construction or infrastructure applications and for power transmission and
distribution systems. Network components for high voltage applications, in particular, are designed to
customer specifications.
MARKET OVERVIEW
The markets in which the Prysmian Group's Utilities business area operates saw an amplification in the first
six months of 2012 of the signs of uncertainty already appearing in the second half of 2011. Demand
contracted on both the power distribution and generation markets throughout the half year, with differences
between the various geographical areas and competition becoming more accentuated in the second quarter.
Activities in the High Voltage market - traditionally highly international both in terms of demand and supply -
have been particularly affected by the global macroeconomic scenario and have generally slowed compared
with the prior year.
Faced with general uncertainty about future energy consumption and access to funding, the largest Utilities,
particularly in Europe and North America, have adopted a cautious approach to new investment projects.
Industry demand has therefore been limited to rationalisation and/or maintenance projects - to improve
efficiency and reduce energy generation costs - in Europe, and North and South America, or to the extension
or completion of major initiatives in the Middle East. Utilities in growing economies, like China and India,
have become more and more demanding on the price front, not only due to an increasing number of
competitors but also because of the need to limit financial exposure in the face of uncertain investment
returns.
As for the Submarine cables business line, demand has been at a stable high or slightly rising level, thanks
to investments by Utilities to build new offshore wind farms and commence major new interconnection
projects.
Although this trend has been particularly evident in parts of the world, such as North Europe, the Arab
Emirates and emerging countries in Southeast Asia, where demand for energy has grown over the past two

PRYSMIAN l INTERIM DIRECTORS’ REPORT
. 18
years, new initiatives have also emerged in areas most affected by the financial crisis, like the
Mediterranean, thanks to measures to stimulate the economy or to upgrade infrastructure.
Demand in the Power Distribution business line generally contracted throughout the half year, interrupting
the upward trend in volumes started last year.
Energy consumption in the major European countries declined in the past quarters, adversely affecting
demand by the major Utilities. The latter have either adopted an extremely cautious approach in view of the
difficulties in forecasting future growth, or have concentrated on restructuring to improve efficiency and
decrease costs of supply. The competitive environment in terms of price and mix has remained challenging
almost everywhere.
In contrast, markets in North America showed slight signs of a recovery during the half year, after a three-
year period during which operators had reduced work on grids to the bare minimum.
The Brazilian market also showed signs of vitality throughout the half year. Thanks to growth in domestic
energy consumption, demand was up on the prior year, even if accompanied by high prices competition.
The Network Components market can be broadly divided into products for high and extra high voltage
networks and products for medium and low voltage use.
As regards the former business line, demand has been affected, especially in the past quarter, by the
contraction in the High Voltage sector, linked to delays by the major Utilities in their investment projects.
Instead, demand has seemed to be stable for submarine accessories, as a direct consequence of the current
initiatives around the world.
The Utilities’ growing focus on price and the challenging competitive environment in the high voltage cables
market have partly spilled over into the Network Components market.
The market for medium and low voltage accessories has confirmed the positive trend in volumes starting last
year, in apparent contrast with the decrease in demand in the Power Distribution business line. The positive
trend reflects the fact that these products are normally used in ordinary maintenance of secondary
distribution grids, and are key factors in ensuring regular power supply.
FINANCIAL PERFORMANCE
Sales to third parties by the Utilities business area amounted to Euro 1,073 million in the first half of 2012,
compared with Euro 1,125 million pro-forma at 30 June 2011, posting a negative change of Euro 52 million (-
4.7%) due to the combined effect of the following main factors:
- negative change of Euro 25 million (-2.3%) in sales prices due to fluctuations in metal prices;
- negative change of Euro 16 million (-1.4%) due to failure to consolidate the sales of Ravin Cables
Limited (India) and Power Plus Cable CO LLC (Middle East – 49% consolidated) for the period 1 April –
30 June 2012;
- organic decrease in sales of Euro 28 million (-2.4%);
- positive exchange rate effects of Euro 17 million (+1.4%).

PRYSMIAN l INTERIM DIRECTORS’ REPORT
. 19
The organic decrease affected every business line, with the sole exception of Submarine, and was
concentrated in European and Asian Pacific markets, already displaying pressure on margins.
In contrast, Power Distribution sales reported a recovery in North and South America thanks to growing
demand.
Sales by the High Voltage business line were affected by the contraction in demand already evident in the
last quarter of 2011. The reduction in the Group's sales in this sector was concentrated in European
domestic markets and was not completely neutralised by initiatives on markets with growing demand for
energy infrastructure, such as China, Russia, the Middle East, Brazil and India.
The order book provides sales visibility for about one year and expanded further during the second quarter
thanks to new commercial initiatives focused on key clients (Enel, EDF and Tennet).
The Network Components business line reported increased sales of medium and low voltage accessories on
the major European domestic markets and in North America, thanks to demand generated by scheduled grid
maintenance work and to increased production capacity at the French plants, allowing faster response to
customer requests. Instead, the decline in demand in the High Voltage sector penalised sales of high voltage
accessories in the second quarter as well. Sales on the Chinese market, where sales price competition
remains high, were stable or slightly higher than last year, thanks to Prysmian's greater local
competitiveness.
Sales by the Submarine business line increased on the prior year, in line with forecasts for the major projects
acquired. The larger projects on which work was performed during the period were Messina II (Italy), and the
Borwin 1, Helwin 1 and Sylwin offshore wind farm projects in Germany.
The value of the Group's order book has increased further at the end of the second quarter, providing sales
visibility for a period of nearly 3 years. The six-month growth has been achieved thanks to work on short-
distance connections and/or repairs (Alaska, Penang), to the new Western Link contract in the UK and to
new contracts for offshore wind farm connections. In order to satisfy the latter contracts, investments have
been made to expand production capacity at the plant in Finland, already operational at the end of 2011, and
additional investments are planned at the Arco Felice plant in Italy.
The organic reduction in sales in the Utilities business area was entirely reflected in its entirety in adjusted
EBITDA, which went from Euro 135 million pro-forma at 30 June 2011 to Euro 117 million at 30 June 2012.
The reduction in this result has been partly accentuated by the higher proportion of sales in markets with
strong competitive pressures, mainly those for lower value-added products.

PRYSMIAN l INTERIM DIRECTORS’ REPORT
. 20
TRADE & INSTALLERS
(*) The pro-forma figures are calculated by aggregating the Draka Group's results for the two-month pre-acquisition period (January-February)
with the consolidated figures.
The Prysmian Group produces a comprehensive range of rigid and flexible low voltage cables for distributing
power to and within residential and non-residential buildings in compliance with international standards.
Product development and innovation particularly focuses on high performance cables, such as Fire-
Resistant cables and Low Smoke zero Halogen (LSOH) cables, which are used in all those applications
where safety must be guaranteed. In fact, in the event of fire, Fire-Resistant cables continue to operate and
Low Smoke zero Halogen cables have reduced emissions of toxic gas and smoke.
During the past year the range of products and services has been further extended and specialised with the
addition of cables for infrastructure such as airports, ports and railway stations.
Prysmian Group's customers for these products cover a wide spectrum, from international distributors and
buying syndicates to installers and wholesalers.
MARKET OVERVIEW
The reference markets have distinct geographical characteristics (despite international product standards)
both in terms of customer and supplier fragmentation and the range of items produced and sold.
Construction industry demand, already at a low level in 2011, has declined even more in Central and South
Europe during the first half of 2012, while remaining generally stable in North and East Europe.
During the second quarter, the persistent uncertainty about future scenarios for the construction market
prevailed over the positive effects of lower metal and commodity prices; as a result, the largest industry
players have continued to maintain minimum stocks and constant pressure on sales prices.
In Europe, countries like Spain and Italy have particularly suffered because their tough restrictions on bank
credit have adversely affected the property market.
(in millions of Euro)
1st half 2012 1st half 2011 (*)
Pro-forma
% change % organic
sales change
FY 2011 (*)
Pro-forma
Sales to third parties 1.110 1.159 -4,2% -0,4% 2.233
Adjusted EBITDA 42 41 73
% of sales 3,8% 3,5% 3,3%
Adjusted operating income 28 26 35
% of sales 2,5% 2,4% 1,6%

PRYSMIAN l INTERIM DIRECTORS’ REPORT
. 21
In contrast, markets in North America have confirmed a rising trend in demand for products serving
infrastructure projects.
Markets in South America have reported slightly higher volumes and prices, thanks to dynamism of both the
industrial and residential construction sectors.
FINANCIAL PERFORMANCE
Sales to third parties by the Trade & Installers business area amounted to Euro 1,110 million at 30 June
2012, compared with Euro 1,159 million pro-forma in the same period of 2011, posting a negative change of
Euro 49 million (-4.2%) due to the combined effect of the following main factors:
- negative change of Euro 49 million (-4.2%) in sales prices due to fluctuations in metal prices;
- organic decrease in sales of Euro 5 million (-0.4%), due to the recovery in volumes in North and
South America, which basically matched the general downturn in Europe's Mediterranean countries;
- positive exchange rate effects of Euro 5 million (+0.4%).
During the first half of 2012, Prysmian Group generally defended its market share on the major European
markets not only by pursuing a strategy focused on commercial relationships with top international
customers, but also by engaging in tactical actions to avoid losing sales opportunities.
Over the second quarter Prysmian's commercial strategy became increasingly selective, by giving priority to
a product mix focused on products for "safety of people and property" (Fire resistant/LSOH), at the expense
of those product segments more subject to price pressures.
This allowed the decline in profitability to be mitigated, in the presence of decreasing metal prices.
In North America Prysmian Group was able to benefit from the uptrend in demand after completing activities
to rationalise its Canadian production site in Prescott and make it more efficient.
Despite tough price competition in the industrial and commercial construction sectors, Prysmian Group’s
wide product range allowed it to increase its market share in South America, particularly in the second
quarter of 2012.
Thanks to the combined factors described above and the actions to improve industrial structure, adjusted
EBITDA increased by Euro 1 million (+2.4%) on the prior year equivalent period to Euro 42 million, despite
the negative trend by markets in Southern Europe.

PRYSMIAN l INTERIM DIRECTORS’ REPORT
. 22
INDUSTRIAL
(*) The pro-forma figures are calculated by aggregating the Draka Group's results for the two-month pre-acquisition period (January-February)with the consolidated figures.
The extensive product range, developed specifically for the Industrial market, stands out for the highly
customised nature of the solutions offered. These products serve a broad range of industries, including
Oil&Gas, Transport, Infrastructure, Mining and Renewable Energy. Prysmian Group offers integrated, high
value-added cabling solutions to its customers, who include world-leading industrial groups and OEMs
(Original Equipment Manufacturers), such as ABB, AKER, Alstom, SNCF, Petrobras, Peugeot-Citroen,
Renault and Siemens.
The continuous specialisation of products and solutions allows them to be customised for specific fields of
application, including use in the renewable energy sector, in the chemicals, transportation, aviation and
aerospace industries, as well as in elevators.
Prysmian Group offers solutions to the Oil&Gas industry for both upstream and downstream activities. Its
products therefore range from low and medium voltage power and instrumentation/control cables, to
multipurpose umbilical cables for transporting energy, telecommunications, fluids and chemicals when
connecting submarine sources and collectors to FPSO (Floating, Production, Storage and Offloading)
platforms.
In the transport sector, Prysmian Group cables are used in the construction of trains, ships and motor
vehicles; the principal applications for which its cables are used in the infrastructure sector are railways,
docks and airports. The product range also includes cables for the mining industry and for applications in the
renewable energy sector. Prysmian Group also supplies cables able to withstand high radiation
environments for use in military applications and nuclear power stations.
(in millions of Euro)
1st half 2012 1st half 2011 (*)
Pro-forma
% change % organic
sales change
FY 2011 (*)
Pro-forma
Sales to third parties 920 889 3,6% 4,9% 1.824
Adjusted EBITDA 70 50 116
% of sales 7,6% 5,6% 6,4%
Adjusted operating income 49 34 79
% of sales 5,4% 3,8% 4,3%
PRYSMIAN l INTERIM DIRECTORS’ REPORT
. 23
MARKET OVERVIEW
Markets for industrial cables were generally stable or growing in the first half of 2012, although there were
inconsistencies between the various business lines and large differences between the various geographical
areas.
A common trend in all sectors of this business area has been a greater fragmentation of demand, with
smaller scale but technologically more complex projects than in the past, accompanied by tougher demands
in terms of quality and after-sales service.
In fact, while some market sectors have reported stable or growing demand, such as Oil&Gas, port
infrastructure and renewable energy, other sectors, such as automotive, have experienced a decline in
volumes.
Demand in the Oil&Gas and port facilities sectors, which had already shown clear signs of recovery from the
second half of last year, grew even more, especially in high-growth regions of the world, like South America
and the Middle East.
In particular, the second quarter confirmed the signs of growth in demand in areas such as Southeast Asia
(Malaysia, Indonesia and Singapore) and Australia.
The market for oil industry products in Brazil, featuring large-scale projects, confirmed in the first two
quarters of 2012 the positive trend already seen in the second half of last year.
Within the infrastructure and general transport sector, the major European players have adopted a cautious
stance because of poor visibility as to when to resume investments and because of recent deficit-cutting
policies in the eurozone's major economies, while other areas of the world have enjoyed strong demand for
cables for port infrastructure projects.
Despite the restrictive financial policies adopted by the main European governments cutting special
incentives or making access to credit for wind projects more difficult, the renewable energy market has
appeared stable or slightly growing in Europe, while confirming an upward trend in other parts of the world.
This occurred thanks to the extension of regulatory measures and investments aimed at generating
environmentally sustainable energy in developing countries.
Restrictive financial policies have forced the ending of incentives given in the past two years in support of the
automotive industry, leading to a decline in automotive industry volumes in nearly every European country,
with the sole exception of Germany. Automotive industry demand in the rest of the world has nonetheless
remained largely stable compared with the second half of last year.
FINANCIAL PERFORMANCE
Sales to third parties by the Industrial business area amounted to Euro 920 million at 30 June 2012,
compared with Euro 889 million pro-forma in the same period of 2011. The increase of Euro 31 million
(+3.6%) is due to the following factors:

PRYSMIAN l INTERIM DIRECTORS’ REPORT
. 24
- organic sales growth of Euro 43 million (+4.9%), most of which achieved thanks to growth in volumes
in the Oil&Gas sector;
- positive exchange rate effects of Euro 25 million (+2.8%);
- negative change of Euro 37 million (-4.1%) in sales prices due to fluctuation in metal prices.
In Europe, Prysmian Group has focused its commercial efforts on the Oil&Gas industry with products
destined for the Norwegian market and for export to the major energy-producing nations, as well as on the
Renewables industry with cables for wind and solar applications. This has successfully made up for the
decline in volumes in the Automotive industry, particularly evident in the French market, and in the rail and
civil infrastructure sectors.
Prysmian Group has pursued opportunities arising from infrastructure development in the Middle East, a
market traditionally served by its European businesses.
The strategy of technological specialisation of the solutions offered has boosted sales on the elevator market
in North America, of which the WTC project is the prime example.
Similarly, consolidation of the Group's commercial structure in North America has made it possible to exploit
opportunities in the US onshore drilling sector, particularly in the second quarter.
Sales of flexible pipes, manufactured at the new Vila Velha plant and destined for markets in South America,
came to in excess of Euro 10 million in the first half of 2012, with an increase in the order book thanks to
growing demand from Petrobras.
The Asia-Pacific region has offered the most attractive growth opportunities for the Group, thanks to
recovery of market share in Australia and actions to penetrate the Renewables market in China.
Adjusted EBITDA came to Euro 70 million at 30 June 2012, reporting an increase of Euro 20 million on the
pro-forma figure for the first half of 2011 due to a moderate recovery in demand in various parts of the world,
particularly by the Oil&Gas sector, and to the development of the elevator cables business in North America.
PRYSMIAN l INTERIM DIRECTORS’ REPORT
. 25
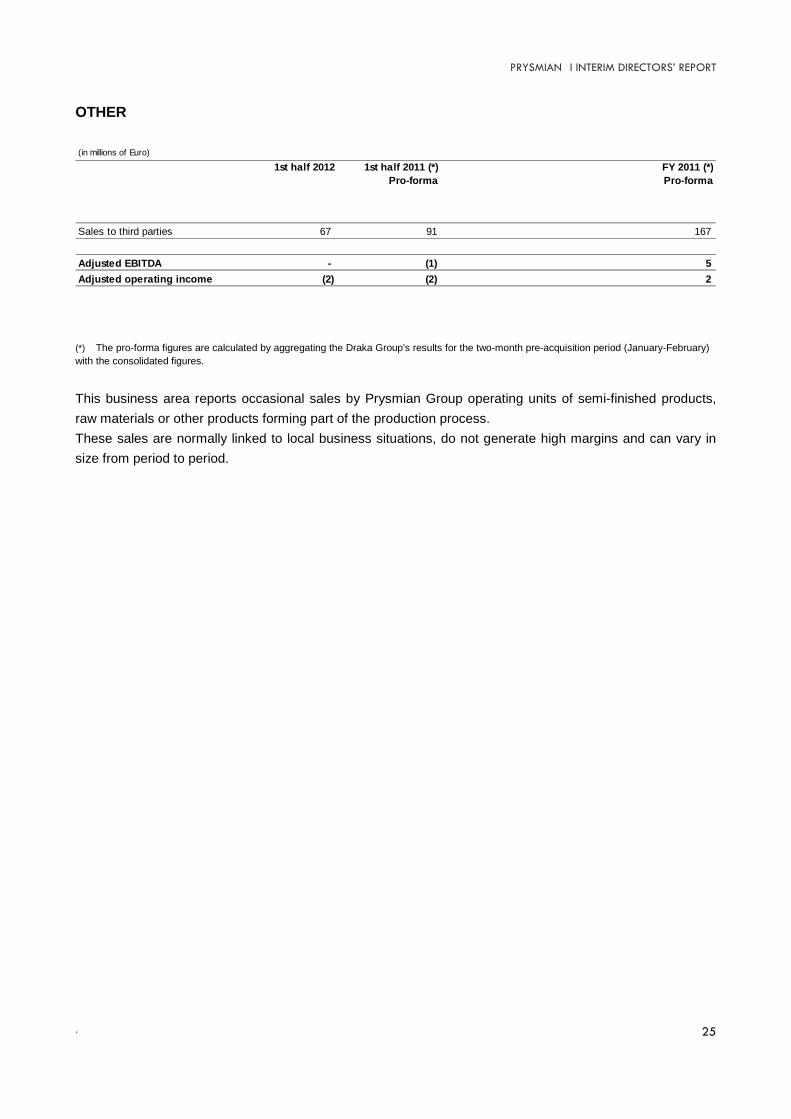
OTHER
(*) The pro-forma figures are calculated by aggregating the Draka Group's results for the two-month pre-acquisition period (January-February)
with the consolidated figures.
This business area reports occasional sales by Prysmian Group operating units of semi-finished products,
raw materials or other products forming part of the production process.
These sales are normally linked to local business situations, do not generate high margins and can vary in
size from period to period.
(in millions of Euro)
1st half 2012 1st half 2011 (*)
Pro-forma
FY 2011 (*)
Pro-forma
Sales to third parties 67 91 167
Adjusted EBITDA - (1) 5
Adjusted operating income (2) (2) 2
PRYSMIAN l INTERIM DIRECTORS’ REPORT
. 26
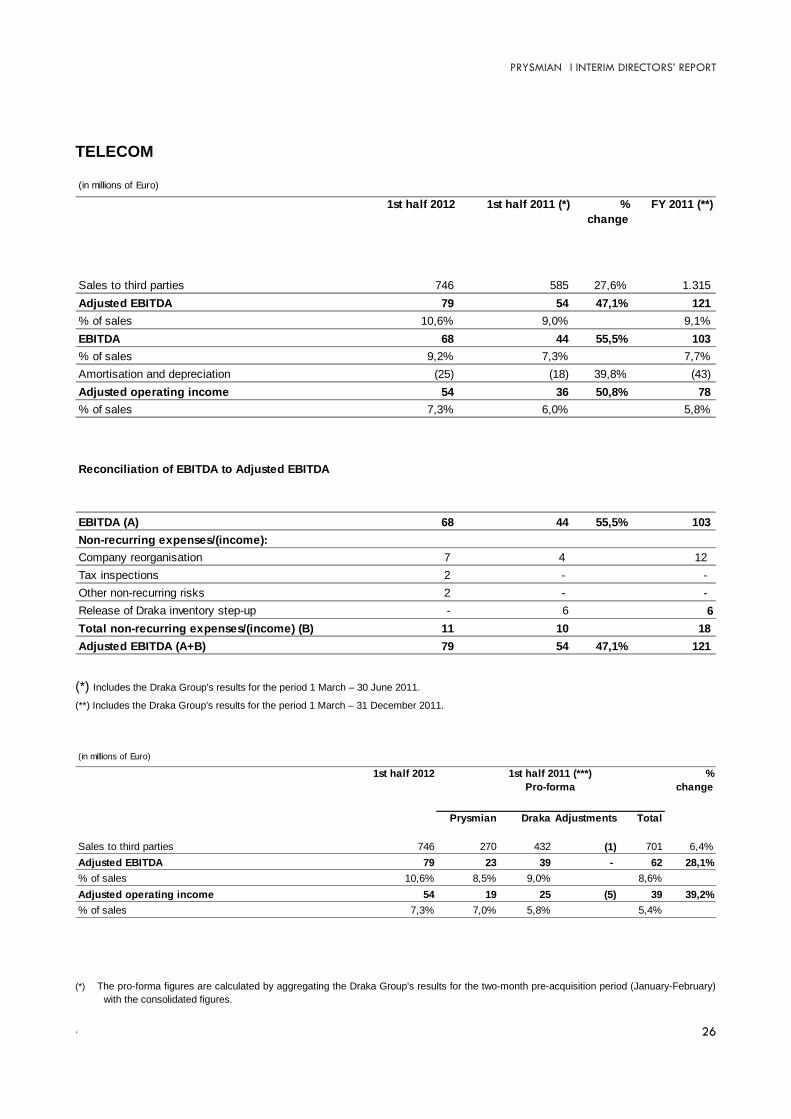
TELECOM
(*) Includes the Draka Group's results for the period 1 March – 30 June 2011.
(**) Includes the Draka Group's results for the period 1 March – 31 December 2011.
(*) The pro-forma figures are calculated by aggregating the Draka Group's results for the two-month pre-acquisition period (January-February)
with the consolidated figures.
(in millions of Euro)
1st half 2012 1st half 2011 (*) %
change
FY 2011 (**)
Sales to third parties 746 585 27,6% 1.315
Adjusted EBITDA 79 54 47,1% 121
% of sales 10,6% 9,0% 9,1%
EBITDA 68 44 55,5% 103
% of sales 9,2% 7,3% 7,7%
Amortisation and depreciation (25) (18) 39,8% (43)
Adjusted operating income 54 36 50,8% 78
% of sales 7,3% 6,0% 5,8%
Reconciliation of EBITDA to Adjusted EBITDA
EBITDA (A) 68 44 55,5% 103
Non-recurring expenses/(income):
Company reorganisation 7 4 12
Tax inspections 2 - -
Other non-recurring risks 2 - -
Release of Draka inventory step-up - 6 6
Total non-recurring expenses/(income) (B) 11 10 18
Adjusted EBITDA (A+B) 79 54 47,1% 121
(in millions of Euro)
1st half 2012 %
change
Prysmian Draka Adjustments Total
Sales to third parties 746 270 432 (1) 701 6,4%
Adjusted EBITDA 79 23 39 - 62 28,1%
% of sales 10,6% 8,5% 9,0% 8,6%
Adjusted operating income 54 19 25 (5) 39 39,2%
% of sales 7,3% 7,0% 5,8% 5,4%
1st half 2011 (***)
Pro-forma

PRYSMIAN l INTERIM DIRECTORS’ REPORT
. 27
As partner to the world's leading telecoms operators, Prysmian Group produces and sells a comprehensive
range of optical fibre and copper cables, suitable for all types of application for voice/video/data
transmission, as well as connectivity components and accessories.
Optical fibre
Prysmian Group is a leading manufacturer of the fundamental component of all optical cables - namely
optical fibre. With its experience in fibre production dating back to 1982, Prysmian Group is able to utilise all
three of the major production technologies currently available: OVD (Outside Vapour Deposition), MCVD
(Modified Chemical Vapour Deposition) and VAD (Vapour Axial Deposition). The Group produces a
complete range of fibres including long distance, metro ring, low water peak, and reduced diameter fibre, and
the latest addition to the fibre family - bend insensitive fibres. Fibres are produced to the highest standards of
quality control and in strict compliance with ITU international standards. With a centre of fibre excellence in
Battipaglia, Italy, and a total of three manufacturing locations around the world, Prysmian Group is the global
leader in this highly specialised technology.
Optical cables
Optical fibres are used in the production of a vast range of optical cables, from single fibre constructions
through to cables containing 1,728 fibres. Optical cables are now used in a variety of demanding
environments. They can be pulled (or blown) into ducts, buried directly underground or suspended on
overhead systems such as telegraph poles or electricity pylons. Cables are also installed in road and rail
tunnels and within various buildings where they must satisfy specific fire-resistant requirements.
Cables can also be installed in gas and drainage networks. Prysmian Group has developed specific cable
designs to satisfy all these requirements, using technologies such as Optical Ground Wire (OPGW), Rapier
(easy break-out), Zephyr (mini blown cable), Airbag (dielectric direct buried) and many more.
Copper cables
Prysmian Group produces a wide range of copper cables for underground and overhead cabling solutions
and for residential and non-residential buildings. Cables are designed for high transmission, low interference
and electromagnetic compatibility and in accordance with the main international standards and
specifications. Prysmian Group is able to supply cables with specific performance characteristics such as
zero halogen emissions, low emission of toxic fumes and gases and fire retardant. The Group's product
portfolio includes a comprehensive range of copper cables with different capacities (from 2 to 2,400 pairs)
including xDSL cables for broadband access.
Accessories
Prysmian Group supplies a complete range of passive connectivity products under the OAsys trademark.
These products satisfy every cable management need whatever the network type, including overhead and
underground installation, as well as cabling in central offices, exchanges or customer premises.
FTTH (Fibre To The Home)
Growing customer demand for higher bandwidth has seen the deployment of optical fibre moving closer to
the end user with the ultimate goal being Fibre To The Home (FTTH). Prysmian Group is extremely active in
this rapidly growing sector of the market where its approach is based on combining existing technology -
such as the Sirocco Blown Fibre System - with innovative new solutions such as Quickdraw pre-
connectorised cable and the new VerticasaTM system, which provides an efficient way of deploying fibres in
PRYSMIAN l INTERIM DIRECTORS’ REPORT
. 28
high-rise buildings and multi-dwelling units. Many of the cables used in FTTH systems feature Prysmian
Group's proprietary bend insensitive CasaLightTM optical fibre which has been specially developed for this
application.
Multimedia and Specials
The integration of Draka's Telecom segment within the Prysmian Group allows it to offer the market a more
comprehensive portfolio of solutions thanks to the more specialised nature of its products for
communications, in particular coaxial data transmission cables and single mode and multimode optical fibre
using proprietary technology.
In addition, it is able to offer a full range of connectivity components as well as network design, engineering
and implementation services.
MARKET OVERVIEW
The market for optical fibre cables is a global one. Forecasts at the start of the year predicted that the size of
the global market would have grown in 2012 although with large regional differences. In fact, the first half
saw demand grow in fast-developing markets (China) and in those with high communication infrastructure
needs (India, Brazil, Turkey), while markets in both North America and Europe were basically stable.
The Access/Broadband/FTTx market was stable in the first half of 2012, with growth driven by the
development of optical fibre communication infrastructure, although the low maturity of these products
implies different evolution in demand by geographical area.
The copper cables market is experiencing a slowdown not only because of the economic downturn in the
past two years, which has driven some major operators to revise their larger investment projects, but also
because of product maturity. The downturn in demand was evident during the first half of 2012 with soaring
demand for internet access leading major operators to opt to renew their networks using optical fibre, rather
than perform maintenance or upgrade work on existing networks. xDSL cables have provided an opportunity
for product technological diversification in a market that has not otherwise experienced significant changes in
recent years.
FINANCIAL PERFORMANCE
At the end of the first half of 2012 sales to third parties by the Telecom segment amounted to Euro 746
million, compared with Euro 585 million at 30 June 2011, posting an increase of Euro 161 million (+27.6%).
Compared with the pro-forma figure of Euro 701 million, Telecom sales to third parties posted an increase
of Euro 45 million (+6.4%).
This change is attributable to the following factors:
- positive exchange rate effects of Euro 22 million (+3.3%);
- positive change of Euro 16 million (+2.3%) for the line-by-line consolidation of Telcon Fios e Cabos
para Telecomunicaçoes S.A. starting from the second quarter;
- organic sales growth of Euro 12 million (+1.7%), thanks to volume growth for optical fibre cables;

PRYSMIAN l INTERIM DIRECTORS’ REPORT
. 29
- negative change of Euro 5 million (-0.9%) in sales prices due to fluctuation in metal prices.
The organic sales growth primarily reflects an increase in optical fibre cable volumes, linked to the positive
evolution in demand, driven not only by large-scale projects such as those started for B.T. (United Kingdom),
NBN (Australia) and Telefonica (Brazil), but also by the recovery in demand by the US market and by
emerging markets and channels, such as Eastern Europe, South America and India.
Adjusted EBITDA came to Euro 79 million at 30 June 2012, reporting an increase of Euro 25 million
(+47.1%) on the corresponding figure of Euro 54 million at 30 June 2011, and an increase of Euro 17 million
(+28.1%) on the 2011 pro-forma figure.

PRYSMIAN l INTERIM DIRECTORS’ REPORT
. 30
(in millions of Euro)
30 June 2012 30 June 2011 Change 31 December 2011
Net fixed assets 2,264 2,201 63 2,255
Net working capital 934 865 69 552
Provisions (369) (357) (12) (371)
Net capital employed 2,829 2,709 120 2,436
Employee benefit obligations 308 234 74 268
Total equity 1,125 1,097 28 1,104
of which attributable to non-controlling interests 52 67 (15) 62
Net financial position 1,396 1,378 18 1,064
Total equity and sources of funds 2,829 2,709 120 2,436
GROUP STATEMENT OF FINANCIAL POSITION
RECLASSIFIED STATEMENT OF FINANCIAL POSITION
Net fixed assets amounted to Euro 2,264 million at 30 June 2012, compared with Euro 2,255 million at 31
December 2011, having increased by Euro 9 million mainly due to the combined effect of the following
factors:
- Euro 65 million in investments in property, plant and equipment and intangible assets;
- Euro 2 million in retirements and disposals of property, plant and equipment;
- Euro 80 million in depreciation, amortisation and impairment charges for the period;
- positive changes for the line-by-line consolidation of Telcon Fios e Cabos para Telecomunicaçoes S.A.
as from the second quarter, amounting to Euro 21 million (including Euro 7 million in goodwill arising
from the acquisition).
Net working capital of Euro 934 million at 30 June 2012, exceeded the corresponding figure at 31
December 2011 (Euro 552 million) by Euro 382 million (remaining the same even when the fair value
change in derivatives is excluded), reflecting the following main factors:
- increase linked to the greater seasonality of sales in the quarter just ended and those expected in the
third quarter, particularly in relation to stock levels held at plants;
- increase linked to the start of industrial restructuring projects and consequent preparation of
inventories to ensure the expected level of customer service;
- significant growth in working capital committed in long-term High Voltage and Submarine projects,
linked to their state of completion relative to the agreed delivery deadlines;
- increase of Euro 12 million arising from the line-by-line consolidation of Telcon Fios e Cabos para
Telecomunicaçoes S.A. starting from the second quarter;
- increase of Euro 5 million linked to exchange rate differences.
The net financial position of Euro 1,396 million at 30 June 2012 has increased by Euro 332 million since 31
December 2011 (Euro 1,064 million), mainly reflecting the following factors:

PRYSMIAN l INTERIM DIRECTORS’ REPORT
. 31
- positive cash flows from operating activities (before of the net working capital changes) of Euro 258
million;
- negative impact of Euro 359 million from changes in working capital;
- payment of Euro 32 million in taxes;
- net operating investments of Euro 63 million;
- receipt of Euro 6 million in dividends;
- purchase of the remaining Draka shares under the squeeze-out procedure for Euro 9 million;
- cash outlays of Euro 26 million for acquisitions;
- payment of Euro 76 million in net finance costs;
- distribution of Euro 45 million in dividends.
PRYSMIAN l INTERIM DIRECTORS’ REPORT
. 32
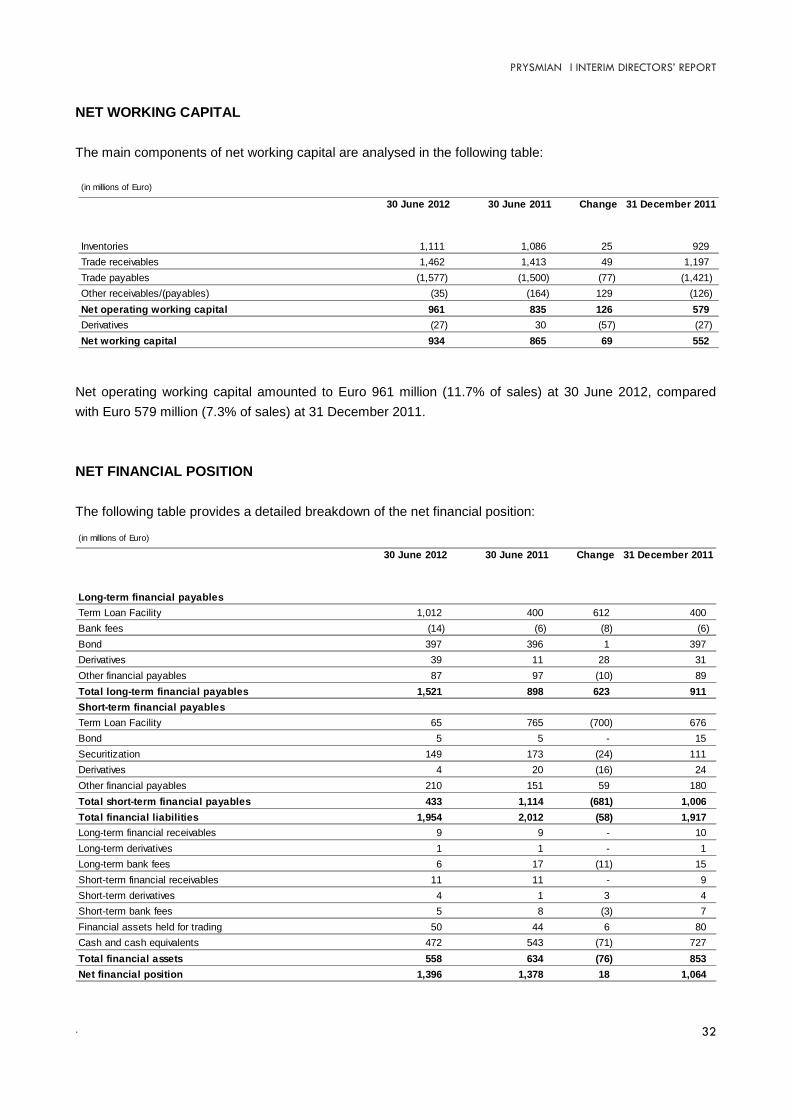
(in millions of Euro)
30 June 2012 30 June 2011 Change 31 December 2011
Inventories 1,111 1,086 25 929
Trade receivables 1,462 1,413 49 1,197
Trade payables (1,577) (1,500) (77) (1,421)
Other receivables/(payables) (35) (164) 129 (126)
Net operating working capital 961 835 126 579
Derivatives (27) 30 (57) (27)
Net working capital 934 865 69 552
(in millions of Euro)
30 June 2012 30 June 2011 Change 31 December 2011
Long-term financial payables
Term Loan Facility 1,012 400 612 400
Bank fees (14) (6) (8) (6)
Bond 397 396 1 397
Derivatives 39 11 28 31
Other financial payables 87 97 (10) 89
Total long-term financial payables 1,521 898 623 911
Short-term financial payables
Term Loan Facility 65 765 (700) 676
Bond 5 5 - 15
Securitization 149 173 (24) 111
Derivatives 4 20 (16) 24
Other financial payables 210 151 59 180
Total short-term financial payables 433 1,114 (681) 1,006
Total financial liabilities 1,954 2,012 (58) 1,917
Long-term financial receivables 9 9 - 10
Long-term derivatives 1 1 - 1
Long-term bank fees 6 17 (11) 15
Short-term financial receivables 11 11 - 9
Short-term derivatives 4 1 3 4
Short-term bank fees 5 8 (3) 7
Financial assets held for trading 50 44 6 80
Cash and cash equivalents 472 543 (71) 727
Total financial assets 558 634 (76) 853
Net financial position 1,396 1,378 18 1,064
NET WORKING CAPITAL
The main components of net working capital are analysed in the following table:
Net operating working capital amounted to Euro 961 million (11.7% of sales) at 30 June 2012, compared
with Euro 579 million (7.3% of sales) at 31 December 2011.
NET FINANCIAL POSITION
The following table provides a detailed breakdown of the net financial position:

PRYSMIAN l INTERIM DIRECTORS’ REPORT
. 33
(in millions of Euro)
1st half 2012 1st half 2011 Change FY 2011
EBITDA 266 26 240 269
Changes in provisions (including employee benefit obligations) (7) 177 (184) 200
Inventory step-up - 14 (14) 14
(Gains)/losses on disposal of property, plant and equipment
and intangible assets (1) (1) - (2)
Net cash flow provided by operating activities (before
changes in net working capital) 258 216 42 481
Changes in net working capital (359) (107) (252) 183
Taxes paid (32) (37) 5 (97)
Net cash flow provided/(used) by operating activities (133) 72 (205) 567
Acquisitions (35) (419) 384 (419)
Net cash flow used in operational investing activities (63) (46) (17) (145)
Net cash flow provided by financial investing activities (1) 6 4 2 4
Free cash flow (unlevered) (225) (389) 164 7
Net finance costs (76) (89) 13 (130)
Free cash flow (levered) (301) (478) 177 (123)
Increases in share capital and other changes in equity - 1 (1) 1
Dividend distribution (45) (36) (9) (37)
Net cash flow provided/(used) in the period (346) (513) 167 (159)
Opening net financial position (1,064) (459) (605) (459)
Net cash flow provided/(used) in the period (346) (513) 167 (159)
Other changes 14 (406) 420 (446)
Closing net financial position (1,396) (1,378) (18) (1,064)
STATEMENT OF CASH FLOWS
(1) This does not include cash flow relating to "Financial assets held for trading" and non-instrumental "Available-for-sale financialassets", classified in the net financial position.
Net cash flow provided by operating activities (before changes in net working capital) amounted to Euro 258
million at the end of the first half of 2012.
This cash flow was negatively impacted by the increase of Euro 359 million in net working capital described
earlier. Therefore, after deducting Euro 32 million in tax payments, net cash flow from operating activities in
the period was a negative Euro 133 million.
Net cash flow used for acquisitions came to Euro 35 million, of which Euro 9 million relates to the purchase
of the remaining Draka shares under the squeeze-out procedure, Euro 25 million for the purchase of sales
in Telcon Fios e Cabos para Telecomunicaçoes S.A. and Draktel Optical Fibre S.A., and the remainder for
the Neva Cables Ltd share purchase.
Net operating investments in the first half of 2012 amounted to Euro 63 million and mainly refer to
expansion of production capacity for high voltage cables in Russia, China and France, for submarine cables
in Italy and Finland, to the investment in the Telecom segment in Australia in connection with the long-term
NBN project and lastly to the increase in optical fibre production capacity in Brazil.
Dividends paid out in the first half of 2012 amounted to Euro 45 million.
PRYSMIAN l INTERIM DIRECTORS’ REPORT
. 34
ALTERNATIVE PERFORMANCE INDICATORS
In addition to the standard financial reporting formats and indicators required under IFRS, this document
contains a number of reclassified statements and alternative performance indicators. The purpose is to help
users better evaluate the Group's economic and financial performance. However, these statements and
indicators should not be treated as a substitute for the standard ones required by IFRS.
The alternative indicators used for reviewing the income statement include:
• Adjusted net profit/(loss): net profit/(loss) before non-recurring income and expenses, the fair value
change in metal derivatives and in other fair value items, the effect of currency and interest rate derivatives,
exchange rate differences and the related tax effects;
• Adjusted operating income: operating income before non-recurring income and expenses and the fair
value change in metal derivatives and in other fair value items, as reported in the consolidated income
statement. The purpose of this indicator is to present the Group's operating profitability without the effects of
events considered to be outside its recurring operations;
• EBITDA: operating income before the fair value change in metal price derivatives and in other fair value
items and before amortisation, depreciation and impairment. The purpose of this indicator is to present the
Group's operating profitability before the main non-monetary items;
• Adjusted EBITDA: EBITDA as defined above calculated before non-recurring income and expenses, as
reported in the consolidated income statement. The purpose of this indicator is to present the Group's
operating profitability before the main non-monetary items, without the effects of events considered to be
outside the Group's recurring operations;
• Organic growth: change in sales calculated net of changes in the scope of consolidation, changes in metal
prices and the effect of exchange rates;
• ROCE: the ratio between adjusted operating profit/(loss) and the sum of equity, net financial position and
employee benefit obligations.
The alternative indicators used for reviewing the reclassified statement of financial position include:
• Net fixed assets: sum of the following items contained in the statement of financial position:
- Intangible assets
- Property, plant and equipment
- Investments in associates
- Available-for-sale financial assets, net of non-current securities classified as long-term financial
receivables in the net financial position
• Net working capital: sum of the following items contained in the statement of financial position:
- Inventories
- Trade receivables
- Trade payables
- Other non-current receivables and payables, net of long-term financial receivables classified in the
net financial position
- Other current receivables and payables, net of short-term financial receivables classified in the net
financial position
- Derivatives net of financial instruments for hedging interest rate and currency risks relating to financial
transactions, classified in the net financial position

PRYSMIAN l INTERIM DIRECTORS’ REPORT
. 35
- Current tax payables
• Net operating working capital: sum of the following items contained in the statement of financial position:
- Inventories
- Trade receivables
- Trade payables
- Other non-current receivables and payables, net of long-term financial receivables classified in the
net financial position
- Other current receivables and payables, net of short-term financial receivables classified in the net
financial position
- Current tax payables
• Provisions: sum of the following items contained in the statement of financial position:
- Provisions for risks and charges – current portion
- Provisions for risks and charges – non-current portion
- Provisions for deferred tax liabilities
- Deferred tax assets
• Net capital employed: sum of Net fixed assets, Net working capital and Provisions.
• Employee benefit obligations and Total equity: these indicators correspond to Employee benefit
obligations and Total equity reported in the statement of financial position.
• Net financial position: sum of the following items:
- Borrowings from banks and other lenders - non-current portion
- Borrowings from banks and other lenders - current portion
- Derivatives for financial transactions recorded as Non-current derivatives and classified under Long-term
financial receivables
- Derivatives for financial transactions recorded as Current derivatives and classified under Short-term
financial receivables
- Derivatives for financial transactions recorded as Non-current derivatives and classified under Long-term
financial payables
- Derivatives for financial transactions recorded as Current derivatives and classified under Short-term
financial payables
- Medium/long-term financial receivables recorded in Other non-current receivables
- Bank fees on loans recorded in Other non-current receivables
- Short-term financial receivables recorded in Other current receivables
- Bank fees on loans recorded in Other current receivables
- Short/long-term available-for-sale financial assets, not instrumental to the Group's activities
- Financial assets held for trading
- Cash and cash equivalents

PRYSMIAN l INTERIM DIRECTORS’ REPORT
. 36
(in millions of Euro)
Note Partial amounts
from financial
statements
Total amounts
from financial
statements
Partial amounts
from financial
statements
Total amounts
from financial
statements
Net fixed assets
Property, plant and equipment 1,547 1,539
Intangible assets 619 618
Investments in associates 91 87
Available-for-sale financial assets 5 6
Assets held for sale 2 5
Total net fixed assets A 2,264 2,255
Net working capital
Inventories B 1,111 929
Trade receivables C 1,462 1,197
Trade payables D (1,577) (1,421)
Other receivables/payables - net E (35) (126)
of which:
Other receivables - non-current 2 28 27
Tax receivables 2 17 13
Receivables from employees 2 2 1
Others 2 9 13
Other receivables - current 2 610 500
Tax receivables 2 92 124
Receivables from employees and
pension funds 2 6 4
Advances 2 24 14
Others 2 142 139
Construction contracts 2 346 219
Other payables - non-current 10 (30) (32)
Tax and social security payables 10 (15) (16)
Accrued expenses 10 (3) -
Others 10 (12) (16)
Other payables - current 10 (632) (571)
Tax and social security payables 10 (93) (95)
Advances 10 (187) (132)
Payables to employees 10 (61) (65)
Accrued expenses 10 (118) (131)
Others 10 (173) (148)
Current tax payables (11) (50)
Total operating working capital F=B+C+D+E 961 579
Derivatives G (27) (27)
of which:
Forward currency contracts on
commercial transactions (cash flow
hedges) - non-current 4 - (5)
Forward currency contracts on
commercial transactions (cash flow
hedges) - current 4 (10) (2)
Forward currency contracts on
commercial transactions - current 4 - (2)
Forward currency contracts on
commercial transactions - non-current 4 - 1
Metal derivatives - non-current 4 (7) -
Metal derivatives - current 4 (10) (19)
Total net working capital H=F+G 934 552
30 June 2012 31 December 2011
Reconciliation between the Reclassified Statement of Financial Position presented in the Directors' Report and
the Statement of Financial Position contained in the Half-Year Condensed Consolidated Financial Statements at
30 June 2012

PRYSMIAN l INTERIM DIRECTORS’ REPORT
. 37
(in millions of Euro)
Note Partial amounts
from financial
statements
Total amounts
from financial
statements
Partial amounts
from financial
statements
Total amounts
from financial
statements
Provisions for risks and charges - non-current (64) (67)
Provisions for risks and charges - current (294) (295)
Deferred tax assets 99 97
Deferred tax liabilities (110) (106)
Total provisions I (369) (371)
Net capital employed L=A+H+I 2,829 2,436
Employee benefit obligations M 308 268
Total equity N 1,125 1,104
Equity attributable to non-controlling
interests 52 62
Net financial position
Total long-term financial payables O 1,521 911
Term Loan Facility 9 1,012 400
Bank fees 9 (14) (6)
Bond 9 397 397
Derivatives 39 31
of which:
Forward currency contracts on financial
transactions 4 6 4
Interest rate swaps 4 33 27
Other payables 87 89
of which:
Finance lease obligations 9 13 14
Other financial payables 9 74 75
Short-term financial payables P 433 1,006
Term Loan Facility 9 66 676
Bank fees 9 (1) -
Bond 9 5 15
Securitization 9 149 111
Derivatives 4 24
of which:
Interest rate swaps 4 - 2
Forward currency contracts on financial
transactions 4 4 22
Other payables 210 180
of which:
Finance lease obligations 9 2 3
Other financial payables 9 208 177
Total financial liabilities Q=O+P 1,954 1,917
Long-term financial receivables R 2 (9) (10)
Long-term derivatives R (1) (1)
of which:
Interest rate swaps (non-current) 4 - -
Forward currency contracts on financial
transactions (non-current) 4 (1) (1)
Long-term bank fees R 2 (6) (15)
Short-term financial receivables R 2 (11) (9)
Short-term derivatives R (4) (4)
of which:
Forward currency contracts on financial
transactions (current) 4 (4) (4)
Short-term bank fees R 2 (5) (7)
Available-for-sale financial assets
(current) S - -
Financial assets held for trading T (50) (80)
Cash and cash equivalents U (472) (727)
Total financial assets V=R+S+T+U (558) (853)
Total net financial position W=Q+V 1,396 1,064
Total equity and sources of funds Z=M+N+W 2,829 2,436
30 June 2012 31 December 2011
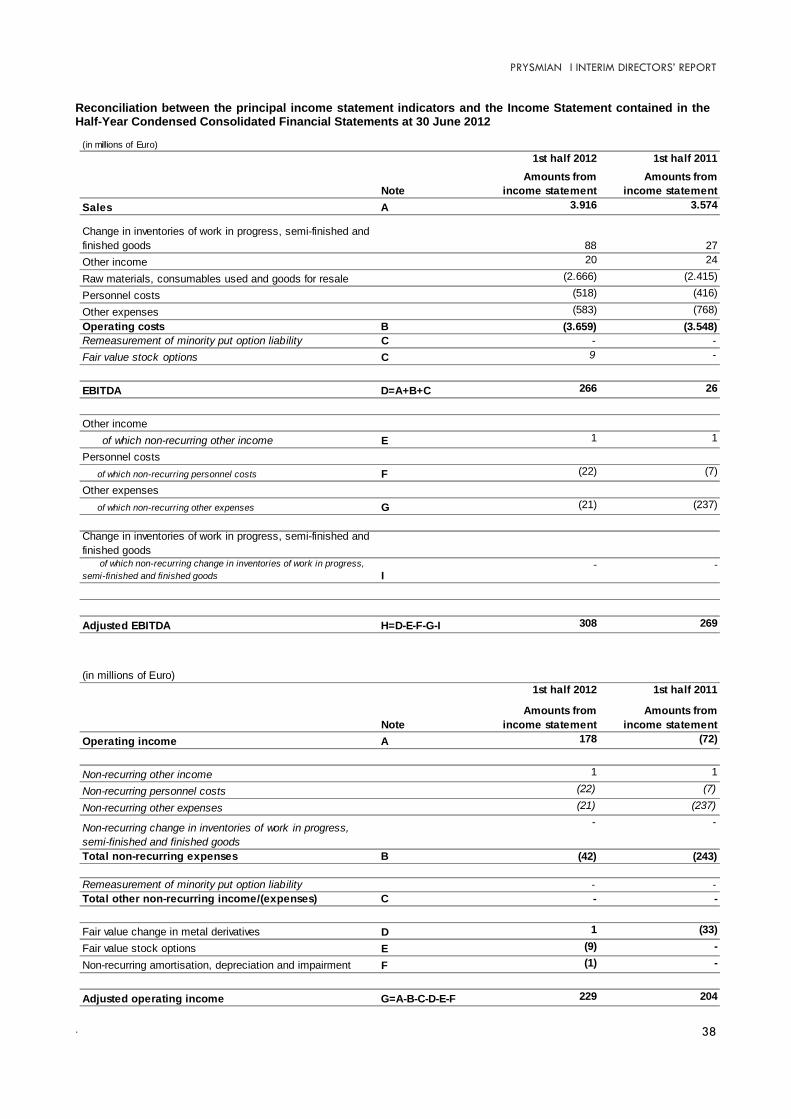
PRYSMIAN l INTERIM DIRECTORS’ REPORT
. 38
Reconciliation between the principal income statement indicators and the Income Statement contained in theHalf-Year Condensed Consolidated Financial Statements at 30 June 2012
(in millions of Euro)
1st half 2012 1st half 2011
Note
Amounts from
income statement
Amounts from
income statement
Sales A 3.916 3.574
Change in inventories of work in progress, semi-finished and
finished goods 88 27
Other income 20 24
Raw materials, consumables used and goods for resale (2.666) (2.415)
Personnel costs (518) (416)
Other expenses (583) (768)
Operating costs B (3.659) (3.548)
Remeasurement of minority put option liability C - -
Fair value stock options C 9 -
EBITDA D=A+B+C 266 26
Other income
of which non-recurring other income E 1 1
Personnel costs
of which non-recurring personnel costs F (22) (7)
Other expenses
of which non-recurring other expenses G (21) (237)
Change in inventories of work in progress, semi-finished and
finished goodsof which non-recurring change in inventories of work in progress,
semi-finished and finished goods I- -
Adjusted EBITDA H=D-E-F-G-I 308 269
(in millions of Euro)
1st half 2012 1st half 2011
Note
Amounts from
income statement
Amounts from
income statement
Operating income A 178 (72)
Non-recurring other income 1 1
Non-recurring personnel costs (22) (7)
Non-recurring other expenses (21) (237)
Non-recurring change in inventories of work in progress,
semi-finished and finished goods
- -
Total non-recurring expenses B (42) (243)
Remeasurement of minority put option liability - -
Total other non-recurring income/(expenses) C - -
Fair value change in metal derivatives D 1 (33)
Fair value stock options E (9) -
Non-recurring amortisation, depreciation and impairment F (1) -
Adjusted operating income G=A-B-C-D-E-F 229 204

PRYSMIAN l INTERIM DIRECTORS’ REPORT
. 39
SUBSEQUENT EVENTS
On 26 July 2012, the securitization programme , due to end on 31 July 2012, was extended for another 12
months and the amount of the related credit facility reduced to Euro 150 million, consistent with the amount
of trade receivables eligible for securitization under the agreed contractual terms.
BUSINESS OUTLOOK
The macroeconomic environment in the first half of 2011 had confirmed the initial signs of recovery already
seen in 2010, albeit with very low growth rates at levels still well below those before the 2008 financial crisis.
However, the second half of 2011 and first half of the current year began to be affected by growing concerns
about Eurozone and US debt sustainability, leading to a sharp deterioration in business confidence and a
gradual slowing of industrial output and demand. In such a context, the Group expects that 2012 will see a
slight contraction in demand for medium voltage power distribution cables, for building wires and for those
products in the Industrial sector most exposed to cyclical trends. Instead, positive developments in demand
are confirmed for the high value-added businesses of submarine power transmission, renewable energy,
offshore Oil&Gas and fibre optic cables for major telecom operators.
Despite the gradual deterioration in macroeconomic conditions, the results achieved in the first six months,
combined with the size of the current order book, lead the Group to expect an increase in adjusted EBITDA
for FY 2012 in the range of Euro 600 million – Euro 650 million (compared with Euro 568 million in FY 2011),
with the upper end of the range thought likely to be achieved (Euro 625 million - Euro 650 million). This
range is related to development of demand on the reference markets in the second half of the year and
reflects the consolidation of Draka for the full year (in 2011 Draka was consolidated from 1 March). The
expected increase in profitability is essentially due to synergies resulting from integration with Draka, as well
as growth in higher value-added business areas.
In fact, during 2012 the Prysmian Group will continue to integrate the activities of Draka in order to optimise
and rationalise the new Group's organisational and production structure with the goal of further strengthening
its presence in all areas of business and of achieving the projected cost synergies.
.
PRYSMIAN l INTERIM DIRECTORS’ REPORT
. 40
FORESEEABLE RISKS IN 2012*
The Prysmian Group is exposed in the normal conduct of its business to a number of financial and non-
financial risk factors which, if they should arise, could have an impact on the Group's results of operations
and statement of financial position. Given the results of operations in the first six months of the year and the
specific macroeconomic context, the principal risk factors currently foreseeable for the next six months of
2012 are described below according to their nature.
Risks associated with market trends and competitive pressure
Some of the markets for the Group's products, mainly relating to the Trade & Installers business area, the
Power Distribution business line and certain applications in the Industrial business area, are subject to
cyclical fluctuations in demand and are influenced by overall trends in GDP growth.
Demand for products in the energy cables segment is also influenced by the spending plans of companies in
the Utilities business area and by overall energy consumption, as well as in part by construction sector
trends, while demand for products in the telecom cables segment is heavily influenced by the spending plans
of telecom operators.
The first half of 2012 reported basically stable overall volumes compared with the prior year equivalent
period, therefore keeping plant utilisation still well below pre-crisis levels, with resulting competitive pressure
on sales prices and, consequently, on margins.
The diversified nature of the Group's markets and products reduces its exposure to cyclical trends in demand
on certain markets, but it cannot be excluded that demand will not contract during upcoming quarters for the
above businesses, which could have a significant impact on the Group's activities, results of operations and
statement of financial position. Competitive pressure due to lower demand in the Trade & Installers business
area and in the Power Distribution business line, although to a lesser extent, could translate into additional
price pressure because many of the products offered by the Group in these sectors are made in compliance
with specific industrial standards and are largely interchangeable with those offered by its major competitors,
in which case price is a key factor in customer supplier selection.
Even though the Group believes it will be able to cut costs in the face of contracting sales volumes, it may
not be able to reduce them sufficiently to match the possible contraction in sales prices, with a consequently
negative impact on its activities, results of operations and statement of financial position.
* The risks described in this section are those that, at the date of the present document, the Group believes, if they were to occur, could
have a material adverse near-term impact on its activities, financial position, earnings and future prospects. The Group is also exposed to
other risk factors that, at the date of the present document, nonetheless appear to be of limited significance.

PRYSMIAN l INTERIM DIRECTORS’ REPORT
. 41
Exchange rate risk
The Prysmian Group operates internationally and is therefore exposed to exchange rate risk in the various
currencies in which it operates (principally the US dollar, British pound, Brazilian real and Australian dollar).
Exchange rate risk occurs when future transactions or assets and liabilities recognised in the statement of
financial position are denominated in a currency other than the functional currency of the company which
undertakes the transaction.
To manage exchange rate risk arising from future trade transactions and from the recognition of foreign
currency assets and liabilities, most Group companies use forward contracts arranged by Group Treasury,
which manages the various positions in each currency. Since Prysmian prepares its consolidated financial
statements in Euro, it is therefore possible that, despite centrally arranged hedges, significant fluctuations in
the exchange rates used to translate the foreign currency financial statements of subsidiaries could affect the
Group's results of operations and statement of financial position.
Interest rate risk
Changes in interest rates affect the market value of the Prysmian Group's financial assets and liabilities as
well as its net finance costs. The interest rate risk to which the Group is exposed is mainly on long-term
financial liabilities, carrying both fixed and variable rates.
Fixed rate debt exposes the Group to a fair value risk. The Group does not operate any particular hedging
policies in relation to the risk arising from such contracts since it considers this risk to be immaterial.
Variable rate debt exposes the Group to a rate volatility risk (cash flow risk). The Group uses interest rate
swaps (IRS) to hedge this risk, which transform variable rates into fixed ones, thus reducing the rate volatility
risk. Under such IRS contracts, the Group agrees with the other parties to swap on specific dates the
difference between the contracted fixed rates and the variable rate calculated on the loan's notional value. A
potential rise in interest rates, from the record lows reached in recent years, is a risk factor in coming
quarters; in order to limit this risk, during 2012 the Prysmian Group has taken out additional IRS contracts to
mitigate the risk of a rise in interest rates until the end of 2016.
Risks associated with fluctuations in raw material prices
The principal material used for making the Prysmian Group's products is copper. The other raw materials
used are aluminium, lead and steel, as well as various petroleum derivatives, such as PVC and
polyethylene. All raw materials have experienced particularly significant price fluctuations in recent years,
which could continue in coming quarters. The Group neutralises the impact of possible rises in the price of
copper and its other principal raw materials through automatic sales price adjustment mechanisms or
through hedging activities; the exception is petroleum derivatives (polyethylene, plastifying PVC, rubber and
other chemical products), where the risk cannot be offset through hedging. Established commercial practice
and/or the structural characteristics of the markets concerned mean that hedging of certain products (mainly
in the Trade & Installers business area) involves the periodic updating of price lists (since it is not possible to
use automatic sales price adjustment mechanisms). In such cases, it is possible that, in the current market
context, the Company would be unable to quickly pass on the impact of fluctuations in raw material prices to
sales prices. In particular, in the case of petroleum derivatives, it is standard practice for changes in
purchase price to systematically take place later than changes in the petroleum price.
More generally, depending on the size and speed of copper price fluctuations, such fluctuations may have a
significant impact on customers' buying decisions particularly in the Trade & Installers business area and the
Power Distribution business line and certain lines in the Industrial area more exposed to cyclical trends in
demand, and on the Group's margins and working capital. In particular, (i) significant, rapid increases and
decreases in the copper price may cause absolute increases and decreases respectively in the Group's

PRYSMIAN l INTERIM DIRECTORS’ REPORT
. 42
profit margins due to the nature of the commercial relationships and mechanisms for determining end
product prices and (ii) increases and decreases in the copper price may cause increases and decreases
respectively in working capital (causing a consequent increase or decrease in the Group's net debt).
Risk hedging differs according to the type of business and supply contract, as shown in the following
diagram:
Risks relating to the Draka Group's integration process
The public offer for all the shares in Draka Holding N.V. was completed on 22 February 2011 with
acceptances received from more than 99% of the shares, while on 27 February 2012, the Prysmian Group
completed the squeeze-out procedure to obtain ownership of the company's entire share capital. After the
integration process's initial preparatory phase, the new organisational structure was officially launched with
effect from July 2011 and will guide the new Group with the goal of promoting both the Prysmian and Draka
commercial brands and of realising the expected synergies.
Over the course of the integration process Prysmian expects to incur a total of some Euro 200 million in
restructuring costs (net of any divestments) and to generate growing cost synergies starting from year one of
the integration with the goal of achieving total annual synergies of Euro 150 million by 2015, mainly by
reducing fixed costs, by optimising the industrial footprint and procurement, by making organisational
PRYSMIAN l INTERIM DIRECTORS’ REPORT
. 43
savings and improving operating efficiency and optical fibre sourcing, and by exploiting complementarities in
the product portfolios.
However, Prysmian cannot rule out potential difficulties or delays in implementing the new organisational
structure and the new operating processes, with a possible consequent adverse impact both on the timing
and amount of expected synergies and restructuring costs.
Risks associated with activities in developing countries
The Prysmian Group operates and has production facilities and/or companies in Asia and Latin America.
The Group's activities in these countries are exposed to different risks linked to local regulatory and legal
systems, the imposition of tariffs or taxes, political and economic instability, and exchange rate risks.
Significant changes in the macroeconomic, political, tax or legislative framework of such countries could
have an adverse impact on the Group's activities, results of operations and statement of financial position.
Risks associated with sources of finance
The effects of the recent major instability in the international banking and financial system could represent a
potential risk factor in terms of obtaining financial resources and the associated cost. Prysmian Group
believes that it has significantly mitigated such a risk after entering into a long-term loan agreement in March
2011 for Euro 800 million (Credit Agreement 2011) with a syndicate of major banks. This five-year
agreement comprises a loan for Euro 400 million (Term Loan Facility 2011) and a revolving facility for Euro
400 million (Revolving Credit Facility 2011). It will be recalled that in January 2010 Prysmian entered into a
forward start credit agreement for Euro 1,070 million, of which Euro 670 million related to a Term Loan
Facility and Euro 400 million to a Revolving Credit Facility, maturing on 31 December 2014. This agreement
was used on 3 May 2012 to replace the Credit Agreement made in 2007 at its natural maturity.
In addition, the placement of an unrated bond with institutional investors on the Eurobond market was
completed in March 2010 for a nominal total of Euro 400 million with a 5.25% coupon and maturity in April
2015.
The annual interest rate on the cash credit facilities is equal to the sum of:
I. LIBOR or EURIBOR, depending on the currency;
II. an annual spread determined on the basis of the ratio between consolidated net financial position and
consolidated EBITDA.
As at 30 June 2012, the Group had financial resources, comprising cash and cash equivalents and undrawn
committed credit lines, in excess of Euro 1 billion.
A detailed analysis of "Borrowings from banks and other lenders" can be found in the Explanatory Notes to
the Half-Year Condensed Consolidated Financial Statements.
Risks associated with sources of finance: financial covenants
The credit agreements mentioned in the preceding paragraph all contain a series of financial and non-
financial covenants with which the Group must comply. These covenants restrict Prysmian's ability to
increase its net debt; should it fail to satisfy one of the covenants, this would lead to a default event which,
unless resolved under the terms of the respective agreements, could lead to their termination and/or an early
repayment of any amounts drawn down. In such an eventuality, the Group might be unable to repay the
amounts demanded early, which in turn would give rise to a liquidity risk.
The financial covenants are measured at the half-year close on 30 June and at the full-year close on 31
December. All covenants, financial and otherwise, were fully observed at 30 June 2012. In particular:
(i) the ratio between EBITDA and Net finance costs, as defined in the two credit agreements, was 6.47
(against a required covenant of not less than 4.00x);

PRYSMIAN l INTERIM DIRECTORS’ REPORT
. 44
(ii) the ratio between Net Financial Position and EBITDA, as defined in the two credit agreements, was 2.16
(against a required covenant of below 3.50x);
Furthermore, during February 2011, concurrently with the Draka acquisition, the Group had obtained from
the syndicate of financing banks a significant extension to its financial covenants, as reported above, with
respect to the previous ones.
As things stand and in view of the above widening of the financial covenants, Prysmian Group believes that it
will not have to face this risk in the near future.
Risks relating to legal and tax proceedings
Prysmian S.p.A. and some Prysmian Group companies are currently involved in tax and legal proceedings in
connection with their business, involving civil, criminal and administrative actions. In some of these cases,
the company might not be able to accurately quantify the potential losses or penalties and, if the proceedings
have an adverse outcome, this could have even a material impact on the Group's activities, results of
operations and statement of financial position.
More specifically, the European Commission, the US Department of Justice and the Japanese antitrust
authority started an investigation in late January 2009 into several European and Asian electrical cable
manufacturers to verify the existence of alleged anti-competitive practices in the high voltage underground
and submarine cables markets. Subsequently, the Australian Competition and Consumers Commission
("ACCC") and the New Zealand Commerce Commission also started similar investigations. During 2011, the
Canadian antitrust authority also started an investigation into a high voltage submarine project dating back to
2006. The investigations in Japan and New Zealand ended in previous years without any sanctions for
Prysmian. The other investigations are still in progress and the Group is fully collaborating with the relevant
authorities.
In Australia, the ACCC has filed a case before the Federal Court arguing that Prysmian Cavi e Sistemi S.r.l.
(formerly Prysmian Cavi e Sistemi Energia S.r.l.) and two other companies violated antitrust rules in
connection with a high voltage underground cable project awarded in 2003. Prysmian Cavi e Sistemi S.r.l.
was officially served with this claim in April 2010 and has since filed its defence.
In Brazil, the local antitrust authority has started an investigation into several cable manufacturers, including
Prysmian, in the high voltage underground and submarine cables market (this is the only investigation for
which the Group has been unable to estimate the size of the provision).
At the start of July 2011, Prysmian received a statement of objection from the European Commission in
relation to the investigation started in January 2009 into the high voltage underground and submarine energy
cables market. This document contains the Commission's preliminary position on alleged anti-competitive
practices and does not prejudge its final decision. Prysmian has therefore had access to the Commission's
dossier and, while fully co-operating, has presented its defence against the related allegations. This past
June was the hearing before the European Commission during which Prysmian, as well as the other
companies party to the proceedings, had the opportunity to submit its defence.
Already during 2011, in view of the developments in the European Commission investigation, management
believed that it was able to estimate the risk relating to the investigations underway in the various
jurisdictions, except for Brazil.
The amount of the provision at 30 June 2012, totalling Euro 211 million, still represents the best estimate of
this liability based on the information currently available, even though the outcome of the pending demands
in the various jurisdictions is still uncertain.

PRYSMIAN l INTERIM DIRECTORS’ REPORT
. 45
Risks associated with delivery dates and product quality
Some supply and/or installation contracts entered into by the Prysmian Group include penalties if the agreed
delivery date or qualitative standards are not met. The application of such penalties, the obligation to
compensate any damages as well as the impact of any delayed delivery on the supply chain, could
adversely affect the Group's activities, results of operations and statement of financial position.
Although in recent years, Group companies have not been involved in claims for damages of this kind, it is
not possible to guarantee that in the future the Group will always manage to fully and promptly meet such
commitments.
STOCK OPTION PLANS
Information about the evolution of existing stock option plans can be found in Note 23 to the Half-Year
Condensed Consolidated Financial Statements.
RELATED PARTY TRANSACTIONS
Related party transactions do not qualify as either atypical or unusual but fall into the normal course of
business by Group companies. Such transactions take place under market terms and conditions, according
to the type of goods and services provided.
Information on related party transactions, including that required by the Consob Communication dated 28
July 2006, is presented in Note 20 to the Half-Year Condensed Consolidated Financial Statements.
Milan, 7 August 2012
ON BEHALF OF THE BOARD OF DIRECTORS
THE CHAIRMAN
Massimo Tononi

HALF-YEAR CONDENSEDCONSOLIDATEDFINANCIAL STATEMENTS
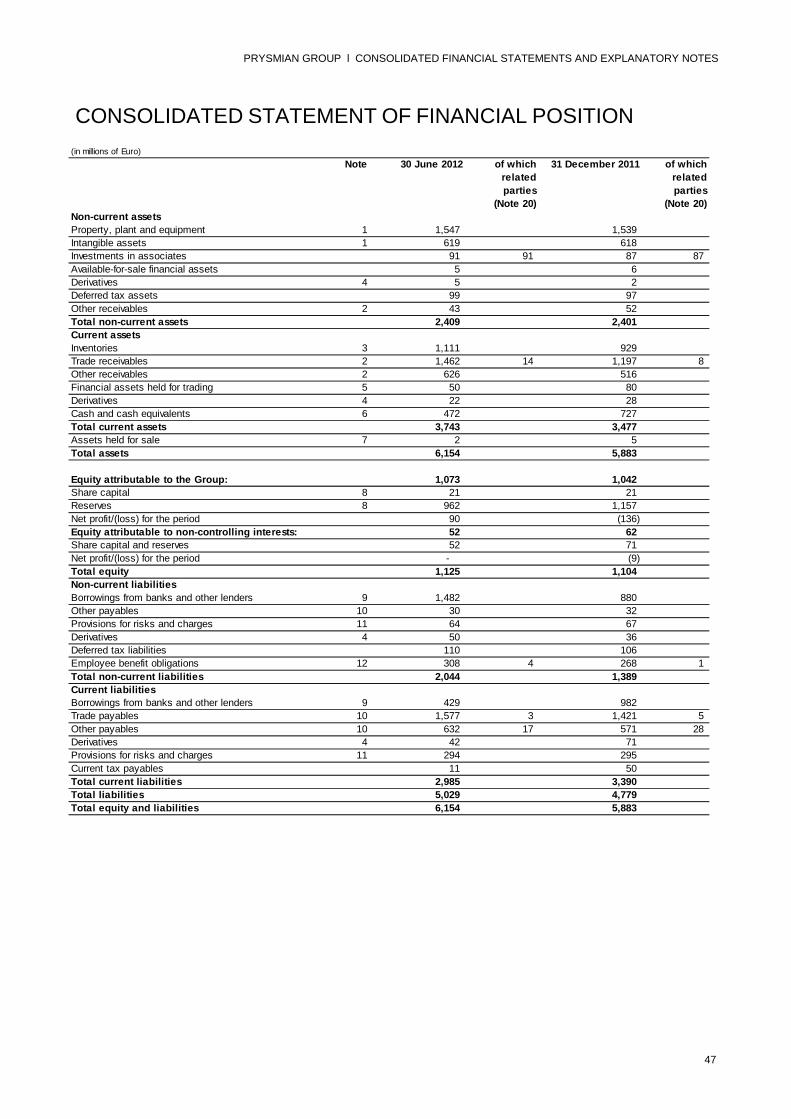
47
PRYSMIAN GROUP l CONSOLIDATED FINANCIAL STATEMENTS AND EXPLANATORY NOTES
(in millions of Euro)
Note 30 June 2012 of which
related
parties
(Note 20)
31 December 2011 of which
related
parties
(Note 20)
Non-current assets
Property, plant and equipment 1 1,547 1,539
Intangible assets 1 619 618
Investments in associates 91 91 87 87
Available-for-sale financial assets 5 6
Derivatives 4 5 2
Deferred tax assets 99 97
Other receivables 2 43 52
Total non-current assets 2,409 2,401
Current assets
Inventories 3 1,111 929
Trade receivables 2 1,462 14 1,197 8
Other receivables 2 626 516
Financial assets held for trading 5 50 80
Derivatives 4 22 28
Cash and cash equivalents 6 472 727
Total current assets 3,743 3,477
Assets held for sale 7 2 5
Total assets 6,154 5,883
Equity attributable to the Group: 1,073 1,042
Share capital 8 21 21
Reserves 8 962 1,157
Net profit/(loss) for the period 90 (136)
Equity attributable to non-controlling interests: 52 62
Share capital and reserves 52 71
Net profit/(loss) for the period - (9)
Total equity 1,125 1,104
Non-current liabilities
Borrowings from banks and other lenders 9 1,482 880
Other payables 10 30 32
Provisions for risks and charges 11 64 67
Derivatives 4 50 36
Deferred tax liabilities 110 106
Employee benefit obligations 12 308 4 268 1
Total non-current liabilities 2,044 1,389
Current liabilities
Borrowings from banks and other lenders 9 429 982
Trade payables 10 1,577 3 1,421 5
Other payables 10 632 17 571 28
Derivatives 4 42 71
Provisions for risks and charges 11 294 295
Current tax payables 11 50
Total current liabilities 2,985 3,390
Total liabilities 5,029 4,779
Total equity and liabilities 6,154 5,883
CONSOLIDATED STATEMENT OF FINANCIAL POSITION

48
PRYSMIAN GROUP l CONSOLIDATED FINANCIAL STATEMENTS AND EXPLANATORY NOTES
CONSOLIDATED INCOME STATEMENT
(in millions of Euro)
Note 1st half 2012 of which
related
parties
(Note 20)
1st half 2011 of which
related
parties
(Note 20)
Sales of goods and services 3.916 29 3.574 14
Change in inventories of work in progress, semi-finished and
finished goods 88 13of which non-recurring change in inventories of work in progress, semi-
finished and finished goods 13 - (14)
Other income 20 24
of which non-recurring other income 13 1 1
Raw materials, consumables used and goods for resale (2.666) (5) (2.473) (3)
Fair value change in metal derivatives 1 (33)
Personnel costs (518) (8) (416) (5)
of which non-recurring personnel costs 13 (22) (7)
of which personnel costs for stock option fair value 23 (9) -
Amortisation, depreciation and impairment (80) (65)
of which non-recurring impairment 13 (1) -
Other expenses (583) (696)
of which non-recurring other expenses 13 (21) (223)
Operating income 13 178 (72)
Finance costs 14 (192) (157)
of which non-recurring finance costs (2) -
Finance income 14 134 1 95
Share of income from investments in associates and dividends
from other companies 8 8 4 4
Profit/(loss) before taxes 128 (130)
Taxes 15 (38) (26)
Net profit/(loss) for the period 90 (156)
Attributable to:
Owners of the parent 90 (156)
Non-controlling interests - -
Basic earnings/(loss) per share (in Euro) 16 0,43 (0,76)
Diluted earnings/(loss) per share (in Euro) 16 0,43 (0,76)

49
PRYSMIAN GROUP l CONSOLIDATED FINANCIAL STATEMENTS AND EXPLANATORY NOTES
(in millions of Euro)
1st half 2012 1st half 2011
Net profit/(loss) for the period 90 (156)
Fair value gains/(losses) on available-for-sale financial assets - gross of tax - 1
Fair value gains/(losses) on available-for-sale financial assets - tax effect - -
Fair value gains/(losses) on cash flow hedges - gross of tax (5) 18
Fair value gains/(losses) on cash flow hedges - tax effect 2 (5)
Actuarial gains/(losses) on employee benefits - gross of tax (28) 2
Actuarial gains/(losses) on employee benefits - tax effect 3 -
Currency translation differences 4 (32)
Total post-tax other comprehensive income/(loss) for the period (24) (16)
Total comprehensive income/(loss) for the period 66 (172)
Attributable to:
Owners of the parent 66 (169)
Non-controlling interests - (3)
(in millions of Euro)
Share
capital
Fair value gains
and losses on
available-for-
sale financial
assets
Cash flow
hedges
Currency
translation
reserve
Other
reserves
Net profit/(loss)
for the period
Non-
controlling
interests
Total
Balance at 31 December 2010 18 - (13) (31) 634 148 43 799
Allocation of prior year net result - - - - 148 (148) - -
Capital contributions 3 - - - 476 - - 479
Capital increase costs - - - - (1) - - (1)
Dividend distribution - - - - (35) - (1) (36)
Change in scope of consolidation - - - - - - 28 28
Total comprehensive income/(loss) for the period - 1 13 (29) 2 (156) (3) (172)
Balance at 30 June 2011 21 1 - (60) 1,224 (156) 67 1,097
Balance at 31 December 2011 21 - (17) (36) 1,210 (136) 62 1,104
Allocation of prior year net result - - - - (136) 136 - -
Fair value - stock options - - - - 9 - - 9
Dividend distribution (44) (1) (45)
Non-controlling interests acquired in subsidiaries (1) - - - - (3) - (9) (12)
Put option release 3 3
Total comprehensive income/(loss) for the period - - (3) 4 (25) 90 - 66
Balance at 30 June 2012 21 - (20) (32) 1,014 90 52 1,125
CONSOLIDATED STATEMENT OF COMPREHENSIVE INCOME
CONSOLIDATED STATEMENT OF CHANGES IN EQUITY
(1) This amount refers to the squeeze-out procedure to purchase the shares of Draka Holding NV, and to the acquisitions of
Draktel Optical Fibre S.A. and Neva Cables Ltd.

50
PRYSMIAN GROUP l CONSOLIDATED FINANCIAL STATEMENTS AND EXPLANATORY NOTES
(in millions of Euro)
1st half 2012 of which
related
parties
(Note 20)
1st half 2011 of which
related parties
(Note 20)
Profit/(loss) before taxes 128 (130)
Depreciation and impairment of property, plant and equipment 65 55
Amortisation and impairment of intangible assets 15 10
Net gains on disposal of property, plant and equipment, intangible
assets and other non-current assets (1) (1)
Share of income from investments in associates (8) (4)
Fair value - stock options 9 -
Fair value change in metal derivatives and other fair value items (1) 33
Net finance costs 58 62
Changes in inventories (167) (58)
Changes in trade receivables/payables (104) (8) (79) (3)
Changes in other receivables/ payables (89) (11) 43
Changes in receivables/payables for derivatives 1 1
Taxes paid (32) (37)
Utilisation of provisions (including employee benefit obligations) (48) (41)
Increases in provisions (including employee benefit obligations) 41 3 218
A. Net cash flow provided by/(used in) operating activities (133) 72
Acquisitions (1) (35) (25) (419)
Investments in property, plant and equipment (55) (46)
Disposals of property, plant and equipment 2 11
Investments in intangible assets (10) (11)
Investments in financial assets held for trading (2) -
Disposals of financial assets held for trading 29 20
Disposals of available-for-sale financial assets - 143
Dividends received 6 6 4
B. Net cash flow provided by/(used in) investing activities (65) (298)
Capital contributions and other changes in equity - 1
Dividend distribution (45) (36)
Finance costs paid (188) (176)
Finance income received 112 87
Changes in net financial payables 54 272
C. Net cash flow provided by/(used in) financing activities (67) 148
D. Currency translation gains/(losses) on cash and cash equivalents 10 (9)
E. Total cash flow provided/(used) in the period (A+B+C+D) (255) (87)
F. Net cash and cash equivalents at the beginning of the period 727 630
G. Net cash and cash equivalents at the end of the period (E+F) 472 543
CONSOLIDATED STATEMENT OF CASH FLOWS
(1) The figure of Euro 35 million in the first six months of 2012 refers to:
- Euro 23 million for the acquisition of Telcon Fios e Cabos para Telecomunicaçoes S.A. (stated net of Euro 9 million in cash
and cash equivalents held by the acquiree at the acquisition date);
- Euro 9 million for the cash outlay under the squeeze-out procedure to purchase Draka Holding NV shares;
- Euro 2 million for the acquisition of Draktel Optical Fibre S.A.;
- Euro 1 million for the acquisition of Neva Cables Ltd.
The figure of Euro 419 million at the end of June 2011 represented the cash outlay of Euro 501 million to acquire the Draka Group
minus the Draka Group’s net cash and cash equivalents at the acquisition date.

51
PRYSMIAN GROUP l CONSOLIDATED FINANCIAL STATEMENTS AND EXPLANATORY NOTES
EXPLANATORY NOTES
A. GENERAL INFORMATION
Prysmian S.p.A. ("the Company") is a company incorporated and domiciled in Italy and organised under the
laws of the Republic of Italy.
The Company has its registered office in Viale Sarca, 222 - Milan (Italy).
Prysmian S.p.A. has been listed on the Italian Stock Exchange since 3 May 2007 and has been included
since September 2007 in the FTSE MIB index, comprising the top 40 Italian companies by capitalisation and
stock liquidity.
The Company and its subsidiaries (together "the Group" or "Prysmian Group") produce, distribute and sell
cables and systems and related accessories for the energy and telecommunications industries worldwide.
Squeeze-out procedure
On 27 February 2012, the squeeze-out, permitted under art. 2:359c of the Dutch Civil Code, was completed
in order to purchase the 478,878 ordinary shares of Draka Holding N.V., for which the acceptance was not
obtained during the public mixed exchange and cash offer for all the Draka Holding N.V. ordinary shares.
The successful conclusion of the squeeze-out means that Prysmian Group now holds the entire share
capital of Draka Holding N.V..
The squeeze-out procedure required Prysmian S.p.A. to make available to these share-owners the sum of
Euro 8,886,251.19, inclusive of legal interest required under Dutch law, on a deposit account held at the
Dutch Ministry of Finance; this amount was calculated on the basis of a value of Euro 18.53 per share, as
determined by the corporate division of the Amsterdam Appeal Court.
The consolidated financial statements contained herein were approved by the Board of Directors on 7
August 2012. The present document has been the subject of a limited review by the independent auditors.
Note: all the amounts shown in the tables in the following Notes are expressed in millions of Euro, unless otherwise stated.
B. FORM AND CONTENT
The present half-year condensed consolidated financial statements have been prepared on a going concern
basis, since the directors have assessed that there are no financial, operating or other kind of indicators that
might provide evidence of the Group's inability to meet its obligations in the foreseeable future and
particularly in the next 12 months.
In particular, the Group's estimates and projections have taken into account the increase in net debt resulting
from the Draka acquisition, possible developments in the investigations by the European Commission and
52
PRYSMIAN GROUP l CONSOLIDATED FINANCIAL STATEMENTS AND EXPLANATORY NOTES
other jurisdictions into alleged anti-competitive practices in the high voltage underground and submarine
cables market, as well as the risk factors described in the Directors' Report, and confirm Prysmian Group's
ability to operate as a going concern and to comply with its financial covenants.
The Company has prepared the present document in compliance with the International Financial Reporting
Standards (IFRS) issued by the IASB and recognised by the European Union in Regulation (EC)
n.1606/2002 of the European Parliament and Council dated 19 July 2002, and specifically in accordance
with IAS 34 – Interim Financial Reporting, and the instructions issued in implementation of art. 9 of Italian
Decree 38/2005. As permitted by IAS 34, the Group has decided to publish its half-year consolidated
financial statements and associated explanatory notes in a condensed format.
The information contained in the half-year condensed consolidated financial statements must be read in
conjunction with the annual IFRS consolidated financial statements at 31 December 2011.
B.1 FINANCIAL STATEMENTS AND DISCLOSURES
The Group has decided to present its income statement according to the nature of expenses, whereas
assets and liabilities in the statement of financial position are classified as current or non-current. The
statement of cash flows has been prepared using the indirect method. The Group has also applied the
provisions of Consob Resolution 15519 dated 27 July 2006 concerning financial statement formats and the
requirements of Consob Communication 6064293 dated 28 July 2006 regarding disclosures.
The provisional fair values at 30 June 2011 of the assets and liabilities relating to the Draka Group business
combination do not materially differ from the final values at 31 December 2011, meaning it has not been
necessary to amend the disclosure made in 1st half 2011.
For the sake of consistency with the current presentation, the consolidated income statement for 1st half
2011, presented in the half-year condensed consolidated financial statements for comparative purposes,
contains some reclassifications compared with the previously published figures. In particular, the cost of
goods for resale and related change in inventories have been reclassified from "Other expenses" to "Raw
materials, consumables used and goods for resale". The amount of the reclassification in 1st half 2011 is
Euro 58 million.
When preparing the half-year condensed consolidated financial statements, management has made
judgements, estimates and assumptions that affect the value of revenues, costs, assets and liabilities and
the disclosures relating to contingent assets and liabilities at the reporting date. As estimates, these may
differ from the actual results obtained in the future. Some valuation processes, particularly more complex
ones such as the determination of any impairment losses against the value of property, plant and equipment
and intangible assets, are carried out fully only at year end, when all the necessary information is available,
unless there are impairment indicators that require the immediate recognition of a loss.
53
PRYSMIAN GROUP l CONSOLIDATED FINANCIAL STATEMENTS AND EXPLANATORY NOTES
B.2 ACCOUNTING STANDARDS
Accounting standards used to prepare the half-year condensed consolidated financial
statements
The consolidation principles, the methods applied for translating financial statements into the presentation
currency, the accounting standards and the accounting estimates adopted are the same as those used for
the consolidated financial statements at 31 December 2011, to which reference should be made for more
details, except for:
1. income taxes, which have been recognised using the best estimate of the weighted average tax rate
for the full year;
2. the accounting standards and amendments discussed below and obligatorily applied with effect from
1 January 2012 after receiving endorsement from the competent authorities.
Accounting standards, amendments and interpretations applied from 1 January 2012
On 7 October 2010, the IASB published a number of amendments to IFRS 7 – Financial Instruments:
Disclosures. These amendments will allow users of financial statements to improve their understanding of
transfer transactions of financial assets and the possible effects of any risks that may remain with the entity
that transferred the assets. The amendments also require additional disclosures if a disproportionate amount
of transfer transactions are undertaken around the end of a reporting period. These amendments were
published in the Official Journal of the European Union on 23 November 2011 and apply to financial years
beginning on or after 1 July 2011. The application of these amendments has not had any effect on the
present half-year condensed consolidated financial statements.
New standards, amendments and interpretations of existing standards, not yet mandatory and
not adopted early by the Group
On 12 November 2009, the IASB issued the first part of a new accounting standard IFRS 9 – Financial
Instruments, which will supersede IAS 39 - Financial Instruments: Recognition and Measurement. This initial
document addresses the classification of financial instruments and forms part of a three-phase project,
whose second and third phases will address the impairment methodology for financial assets and the
application of hedge accounting respectively. This new standard, whose purpose is to simplify and reduce
the complexity of accounting for financial instruments, classifies financial instruments in three categories that
the reporting entity defines according to its business model, and to the contractual characteristics and related
cash flows of the instruments in question.
On 28 October 2010, the IASB published new requirements on accounting for financial liabilities. These
requirements will be added to IFRS 9 and complete the classification and measurement phase of the project
to replace IAS 39.

54
PRYSMIAN GROUP l CONSOLIDATED FINANCIAL STATEMENTS AND EXPLANATORY NOTES
On 16 December 2011, the IASB published Mandatory Effective Date and Transition Disclosures
(Amendments to IFRS 9 and IFRS 7), which defers the mandatory effective date of IFRS 9 from 1 January
2013 to 1 January 2015, while nonetheless leaving the possibility of earlier application unchanged.
As at the present document date, the European Union had not yet completed the endorsement process
needed for this document to apply.
On 20 December 2010, the IASB issued a document entitled Deferred Tax: Recovery of Underlying Assets
(Amendments to IAS 12). The current version of IAS 12 requires the recoverability of deferred tax assets to
be assessed on the basis of judgements concerning their possible use or sale. The amendment provides a
practical solution by introducing a presumption in relation to investment property, and to property, plant and
equipment and intangible assets that are recognised or measured at fair value. This presumption assumes
that a deferred tax asset will be fully recovered through sale, unless there is clear evidence that its carrying
amount can be recovered through use.
As a result of the amendment of IAS 12, SIC 21 - Income Taxes: Recovery of Revalued Non-Depreciable
Assets will be withdrawn. As at the present document date, the European Union had not yet completed the
endorsement process needed for the application of this amendment, which is due to come into effect from 1
January 2012.
On 12 May 2011, the IASB issued IFRS 10, IFRS 11 and IFRS 12 and amendments to IAS 27 and IAS 28.
These documents are due to become effective from 1 January 2013. Earlier adoption of one of these
standards necessarily involves mandatory adoption of the other four. As at the present document date, the
European Union had not yet completed the endorsement process.
The principal changes are as follows:
IFRS 10 - Consolidated Financial Statements
This standard supersedes SIC 12 - Consolidation: Special Purpose Entities and parts of IAS 27 -
Consolidated and Separate Financial Statements. The objective of the new standard is to define the
concept of control and to combine the guidance on consolidation in a single document.
The new definition of control is more detailed and complex than before, and is associated with the
ongoing existence of all three of the following precise circumstances: power over the investee, exposure
or rights to variable returns from involvement with the investee and ability of the investor to use its power
over the investee to affect the amount of its return.
IAS 27 - Separate Financial Statements
IAS 27 - Consolidated and Separate Financial Statements has been revised following publication of
IFRS 10 - Consolidated Financial Statements. All references to consolidation have been removed from
the revised standard. Consequently, IAS 27 addresses only separate financial statements.
IFRS 11 - Joint Arrangements
This document supersedes IAS 31 - Interests in Joint Ventures and SIC 13 - Jointly Controlled Entities:
Non-Monetary Contributions by Venturers and establishes principles for identifying a joint arrangement
on the basis of the rights and obligations arising from the arrangement, rather than its legal form. The
accounting treatment differs according to whether the arrangement is classified as a joint operation or a
55
PRYSMIAN GROUP l CONSOLIDATED FINANCIAL STATEMENTS AND EXPLANATORY NOTES
joint venture. In addition, the existing policy choice of proportionate consolidation for joint ventures has
been eliminated.
IFRS 12 - Disclosure of Interests in Other Entities
This document refers to the disclosures concerning interests in other entities, including subsidiaries,
associates and joint ventures.
The objective is to disclose information that enables users of financial statements to evaluate the nature
of risks associated with interests in strategic investments (consolidated and otherwise) intended to be
held over the medium to long term.
On the same date the IASB issued IFRS 13 - Fair Value Measurement, which sets out in a single document
the rules defining the fair value concept and its use for measurement purposes in the various circumstances
permitted by IFRSs. As at the present document date, the European Union had not yet completed the
endorsement process needed for the application of this standard, which is due to come into effect from 1
January 2013.
On 16 June 2011, the IASB issued an amendment to IAS 1 - Presentation of Financial Statements. The
amendment requires entities to group together items within "Other comprehensive income" based on
whether they can or cannot subsequently be reclassified to profit or loss. This document was published in
the Official Journal of the European Union on 6 June 2012 and is applicable to financial years beginning on
or after 1 July 2012.
On the same date, the IASB also published a revised version of IAS 19 - Employee Benefits. The
amendments make important improvements insofar as: they eliminate the "corridor method" option to defer
recognition of actuarial gains and losses, and require plan deficits or surpluses to be presented in the
statement of financial position, costs relating to employee service and net interest expense to be recognised
in the statement of income, and actuarial gains and losses arising from the remeasurement of plan assets
and liabilities to be presented in other comprehensive income. The return on plan assets recognised in net
interest expense must be calculated using the discount rate applying to plan liabilities and no longer using
the expected rate of return on plan assets. The revised standard also calls for new disclosures to be
provided in the notes to financial statements. This document was published in the Official Journal of the
European Union on 6 June 2012 and is applicable to financial years beginning on or after 1 January 2013.
Earlier application is permitted.
On 16 December 2011, the IASB published amendments to IAS 32: Offsetting Financial Assets and
Financial Liabilities to clarify the criteria for offsetting financial assets and liabilities.
The amendments clarify that:
- the right of set-off between financial assets and liabilities must be available at the financial reporting date
and not contingent on a future event,
- this right must be enforceable by all counterparties both in the normal course of business and in the event
of insolvency/bankruptcy.
The amendments are effective for financial years beginning on or after 1 January 2014 and are required to
be applied retrospectively.
56
PRYSMIAN GROUP l CONSOLIDATED FINANCIAL STATEMENTS AND EXPLANATORY NOTES
On the same date, the IASB published amendments to IFRS 7: Disclosures - Offsetting Financial Assets and
Financial Liabilities to introduce new disclosures that will allow users of financial statements to assess the
impact on the financial statements of offsetting financial assets and liabilities. The disclosures relate to
master netting arrangements and similar agreements. The amendments are effective for financial years
beginning on or after 1 January 2013 and are required to be applied retrospectively.
As at the present document date, the European Union had not yet completed the endorsement process
needed for the application of these amendments.
B.3 CHANGES IN THE SCOPE OF CONSOLIDATION
The Group's scope of consolidation includes the financial statements of Prysmian S.p.A. (the Parent
Company) and of the companies over which it exercises direct or indirect control, which are consolidated
from the date when control is obtained until the date when such control ceases.
The following changes took place during the first six months of 2012:
Acquisitions
On 5 March 2012, Prysmian Cavi e Sistemi S.r.l and Prysmian S.p.A. respectively acquired 99.99% and
0.01% of the shares in Jaguar Communication Consultancy Services Private Ltd, an Indian company formed
on 31 January 2012.
On 4 April 2012, Draka Comteq Brasil Holding Ltda acquired 0.81% of the shares in Draka Cableteq Brasil
S.A..
On 5 April 2012, Draka Cableteq Brasil S.A. finalised the acquisition of 50% of the shares in Telcon Fios e
Cabos para Telecomunicaçoes S.A. and of 30% of the shares in Draktel Optical Fibre S.A., thereby
becoming the sole shareholder of these two Brazilian telecom cable and optical fibre companies, which had
joined the Group following the acquisition of the Draka Group in 2011. The value of the acquisition amounts
to approximately Euro 25 million (Euro 23 million for Telcon Fios e Cabos para Telecomunicaçoes SA. and
Euro 2 million for Draktel Optical Fibre S.A.).
On 11 May 2012, Draka Comteq Finland OY acquired the entire 25% non-controlling interest in Neva Cables
Ltd, a Russian company that is now wholly owned by the Group.
New company formations
Prysmian Electronics S.r.l. was formed in Italy on 12 January 2012. It is owned by Prysmian Cavi e Sistemi
S.r.l. (80%) and third parties (20%).
Prysmian UK Group Limited was formed on 2 April 2012. It is wholly owned by Draka Holding N.V.

57
PRYSMIAN GROUP l CONSOLIDATED FINANCIAL STATEMENTS AND EXPLANATORY NOTES
Mergers
On 27 June 2012, the merger was completed of Draka Industry & Specialty S.L.U. and Draka Elevator
Products Spain S.L.U. into Draka Cables Industrial S.L.U. (which on 30 June 2012 changed its legal form,
assuming the new name of Draka Cables Industrial S.A.).
On 28 June 2012 and 29 June 2012 the respective mergers were completed of Draka Marine Oil and Gas
International LLC into Draka Cableteq USA and of Draka Holdings USA Inc. into Draka Cableteq USA.
Liquidations
On 10 January 2012, the process of winding up Draka UK (EXDCC) Pension Plan Trust Company Ltd was
completed with the company's removal from the local company registry.
On 24 January 2012, the process of winding up Prysmian Cables Ltd. and Prysmian Focom Ltd. was
completed with their removal from the local company registry.
On 31 January 2012, the process of winding up Draka UK Services Ltd., Draka Cardinal Ltd. and RMCA
Holdings Ltd. was completed with their removal from the local company registry.
On 17 February 2012, the process of winding up NKF Americas N.V. and NKF Caribe N.V., both registered
in the Dutch Antilles, was completed with their removal from the local company registry.
On 1 June 2012, the process of winding up the German company Sykonec GMBH was completed with its
removal from the local company registry.
Ravin Cables Limited
At the beginning of 2010 the Prysmian Group acquired a 51% interest in the Indian company Ravin Cables
Limited. Over recent months relations with the minority shareholders have significantly deteriorated and, in
these circumstances, Prysmian has also initiated arbitration proceedings at the London Court of
International Arbitration (LCIA). From the second quarter of the year, it has been impossible for Prysmian to
be able to obtain reliable, updated financial information about the Indian company. In view of these events,
the half-year condensed consolidated financial statements reflects the statement of financial position and
income statement of Ravin Cables Limited at 31 March 2012, which are those latest available.
Appendix A provides a list of the Prysmian Group's subsidiaries, associates and significant investments at 30
June 2012.

58
PRYSMIAN GROUP l CONSOLIDATED FINANCIAL STATEMENTS AND EXPLANATORY NOTES
C. SEGMENT INFORMATION
The criteria used for identifying reportable segments are consistent with the way in which management runs
the Group.
In particular, the information is structured in the same way as the report periodically reviewed by the Chief
Executive Officer for the purposes of managing the business. In fact, the Chief Executive Officer reviews
operating performance by macro type of business (Energy and Telecom), assesses the results of operating
segments primarily on the basis of Adjusted EBITDA, defined as earnings (loss) for the period before non-
recurring items (eg. restructuring costs), amortisation, depreciation and impairment, finance costs and
income, and taxes, and reviews the statement of financial position for the Group as a whole, and not by
operating segment.
In order to provide users of the financial statements with clearer information, certain economic data is also
reported for the following sales channels and business areas within the individual operating segments:
A) Energy operating segment:
1. Utilities: organised in four lines of business, comprising High Voltage, Power Distribution, Accessories
and Submarine;
2. Trade & Installers: low and medium voltage cables for power distribution to and within residential and
other buildings;
3. Industrial: comprises cables and accessories for special industrial applications based on specific
requirements (Specialties&OEM; Oil&Gas; Automotive; Renewables; Surf; Elevator);
4. Other: occasional sales of residual products.
B) Telecom operating segment: organised in the following lines of business: Telecom Solutions (Telecom
Optical and Telecom Copper); Optical Fibre; Multimedia Solutions; OPGW.
All Corporate fixed costs are allocated to the Energy and Telecom segments. Revenues and costs are
allocated to each operating segment by identifying all revenues and costs directly attributable to that
segment and by allocating indirect costs on the basis of Corporate resources (personnel, space used, etc.)
absorbed by the operating segments.
Group operating activities are organised and managed separately based on the nature of the products and
services provided: each segment offers different products and services to different markets. Sales of goods
and services are analysed geographically on the basis of the location of the registered office of the company
that issues the invoices, regardless of the geographic destination of the products sold. This type of reporting
does not significantly differ from the breakdown of sales of goods and services by destination of the products
being sold. Transfer pricing between segments is determined using the same conditions as applied between
Group companies and is generally determined by applying a mark-up to production costs.
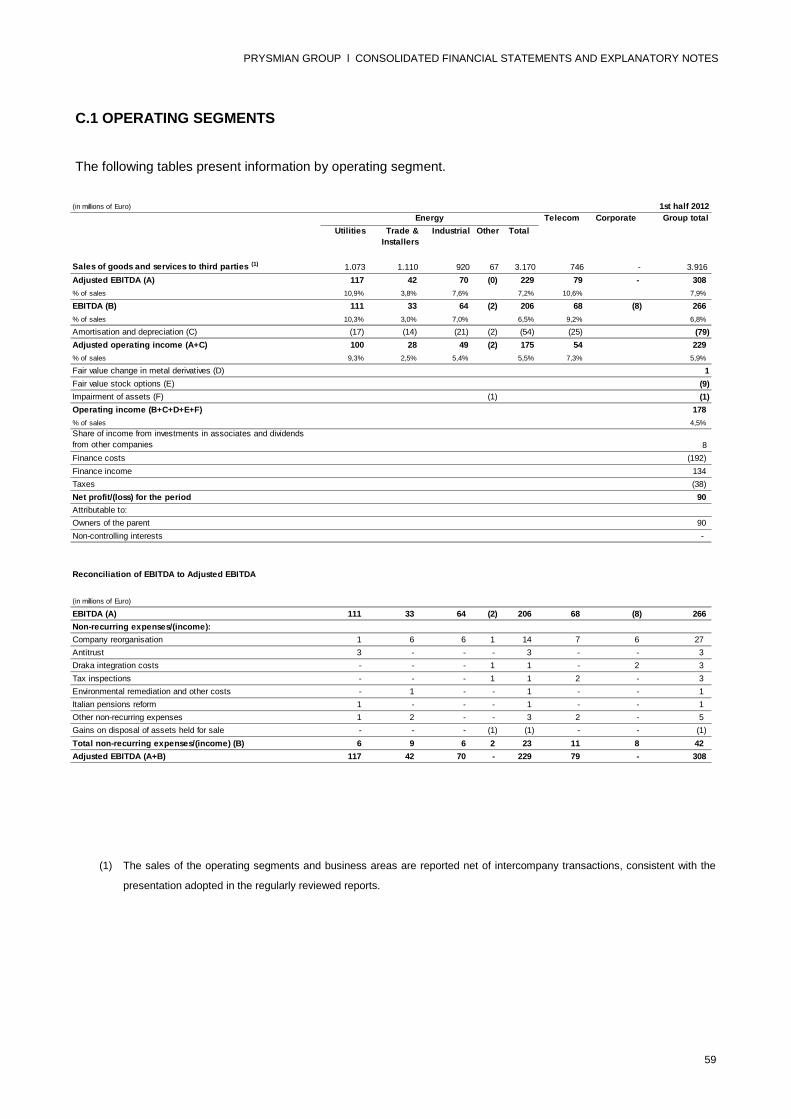
59
PRYSMIAN GROUP l CONSOLIDATED FINANCIAL STATEMENTS AND EXPLANATORY NOTES
C.1 OPERATING SEGMENTS
The following tables present information by operating segment.
(1) The sales of the operating segments and business areas are reported net of intercompany transactions, consistent with the
presentation adopted in the regularly reviewed reports.
(in millions of Euro)
Telecom Corporate Group total
Utilities Trade &
Installers
Industrial Other Total
Sales of goods and services to third parties (1) 1.073 1.110 920 67 3.170 746 - 3.916
Adjusted EBITDA (A) 117 42 70 (0) 229 79 - 308
% of sales 10,9% 3,8% 7,6% 7,2% 10,6% 7,9%
EBITDA (B) 111 33 64 (2) 206 68 (8) 266
% of sales 10,3% 3,0% 7,0% 6,5% 9,2% 6,8%
Amortisation and depreciation (C) (17) (14) (21) (2) (54) (25) (79)
Adjusted operating income (A+C) 100 28 49 (2) 175 54 229
% of sales 9,3% 2,5% 5,4% 5,5% 7,3% 5,9%
Fair value change in metal derivatives (D) 1
Fair value stock options (E) (9)
Impairment of assets (F) (1) (1)
Operating income (B+C+D+E+F) 178
% of sales 4,5%
Share of income from investments in associates and dividends
from other companies 8
Finance costs (192)
Finance income 134
Taxes (38)
Net profit/(loss) for the period 90
Attributable to:
Owners of the parent 90
Non-controlling interests -
Reconciliation of EBITDA to Adjusted EBITDA
(in millions of Euro)
EBITDA (A) 111 33 64 (2) 206 68 (8) 266
Non-recurring expenses/(income):
Company reorganisation 1 6 6 1 14 7 6 27
Antitrust 3 - - - 3 - - 3
Draka integration costs - - - 1 1 - 2 3
Tax inspections - - - 1 1 2 - 3
Environmental remediation and other costs - 1 - - 1 - - 1
Italian pensions reform 1 - - - 1 - - 1
Other non-recurring expenses 1 2 - - 3 2 - 5
Gains on disposal of assets held for sale - - - (1) (1) - - (1)
Total non-recurring expenses/(income) (B) 6 9 6 2 23 11 8 42
Adjusted EBITDA (A+B) 117 42 70 - 229 79 - 308
1st half 2012
Energy
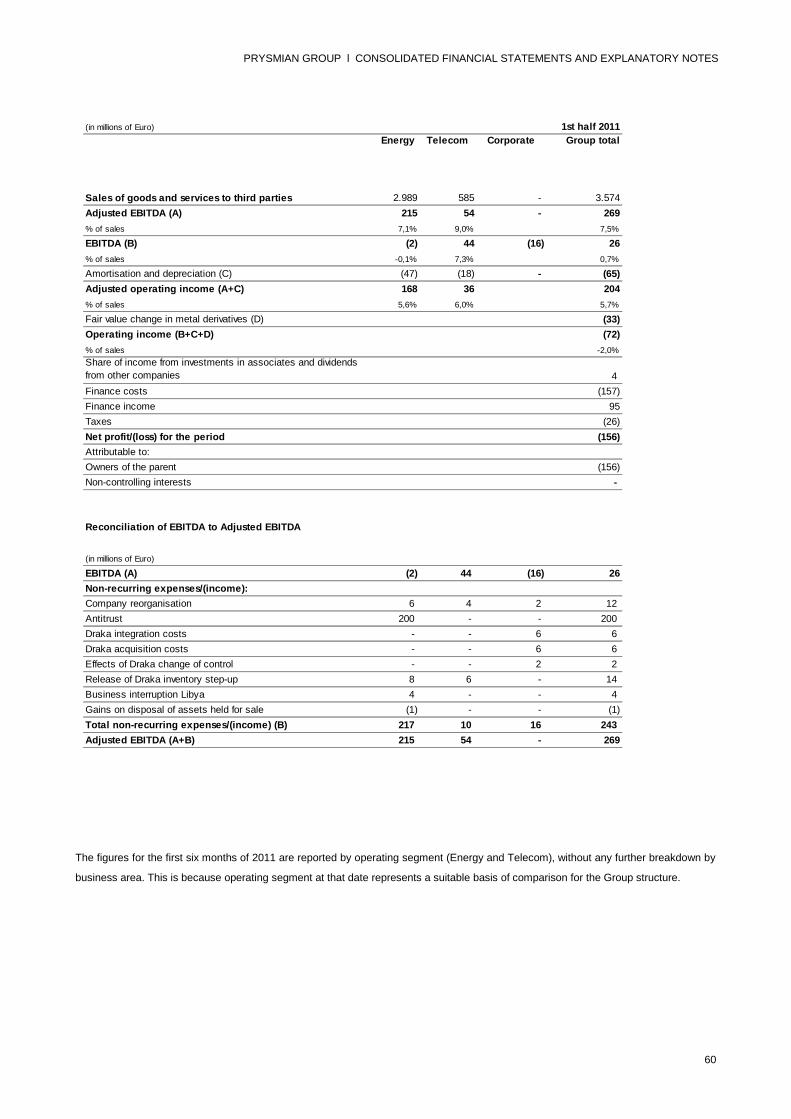
60
PRYSMIAN GROUP l CONSOLIDATED FINANCIAL STATEMENTS AND EXPLANATORY NOTES
The figures for the first six months of 2011 are reported by operating segment (Energy and Telecom), without any further breakdown by
business area. This is because operating segment at that date represents a suitable basis of comparison for the Group structure.
(in millions of Euro)
Telecom Corporate Group total
Sales of goods and services to third parties 2.989 585 - 3.574
Adjusted EBITDA (A) 215 54 - 269
% of sales 7,1% 9,0% 7,5%
EBITDA (B) (2) 44 (16) 26
% of sales -0,1% 7,3% 0,7%
Amortisation and depreciation (C) (47) (18) - (65)
Adjusted operating income (A+C) 168 36 204
% of sales 5,6% 6,0% 5,7%
Fair value change in metal derivatives (D) (33)
Operating income (B+C+D) (72)
% of sales -2,0%
Share of income from investments in associates and dividends
from other companies 4
Finance costs (157)
Finance income 95
Taxes (26)
Net profit/(loss) for the period (156)
Attributable to:
Owners of the parent (156)
Non-controlling interests -
Reconciliation of EBITDA to Adjusted EBITDA
(in millions of Euro)
EBITDA (A) (2) 44 (16) 26
Non-recurring expenses/(income):
Company reorganisation 6 4 2 12
Antitrust 200 - - 200
Draka integration costs - - 6 6
Draka acquisition costs - - 6 6
Effects of Draka change of control - - 2 2
Release of Draka inventory step-up 8 6 - 14
Business interruption Libya 4 - - 4
Gains on disposal of assets held for sale (1) - - (1)
Total non-recurring expenses/(income) (B) 217 10 16 243
Adjusted EBITDA (A+B) 215 54 - 269
1st half 2011
Energy
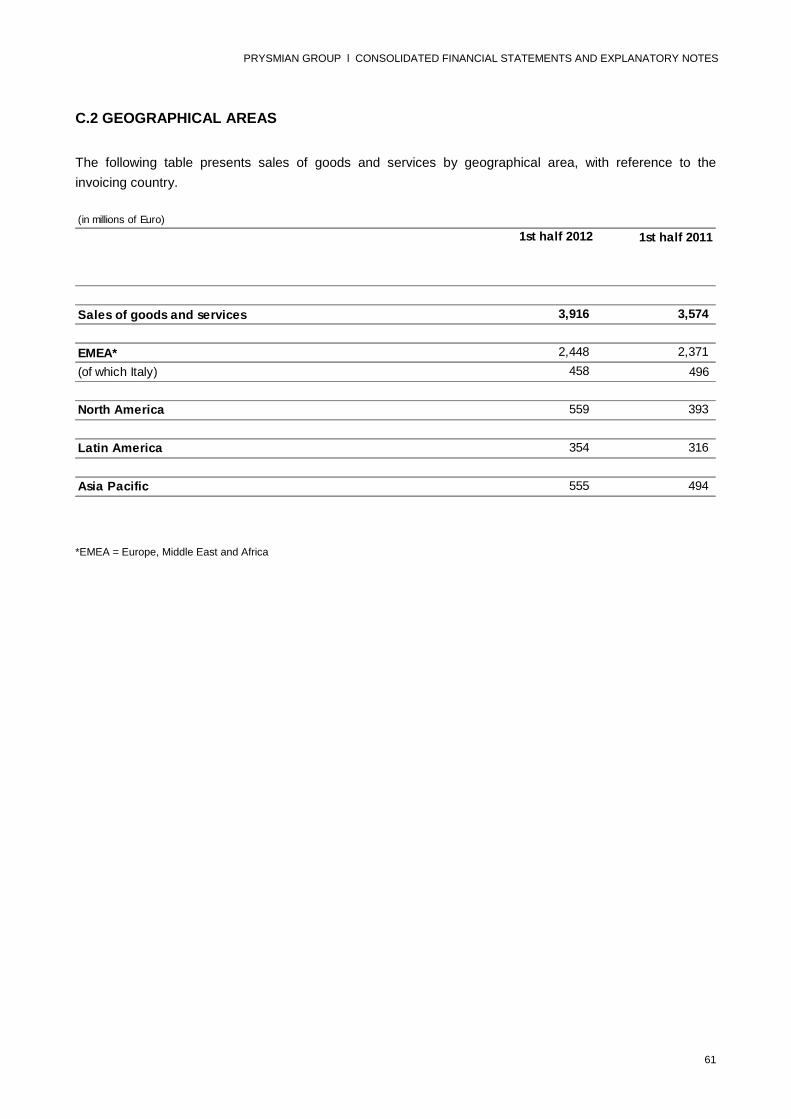
61
PRYSMIAN GROUP l CONSOLIDATED FINANCIAL STATEMENTS AND EXPLANATORY NOTES
(in millions of Euro)
1st half 2012 1st half 2011
Sales of goods and services 3,916 3,574
EMEA* 2,448 2,371
(of which Italy) 458 496
North America 559 393
Latin America 354 316
Asia Pacific 555 494
C.2 GEOGRAPHICAL AREAS
The following table presents sales of goods and services by geographical area, with reference to the
invoicing country.
*EMEA = Europe, Middle East and Africa

62
PRYSMIAN GROUP l CONSOLIDATED FINANCIAL STATEMENTS AND EXPLANATORY NOTES
(in millions of Euro)
Total acquisition cost (A) 21
Dividend distribution (B) 11
Fair value of net assets acquired* (C) 25
Goodwill (A)+(B)-(C) 7
Cash outlay for acquisition 32
Cash held by acquired company (9)
Acquisition cash flow 23
(in millions of Euro)
Fair value*
Property, plant and equipment 12
Intangible assets 2
Financial receivables - non-current 3
Inventories 4
Trade and other receivables 15
Trade and other payables (13)
Deferred tax liabilities (2)
Borrowings from banks and other lenders (5)
Cash and cash equivalents 9
Net assets acquired (C)* 25
D. BUSINESS COMBINATIONS
On 5 April 2012, the Prysmian Group acquired, through its subsidiary Draka Cableteq Brasil, a majority 50%
controlling interest in the Brazilian company Telcon Fios e Cabos para Telecomunicaçoes SA., thereby
becoming its sole shareholder. For practicality and in the absence of material impacts, the acquisition date of
the remaining of the 50% of shares has been taken as 31 March 2012, with revenues and expenses
consolidated as from 1 April 2012.
In compliance with IFRS 3, the fair values of the assets, liabilities and contingent liabilities have been
determined on a provisional basis, given the fact that some estimation processes have been not completed
at the reporting date. These measurements could be adjusted over the course of the twelve-month period
from the acquisition date.
* The fair values are reported on provisional basis.
Details of the provisional fair values of the assets/liabilities acquired are as follows:
* The fair values are reported on provisional basis.
The acquisition has given rise to a provisional amount of Euro 7 million in goodwill, which has been recorded
in "Intangible assets".
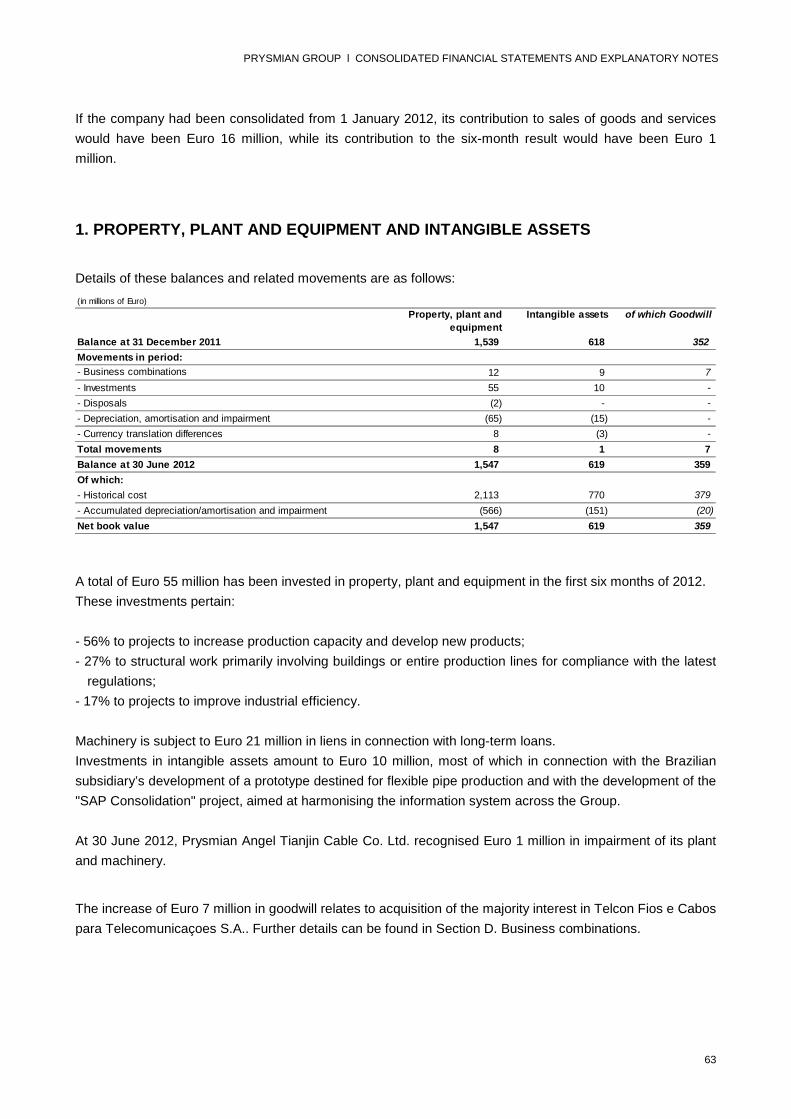
63
PRYSMIAN GROUP l CONSOLIDATED FINANCIAL STATEMENTS AND EXPLANATORY NOTES
(in millions of Euro)
Property, plant and
equipment
Intangible assets of which Goodwill
Balance at 31 December 2011 1,539 618 352
Movements in period:
- Business combinations 12 9 7
- Investments 55 10 -
- Disposals (2) - -
- Depreciation, amortisation and impairment (65) (15) -
- Currency translation differences 8 (3) -
Total movements 8 1 7
Balance at 30 June 2012 1,547 619 359
Of which:
- Historical cost 2,113 770 379
- Accumulated depreciation/amortisation and impairment (566) (151) (20)
Net book value 1,547 619 359
If the company had been consolidated from 1 January 2012, its contribution to sales of goods and services
would have been Euro 16 million, while its contribution to the six-month result would have been Euro 1
million.
1. PROPERTY, PLANT AND EQUIPMENT AND INTANGIBLE ASSETS
Details of these balances and related movements are as follows:
A total of Euro 55 million has been invested in property, plant and equipment in the first six months of 2012.
These investments pertain:
- 56% to projects to increase production capacity and develop new products;
- 27% to structural work primarily involving buildings or entire production lines for compliance with the latest
regulations;
- 17% to projects to improve industrial efficiency.
Machinery is subject to Euro 21 million in liens in connection with long-term loans.
Investments in intangible assets amount to Euro 10 million, most of which in connection with the Brazilian
subsidiary’s development of a prototype destined for flexible pipe production and with the development of the
"SAP Consolidation" project, aimed at harmonising the information system across the Group.
At 30 June 2012, Prysmian Angel Tianjin Cable Co. Ltd. recognised Euro 1 million in impairment of its plant
and machinery.
The increase of Euro 7 million in goodwill relates to acquisition of the majority interest in Telcon Fios e Cabos
para Telecomunicaçoes S.A.. Further details can be found in Section D. Business combinations.

64
PRYSMIAN GROUP l CONSOLIDATED FINANCIAL STATEMENTS AND EXPLANATORY NOTES
(in millions of Euro) 30 June 2012
Non-current Current Total
Trade receivables - 1,531 1,531
Allowance for doubtful accounts - (69) (69)
Total trade receivables - 1,462 1,462
Other receivables:
Tax receivables 17 92 109
Financial receivables 9 11 20
Prepaid finance costs 6 5 11
Receivables from employees 2 3 5
Pension fund receivables - 3 3
Construction contracts - 346 346
Advances to suppliers - 24 24
Others 9 142 151
Total other receivables 43 626 669
Total 43 2,088 2,131
(in millions of Euro) 31 December 2011
Non-current Current Total
Trade receivables - 1,264 1,264
Allowance for doubtful accounts - (67) (67)
Total trade receivables - 1,197 1,197
Other receivables:
Tax receivables 13 124 137
Financial receivables 10 9 19
Prepaid finance costs 15 7 22
Receivables from employees 1 1 2
Pension fund receivables - 3 3
Construction contracts - 235 235
Advances to suppliers - 14 14
Others 13 123 136
Total other receivables 52 516 568
Total 52 1,713 1,765
It is reported that, except as disclosed above, there has been no need to recognise any other impairment
losses. This does not mean that impairment losses, even significant ones, will not emerge when tests are
performed in more detail for the purposes of the annual financial statements.
2. TRADE AND OTHER RECEIVABLES
These are detailed as follows:

65
PRYSMIAN GROUP l CONSOLIDATED FINANCIAL STATEMENTS AND EXPLANATORY NOTES
(in millions of Euro)
30 June 2012 31 December 2011
Raw materials 327 291
of which allowance for obsolete and slow-moving raw materials (28) (22)
Work in progress and semi-finished goods 291 222of which allowance for obsolete and slow-moving work in progress
and semi-finished goods (7) (4)
Finished goods (1)493 416
of which allowance for obsolete and slow-moving finished goods (45) (44)
Total 1,111 929
(in millions of Euro)
Asset Liability
Non-current
Interest rate swaps (cash flow hedges) - 33
Forward currency contracts on commercial transactions (cash flow hedges) 4 4
Forward currency contracts on financial transactions (cash flow hedges) - 4
Total hedging derivatives 4 41
Forward currency contracts on financial transactions 1 2
Metal derivatives - 7
Total other derivatives 1 9
Total non-current 5 50
Current
Forward currency contracts on commercial transactions (cash flow hedges) 14 24
Total hedging derivatives 14 24
Forward currency contracts on commercial transactions 2 2
Forward currency contracts on financial transactions 4 4
Metal derivatives 2 12
Total other derivatives 8 18
Total current 22 42
Total 27 92
30 June 2012
3. INVENTORIES
These are detailed as follows:
(1) Finished products also include goods for resale.
4. DERIVATIVESThese are detailed as follows:
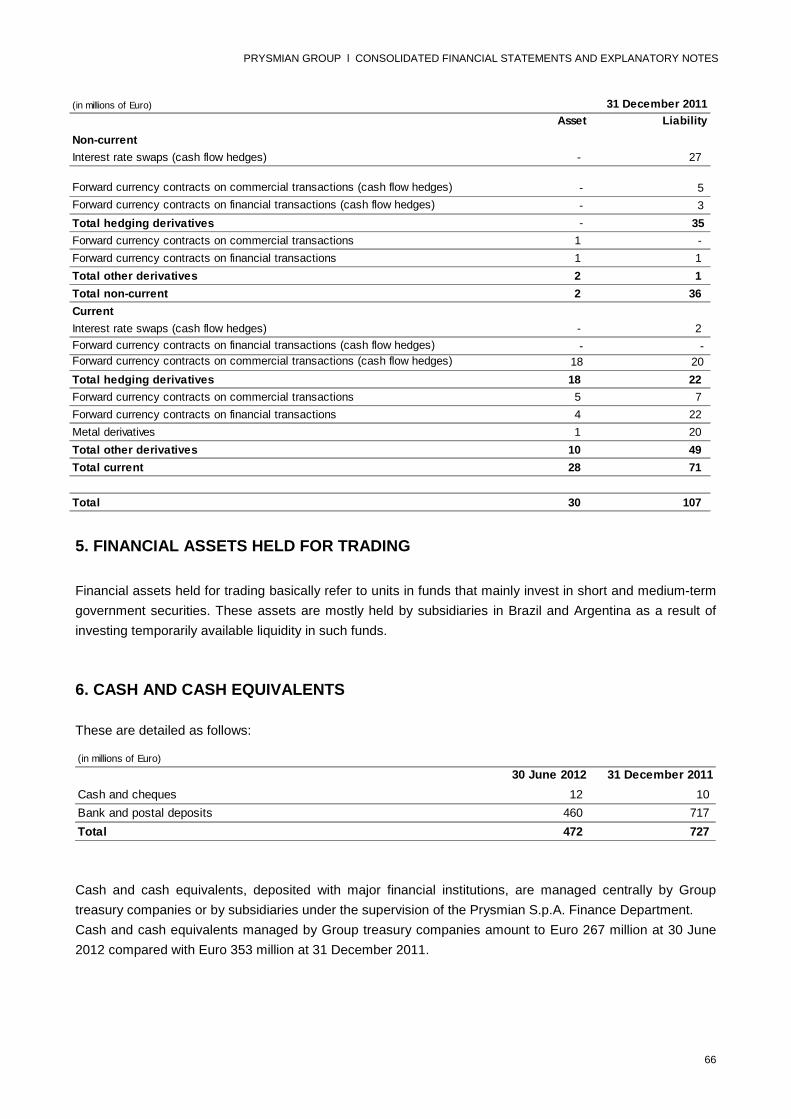
66
PRYSMIAN GROUP l CONSOLIDATED FINANCIAL STATEMENTS AND EXPLANATORY NOTES
(in millions of Euro)
Asset Liability
Non-current
Interest rate swaps (cash flow hedges) - 27
Forward currency contracts on commercial transactions (cash flow hedges) - 5
Forward currency contracts on financial transactions (cash flow hedges) - 3
Total hedging derivatives - 35
Forward currency contracts on commercial transactions 1 -
Forward currency contracts on financial transactions 1 1
Total other derivatives 2 1
Total non-current 2 36
Current
Interest rate swaps (cash flow hedges) - 2
Forward currency contracts on financial transactions (cash flow hedges) - -
Forward currency contracts on commercial transactions (cash flow hedges) 18 20
Total hedging derivatives 18 22
Forward currency contracts on commercial transactions 5 7
Forward currency contracts on financial transactions 4 22
Metal derivatives 1 20
Total other derivatives 10 49
Total current 28 71
Total 30 107
31 December 2011
(in millions of Euro)
30 June 2012 31 December 2011
Cash and cheques 12 10
Bank and postal deposits 460 717
Total 472 727
5. FINANCIAL ASSETS HELD FOR TRADING
Financial assets held for trading basically refer to units in funds that mainly invest in short and medium-term
government securities. These assets are mostly held by subsidiaries in Brazil and Argentina as a result of
investing temporarily available liquidity in such funds.
6. CASH AND CASH EQUIVALENTS
These are detailed as follows:
Cash and cash equivalents, deposited with major financial institutions, are managed centrally by Group
treasury companies or by subsidiaries under the supervision of the Prysmian S.p.A. Finance Department.
Cash and cash equivalents managed by Group treasury companies amount to Euro 267 million at 30 June
2012 compared with Euro 353 million at 31 December 2011.

67
PRYSMIAN GROUP l CONSOLIDATED FINANCIAL STATEMENTS AND EXPLANATORY NOTES
(in millions of Euro)
30 June 2012 31 December 2011
Land 2 2
Buildings - 2
Plant and machinery - 1
Total 2 5
7. ASSETS HELD FOR SALE
These are detailed as follows:
The change in assets held for sale basically refers to the disposal of buildings (Euro 2 million) by Prysmian
Angel Tianjin Cable Co. Ltd, on which a gain of Euro 1 million has been realised. This gain has been
classified as non-recurring income (Note 13).
8. SHARE CAPITAL AND RESERVES
Consolidated equity has increased by Euro 21 million since 31 December 2011, mainly reflecting the net
effect of:
- the net profit for the period of Euro 90 million;
- the dividend distribution of Euro 45 million;
- positive currency translation differences of Euro 4 million;
- the change of Euro 9 million in the share-based compensation reserve linked to the stock option
plan;
- the negative post-tax change of Euro 25 million in actuarial gains on employee benefits;
- the negative post-tax change of Euro 3 million in the fair value of derivatives designated as cash flow
hedges;
- the negative amount of Euro 12 million for changes in the scope of consolidation, of which Euro 9
million following completion of the squeeze-out, under art. 2:359c of the Dutch Civil Code, to
purchase the 478,878 ordinary shares in Draka Holding N.V. that did not accept the public mixed
exchange and cash offer for all the ordinary shares in Draka Holding N.V., Euro 2 million for the
purchase of the remaining 30% of Draktel Optical Fibre S.A. and Euro 1 million for the purchase of
the remaining 25% of Neva Cables Ltd;
- the release of Euro 3 million against a put option reported at 31 December 2011 after acquiring the
non-controlling interest in Draktel Optical Fibre S.A..
At 30 June 2012 the share capital of Prysmian S.p.A. comprises 214,430,972 shares with a total value of
Euro 21,443,097.20.

68
PRYSMIAN GROUP l CONSOLIDATED FINANCIAL STATEMENTS AND EXPLANATORY NOTES
Ordinary shares Treasury shares Total
Balance at 31 December 2010 182,029,302 (3,028,500) 179,000,802
Capital increase (1) 32,364,179 - 32,364,179
Treasury shares - (10,669) (10,669)
Balance at 31 December 2011 214,393,481 (3,039,169) 211,354,312
Ordinary shares Treasury shares TotalBalance at 31 December 2011 214,393,481 (3,039,169) 211,354,312
Capital increase (2) 37,491 - 37,491
Treasury shares - - -
Balance at 30 June 2012 214,430,972 (3,039,169) 211,391,803
Number
of shares
Total
nominal
value
(in Euro)
% of
total
share
capital
Average
unit
value
(in Euro)
Total
carrying
value
(in Euro)
At 31 December 2010 3,028,500 302,850 1.66% 9.965 30,179,003
- Business combinations 10,669 1,067 - 9.380 100,075
- Purchases - - - - -
- Sales - - - - -
At 31 December 2011 3,039,169 303,917 1.42% 9.963 30,279,078
- Purchases - - - - -
- Sales - - - -
At 30 June 2012 3,039,169 303,917 1.42% 9.963 30,279,078
Movements in the ordinary shares of Prysmian S.p.A. are as follows:
(1) Capital increases relating to the Draka Group acquisition (31,824,570 shares) and to the exercise of part of the options under the
Stock Option Plan 2007-2012.(2)
Capital increases relating to the exercise of part of the options under the Stock Option Plan 2007-2012.
Treasury shares
The treasury shares held at the beginning of 2011 were acquired under the shareholders' resolution dated 15
April 2008, which gave the Board of Directors the authority for an 18-month period to buy up to 18 million
shares. This period was subsequently extended to October 2010 under a resolution adopted on 9 April 2009.
During 2011 the number of treasury shares increased following the acquisition of Draka Holding N.V., which
holds 10,669 Prysmian S.p.A. shares.
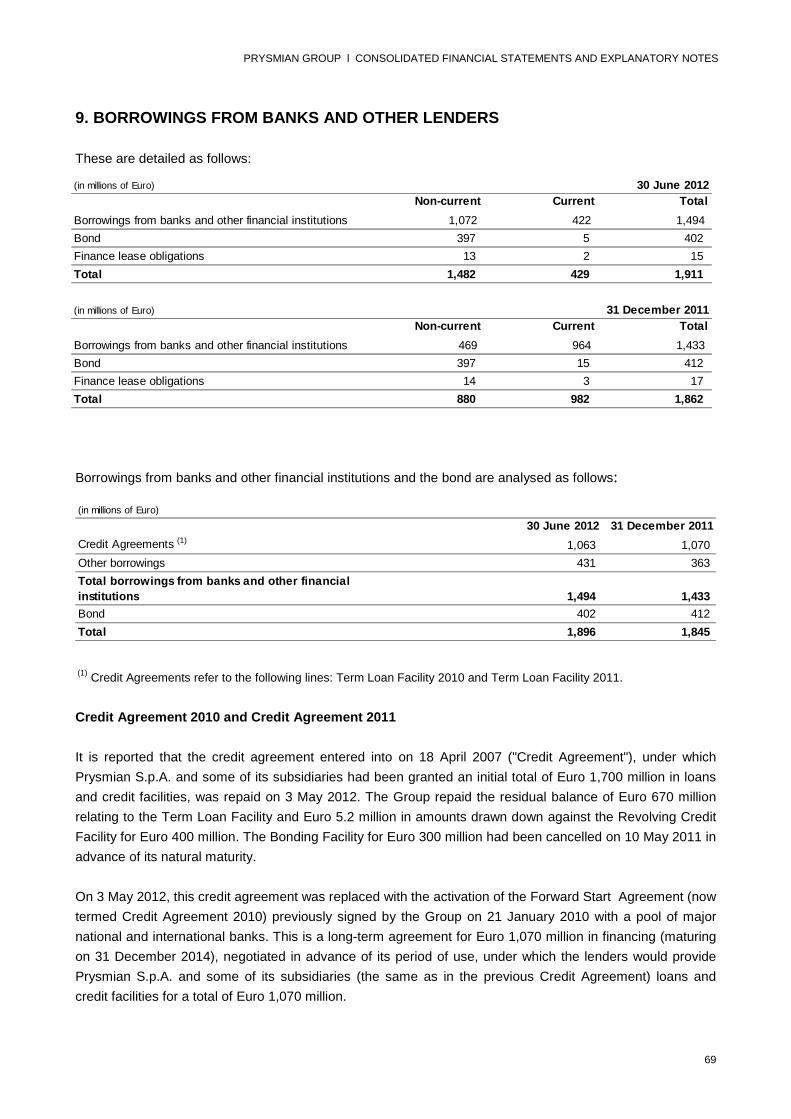
69
PRYSMIAN GROUP l CONSOLIDATED FINANCIAL STATEMENTS AND EXPLANATORY NOTES
(in millions of Euro) 30 June 2012
Non-current Current Total
1,072 422 1,494
Bond 397 5 402
Finance lease obligations 13 2 15
Total 1,482 429 1,911
(in millions of Euro)
Non-current Current Total
469 964 1,433
Bond 397 15 412
Finance lease obligations 14 3 17
Total 880 982 1,862
Borrowings from banks and other financial institutions
31 December 2011
Borrowings from banks and other financial institutions
(in millions of Euro)
30 June 2012 31 December 2011
Credit Agreements (1)1,063 1,070
Other borrowings 431 363
1,494 1,433
Bond 402 412
Total 1,896 1,845
Total borrowings from banks and other financial
institutions
9. BORROWINGS FROM BANKS AND OTHER LENDERS
These are detailed as follows:
Borrowings from banks and other financial institutions and the bond are analysed as follows:
(1)Credit Agreements refer to the following lines: Term Loan Facility 2010 and Term Loan Facility 2011.
Credit Agreement 2010 and Credit Agreement 2011
It is reported that the credit agreement entered into on 18 April 2007 ("Credit Agreement"), under which
Prysmian S.p.A. and some of its subsidiaries had been granted an initial total of Euro 1,700 million in loans
and credit facilities, was repaid on 3 May 2012. The Group repaid the residual balance of Euro 670 million
relating to the Term Loan Facility and Euro 5.2 million in amounts drawn down against the Revolving Credit
Facility for Euro 400 million. The Bonding Facility for Euro 300 million had been cancelled on 10 May 2011 in
advance of its natural maturity.
On 3 May 2012, this credit agreement was replaced with the activation of the Forward Start Agreement (now
termed Credit Agreement 2010) previously signed by the Group on 21 January 2010 with a pool of major
national and international banks. This is a long-term agreement for Euro 1,070 million in financing (maturing
on 31 December 2014), negotiated in advance of its period of use, under which the lenders would provide
Prysmian S.p.A. and some of its subsidiaries (the same as in the previous Credit Agreement) loans and
credit facilities for a total of Euro 1,070 million.

70
PRYSMIAN GROUP l CONSOLIDATED FINANCIAL STATEMENTS AND EXPLANATORY NOTES
31 May 2013 9.25%
30 November 2013 9.25%
31 May 2014 9.25%
31 December 2014 72.25%
(in millions of Euro)
Total lines Used Unused
Term Loan Facility 2010 670 (670) -
Term Loan Facility 2011 400 (400) -
Revolving Credit Facility 2010 400 (4) 396
Revolving Credit Facility 2011 400 - 400
Total Credit Agreements 1,870 (1,074) 796
Securitization 350 (149) 201
Total 2,220 (1,223) 997
(in millions of Euro)
Total lines Used Unused
Term Loan Facility 670 (670) -
Term Loan Facility 2011 400 (400) -
Revolving Credit Facility 400 (6) 394
Revolving Credit Facility 2011 400 - 400
Total Credit Agreements 1,870 (1,076) 794
Securitization 350 (111) 239
Total 2,220 (1,187) 1,033
31 December 2011
30 June 2012
(in thousands of Euro)
Term Loan Facility 2010 670,000
Revolving Credit Facility 2010 400,000
This financing agreement is split as follows:
The repayment schedule of the Term Loan under the Credit Agreement 2010 is structured as follows:
The “Credit Agreements” line also includes the Credit Agreement 2011, entered into by Prysmian on 7 March
2011 with a pool of major banks for Euro 800 million with a five-year maturity. This agreement comprises a
loan for Euro 400 million (Term Loan Facility 2011) and a revolving facility for Euro 400 million (Revolving
Credit Facility 2011). The entire amount of the Term Loan Facility 2011 is scheduled for repayment on 7
March 2016.
The following table summarises the committed lines available to the Group at 30 June 2012 and 31
December 2011:
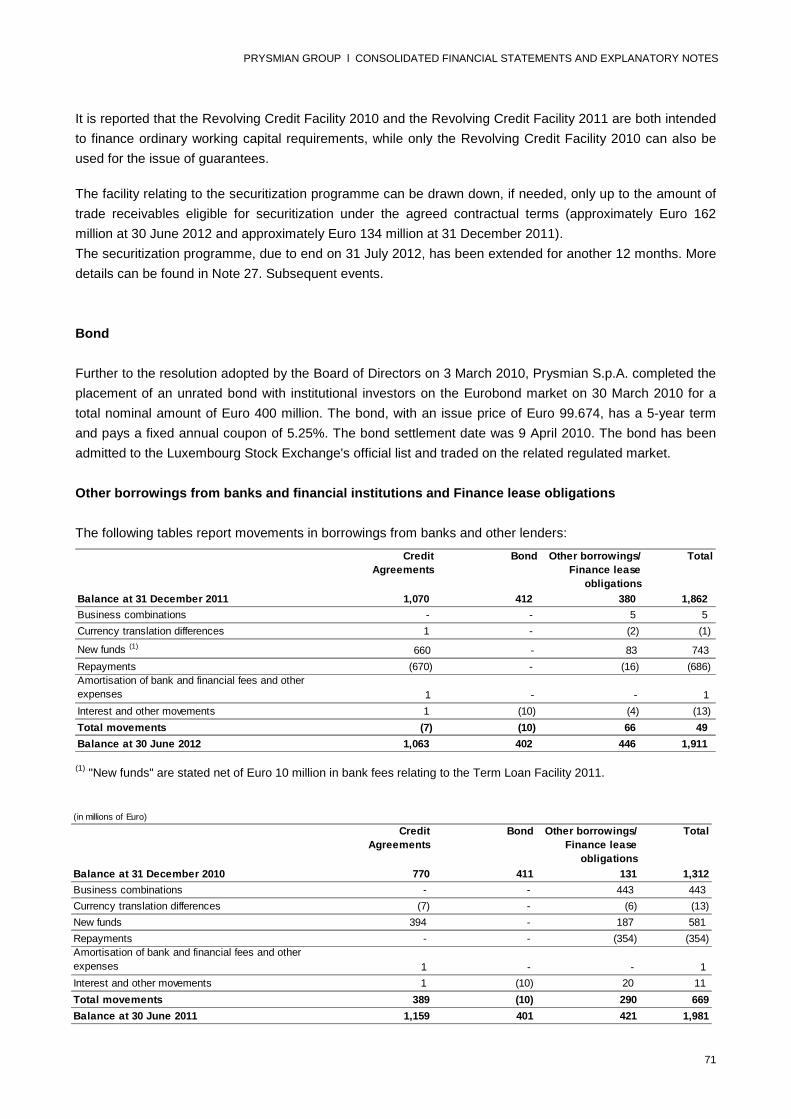
71
PRYSMIAN GROUP l CONSOLIDATED FINANCIAL STATEMENTS AND EXPLANATORY NOTES
Credit
Agreements
Bond Other borrowings/
Finance lease
obligations
Total
Balance at 31 December 2011 1,070 412 380 1,862
Business combinations - - 5 5
Currency translation differences 1 - (2) (1)
New funds (1)660 - 83 743
Repayments (670) - (16) (686)
Amortisation of bank and financial fees and other
expenses 1 - - 1
Interest and other movements 1 (10) (4) (13)
Total movements (7) (10) 66 49
Balance at 30 June 2012 1,063 402 446 1,911
(in millions of Euro)
Credit
Agreements
Bond Other borrowings/
Finance lease
obligations
Total
Balance at 31 December 2010 770 411 131 1,312
Business combinations - - 443 443
Currency translation differences (7) - (6) (13)
New funds 394 - 187 581
Repayments - - (354) (354)
Amortisation of bank and financial fees and other
expenses 1 - - 1
Interest and other movements 1 (10) 20 11
Total movements 389 (10) 290 669
Balance at 30 June 2011 1,159 401 421 1,981
It is reported that the Revolving Credit Facility 2010 and the Revolving Credit Facility 2011 are both intended
to finance ordinary working capital requirements, while only the Revolving Credit Facility 2010 can also be
used for the issue of guarantees.
The facility relating to the securitization programme can be drawn down, if needed, only up to the amount of
trade receivables eligible for securitization under the agreed contractual terms (approximately Euro 162
million at 30 June 2012 and approximately Euro 134 million at 31 December 2011).
The securitization programme, due to end on 31 July 2012, has been extended for another 12 months. More
details can be found in Note 27. Subsequent events.
Bond
Further to the resolution adopted by the Board of Directors on 3 March 2010, Prysmian S.p.A. completed the
placement of an unrated bond with institutional investors on the Eurobond market on 30 March 2010 for a
total nominal amount of Euro 400 million. The bond, with an issue price of Euro 99.674, has a 5-year term
and pays a fixed annual coupon of 5.25%. The bond settlement date was 9 April 2010. The bond has been
admitted to the Luxembourg Stock Exchange's official list and traded on the related regulated market.
Other borrowings from banks and financial institutions and Finance lease obligations
The following tables report movements in borrowings from banks and other lenders:
(1)"New funds" are stated net of Euro 10 million in bank fees relating to the Term Loan Facility 2011.
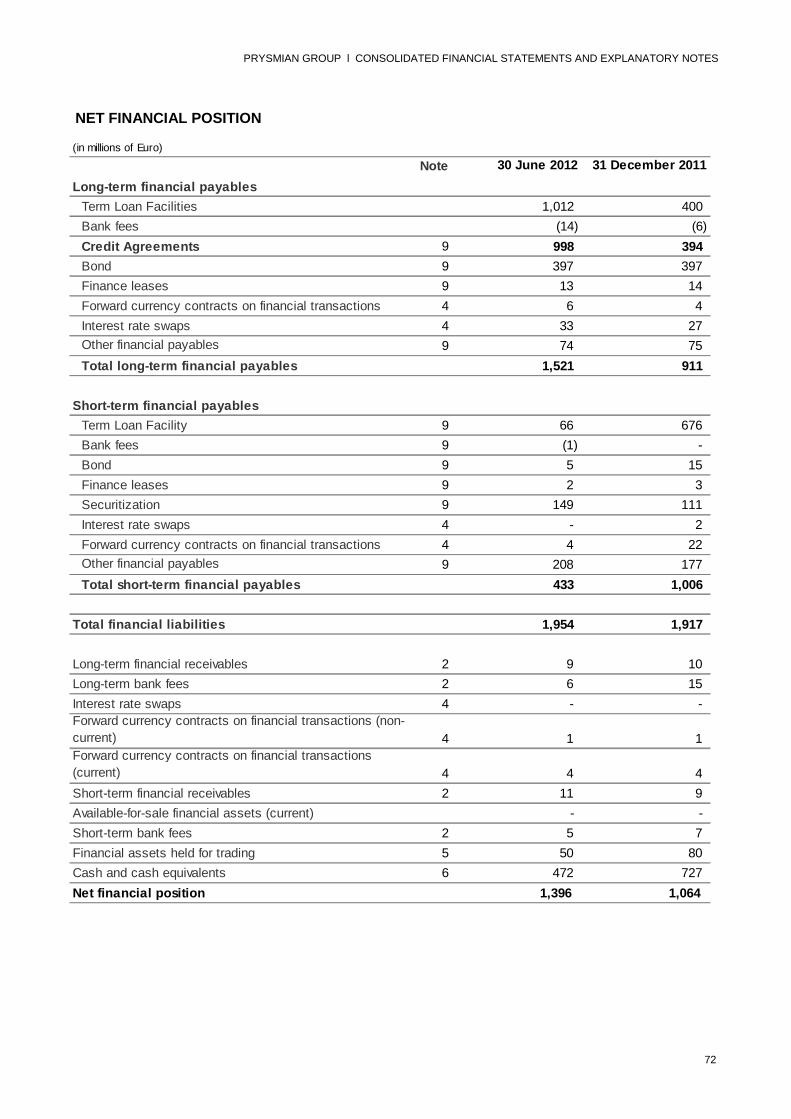
72
PRYSMIAN GROUP l CONSOLIDATED FINANCIAL STATEMENTS AND EXPLANATORY NOTES
(in millions of Euro)
Note 30 June 2012 31 December 2011
Long-term financial payables
Term Loan Facilities 1,012 400
Bank fees (14) (6)
Credit Agreements 9 998 394
Bond 9 397 397
Finance leases 9 13 14
Forward currency contracts on financial transactions 4 6 4
Interest rate swaps 4 33 27
Other financial payables 9 74 75
Total long-term financial payables 1,521 911
Short-term financial payables
Term Loan Facility 9 66 676
Bank fees 9 (1) -
Bond 9 5 15
Finance leases 9 2 3
Securitization 9 149 111
Interest rate swaps 4 - 2
Forward currency contracts on financial transactions 4 4 22
Other financial payables 9 208 177
Total short-term financial payables 433 1,006
Total financial liabilities 1,954 1,917
Long-term financial receivables 2 9 10
Long-term bank fees 2 6 15
Interest rate swaps 4 - -
Forward currency contracts on financial transactions (non-
current) 4 1 1
Forward currency contracts on financial transactions
(current) 4 4 4
Short-term financial receivables 2 11 9
Available-for-sale financial assets (current) - -
Short-term bank fees 2 5 7
Financial assets held for trading 5 50 80
Cash and cash equivalents 6 472 727
Net financial position 1,396 1,064
NET FINANCIAL POSITION
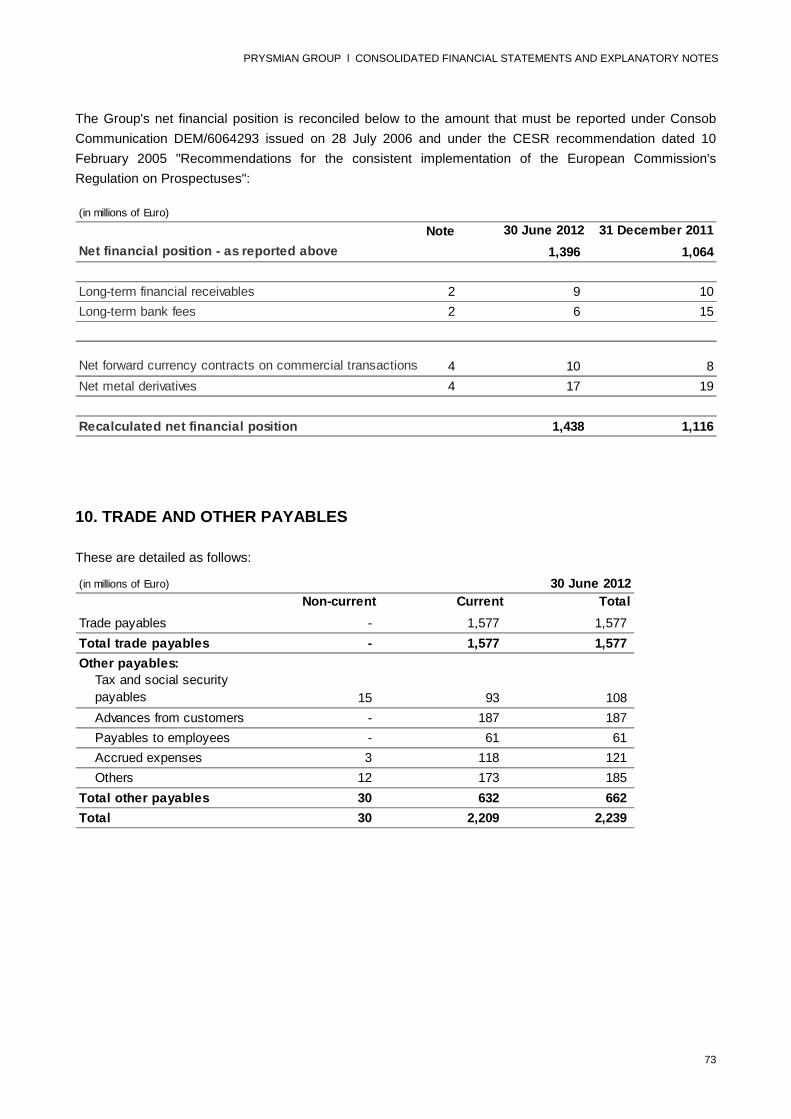
73
PRYSMIAN GROUP l CONSOLIDATED FINANCIAL STATEMENTS AND EXPLANATORY NOTES
(in millions of Euro)
Note 30 June 2012 31 December 2011
Net financial position - as reported above 1,396 1,064
Long-term financial receivables 2 9 10
Long-term bank fees 2 6 15
Net forward currency contracts on commercial transactions 4 10 8
Net metal derivatives 4 17 19
Recalculated net financial position 1,438 1,116
(in millions of Euro)
Non-current Current Total
Trade payables - 1,577 1,577
Total trade payables - 1,577 1,577
Other payables:
Tax and social security
payables 15 93 108
Advances from customers - 187 187
Payables to employees - 61 61
Accrued expenses 3 118 121
Others 12 173 185
Total other payables 30 632 662
Total 30 2,209 2,239
30 June 2012
The Group's net financial position is reconciled below to the amount that must be reported under Consob
Communication DEM/6064293 issued on 28 July 2006 and under the CESR recommendation dated 10
February 2005 "Recommendations for the consistent implementation of the European Commission's
Regulation on Prospectuses":
10. TRADE AND OTHER PAYABLES
These are detailed as follows:
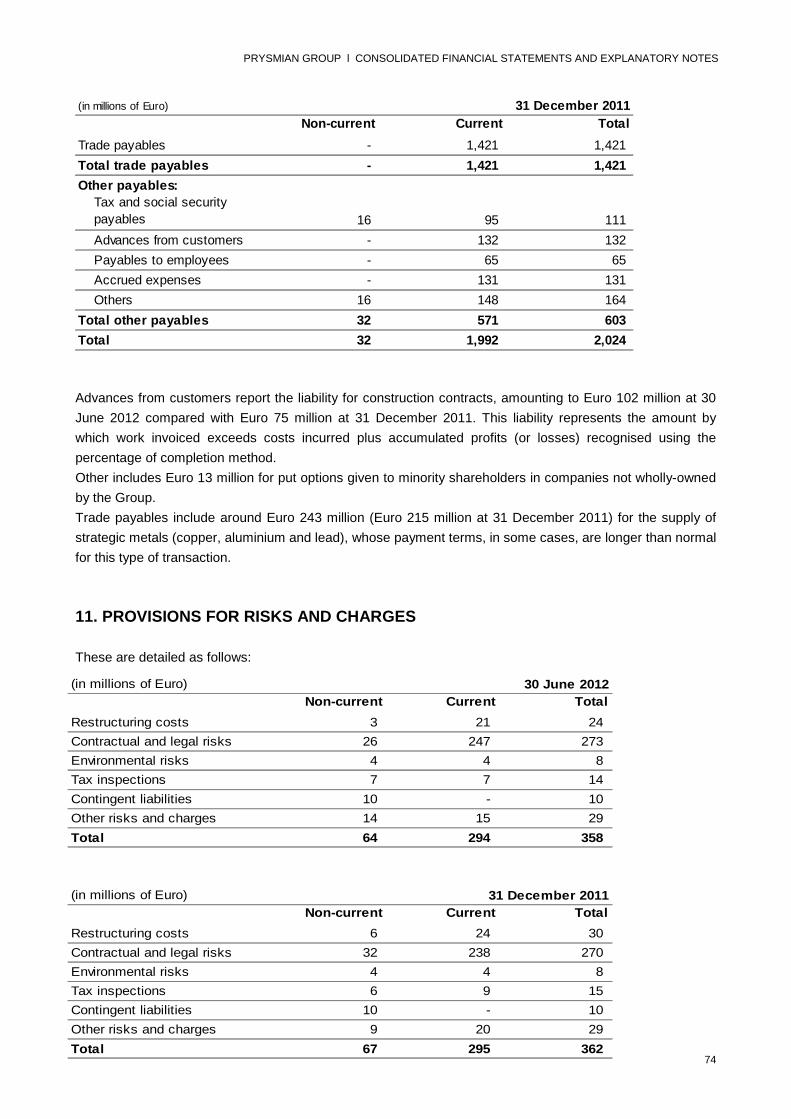
74
PRYSMIAN GROUP l CONSOLIDATED FINANCIAL STATEMENTS AND EXPLANATORY NOTES
(in millions of Euro) 30 June 2012
Non-current Current Total
Restructuring costs 3 21 24
Contractual and legal risks 26 247 273
Environmental risks 4 4 8
Tax inspections 7 7 14
Contingent liabilities 10 - 10
Other risks and charges 14 15 29
Total 64 294 358
(in millions of Euro) 31 December 2011
Non-current Current Total
Restructuring costs 6 24 30
Contractual and legal risks 32 238 270
Environmental risks 4 4 8
Tax inspections 6 9 15
Contingent liabilities 10 - 10
Other risks and charges 9 20 29
Total 67 295 362
(in millions of Euro)
Non-current Current Total
Trade payables - 1,421 1,421
Total trade payables - 1,421 1,421
Other payables:
Tax and social security
payables 16 95 111
Advances from customers - 132 132
Payables to employees - 65 65
Accrued expenses - 131 131
Others 16 148 164
Total other payables 32 571 603
Total 32 1,992 2,024
31 December 2011
Advances from customers report the liability for construction contracts, amounting to Euro 102 million at 30
June 2012 compared with Euro 75 million at 31 December 2011. This liability represents the amount by
which work invoiced exceeds costs incurred plus accumulated profits (or losses) recognised using the
percentage of completion method.
Other includes Euro 13 million for put options given to minority shareholders in companies not wholly-owned
by the Group.
Trade payables include around Euro 243 million (Euro 215 million at 31 December 2011) for the supply of
strategic metals (copper, aluminium and lead), whose payment terms, in some cases, are longer than normal
for this type of transaction.
11. PROVISIONS FOR RISKS AND CHARGES
These are detailed as follows:

75
PRYSMIAN GROUP l CONSOLIDATED FINANCIAL STATEMENTS AND EXPLANATORY NOTES
(in millions of Euro)
Restructuring
costs
Contractual and
legal risks
Environmental
risks
Tax
inspections
Contingent
liabilities
Other risks
and charges
Total
Balance at 31 December 2011 30 270 8 15 10 29 362
Increases 11 9 - 1 - 8 29
Utilisations (19) (4) - (2) - (1) (26)
Releases - (8) - - - (6) (14)
Currency translation differences - - - - - - -
Other 2 6 - - - (1) 7
Total movements (6) 3 - (1) - - (4)
Balance at 30 June 2012 24 273 8 14 10 29 358
The following table reports the movements in these provisions during the period:
The provision for restructuring costs reports a net decrease of Euro 6 million.
In particular, Euro 11 million has been recognised in the period for restructuring projects relating to certain
plants in Italy, Spain and Great Britain; Euro 19 million of this provision has been utilised mostly for
restructuring projects carried out in Germany, France, the Netherlands, Spain and the United States.
At 30 June 2012 the value of the provision for contractual and legal risks reports an increase of Euro 3
million.
In particular, the changes in this provision are: Euro 9 million of new provisions in the period, Euro 4 million
of utilisations and Euro 8 million of releases, for risks relating to contractual penalties and guarantees.
At 30 June 2012 the provision for contractual and legal risks includes Euro 211 million in respect of the
provision against the antitrust investigations in progress in various jurisdictions. This particular provision has
increased by Euro 3 million since 31 December 2011, mainly due to exchange rate movements affecting the
part of the provision in foreign currency. More specifically, the European Commission, the US Department of
Justice and the Japanese antitrust authority started an investigation in late January 2009 into several
European and Asian electrical cable manufacturers to verify the existence of alleged anti-competitive
practices in the high voltage underground and submarine cables markets. Subsequently, the Australian
Competition and Consumers Commission ("ACCC") and the New Zealand Commerce Commission also
started similar investigations. During 2011, the Canadian antitrust authority also started an investigation into
a high voltage submarine project dating back to 2006. The investigations in Japan and New Zealand ended
in previous years without any sanctions for Prysmian. The other investigations are still in progress and the
Group is fully collaborating with the relevant authorities.
In Australia, the ACCC has filed a case before the Federal Court arguing that Prysmian Cavi e Sistemi S.r.l.
(formerly Prysmian Cavi e Sistemi Energia S.r.l.) and two other companies violated antitrust rules in
connection with a high voltage underground cable project awarded in 2003. Prysmian Cavi e Sistemi S.r.l.
was officially served with this claim in April 2010 and has since filed its defence.
In Brazil, the local antitrust authority has started an investigation into several cable manufacturers, including
Prysmian, in the high voltage underground and submarine cables market (this is the only investigation for
which the Group has been unable to estimate the size of the provision).
At the start of July 2011, Prysmian received a statement of objection from the European Commission in
relation to the investigation started in January 2009 into the high voltage underground and submarine energy
cables market. This document contains the Commission's preliminary position on alleged anti-competitive
practices and does not prejudge its final decision. Prysmian has therefore had access to the Commission's
dossier and, while fully co-operating, has presented its defence against the related allegations. This past

76
PRYSMIAN GROUP l CONSOLIDATED FINANCIAL STATEMENTS AND EXPLANATORY NOTES
(in millions of Euro) 30 June 2012 31 December 2011
Pension funds 213 188
Employee indemnity liability (Italian TFR) 23 22
Medical benefit plans 29 26
Termination and other benefits 29 26
Incentive plans 14 6
Total 308 268
June was the hearing before the European Commission during which Prysmian, as well as the other
companies party to the proceedings, had the opportunity to submit its defence.
Already during 2011, in view of the developments in the European Commission investigation, management
believed that it was able to estimate the risk relating to the investigations underway in the various
jurisdictions, except for Brazil.
The amount of the provision at 30 June 2012 still represents the best estimate of this liability based on the
information currently available, even though the outcome of the pending demands in the various jurisdictions
is still uncertain.
12. EMPLOYEE BENEFIT OBLIGATIONS
These are detailed as follows:
Movements in pension funds have had an overall impact of Euro 10 million on the period's income
statement, of which Euro 5 million classified in personnel costs and Euro 5 million in finance costs.
The effect on operating income of the Monti-Fornero reform, which has lengthened working life for
employees of Italian companies, is Euro 1 million and has been classified as a non-recurring expense.
At 30 June 2012, actuarial losses of Euro 28 million before the tax effect have been recognised in equity.
More details can be found in the Consolidated Statement of Comprehensive Income.
Please refer to Note 23 for comments about incentive plans.

77
PRYSMIAN GROUP l CONSOLIDATED FINANCIAL STATEMENTS AND EXPLANATORY NOTES
1st half 2012 1st half 2011 (*)
Average number 21,661 18,981
30 June 2012 31 December 2011
Closing number 21,764 21,547
(in millions of Euro)
1st half 2012 1st half 2011
Company reorganisation (27) (12)
Antitrust (3) (200)
Draka integration costs (3) (6)
Tax inspections (3) -
Environmental remediation and other costs (1) -
Italian pensions reform (1) -
Other non-recurring expenses (5) -
Impairment of property, plant and equipment (1) -
Draka acquisition costs - (6)
Effects of Draka change of control - (2)
Release of Draka inventory step-up - (14)
Business interruption Libya - (4)
Gains on disposal of assets held for sale 1 1
Total non-recurring (expenses)/income and impairment (43) (243)
The period average headcount and period-end closing headcount are shown below:
(*)These figures have been calculated considering the Draka Group’s consolidation from 1 March 2011.
13. OPERATING INCOME
Operating income is a profit of Euro 178 million in the first six months of 2012 (compared with a loss of Euro
72 million in the first six months of 2011) and includes the following non-recurring items and impairment of
assets:

78
PRYSMIAN GROUP l CONSOLIDATED FINANCIAL STATEMENTS AND EXPLANATORY NOTES
(in millions of Euro)
1st half 2012 1st half 2011
Interest income from banks and other financial institutions 10 5
Other finance income 1 -
Finance income 11 5
Net gains on interest rate swaps - 11
Net gains on forward currency contracts 22 1
Gains on derivatives 22 12
Foreign currency exchange gains 101 78
Total finance income 134 95
(in millions of Euro)
1st half 2012 1st half 2011
Interest on syndicated loans 16 15
Interest on bond 10 10
Amortisation of bank and financial fees and other expenses 5 6
Interest costs on employee benefits 5 4
Other bank interest 17 10
Costs for undrawn credit lines 1 -
Sundry bank fees 5 5
Other non-recurring financial expenses 2 -
Other 9 8
Finance costs 70 58
Net losses on forward currency contracts - -
Losses on derivatives - -
Foreign currency exchange losses 122 99
Total finance costs 192 157
14. FINANCE INCOME AND COSTS
Finance costs are detailed as follows:
Finance income is detailed as follows:
15. TAXES
The total tax charge has been estimated on the basis of the expected tax rate for the full year. The tax rate
used for the first six months of 2012 is 30%.
The taxes of Euro 38 million calculated for the period January – June 2012 represent approximately 30% of
pre-tax profit, compared with 37.4% in the same period of 2011 (this percentage excluded the estimated
non-deductible portion of the antitrust provision).

79
PRYSMIAN GROUP l CONSOLIDATED FINANCIAL STATEMENTS AND EXPLANATORY NOTES
(in millions of Euro)
1st half 2012 1st half 2011
Net profit/(loss) attributable to owners of the parent 90 (156)
Weighted average number of ordinary shares (thousands) 211,379 205,842
Basic earnings/(loss) per share (in Euro) 0.43 (0.76)
Net profit/(loss) attributable to owners of the parent 90 (156)
Weighted average number of ordinary shares (thousands) 211,379 205,842
Adjustments for:
Dilution from incremental shares arising from exercise of stock options
(thousands) 106 410
Weighted average number of ordinary shares to calculate diluted
earnings per share (thousands) 211,485 206,252
Diluted earnings/(loss) per share (in Euro) 0.43 (0.76)
16. EARNINGS/(LOSS) PER SHARE
Basic earnings/(loss) per share have been determined by dividing the net result for the period attributable to
owners of the parent by the average number of the Company's outstanding shares. With regard to the
denominator used for calculating earnings per share, the average number of outstanding shares also
includes:
a. the shares issued following exercise of options under the Stock Option Plan, involving the issue of
546,227 shares in 2008, 688,812 shares in 2009, 794,263 shares in 2010, 539,609 shares in 2011
and 37,491 in the first six months of 2012. The options are all vested but can be exercised only in
two 30-day periods, running from the date of approving the half-year results for 2012 and from the
date of approving the proposed annual financial statements for 2012;
b. the issue of 31,824,570 shares under the capital increase for the Draka Group acquisition.
Diluted earnings/(loss) per share have been determined by taking into account, when calculating the number
of outstanding shares, the potential dilutive effect of options granted under existing Stock Option Plans.
17. CONTINGENT LIABILITIES
As a global operator, the Group is exposed to legal risks primarily, by way of example, in the areas of
product liability, environmental rules and regulations, antitrust investigations and tax matters. Outlays relating
to current or future proceedings cannot be predicted with certainty. It is possible that the outcomes of these
proceedings may give rise to costs that are not covered or not fully covered by insurance, which would
therefore have a direct effect on the Group's results.
It is also reported, with reference to the antitrust investigations in the various jurisdictions involved, that the
only jurisdiction for which Prysmian Group has been unable to estimate the related risk is Brazil.

80
PRYSMIAN GROUP l CONSOLIDATED FINANCIAL STATEMENTS AND EXPLANATORY NOTES
(in millions of Euro) 30 June 2012
Investments in
associates
Trade and other
receivables
Trade and other
payables
Employee
benefit
obligations
Financial
payables and
derivatives
classified as
liabilities
Associates 91 14 3 - -
Other related parties:
Compensation of directors, statutory auditors and
key management personnel - - 4 4 -
Non-controlling interests - - 13 - -
Total 91 14 20 4 -
(in millions of Euro) 31 December 2011
Investments in
associates
Trade and other
receivables
Trade and other
payables
Employee
benefit
obligations
Financial
payables and
derivatives
classified as
liabilities
Associates 87 8 12 - -
Other related parties:
Compensation of directors, statutory auditors and
key management personnel - - 5 1 -
Non-controlling interests - - 16 - -
Total 87 8 33 1 -
18. RECEIVABLES FACTORING
The Group has factored trade receivables without recourse. The amount of receivables factored but not yet
paid by customers was Euro 152 million at 30 June 2012 (Euro 147 million at 30 June 2011 and Euro 178
million at 31 December 2011).
19. SEASONALITY
The Group's business features a certain degree of seasonality in its revenues, which are usually higher in
the second and third quarters. This is due to the fact that utilities projects in the northern hemisphere are
mostly concentrated in the warmer months of the year. The Group's level of debt is generally higher in the
period May-July, with funds being absorbed by higher working capital.
20. RELATED PARTY TRANSACTIONS
Transactions between Prysmian S.p.A. and its subsidiaries and associates mainly refer to:
trade relations involving intercompany purchases and sales of raw materials and finished goods;
services (technical, organisational and general) provided by head office to subsidiaries worldwide;
financial relations maintained by Group treasury companies on behalf of, and with, Group companies.
All the above transactions form part of the Group's continuing operations.
The following tables summarise related party transactions during the six months ended 30 June 2012:

81
PRYSMIAN GROUP l CONSOLIDATED FINANCIAL STATEMENTS AND EXPLANATORY NOTES
(in millions of Euro) 1st half 2012
Share of income
from investments in
associates and
dividends from other
companies
Sales of goods
and services
and other
income
Personnel
costs
Cost of goods
and services
Finance
income/(costs)
Associates 8 29 - 5 1
Other related parties:
Compensation of directors, statutory auditors and
key management personnel - - 8 - -
Total 8 29 8 5 1
(in millions of Euro) 1st half 2011
Share of income
from investments in
associates and
dividends from other
companies
Sales of goods
and services
and other
income
Personnel
costs
Cost of goods
and services
Finance
income/(costs)
Associates 4 14 - 3 -
Other related parties:
Compensation of directors, statutory auditors and
key management personnel - - 5 - -
Total 4 14 5 3 -
Transactions with associates
Trade and other payables refer to goods and services provided in the ordinary course of the Group's
business. Trade and other receivables refer to transactions carried out in the ordinary course of the Group's
business.
Transactions with non-controlling interests
These refer to balances and transactions with minority shareholders in companies not wholly owned by the
Group.
Compensation of Directors, Statutory Auditors and Key Management Personnel
The compensation of the Directors, Statutory Auditors and Key Management Personnel amounts to Euro 8
million at 30 June 2012 (Euro 5 million at 30 June 2011).
The liability for compensation owed to Directors, Statutory Auditors and Key Management Personnel is Euro
8 million at 30 June 2012 (Euro 6 million at 31 December 2011).
21. ATYPICAL AND/OR UNUSUAL TRANSACTIONS
In accordance with the disclosure required by Consob Communication n. DEM/6064293 dated 28 July 2006,
it is reported that no atypical and/or unusual transactions were carried out in the first six months of 2012.
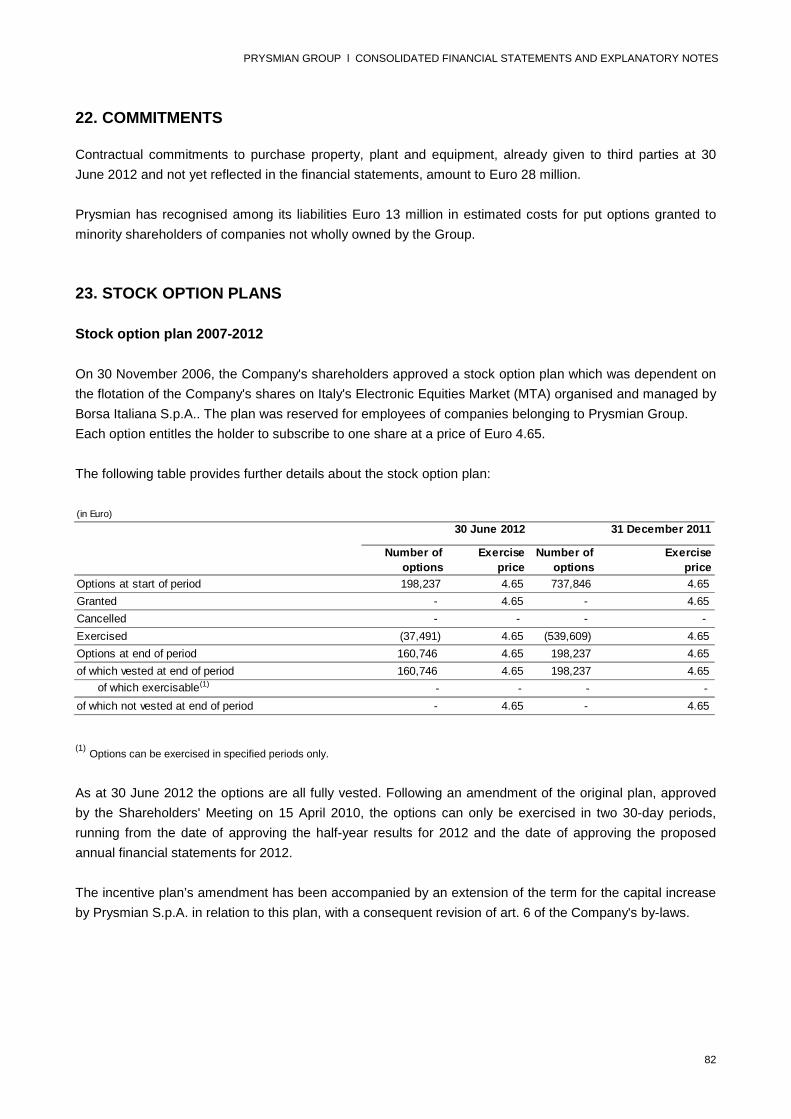
82
PRYSMIAN GROUP l CONSOLIDATED FINANCIAL STATEMENTS AND EXPLANATORY NOTES
(in Euro)
Number of
options
Exercise
price
Number of
options
Exercise
price
Options at start of period 198,237 4.65 737,846 4.65
Granted - 4.65 - 4.65
Cancelled - - - -
Exercised (37,491) 4.65 (539,609) 4.65
Options at end of period 160,746 4.65 198,237 4.65
of which vested at end of period 160,746 4.65 198,237 4.65
of which exercisable(1) - - - -
of which not vested at end of period - 4.65 - 4.65
30 June 2012 31 December 2011
22. COMMITMENTS
Contractual commitments to purchase property, plant and equipment, already given to third parties at 30
June 2012 and not yet reflected in the financial statements, amount to Euro 28 million.
Prysmian has recognised among its liabilities Euro 13 million in estimated costs for put options granted to
minority shareholders of companies not wholly owned by the Group.
23. STOCK OPTION PLANS
Stock option plan 2007-2012
On 30 November 2006, the Company's shareholders approved a stock option plan which was dependent on
the flotation of the Company's shares on Italy's Electronic Equities Market (MTA) organised and managed by
Borsa Italiana S.p.A.. The plan was reserved for employees of companies belonging to Prysmian Group.
Each option entitles the holder to subscribe to one share at a price of Euro 4.65.
The following table provides further details about the stock option plan:
(1)Options can be exercised in specified periods only.
As at 30 June 2012 the options are all fully vested. Following an amendment of the original plan, approved
by the Shareholders' Meeting on 15 April 2010, the options can only be exercised in two 30-day periods,
running from the date of approving the half-year results for 2012 and the date of approving the proposed
annual financial statements for 2012.
The incentive plan’s amendment has been accompanied by an extension of the term for the capital increase
by Prysmian S.p.A. in relation to this plan, with a consequent revision of art. 6 of the Company's by-laws.

83
PRYSMIAN GROUP l CONSOLIDATED FINANCIAL STATEMENTS AND EXPLANATORY NOTES
Long-term incentive plan 2011-2013
On 14 April 2011, the Ordinary Shareholders' Meeting of Prysmian S.p.A. approved, pursuant to art. 114-bis
of Legislative Decree 58/98, a long-term incentive plan for the period 2011-2013 for employees of the
Prysmian Group, including certain members of the Board of Directors of Prysmian S.p.A., and granted the
Board of Directors the necessary authority to establish and execute the plan. The plan's purpose is to
incentivise the process of integration following Prysmian's acquisition of the Draka Group, and is conditional
upon the achievement of performance targets, as detailed in the specific information memorandum.
The plan involves the participation of around 290 employees of group companies in Italy and abroad viewed
as key resources, and divides them into three categories, to whom the shares will be granted in the following
proportions:
CEO: to whom approximately 7.70% of the rights to receive Prysmian S.p.A. shares have been
allotted.
Senior Management: this category has 44 participants who hold key positions within the Group
(including the Directors of Prysmian S.p.A. who hold the positions of Chief Financial Officer, Energy
Business Senior Vice President and Chief Strategic Officer), to whom 41.64% of the total rights to
receive Prysmian shares have been allotted.
Executives: this category has 245 participants who belong to the various operating units and
businesses around the world, to whom 50.66% of the total rights to receive Prysmian shares have
been allotted.
The plan establishes that the number of options granted will depend on the achievement of common
business and financial performance objectives for all the participants.
The plan establishes that the participants' right to exercise the allotted options depends on achievement of
the Target (being a minimum performance objective of at least Euro 1.75 billion in cumulative Adj. EBITDA
for the Group in the period 2011-2013, assuming the same group perimeter) as well as continuation of a
professional relationship with the Group up until 31 December 2013. The plan also establishes an upper limit
for Adj. EBITDA as the Target plus 20% (ie. Euro 2.1 billion), assuming the same group perimeter, that will
determine the exercisability of the maximum number of options granted to and exercisable by each
participant.
Access to the plan has also been made conditional upon each participant's acceptance that part of their
annual bonus will be co-invested, if achieved and payable in relation to financial years 2011 and 2012.
The allotted options carry the right to receive or subscribe to ordinary shares in Prysmian S.p.A., the Parent
Company. These shares may partly comprise treasury shares and partly new issue shares, obtained through
a capital increase that excludes pre-emptive rights under art. 2441, par. 8 of the Italian Civil Code. Such a
capital increase, involving the issue of up to 2,131,500 new ordinary shares of nominal value Euro 0.10
each, for a maximum amount of Euro 213,150, was approved by the shareholders in the extraordinary
session of their meeting on 14 April 2011. The shares obtained from the Company's holding of treasury
shares will be allotted for zero consideration, while the shares obtained from the above capital increase will
be allotted to participants upon payment of an exercise price corresponding to the nominal value of the
Company's shares.
In accordance with IFRS 2, for both new issue and treasury shares, the options granted have been
measured at fair value on their grant date.
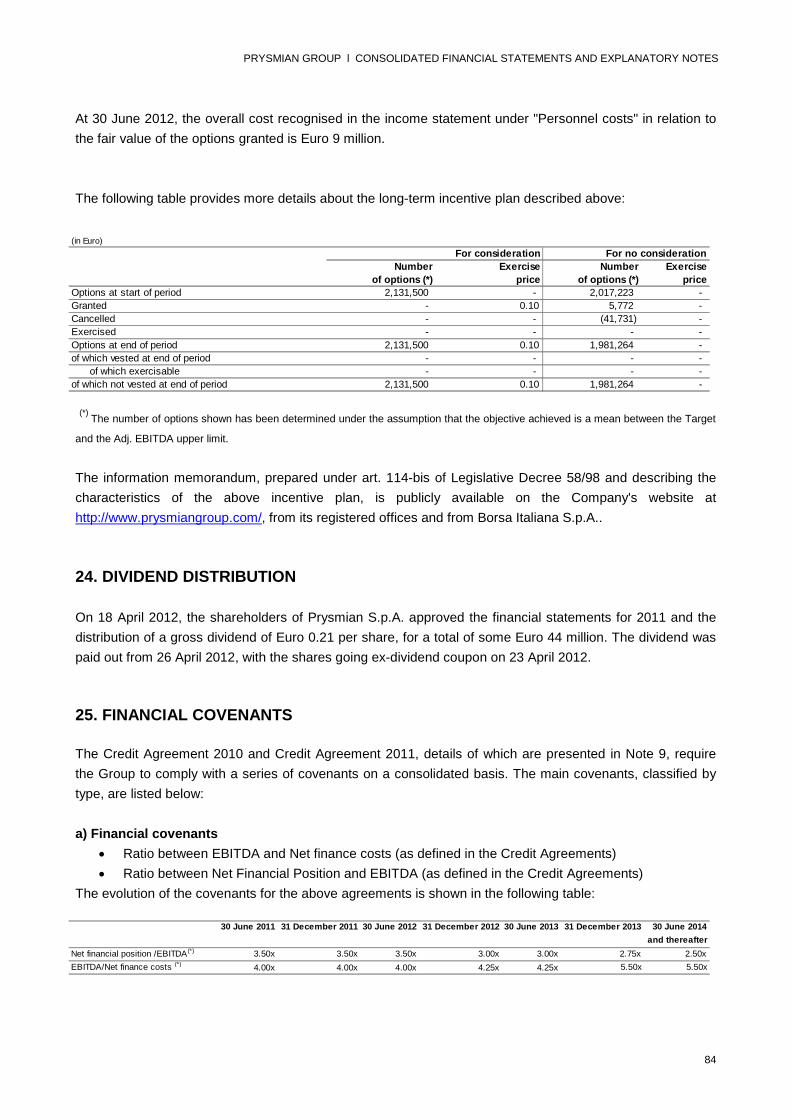
84
PRYSMIAN GROUP l CONSOLIDATED FINANCIAL STATEMENTS AND EXPLANATORY NOTES
(in Euro)
Number
of options (*)
Exercise
price
Number
of options (*)
Exercise
price
Options at start of period 2,131,500 - 2,017,223 -
Granted - 0.10 5,772 -
Cancelled - - (41,731) -
Exercised - - - -
Options at end of period 2,131,500 0.10 1,981,264 -
of which vested at end of period - - - -
of which exercisable - - - -
of which not vested at end of period 2,131,500 0.10 1,981,264 -
For consideration For no consideration
30 June 2011 31 December 2011 30 June 2012 31 December 2012 30 June 2013 31 December 2013 30 June 2014
and thereafter
Net financial position /EBITDA(*) 3.50x 3.50x 3.50x 3.00x 3.00x 2.75x 2.50x
EBITDA/Net finance costs (*) 4.00x 4.00x 4.00x 4.25x 4.25x 5.50x 5.50x
At 30 June 2012, the overall cost recognised in the income statement under "Personnel costs" in relation to
the fair value of the options granted is Euro 9 million.
The following table provides more details about the long-term incentive plan described above:
(*)The number of options shown has been determined under the assumption that the objective achieved is a mean between the Target
and the Adj. EBITDA upper limit.
The information memorandum, prepared under art. 114-bis of Legislative Decree 58/98 and describing the
characteristics of the above incentive plan, is publicly available on the Company's website at
http://www.prysmiangroup.com/, from its registered offices and from Borsa Italiana S.p.A..
24. DIVIDEND DISTRIBUTION
On 18 April 2012, the shareholders of Prysmian S.p.A. approved the financial statements for 2011 and the
distribution of a gross dividend of Euro 0.21 per share, for a total of some Euro 44 million. The dividend was
paid out from 26 April 2012, with the shares going ex-dividend coupon on 23 April 2012.
25. FINANCIAL COVENANTS
The Credit Agreement 2010 and Credit Agreement 2011, details of which are presented in Note 9, require
the Group to comply with a series of covenants on a consolidated basis. The main covenants, classified by
type, are listed below:
a) Financial covenants
Ratio between EBITDA and Net finance costs (as defined in the Credit Agreements)
Ratio between Net Financial Position and EBITDA (as defined in the Credit Agreements)
The evolution of the covenants for the above agreements is shown in the following table:
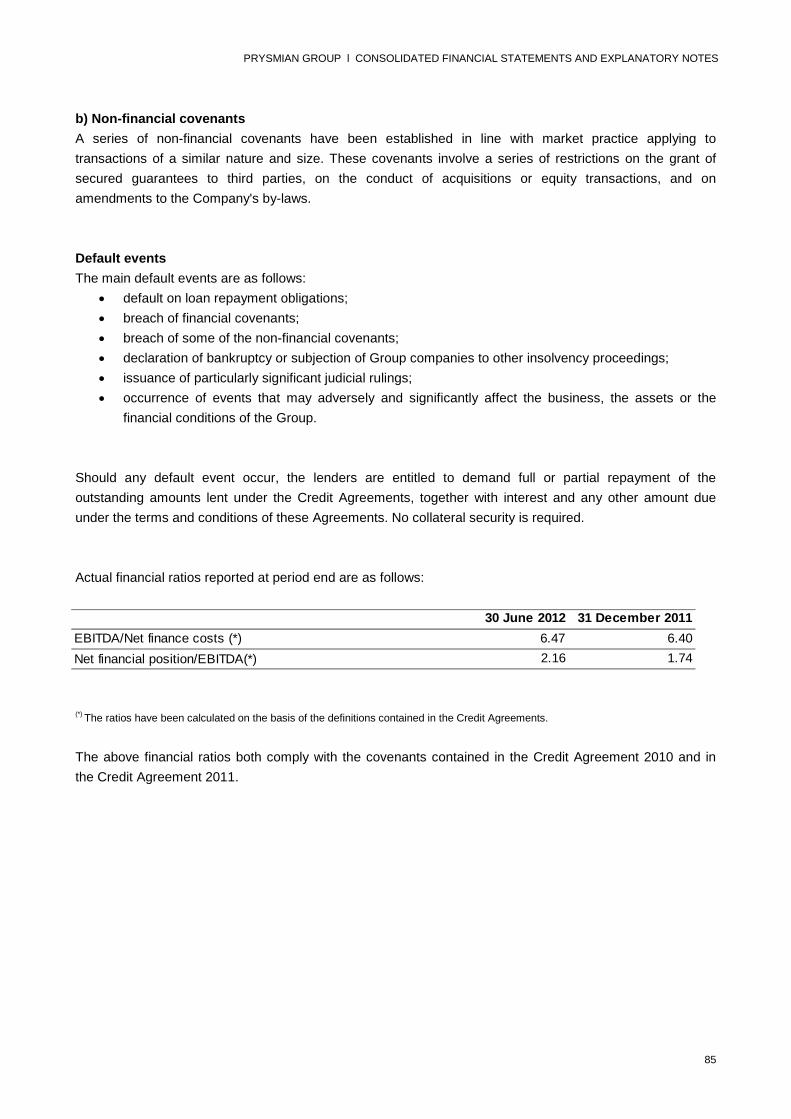
85
PRYSMIAN GROUP l CONSOLIDATED FINANCIAL STATEMENTS AND EXPLANATORY NOTES
30 June 2012 31 December 2011
EBITDA/Net finance costs (*) 6.47 6.40
Net financial position/EBITDA(*) 2.16 1.74
b) Non-financial covenants
A series of non-financial covenants have been established in line with market practice applying to
transactions of a similar nature and size. These covenants involve a series of restrictions on the grant of
secured guarantees to third parties, on the conduct of acquisitions or equity transactions, and on
amendments to the Company's by-laws.
Default events
The main default events are as follows:
default on loan repayment obligations;
breach of financial covenants;
breach of some of the non-financial covenants;
declaration of bankruptcy or subjection of Group companies to other insolvency proceedings;
issuance of particularly significant judicial rulings;
occurrence of events that may adversely and significantly affect the business, the assets or the
financial conditions of the Group.
Should any default event occur, the lenders are entitled to demand full or partial repayment of the
outstanding amounts lent under the Credit Agreements, together with interest and any other amount due
under the terms and conditions of these Agreements. No collateral security is required.
Actual financial ratios reported at period end are as follows:
(*) The ratios have been calculated on the basis of the definitions contained in the Credit Agreements.
The above financial ratios both comply with the covenants contained in the Credit Agreement 2010 and in
the Credit Agreement 2011.
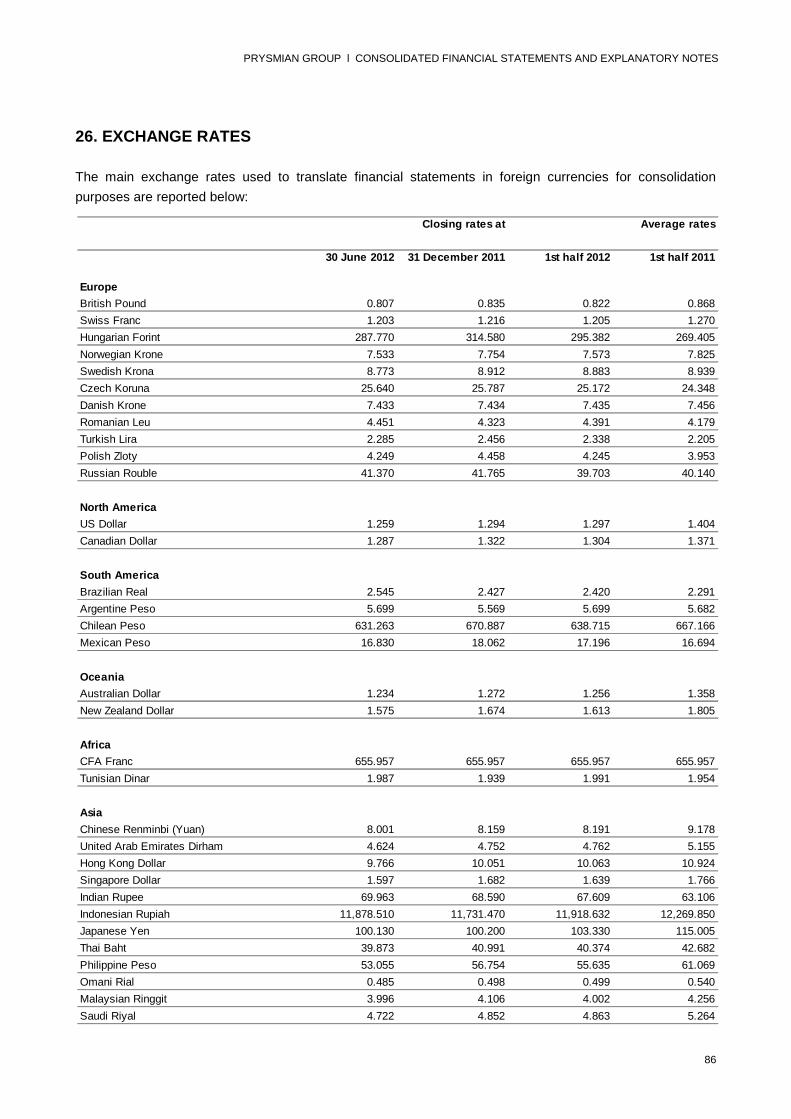
86
PRYSMIAN GROUP l CONSOLIDATED FINANCIAL STATEMENTS AND EXPLANATORY NOTES
Closing rates at Average rates
30 June 2012 31 December 2011 1st half 2012 1st half 2011
Europe
British Pound 0.807 0.835 0.822 0.868
Swiss Franc 1.203 1.216 1.205 1.270
Hungarian Forint 287.770 314.580 295.382 269.405
Norwegian Krone 7.533 7.754 7.573 7.825
Swedish Krona 8.773 8.912 8.883 8.939
Czech Koruna 25.640 25.787 25.172 24.348
Danish Krone 7.433 7.434 7.435 7.456
Romanian Leu 4.451 4.323 4.391 4.179
Turkish Lira 2.285 2.456 2.338 2.205
Polish Zloty 4.249 4.458 4.245 3.953
Russian Rouble 41.370 41.765 39.703 40.140
North America
US Dollar 1.259 1.294 1.297 1.404
Canadian Dollar 1.287 1.322 1.304 1.371
South America
Brazilian Real 2.545 2.427 2.420 2.291
Argentine Peso 5.699 5.569 5.699 5.682
Chilean Peso 631.263 670.887 638.715 667.166
Mexican Peso 16.830 18.062 17.196 16.694
Oceania
Australian Dollar 1.234 1.272 1.256 1.358
New Zealand Dollar 1.575 1.674 1.613 1.805
Africa
CFA Franc 655.957 655.957 655.957 655.957
Tunisian Dinar 1.987 1.939 1.991 1.954
Asia
Chinese Renminbi (Yuan) 8.001 8.159 8.191 9.178
United Arab Emirates Dirham 4.624 4.752 4.762 5.155
Hong Kong Dollar 9.766 10.051 10.063 10.924
Singapore Dollar 1.597 1.682 1.639 1.766
Indian Rupee 69.963 68.590 67.609 63.106
Indonesian Rupiah 11,878.510 11,731.470 11,918.632 12,269.850
Japanese Yen 100.130 100.200 103.330 115.005
Thai Baht 39.873 40.991 40.374 42.682
Philippine Peso 53.055 56.754 55.635 61.069
Omani Rial 0.485 0.498 0.499 0.540
Malaysian Ringgit 3.996 4.106 4.002 4.256
Saudi Riyal 4.722 4.852 4.863 5.264
26. EXCHANGE RATES
The main exchange rates used to translate financial statements in foreign currencies for consolidation
purposes are reported below:

87
PRYSMIAN GROUP l CONSOLIDATED FINANCIAL STATEMENTS AND EXPLANATORY NOTES
27. SUBSEQUENT EVENTS
On 26 July 2012, the securitization programme , due to end on 31 July 2012, was extended for another 12
months and the amount of the related credit facility reduced to Euro 150 million, consistent with the amount
of trade receivables eligible for securitization under the agreed contractual terms.
********
Milan, 7 August 2012
ON BEHALF OF THE BOARD OF DIRECTORS
THE CHAIRMAN
Massimo Tononi

88
PRYSMIAN GROUP l CONSOLIDATED FINANCIAL STATEMENTS AND EXPLANATORY NOTES
Legal name Office Currency Share capital Direct parent company
Europe
Austria
Prysmian OEKW GmbH Vienna Euro 2,053,008 100.00% Prysmian Cavi e Sistemi S.r.l.
Draka Comteq Austria GmbH Vienna Euro 54,505 100.00% Draka Comteq Germany GmbH & Co. KG
Belgium
Draka Belgium N.V. Leuven Euro 61,973 98.52% Draka Holding N.V.
1.48% Draka Kabel B.V.
Denmark
Draka Denmark Copper Cable A/S Brøndby Danish Krone 5,000,000 100.00% Draka Denmark Holding A/S
Draka Comteq Denmark A/S Brøndby Danish Krone 40,000,000 100.00% Draka Denmark Holding A/S
Draka Denmark Holding A/S Brøndby Danish Krone 88,734,000 100.00% Draka Holding N.V.
Estonia
AS Draka Keila Cables Keila Euro 1,661,703 66.00% Draka NK Cables OY
34.00% Third parties
Finland
Prysmian Cables and Systems OY Kirkkonummi Euro 2,000,000 100.00% Prysmian Cavi e Sistemi S.r.l.
Draka NK Cables OY Helsinki Euro 16,008,000 100.00% Draka Holding N.V.
Epictetus OY Helsinki Euro 2,523 100.00% Draka NK Cables OY
Draka Comteq Finland OY Helsinki Euro 100,000 100.00% Draka Comteq B.V.
France
Prysmian (French) Holdings S.A.S. Paron de Sens Euro 173,487,250 100.00% Prysmian Cavi e Sistemi S.r.l.
GSCP Athena (French) Holdings II S.A.S. Paron de Sens Euro 37,000 100.00% Prysmian (French) Holdings S.A.S.
Prysmian Cables et Systèmes France S.A.S. Paron de Sens Euro 136,800,000 100.00% Prysmian (French) Holdings S.A.S.
Draka Comteq France Argenteuil Euro 246,554,316 100.00% Draka France S.A.S.
Draka Fileca S.A.S. Sainte Geneviève Euro 5,439,700 100.00% Draka France S.A.S.
Draka Paricable S.A.S. Sainte Geneviève Euro 5,177,985 100.00% Draka France S.A.S.
Draka France S.A.S. Marne La Vallée Euro 120,041,700 100.00% Draka Holding N.V.
Germany
Prysmian Kabel und Systeme GmbH Berlin Euro 15,000,000 93.75% Draka Cable Wuppertal GmbH
6.25% Prysmian S.p.A.
Bergmann Kabel und Leitungen GmbH Schwerin Euro 1,022,600 100.00% Prysmian Kabel und Systeme GmbH
Prysmian Unterstuetzungseinrichtung Lynen GmbH Eschweiler Deutsche Mark 50,000 100.00% Prysmian Kabel und Systeme GmbH
Draka Cable Wuppertal GmbH Wuppertal Euro 25,000 100.00% Draka Deutschland GmbH
Draka Comteq Berlin GmbH & Co.KG Berlin Deutsche Mark 46,000,000 50.10% NKF Participatie B.V.
49.90% Draka Deutschland Vierte Beteiligungs- GmbH
Draka Comteq Germany Verwaltungs GmbH Koln Euro 25,000 100.00% Draka Comteq BV
Draka Comteq Germany GmbH & Co.KG Koln Euro 26,000 100.00% Draka Comteq B.V.
Draka Comteq Germany Holding GmbH Koln Euro 25,000 100.00% Draka Comteq BV
Draka Deutschland Erste Beteiligungs- GmbH Wuppertal Euro 25,000 100.00% Beheer- en Beleggingsmaatschappij De Vaartweg B.V.
Draka Deutschland GmbH Wuppertal Euro 25,000 90.00% Draka Deutschland Erste Beteiligungs- GmbH
10.00% Draka Deutschland Zweite Beteiligungs- GmbH
% ownership
SCOPE OF CONSOLIDATION – APPENDIX A
The following companies have been consolidated line-by-line:

89
PRYSMIAN GROUP l CONSOLIDATED FINANCIAL STATEMENTS AND EXPLANATORY NOTES
Legal name Office Currency Share capital Direct parent company
Draka Deutschland Verwaltungs- GmbH Wuppertal Deutsche Mark 50,000 100.00% Draka Cable Wuppertal GmbH
Draka Deutschland Vierte Beteiligungs- GmbH Wuppertal Euro 25,000 100.00% Draka Deutschland GmbH
Draka Deutschland Zweite Beteiligungs- GmbH Wuppertal Euro 25,000 100.00% Kabelbedrijven Draka Nederland B.V.
Draka Kabeltechnik GmbH Wuppertal Euro 25,000 100.00% Draka Cable Wuppertal GmbH
Draka Service GmbH Nurnmberg Euro 25,000 100.00% Draka Cable Wuppertal GmbH
Höhn GmbH Wuppertal Deutsche Mark 1,000,000 100.00% Draka Deutschland GmbH
Kaiser Kabel GmbH Wuppertal Deutsche Mark 9,000,000 100.00% Draka Deutschland GmbH
Kaiser Kabel Vertriebs GmbH Wuppertal Euro 25,100 100.00% Kaiser Kabel GmbH
NKF Holding (Deutschland) GmbH Wuppertal Euro 25,000 100.00% Draka Communications B.V.
Usb -elektro Kabelkonfektions - GmbH Bendorf Deutsche Mark 2,750,000 100.00% White Holding B.V.
Wagner Management- und Projektgesellschaft mit beschränkter Haftung Berlin Deutsche Mark 50,000 60.00% Draka Cable Wuppertal GmbH
40.00% Third parties
U.K.
Prysmian Cables & Systems Ltd. Eastleigh British Pound 45,292,120 100.00% Prysmian UK Group Ltd.
Prysmian Construction Company Ltd. Eastleigh British Pound 1 100.00% Prysmian Cables & Systems Ltd.
Prysmian Cables (2000) Ltd. Eastleigh British Pound 1 100.00% Prysmian Cables & Systems Ltd.
Prysmian Cables (Industrial) Ltd. Eastleigh British Pound 1 100.00% Prysmian Cables & Systems Ltd.
Prysmian Cables (Supertension) Ltd. Eastleigh British Pound 1 100.00% Prysmian Cables & Systems Ltd.
Prysmian Cables and Systems International Ltd. Eastleigh Euro 100,000 100.00% Prysmian Cavi e Sistemi S.r.l.
Cable Makers Properties & Services Limited Kingston upon Thames British Pound 33 63.53% Prysmian Cables & Systems Ltd.
12.52% Draka UK Limited
23.95% Third parties
Prysmian Telecom Cables and Systems Uk Ltd. Eastleigh British Pound 1 100.00% Prysmian Cables & Systems Ltd.
Prysmian Metals Limited Eastleigh British Pound 15,000,000 100.00% Prysmian Cables & Systems Ltd.
Comergy Ltd. Eastleigh British Pound 1,000,000 100.00% Prysmian Cavi e Sistemi S.r.l.
Prysmian Pension Scheme Trustee Limited Eastleigh British Pound 1 100.00% Prysmian S.p.A.
Prysmian UK Group Ltd. Eastleigh British Pound 11,000 100.00% Draka Holding N.V.
Draka Distribution Aberdeen Limited Eastleigh British Pound 1 100.00% Draka UK Group Limited
Draka Comteq UK Limited Eastleigh British Pound 2 100.00% Prysmian UK Group Ltd
Draka UK Limited Eastleigh British Pound 202,000 100.00% Draka UK Group Limited
Draka UK Group Limited Eastleigh British Pound 10,000,103 99.99999% Prysmian UK Group Ltd
0.00% Third parties
Draka UK Pension Plan Trust Company Ltd. Derby British Pound 1 100.00% Draka UK Limited
Ireland
Prysmian Financial Services Ireland Limited Dublin Euro 1,000 100.00% Third parties
Prysmian Re Company Limited Dublin Euro 3,000,000 100.00% Prysmian (Dutch) Holding B.V.
Italy
Prysmian Cavi e Sistemi S.r.l. Milan Euro 100,000,000 100.00% Prysmian S.p.A.
Prysmian Cavi e Sistemi Italia S.r.l. Milan Euro 77,143,249 100.00% Prysmian Cavi e Sistemi S.r.l.
Prysmian Treasury S.r.l. Milan Euro 4,242,476 100.00% Prysmian Cavi e Sistemi S.r.l.
Prysmian PowerLink S.r.l. Milan Euro 50,000,000 84.80% Prysmian Cavi e Sistemi S.r.l.
15.20% Prysmian Cavi e Sistemi Italia S.r.l.
Fibre Ottiche Sud - F.O.S. S.r.l. Battipaglia Euro 47,700,000 100.00% Prysmian Cavi e Sistemi S.r.l.
DB Lift Draka Elevator Product S.r.l Milan Euro 250,000 100.00% Prysmian Cavi e Sistemi Italia S.r.l.
Prysmian Electronics S.r.l.. Milan Euro 10,000 80.00% Prysmian Cavi e Sistemi S.r.l.
20.00% Third parties
Luxembourg
Prysmian Treasury (Lux) S.à r.l. Luxembourg Euro 3,050,000 100.00% Prysmian Cavi e Sistemi S.r.l.
Balin S.A. Luxembourg Euro 30,987 100.00% Third parties
Norway
Prysmian Kabler og Systemer A.S. Ski Norwegian Krone 100,000 100.00% Prysmian Cables and Systems OY
Draka Comteq Norway A.S. Drammen Norwegian Krone 100,300 100.00% Draka Comteq B.V.
Draka Norsk Kabel A.S. Drammen Norwegian Krone 22,500,000 100.00% Draka Norway A.S.
Draka Norway A.S. Drammen Norwegian Krone 112,000 100.00% Draka Holding N.V.
% ownership

90
PRYSMIAN GROUP l CONSOLIDATED FINANCIAL STATEMENTS AND EXPLANATORY NOTES
Legal name Office Currency Share capital Direct parent company
The Netherlands
Prysmian Cable Holding B.V. Delft Euro 54,503,013 100.00% Prysmian Cavi e Sistemi S.r.l.
Prysmian Cables and Systems B.V. Delft Euro 5,000,000 100.00% Prysmian Cavi e Sistemi S.r.l.
Prysmian (Dutch) Holdings B.V. Delft Euro 18,000 100.00% Prysmian Cavi e Sistemi S.r.l.
Beheer- en Beleggingsmaatschappij De Vaartweg B.V. Amsterdam Euro 16,563 100.00% Draka Holding N.V.
Cableries Holding B.V. Oudenbosch Euro 453,780 100.00% White Holding B.V.
Draka Beheer B.V. Amsterdam Euro 18,004 100.00% Draka Holding N.V.
Draka Beheer IV B.V. Amsterdam Euro 18,000 100.00% Draka Holding N.V.
Draka Communications B.V. Amsterdam Euro 2,053,355 100.00% Kabelbedrijven Draka Nederland B.V.
Draka Comteq B.V. Amsterdam Euro 1,000,000 100.00% Draka Beheer B.V.
Draka Comteq Cable Solutions B.V. Gouda Euro 18,000 100.00% Draka Beheer B.V.
Draka Comteq Data B.V. Amsterdam Euro 18,200 100.00% Draka Beheer B.V.
Draka Comteq Fibre B.V. Eindhoven Euro 18,000 100.00% Draka Beheer B.V.
Draka Comteq Telecom B.V. Gouda Euro 18,002 100.00% Draka Beheer B.V.
Draka Elevator Products B.V. Oudenbosch Euro 18,000 100.00% Draka Nederland B.V.
Draka Holding N.V. Amsterdam Euro 37,770,558 72.135% Prysmian S.p.A.
27.865% Prysmian Cavi e Sistemi S.r.l.
Draka Kabel B.V. Amsterdam Euro 2,277,977 100.00% Kabelbedrijven Draka Nederland B.V.
Donne Draad B.V. Nieuw Bergen Euro 28,134 100.00% Kabelbedrijven Draka Nederland B.V.
Draka Nederland B.V. Amsterdam Euro 18,605 100.00% Draka Holding N.V.
Draka Treasury B.V. Amsterdam Euro 2,268,901 100.00% Draka Holding N.V.
Fabriek voor Auto-en Electrotechnische Produkten “White Products” B.V. Oudenbosch Euro 6,806,703 100.00% White Holding B.V.
I.C. Kabel B.V. Roosendaal Euro 1,150,333 100.00% Balin S.A.
Kabelbedrijven Draka Nederland B.V. Amsterdam Euro 18,151 100.00% Draka Nederland B.V.
NKF Participatie B.V. Delft Euro 18,151 100.00% Draka Communications B.V.
NK China Investments B.V. Delft Euro 19,000 100.00% Draka Communications B.V.
NKF Vastgoed B.V. Delft Euro 13,613,406 100.00% Draka Communications B.V.
NKF Vastgoed Holding B.V. Den Haag Euro 18,151 100.00% Draka Communications B.V.
NKF Vastgoed I B.V. Delft Euro 18,151 99.00% Draka Holding N.V.
1.00% Draka Communications B.V.
NKF Vastgoed II B.V. Delft Euro 18,151 100.00% Draka Communications B.V.
NKF Vastgoed III B.V. Amsterdam Euro 18,151 99.00% Draka Deutschland GmbH
1.00% Draka Communications B.V.
NKF Vastgoed IV B.V. 's-Gravenhage Euro 18,151 100.00% NKF Vastgoed Holding B.V.
Plasma Optical Fibre B.V. Eindhoven Euro 90,756 100.00% Draka Comteq Fibre B.V.
White Holding B.V. Oudenbosch Euro 4,605,869 100.00% Draka Nederland B.V.
Draka Sarphati B.V. Amsterdam Euro 18,151 100.00% Draka Holding N.V.
Czech Republic
Draka Kabely, s.r.o. Velke Mezirici Czech Koruna 255,000,000 100.00% Draka Holding N.V.
Romania
Prysmian Cabluri Si Sisteme S.A. Slatina Romanian Leu 103,850,920 99.9995% Prysmian (Dutch) Holdings B.V.
0.0005% Prysmian Cavi e Sistemi S.r.l.
Russia
Limited Liability Company "Investitsionno - Promyshlennaya Kompaniya
Rybinskelektrokabel" Rybinsk city Russian Rouble 230,000,000 99.00% Prysmian (Dutch) Holdings B.V.
1.00% Prysmian Cavi e Sistemi S.r.l.
Limited Liability Company "Rybinskelektrokabel" Rybinsk city Russian Rouble 31,800,000 100.00% Limited Liability Company "Investitsionno - Promyshlennaya Kompaniya
Rybinskelektrokabel"
Limited Liability Company "Torgoviy Dom Rybinskelektrokabel" Rybinsk city Russian Rouble 8,512,000 100.00% Limited Liability Company "Investitsionno - Promyshlennaya Kompaniya
Rybinskelektrokabel"
Limited Liability Company "NPP Rybinskelektrokabel" Rybinsk city Russian Rouble 50,000,000 100.00% Limited Liability Company "Investitsionno - Promyshlennaya Kompaniya
Rybinskelektrokabel"
Draka Industrial Cable Russia LLC St. Petersburg Russian Rouble 100,000 100.00% Draka Holding N.V.
Neva Cables Ltd St. Petersburg Russian Rouble 194,000 100.00% Draka Comteq Finland OY
% ownership

91
PRYSMIAN GROUP l CONSOLIDATED FINANCIAL STATEMENTS AND EXPLANATORY NOTES
Legal name Office Currency Share capital Direct parent company
Slovakia
Prysmian Kablo s.r.o. Bratislava Euro 21,246,001 99.995% Prysmian Cavi e Sistemi S.r.l.
0.005% Prysmian S.p.A.
Draka Comteq Slovakia s.r.o. Presov Euro 1,506,639 100.00% Draka Comteq B.V.
Spain
Prysmian Cables y Sistemas S.A. Vilanova I la Geltrù Euro 15,000,000 100.00% Draka Holding N.V. y CIA Soc. Col.
Fercable S.L. Sant Vicenç dels Horts Euro 3,606,073 100.00% Prysmian Cables y Sistemas S.A.
Prysmian Servicios de Tesoreria Espana S.L. Madrid Euro 3,100 100.00% Prysmian Financial Services Ireland Limited
Marmavil.S.L.U. Santa Perpetua de Mogoda Euro 3,006 100.00% Draka Nederland B.V.
Draka Holding NV Y CIA Soc. Col. Santa Perpetua de Mogoda Euro 17,011,695 99.9999% Draka Holding N.V.
0.0001% Marmavil.S.L.U.
Draka Cables Industrial S.A. Santa Perpetua de Mogoda Euro 58,178,234 100.00% Draka Holding NV Y CIA Soc. Col.
Draka Comteq Iberica S.L.U. Maliaño Euro 4,000,040 100.00% Draka Holding NV Y CIA Soc. Col.
Sweden
Prysmian Kablar och System AB Hoganas Swedish Krona 100,000 100.00% Prysmian Cables and Systems OY
Draka Comteq Sweden AB Nässjö Swedish Krona 100,000 100.00% Draka Comteq B.V.
NK Cables Sverige AB Orebro Swedish Krona 100,000 100.00% Draka NK Cables OY
Draka Sweden AB Nässjö Swedish Krona 100,100 100.00% Draka Holding N.V.
Draka Kabel Sverige AB Nässjö Swedish Krona 100,000 100.00% Draka Sweden AB
Fastighets Spännbucklan AB Nässjö Swedish Krona 25,000,000 100.00% Draka Sweden AB
Fastighets Hygget AB Nässjö Swedish Krona 100,000 100.00% Draka Sweden AB
Switzerland
Prysmian Cables and Systems SA Manno Swiss Franc 500,000 100.00% Prysmian (Dutch) Holdings B.V.
Turkey
Turk Prysmian Kablo Ve Sistemleri A.S. Mudanya Turkish new Lira 112,233,652 83.746% Prysmian (Dutch) Holdings B.V.
16.254% Third parties
Draka Istanbul Asansor İthalat İhracat Üretim Ticaret Ltd. Şti. Istanbul Turkish new Lira 180,000 99.972% Draka Elevator Products B.V.
0.028% Draka Holding N.V.
Draka Comteq Kablo Limited Sirketi Istanbul Turkish new Lira 45,818,775 99.50% Draka Comteq B.V.
0.50% Draka Comteq Telecom B.V.
Hungary
Prysmian MKM Magyar Kabel Muvek KFT Budapest Hungarian Forint 5,000,000,000 100.00% Prysmian Cavi e Sistemi S.r.l.
Kabel Keszletertekesito BT Budapest Hungarian Forint 1,239,841,361 99.999% Prysmian MKM Magyar Kabel Muvek KFT
0.001% Third parties
North America
Canada
Prysmian Power Cables and Systems Canada Ltd. Saint John Canadian Dollar 1,000,000 100.00% Prysmian (Dutch) Holdings B.V.
Draka Elevator Products, Inc. Brantford Canadian Dollar n/a 100.00% Draka Cableteq USA, Inc.
U.S.A.
Prysmian Cables and Systems (US) INC. Carson City US Dollar 71,000,001 100.00% Prysmian Cavi e Sistemi S.r.l.
Prysmian Power Cables and Systems USA LLC Wilmington US Dollar 10 100.00% Prysmian Cables and Systems (US) INC.
Prysmian Construction Services Inc Wilmington US Dollar 1,000 100.00% Prysmian Power Cables and Systems USA LLC
Prysmian Communications Cables and Systems USA LLC Wilmington US Dollar 10 100.00% Prysmian Cables and Systems (US) INC.
Prysmian Communications Cables Corporation Wilmington US Dollar 1 100.00% Prysmian Communications Cables and Systems USA LLC
Prysmian Power Financial Services US LLC Wilmington US Dollar 100 100.00% Prysmian Power Cables and Systems USA LLC
Prysmian Communications Financial Services US LLC Wilmington US Dollar 100 100.00% Prysmian Communications Cables and Systems USA LLC
Draka USA, Inc. Boston US Dollar 0.01 100.00% Draka Holding N.V.
Draka Cableteq USA, Inc. Boston US Dollar 10 100.00% Draka USA Inc.
Draka Elevator Products, Inc. Boston US Dollar 1 100.00% Draka Cableteq USA Inc.
Draka Communications Americas, Inc. Boston US Dollar n/a 100.00% Draka Cableteq USA Inc.
Draka Transport USA LLC Boston US Dollar n/a 100.00% Draka Cableteq USA, Inc.
% ownership
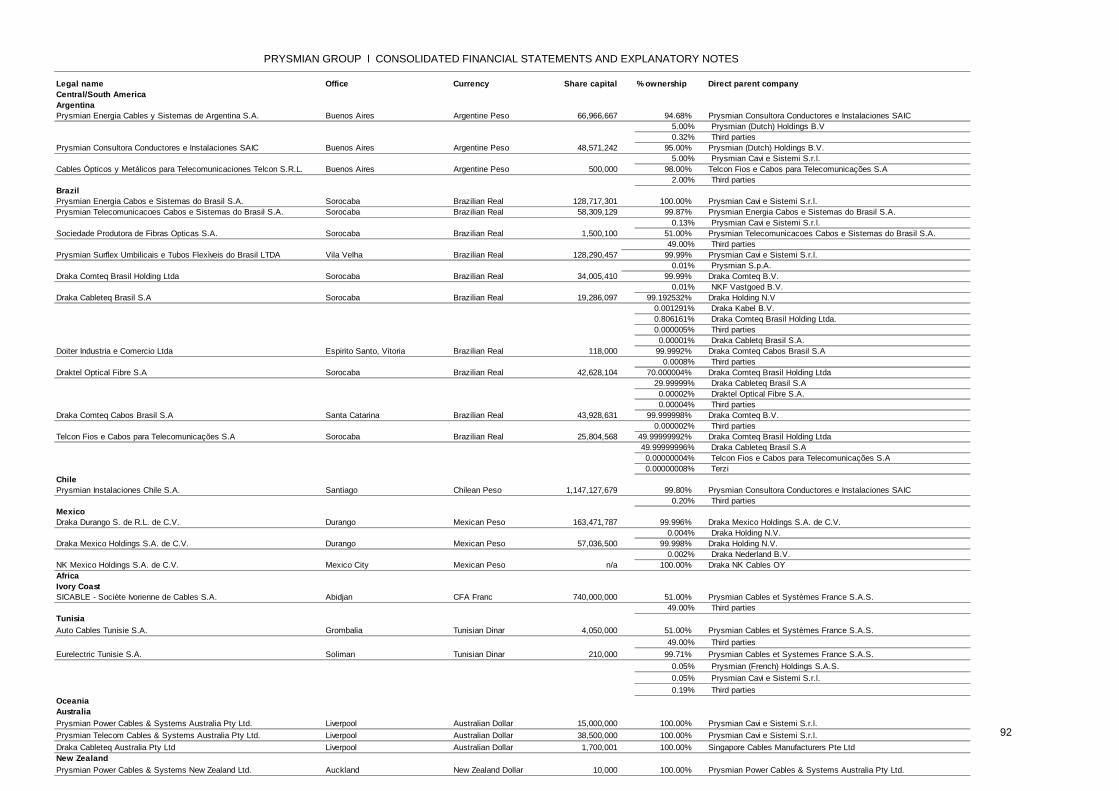
92
PRYSMIAN GROUP l CONSOLIDATED FINANCIAL STATEMENTS AND EXPLANATORY NOTES
Legal name Office Currency Share capital Direct parent company
Central/South America
Argentina
Prysmian Energia Cables y Sistemas de Argentina S.A. Buenos Aires Argentine Peso 66,966,667 94.68% Prysmian Consultora Conductores e Instalaciones SAIC
5.00% Prysmian (Dutch) Holdings B.V
0.32% Third parties
Prysmian Consultora Conductores e Instalaciones SAIC Buenos Aires Argentine Peso 48,571,242 95.00% Prysmian (Dutch) Holdings B.V.
5.00% Prysmian Cavi e Sistemi S.r.l.
Cables Ópticos y Metálicos para Telecomunicaciones Telcon S.R.L. Buenos Aires Argentine Peso 500,000 98.00% Telcon Fios e Cabos para Telecomunicações S.A
2.00% Third parties
Brazil
Prysmian Energia Cabos e Sistemas do Brasil S.A. Sorocaba Brazilian Real 128,717,301 100.00% Prysmian Cavi e Sistemi S.r.l.
Prysmian Telecomunicacoes Cabos e Sistemas do Brasil S.A. Sorocaba Brazilian Real 58,309,129 99.87% Prysmian Energia Cabos e Sistemas do Brasil S.A.
0.13% Prysmian Cavi e Sistemi S.r.l.
Sociedade Produtora de Fibras Opticas S.A. Sorocaba Brazilian Real 1,500,100 51.00% Prysmian Telecomunicacoes Cabos e Sistemas do Brasil S.A.
49.00% Third parties
Prysmian Surflex Umbilicais e Tubos Flexìveis do Brasil LTDA Vila Velha Brazilian Real 128,290,457 99.99% Prysmian Cavi e Sistemi S.r.l.
0.01% Prysmian S.p.A.
Draka Comteq Brasil Holding Ltda Sorocaba Brazilian Real 34,005,410 99.99% Draka Comteq B.V.
0.01% NKF Vastgoed B.V.
Draka Cableteq Brasil S.A Sorocaba Brazilian Real 19,286,097 99.192532% Draka Holding N.V
0.001291% Draka Kabel B.V.
0.806161% Draka Comteq Brasil Holding Ltda.
0.000005% Third parties
0.00001% Draka Cabletq Brasil S.A.
Doiter Industria e Comercio Ltda Espirito Santo, Vitoria Brazilian Real 118,000 99.9992% Draka Comteq Cabos Brasil S.A
0.0008% Third parties
Draktel Optical Fibre S.A Sorocaba Brazilian Real 42,628,104 70.000004% Draka Comteq Brasil Holding Ltda
29.99999% Draka Cableteq Brasil S.A
0.00002% Draktel Optical Fibre S.A.
0.00004% Third parties
Draka Comteq Cabos Brasil S.A Santa Catarina Brazilian Real 43,928,631 99.999998% Draka Comteq B.V.
0.000002% Third parties
Telcon Fios e Cabos para Telecomunicações S.A Sorocaba Brazilian Real 25,804,568 49.99999992% Draka Comteq Brasil Holding Ltda
49.99999996% Draka Cableteq Brasil S.A
0.00000004% Telcon Fios e Cabos para Telecomunicações S.A
0.00000008% Terzi
Chile
Prysmian Instalaciones Chile S.A. Santiago Chilean Peso 1,147,127,679 99.80% Prysmian Consultora Conductores e Instalaciones SAIC
0.20% Third parties
Mexico
Draka Durango S. de R.L. de C.V. Durango Mexican Peso 163,471,787 99.996% Draka Mexico Holdings S.A. de C.V.
0.004% Draka Holding N.V.
Draka Mexico Holdings S.A. de C.V. Durango Mexican Peso 57,036,500 99.998% Draka Holding N.V.
0.002% Draka Nederland B.V.
NK Mexico Holdings S.A. de C.V. Mexico City Mexican Peso n/a 100.00% Draka NK Cables OY
Africa
Ivory Coast
SICABLE - Sociète Ivorienne de Cables S.A. Abidjan CFA Franc 740,000,000 51.00% Prysmian Cables et Systèmes France S.A.S.
49.00% Third parties
Tunisia
Auto Cables Tunisie S.A. Grombalia Tunisian Dinar 4,050,000 51.00% Prysmian Cables et Systèmes France S.A.S.
49.00% Third parties
Eurelectric Tunisie S.A. Soliman Tunisian Dinar 210,000 99.71% Prysmian Cables et Systemes France S.A.S.
0.05% Prysmian (French) Holdings S.A.S.
0.05% Prysmian Cavi e Sistemi S.r.l.
0.19% Third parties
Oceania
Australia
Prysmian Power Cables & Systems Australia Pty Ltd. Liverpool Australian Dollar 15,000,000 100.00% Prysmian Cavi e Sistemi S.r.l.
Prysmian Telecom Cables & Systems Australia Pty Ltd. Liverpool Australian Dollar 38,500,000 100.00% Prysmian Cavi e Sistemi S.r.l.
Draka Cableteq Australia Pty Ltd Liverpool Australian Dollar 1,700,001 100.00% Singapore Cables Manufacturers Pte Ltd
New Zealand
Prysmian Power Cables & Systems New Zealand Ltd. Auckland New Zealand Dollar 10,000 100.00% Prysmian Power Cables & Systems Australia Pty Ltd.
% ownership
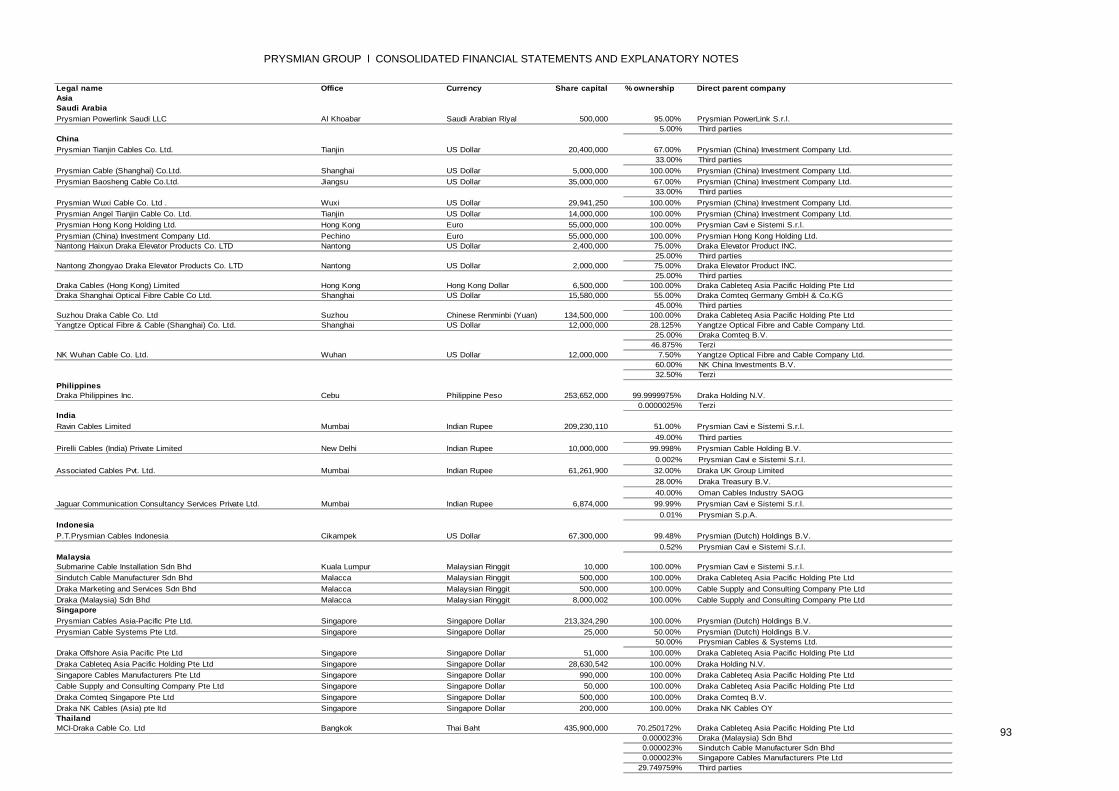
93
PRYSMIAN GROUP l CONSOLIDATED FINANCIAL STATEMENTS AND EXPLANATORY NOTES
Legal name Office Currency Share capital Direct parent company
Asia
Saudi Arabia
Prysmian Powerlink Saudi LLC Al Khoabar Saudi Arabian Riyal 500,000 95.00% Prysmian PowerLink S.r.l.
5.00% Third parties
China
Prysmian Tianjin Cables Co. Ltd. Tianjin US Dollar 20,400,000 67.00% Prysmian (China) Investment Company Ltd.
33.00% Third parties
Prysmian Cable (Shanghai) Co.Ltd. Shanghai US Dollar 5,000,000 100.00% Prysmian (China) Investment Company Ltd.
Prysmian Baosheng Cable Co.Ltd. Jiangsu US Dollar 35,000,000 67.00% Prysmian (China) Investment Company Ltd.
33.00% Third parties
Prysmian Wuxi Cable Co. Ltd . Wuxi US Dollar 29,941,250 100.00% Prysmian (China) Investment Company Ltd.
Prysmian Angel Tianjin Cable Co. Ltd. Tianjin US Dollar 14,000,000 100.00% Prysmian (China) Investment Company Ltd.
Prysmian Hong Kong Holding Ltd. Hong Kong Euro 55,000,000 100.00% Prysmian Cavi e Sistemi S.r.l.
Prysmian (China) Investment Company Ltd. Pechino Euro 55,000,000 100.00% Prysmian Hong Kong Holding Ltd.
Nantong Haixun Draka Elevator Products Co. LTD Nantong US Dollar 2,400,000 75.00% Draka Elevator Product INC.
25.00% Third parties
Nantong Zhongyao Draka Elevator Products Co. LTD Nantong US Dollar 2,000,000 75.00% Draka Elevator Product INC.
25.00% Third parties
Draka Cables (Hong Kong) Limited Hong Kong Hong Kong Dollar 6,500,000 100.00% Draka Cableteq Asia Pacific Holding Pte Ltd
Draka Shanghai Optical Fibre Cable Co Ltd. Shanghai US Dollar 15,580,000 55.00% Draka Comteq Germany GmbH & Co.KG
45.00% Third parties
Suzhou Draka Cable Co. Ltd Suzhou Chinese Renminbi (Yuan) 134,500,000 100.00% Draka Cableteq Asia Pacific Holding Pte Ltd
Yangtze Optical Fibre & Cable (Shanghai) Co. Ltd. Shanghai US Dollar 12,000,000 28.125% Yangtze Optical Fibre and Cable Company Ltd.
25.00% Draka Comteq B.V.
46.875% Terzi
NK Wuhan Cable Co. Ltd. Wuhan US Dollar 12,000,000 7.50% Yangtze Optical Fibre and Cable Company Ltd.
60.00% NK China Investments B.V.
32.50% Terzi
Philippines
Draka Philippines Inc. Cebu Philippine Peso 253,652,000 99.9999975% Draka Holding N.V.
0.0000025% Terzi
India
Ravin Cables Limited Mumbai Indian Rupee 209,230,110 51.00% Prysmian Cavi e Sistemi S.r.l.
49.00% Third parties
Pirelli Cables (India) Private Limited New Delhi Indian Rupee 10,000,000 99.998% Prysmian Cable Holding B.V.
0.002% Prysmian Cavi e Sistemi S.r.l.
Associated Cables Pvt. Ltd. Mumbai Indian Rupee 61,261,900 32.00% Draka UK Group Limited
28.00% Draka Treasury B.V.
40.00% Oman Cables Industry SAOG
Jaguar Communication Consultancy Services Private Ltd. Mumbai Indian Rupee 6,874,000 99.99% Prysmian Cavi e Sistemi S.r.l.
0.01% Prysmian S.p.A.
Indonesia
P.T.Prysmian Cables Indonesia Cikampek US Dollar 67,300,000 99.48% Prysmian (Dutch) Holdings B.V.
0.52% Prysmian Cavi e Sistemi S.r.l.
Malaysia
Submarine Cable Installation Sdn Bhd Kuala Lumpur Malaysian Ringgit 10,000 100.00% Prysmian Cavi e Sistemi S.r.l.
Sindutch Cable Manufacturer Sdn Bhd Malacca Malaysian Ringgit 500,000 100.00% Draka Cableteq Asia Pacific Holding Pte Ltd
Draka Marketing and Services Sdn Bhd Malacca Malaysian Ringgit 500,000 100.00% Cable Supply and Consulting Company Pte Ltd
Draka (Malaysia) Sdn Bhd Malacca Malaysian Ringgit 8,000,002 100.00% Cable Supply and Consulting Company Pte Ltd
Singapore
Prysmian Cables Asia-Pacific Pte Ltd. Singapore Singapore Dollar 213,324,290 100.00% Prysmian (Dutch) Holdings B.V.
Prysmian Cable Systems Pte Ltd. Singapore Singapore Dollar 25,000 50.00% Prysmian (Dutch) Holdings B.V.
50.00% Prysmian Cables & Systems Ltd.
Draka Offshore Asia Pacific Pte Ltd Singapore Singapore Dollar 51,000 100.00% Draka Cableteq Asia Pacific Holding Pte Ltd
Draka Cableteq Asia Pacific Holding Pte Ltd Singapore Singapore Dollar 28,630,542 100.00% Draka Holding N.V.
Singapore Cables Manufacturers Pte Ltd Singapore Singapore Dollar 990,000 100.00% Draka Cableteq Asia Pacific Holding Pte Ltd
Cable Supply and Consulting Company Pte Ltd Singapore Singapore Dollar 50,000 100.00% Draka Cableteq Asia Pacific Holding Pte Ltd
Draka Comteq Singapore Pte Ltd Singapore Singapore Dollar 500,000 100.00% Draka Comteq B.V.
Draka NK Cables (Asia) pte ltd Singapore Singapore Dollar 200,000 100.00% Draka NK Cables OY
Thailand
MCI-Draka Cable Co. Ltd Bangkok Thai Baht 435,900,000 70.250172% Draka Cableteq Asia Pacific Holding Pte Ltd
0.000023% Draka (Malaysia) Sdn Bhd
0.000023% Sindutch Cable Manufacturer Sdn Bhd
0.000023% Singapore Cables Manufacturers Pte Ltd
29.749759% Third parties
% ownership

94
PRYSMIAN GROUP l CONSOLIDATED FINANCIAL STATEMENTS AND EXPLANATORY NOTES
Legal name Office Currency Share capital Direct parent company
Asia
China
Yangtze Optical Fibre and Cable Company Ltd. Wuhan Euro 63,328,220 37.50% Draka Comteq B.V.
62.50% Third parties
United Arab Emirates
Power Plus Cable CO. LLC Fujairah United Arab Emirates Dirham 51,000,000 49.00% Ravin Cables Limited
51.00% Third parties
Japan
Precision Fiber Optics Ltd. Chiba Japanese Yen 360,000,000 50.00% Plasma Optical Fibre B.V.
50.00% Third parties
Malaysia
Power Cables Malaysia Sdn Bhd Selangor Darul Eshan Malaysian Ringgit 8,000,000 40.00% Prysmian (Dutch) Holdings B.V.
60.00% Third parties
% ownership
The following companies have been consolidated on a proportionate basis:

95
PRYSMIAN GROUP l CONSOLIDATED FINANCIAL STATEMENTS AND EXPLANATORY NOTES
Legal name Office Currency Share capital Direct parent company
Europe
Germany
Kabeltrommel GmbH & CO.KG Troisdorf Euro 10,225,838 1.00% Bergmann Kabel und Leitungen GmbH
28.68% Prysmian Kabel und Systeme GmbH
13.50% Draka Cable Wuppertal GmbH
56.82% Third parties
Kabeltrommel GmbH Troisdorf Deutsche Mark 51,000 11.77% Prysmian Kabel und Systeme GmbH
5.88% Bergmann Kabel und Leitungen GmbH
23.53% Draka Cable Wuppertal GmbH
58.82% Third parties
KTG Europe GmbH Troisdorf Euro 100,000 100.00% Kabeltrommel GmbH & CO.KG
U.K.
Rodco Ltd. Weybridge British Pound 5,000,000 40.00% Prysmian Cables & Systems Ltd.
60.00% Third parties
Poland
Eksa Sp.Zo.o Sokolów Polish Zloty 394,000 20.05% Prysmian Cavi e Sistemi S.r.l.
79.95% Third parties
Russia
Elkat Ltd. Moscow Russian Rouble 10,000 40.00% Draka NK Cables OY
60.00% Third parties
Asia
China
Jiangsu Yangtze Zhongli Optical Fibre & Cable Co., Ltd. Changshu Chinese Renminbi (Yuan) 92,880,000 51.00% Yangtze Optical Fibre and Cable Company Ltd.
49.00% Third parties
Yangtze Optical Fibre & Cable Sichuan Co. Ltd. Emeishan City Chinese Renminbi (Yuan) 33,200,000 51.00% Yangtze Optical Fibre and Cable Company Ltd.
49.00% Third parties
Tianjin YOFC XMKJ Optical Communications Co.,Ltd. Tianjin Chinese Renminbi (Yuan) 220,000,000 49.00% Yangtze Optical Fibre and Cable Company Ltd.
51.00% Third parties
Shenzhen SDGI Optical Fibre Co., Ltd. Shenzhen Chinese Renminbi (Yuan) 149,014,800 49.00% Yangtze Optical Fibre and Cable Company Ltd.
51.00% Third parties
Shantou Hi-Tech Zone Aoxing Optical Communication EquipmentsCo.,Ltd.Shantou Chinese Renminbi (Yuan) 170,558,817 42.42% Yangtze Optical Fibre and Cable Company Ltd.
57.58% Third parties
Yangtze (Wuhan) Optical System Corp., Ltd. Wuhan Chinese Renminbi (Yuan) 53,800,000 44.00% Yangtze Optical Fibre and Cable Company Ltd.
56.00% Third parties
Tianjin YOFC XMKJ Optical Cable Co., Ltd. Tianjin Chinese Renminbi (Yuan) 100,000,000 20.00% Yangtze Optical Fibre and Cable Company Ltd.
80.00% Third parties
WuhanGuanyuan Electronic Technology Co. Ltd. Wuhan Chinese Renminbi (Yuan) 5,000,000 20.00% Yangtze Optical Fibre and Cable Company Ltd.
80.00% Third parties
Tianmen Xinrun Timber Produce Co., Ltd. Tianmen Chinese Renminbi (Yuan) 5,000,000 20.00% Yangtze Optical Fibre and Cable Company Ltd.
80.00% Third parties
Oman
Oman Cables Industry SAOG Al Rusayl Industrial Zone Omani Rial 8,970,000 34.78% Draka Holding N.V.
65.22% Third parties
% ownership
The following companies have been accounted for using the equity method:

96
PRYSMIAN GROUP l CONSOLIDATED FINANCIAL STATEMENTS AND EXPLANATORY NOTES
Legal name Direct parent company
Europe
Finland
Conex Cables OY 50.00% Draka NK Cables OY
50.00% Terzi
Switzerland
Voltimum S.A. 13.71% Prysmian Cavi e Sistemi S.r.l.
86.29% Third parties
Asia
Saudi Arabia
Sicew-Saudi Italian Company for Electrical Works Ltd. 34.00% Prysmain Cable Holding B.V.
66.00% Third parties
China
Hangzhou Futong Optical Fiber Technology Co., Ltd. 10.38% Yangtze Optical Fibre and Cable Company Ltd.
89.62% Third parties
Wuhan Yunjingfei Optical Fiber Material Co., Ltd. 20.00% Yangtze Optical Fibre and Cable Company Ltd.
80.00% Third parties
Africa
South Africa
Pirelli Cables & Systems (Proprietary) Ltd. 100.00% Prysmian Cavi e Sistemi S.r.l.
% ownership
The following investments in other companies have been classified as available-for-sale financial assets:
97
PRYSMIAN GROUP l CONSOLIDATED FINANCIAL STATEMENTS AND EXPLANATORY NOTES
CERTIFICATION OF THE HALF-YEAR CONDENSEDCONSOLIDATED FINANCIAL STATEMENTS PURSUANT TOART. 81-TER OF CONSOB REGULATION 11971 DATED 14 MAY1999 AND SUBSEQUENT AMENDMENTS AND ADDITIONS
1. The undersigned Valerio Battista, as Chief Executive Officer, and Carlo Soprano and Jordi Calvo, as
managers responsible for preparing the corporate accounting documents of Prysmian S.p.A., certify, also
taking account of the provisions of paragraphs 3 and 4, art. 154-bis of Italian Legislative Decree 58 dated 24
February 1998, that during the first half of 2012 the accounting and administrative processes for preparing
the half-year condensed consolidated financial statements:
• have been adequate in relation to the business's characteristics and,
• have been effectively applied.
2. The adequacy of the accounting and administrative processes for preparing the half-year condensed
consolidated financial statements at 30 June 2012 has been evaluated on the basis of a procedure
established by Prysmian in compliance with the internal control framework published by the Committee of
Sponsoring Organizations of the Treadway Commission, which represents the generally accepted standard
model internationally.
It is reported that:
- the integration of companies in the Draka Group, acquired in February 2011, into the Group's system of
procedures and controls is still in progress. The integration process has carried on during 2012 and should
be largely completed within the year;
- during the first half of 2012, some of the Prysmian Group's companies have been involved in the project to
change information system. The process of fine-tuning the new system's operating and accounting
functions is still in progress for some of them; in any case, the system of controls in place ensures
consistency with the Group's system of procedures and controls.
3. They also certify that:
3.1 The half-year condensed consolidated financial statements at 30 June 2012:
a. have been prepared in accordance with applicable international accounting standards recognised
by the European Union under Regulation (EC) 1606/2002 of the European Parliament and Council
dated 19 July 2002;
b. correspond to the underlying accounting records and books of account;
c. are able to provide a true and fair view of the issuer's statement of financial position and results of
operations and of the group of companies included in the consolidation.

98
PRYSMIAN GROUP l CONSOLIDATED FINANCIAL STATEMENTS AND EXPLANATORY NOTES
3.2 The interim directors' report contains a reliable analysis of performance and the results of operations,
and of the situation of the issuer and the group of companies included in the consolidation, together with a
description of the principal risks and uncertainties to which they are exposed.
7 August 2012
Signed: Valerio Battista Signed: Carlo Soprano and Jordi Calvo
Chief Executive Officer Managers responsible for preparing corporate accountingdocuments
Valerio Battista Carlo Soprano Jordi Calvo

AUDIT REPORT


PRYSMIAN S.P.A.
Viale Sarca 22220126 MilanItalyph. +39 02 64491www.prysmiangroup.com
