infrastructure versus other investments in the global … versus other investments in the global...
TRANSCRIPT
OECD Journal: Financial Market TrendsVolume 2014/2© OECD 2015
7
Infrastructure versus other investments in the global economy
and stagnation hypotheses: What do company data tell us?
by
Adrian Blundell-Wignall and Caroline Roulet*
* Adrian Blundell-Wignall is the Special Advisor to the OECD Secretary-General on Financial Markets and Director of the Directorate of Financial and Enterprise Affairs (www.oecd.org/daf/abw). Caroline Roulet is an OECD economist and policy analyst in the same directorate. This paper is published under the responsibility of the Secretary-General of the OECD. The opinions expressed and the arguments employed herein do not necessarily reflect the official views of OECD member countries. This document and any map included herein are without prejudice to the status of or sovereignty over any territory, to the delimitation of international frontiers and boundaries and to the name of any territory, city or area. The statistical data for Israel are supplied by and under the responsibility of the relevant Israeli authorities. The use of such data by the OECD is without prejudice to the status of the Golan Heights, East Jerusalem and Israeli settlements in the West Bank under the terms of international law.
This paper uses data drawn from 10 000 global companies in 75 advanced and emerging countries to look at trends in
infrastructure and other non-financial industries in light of the talk of stagnation. There appears to be a twin paradox in
the global economy: some companies and industries are possibly over-investing, driving down returns on equity (ROEs)
versus the cost of capital and creating margin pressure globally, while others carry out too little long-term investment in
favour of buybacks and the accumulation of cash. This pattern is associated with a shift in the centre of gravity of world
economic activity towards emerging markets. Most of the over-investment appears to be occurring in the extremely strong
growth of emerging market sales and investment in non-infrastructure companies, much of which is being financed from
rapidly growing debt since the financial crisis. Global value chains, emerging market policies of financial repression, low
interest rates, taxation incentives, natural resource endowments and other factors determine where investment is stronger
and where it is restrained. Potential problems of debt-financed over-investment in non-infrastructure industries in
emerging markets and the incentives for buybacks are identified as major policy issues that need to be addressed if
sustainable growth is to be achieved. Evidence on the role of causal factors (sales, GDP, the return on equity, the cost of
equity and debt and a measure of financial openness) on corporate capital spending is presented. Finally some policy
recommendations are made.
JEL classification: F21, G15, G18, G23
Keywords: Global economy, infrastructure, investment, listed companies
INFRASTRUCTURE VERSUS OTHER INVESTMENTS IN THE GLOBAL ECONOMY AND STAGNATION HYPOTHESES
OECD JOURNAL: FINANCIAL MARKET TRENDS – VOLUME 2014/2 © OECD 20158
I. IntroductionAt a recent meeting the Governor of the Reserve Bank of Australia asked the following
question (Stevens, 2014):
“Why do financial institutions and investors see so little risk, while companies investing in the
real economy see so much risk?”
This is perhaps the most important question facing policy makers today. Unconventional
monetary policy in zero rates and quantitative easing (QE) have done exactly what was
intended – they have forced investors to take more risk. This has supported the banking
sector and financial markets have run up very well indeed. But outside of the USA, this has
not been followed by real economic growth led by an investment cycle within the private
sector. Unemployment remains high, and in Europe’s periphery youth unemployment
rates are at unprecedented extremes. Emerging markets, too, have slowed and borrowing
to fund investment has accelerated. These developments have led some to argue that the
world economy may be entering a period of stagnation reflected in a secular decline in the
natural rate of interest. Most often a significant role in this process is attributed to the
puzzle of weak investment and particularly infrastructure investment. If growth is to move
into a more sustainable phase, and potential output and jobs are to be restored, then long-
term investment in infrastructure will have to play a greater role alongside an investment
cycle in the much larger non-infrastructure industries. However, while many hypotheses
about the causes of the lack of responsiveness of private investment to easy monetary
policy have been outlined, there has been no systematic analysis of actual private
infrastructure investment and its relationship with investment in other industries. In large
part this is because of a lack of consistent data amenable to empirical study.
This paper sets out some of the possible hypotheses for lack of investment (despite
“zero rates”) in the world economy. National accounts data provide little insight into the
issues relating to private infrastructure investment, and such numbers that are available
certainly cannot be matched with the corresponding financial aspects of the companies
doing the investment. A data set for the private listed sector is constructed based on
10 000 global companies in 75 countries, dividing the industries between infrastructure and
(non-financial) other industries. Capital spending, the way it is funded and the alternative
uses of funding are collected for each company and aggregated to give a clear picture of
what is happening in different groupings of countries. These data are then compared to
some of the hypotheses about stagnation that economists have been debating.
Section II sets out some of the stagnation hypotheses. The investment and sales data
of the companies covered are discussed in Section III, where the prima facie cases for signs
of stagnation in major parts of the world economy (if present) are identified. The debt-
equity ratios and financial flow data exactly matched to these same companies are
presented in Section IV. The matched data for the return on equity, the cost of equity and
debt funding cost are also considered in this section. A measure of financial openness is set
out in Section V. Section VI then combines the company data and the openness measure to

INFRASTRUCTURE VERSUS OTHER INVESTMENTS IN THE GLOBAL ECONOMY AND STAGNATION HYPOTHESES
OECD JOURNAL: FINANCIAL MARKET TRENDS – VOLUME 2014/2 © OECD 2015 9
look at key causal factors in the determinants of infrastructure and general industry capital
spending in an econometric panel regression study. Finally, many of the threads are drawn
together and some policy comments are offered in Section VII.
II. The various hypotheses offered to explain stagnation
The Wicksell natural rate decline and liquidity trap ideas
Lawrence Summers (2014) associates the stagnation thesis with a fall in natural real
interest rate, and calculates that potential GDP is 5% below its pre-crisis level. He suggests
that 50% of this can be attributed to weaker investment, 40% to fewer hours worked and
10% due to total factor productivity decline. He cites six factors in investment supply and
demand associated with the fall in real rates: that IT/digital firms like Apple, Face Book,
WhatsApp, and Google generate mountains of cash for little investment; population
growth is declining; income wealth inequality generates more saving; the relative price of
capital goods has collapsed; disinflation requires only a lower pre-tax real interest rate to
generate the required after tax rate; and the huge accumulation of low risk Treasury
securities in an uncertain environment is suggestive of uncertainty. For policy he touches
on the need for low nominal rates: if the natural real rate is lower, then the actual rate
determined by monetary policy in a low inflation world needs also to be low. He does note,
however, the issue of the Japan disease; i.e. allowing zombie companies easily to refinance
themselves when they should in fact close.
The lack of demand as the source of stagnation is emphasised by Paul Krugman1 who,
like Summers, also cites population growth slowing in the USA, and Robert Gordon’s (2013)
decline in innovation. Following the crisis, the economy has moved into a Keynesian
liquidity trap zone where monetary policy cannot help. Policy makers are failing to deliver
rates low enough to get the economy going. He takes on Bill White’s (2012) argument that
there is a need to raise interest rates to avoid future crises. There is no sign of inflation and
the economy may need liquidity generated “bubbles” to achieve something like full
employment.
Glenn Stevens in his annual Anika Foundation speech (Stevens, 2014) focuses on the
limits to monetary policy, which played an essential role in fixing the banks following the
crisis: a necessary but not sufficient condition for growth. He describes unconventional
monetary policy as unsterilised intervention in asset markets, the aim of which is to raise
risk taking. However, he notes that this is not taking the form of entrepreneurial risk taking
in business investment. Citing strong patents data, Stevens is sceptical of the Summers/
Gordon view that declining innovation is the cause of stagnation. Instead, he cites the
possibility of past “over-investment”, as is widely accepted to have occurred in Japan in
previous decades. It is questionable, however, whether one can observe this in the critical
infrastructure area around the globe where bottlenecks in emerging markets are evident.
In the end Stevens ponders whether it is not animal spirits that are too low, and he
emphasises the need to reduce uncertainty (for example by completing financial
regulation), and to ensure that international trade remains free (as opposed to what many
countries have been doing since the crisis).2
Stagnation as formulated by a shift in the marginal efficiency of investment schedule
to the left might then cross the savings schedule at some low or negative return on equity/
cost of equity, moving from point A to B in the left panel of Figure 1.3 This could be due to
a deterioration of animal spirits. But for advanced economies this could also be due to

INFRASTRUCTURE VERSUS OTHER INVESTMENTS IN THE GLOBAL ECONOMY AND STAGNATION HYPOTHESES
OECD JOURNAL: FINANCIAL MARKET TRENDS – VOLUME 2014/2 © OECD 201510
interconnectedness with what is happening in emerging markets: for example a strong
rightwards shift in the saving schedule, essentially sliding down the investment schedule
in emerging market locations and requiring less investment in the West to meet world
consumer demand (as illustrated by the shift from point C to D in the right panel).4 The
interconnectedness arises as global value chains including emerging economies shift the
centre of gravity of investment, production and employment. These shifts are associated
with falling returns on equity.
Over-investment and emerging markets
Over-investment will occur when managers invest too much in projects that do not
create shareholder value – or more specifically, when returns are less than the cost of
equity resulting in the negative net present values of investments. Where this happens
collectively, due to the mispricing of risk or to the presence of inappropriate economic
policy in a country or region, financial crises can emerge, particularly where the
investment was debt financed. Systemic crises with these characteristics already occurred
in Japan and in Asia in the late 1990s. The emerging market development “model” involves
elements of trade protectionism, managed exchange rates versus the dollar, financial
repression (capital controls, financial regulations, interest rate ceilings) and other policies
such as ownership restrictions, local content requirements, approvals processes for FDI,
etc. Financial repression in particular is associated with high saving which is then
intermediated into heavy investment via state-owned banks (the rightward shift in the
saving curve noted earlier).5
Governance issues that reduce the efficiency of capital in emerging markets
A shift up of the marginal efficiency of capital schedule would correct the tendency
toward lower returns, but this requires reforms of the above restrictive policies. Instead
these factors are often compounded by governance problems of an “upstream” variety
which serve to reduce returns per unit of investment. These include regulations and red
tape, bribery and corruption (and corrupt procurement processes), unclear property rights
and long judicial processes in the event of disputes. Many governments restrict foreign
ownership of infrastructure, and SOEs often play too large a role giving rise to level playing
field issues (competition, pricing and corporate governance). These factors limit efficiency
Figure 1. Wicksell-like diagram
Source: Authors’ illustration.
Advanced economies
COEROE
0
I(1)
I(1)
I(2)
S(1)
S(1)
S(2)
AC
S,I S,I
B D
Emerging economies

INFRASTRUCTURE VERSUS OTHER INVESTMENTS IN THE GLOBAL ECONOMY AND STAGNATION HYPOTHESES
OECD JOURNAL: FINANCIAL MARKET TRENDS – VOLUME 2014/2 © OECD 2015 11
in infrastructure markets and impede competitive neutrality between SOEs and private
firms. Product market regulations that constrain competition in infrastructure raise costs
across the entire economy and affect the profitability of investments in other sectors.6
Impact on western countries
The maintenance of undervalued exchange rates, use of capital controls and trade
protectionism promotes emerging markets exports limits imports of final goods and
damages the traded goods sector in advanced economies as supply chains shift.7 The
supply of consumer goods from emerging markets and pressure on wages in the West8 acts
to keep inflation down and this, together with employment pressures, encourages an
easing bias to monetary policy in order to offset the damage to jobs via the traded good
sector. The proceeds of dollar foreign exchange interventions in emerging markets are held
in US Treasury securities acts to create downward pressure on longer-term interest rates,
including via pricing arbitrage mortgages and corporate debt.9 As more emerging countries
adopt and extend this model, more savings, investment and supply enter the global value
chains. The emerging markets have grown from 20% of world GDP in 1980 to around 50%
by 2013.
The taxation angle
Tax distortions also interact with global value chains to affect the location of business
investment from advanced countries, and the form of financing that is used. For example,
large US companies transfer intellectual property rights to Bermuda or the Cayman Islands
with zero tax and create a second company group in Ireland consisting of, say, two
subsidiaries: one that supplies the product to customers in the EU, and another which is
controlled by the company in Bermuda and receives royalties from yet another subsidiary
in the Netherlands which owns the European patent. The Bermuda-Irish grouping is a
foreign company from the viewpoint of the USA, avoiding tax treatment there. The Irish
supply company gets revenue from the EU, but has to pay a heavy royalty to the Dutch
company for use of the patent, and thereby gets a tax deduction wiping out much of the
taxable income in Ireland. The Netherlands is used in the chain because it does not levy
withholding tax for transfers within the EU: so the Dutch subsidiary transfers the royalty to
the other Irish subsidiary controlled from Bermuda. Bermuda has a zero tax rate and
receives the cash flow from the Irish company that it controls. In this way the large US tech
or pharmaceutical companies (and others) pays no tax from these sources to the USA. Cash
is held abroad, while firms borrow domestically to pay dividends and carry out buybacks.
The borrowing is of course a tax deduction for the US (and other country) businesses. This
structure reduces investment, jobs and tax revenue in the home country and may also shift
wealth distribution in favour of shareholders and away from wage earners.
Buybacks and the uncertainty issue
There are many possible reasons why companies may be uncertain and reticent to
invest in the current environment. Emerging market over-investment may result in
downward pressure on margins. The financial re-regulation process is not complete and
long-term relationships in banking are subject to change, including via the impact of
fragmentation in banking and the reduction of cross-border flows. Rule changes and
technology shifts in the operation of stock markets have reduced the use of IPOs,
particularly for small and medium-sized businesses (SMEs).10 Macro policy is not running
INFRASTRUCTURE VERSUS OTHER INVESTMENTS IN THE GLOBAL ECONOMY AND STAGNATION HYPOTHESES
OECD JOURNAL: FINANCIAL MARKET TRENDS – VOLUME 2014/2 © OECD 201512
at normal interest rate levels, and there is a sense that if this is so economic growth is not
durable at normal rates. In a low-interest rate environment some investors cheer
companies that focus on dividends and buybacks to improve investor (tax effective)
yields, in large part because growth of earnings per share is perceived as more uncertain.
This works against investment, and where borrowing (encouraged by tax incentives) is
used to pay dividends or undertake buybacks debt-equity ratios rise, exposing the firm to
greater risk in the future, and this too works against more sustainable long-term
investment.11
III. What do company data trends say about investment, stagnation and its possible causes?
National accounts data
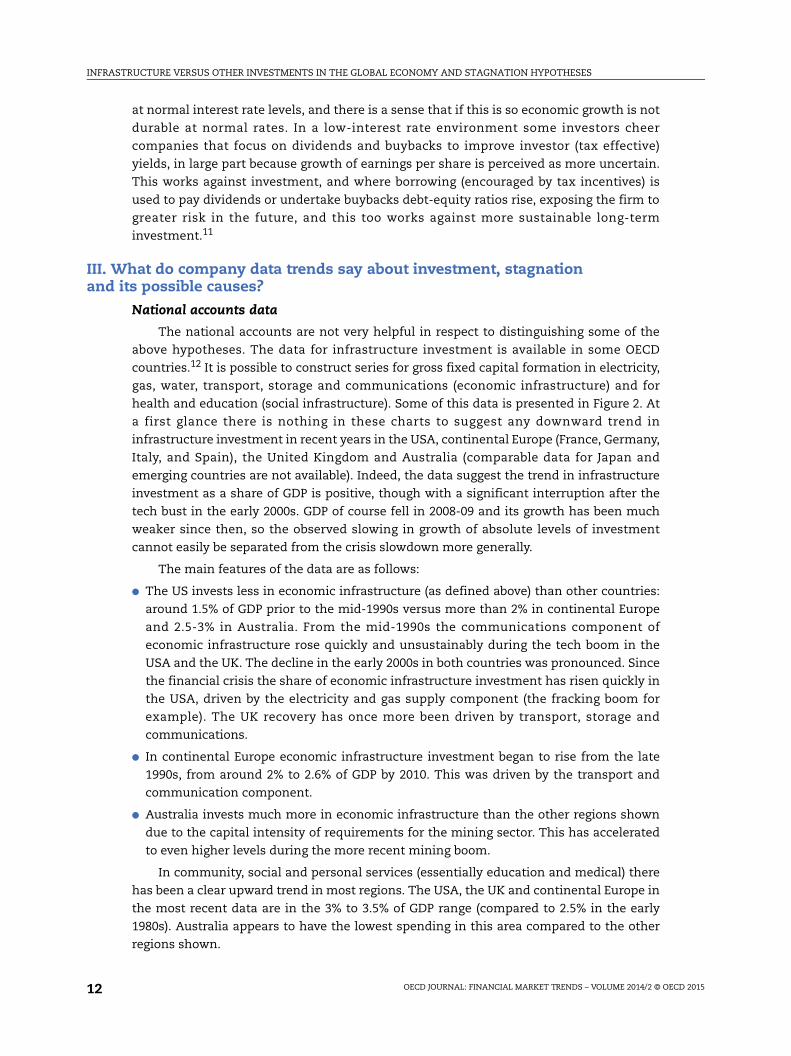
The national accounts are not very helpful in respect to distinguishing some of the
above hypotheses. The data for infrastructure investment is available in some OECD
countries.12 It is possible to construct series for gross fixed capital formation in electricity,
gas, water, transport, storage and communications (economic infrastructure) and for
health and education (social infrastructure). Some of this data is presented in Figure 2. At
a first glance there is nothing in these charts to suggest any downward trend in
infrastructure investment in recent years in the USA, continental Europe (France, Germany,
Italy, and Spain), the United Kingdom and Australia (comparable data for Japan and
emerging countries are not available). Indeed, the data suggest the trend in infrastructure
investment as a share of GDP is positive, though with a significant interruption after the
tech bust in the early 2000s. GDP of course fell in 2008-09 and its growth has been much
weaker since then, so the observed slowing in growth of absolute levels of investment
cannot easily be separated from the crisis slowdown more generally.
The main features of the data are as follows:
● The US invests less in economic infrastructure (as defined above) than other countries:
around 1.5% of GDP prior to the mid-1990s versus more than 2% in continental Europe
and 2.5-3% in Australia. From the mid-1990s the communications component of
economic infrastructure rose quickly and unsustainably during the tech boom in the
USA and the UK. The decline in the early 2000s in both countries was pronounced. Since
the financial crisis the share of economic infrastructure investment has risen quickly in
the USA, driven by the electricity and gas supply component (the fracking boom for
example). The UK recovery has once more been driven by transport, storage and
communications.
● In continental Europe economic infrastructure investment began to rise from the late
1990s, from around 2% to 2.6% of GDP by 2010. This was driven by the transport and
communication component.
● Australia invests much more in economic infrastructure than the other regions shown
due to the capital intensity of requirements for the mining sector. This has accelerated
to even higher levels during the more recent mining boom.
In community, social and personal services (essentially education and medical) there
has been a clear upward trend in most regions. The USA, the UK and continental Europe in
the most recent data are in the 3% to 3.5% of GDP range (compared to 2.5% in the early
1980s). Australia appears to have the lowest spending in this area compared to the other
regions shown.
INFRASTRUCTURE VERSUS OTHER INVESTMENTS IN THE GLOBAL ECONOMY AND STAGNATION HYPOTHESES
OECD JOURNAL: FINANCIAL MARKET TRENDS – VOLUME 2014/2 © OECD 2015 13
Figure 2. Infrastructure investment in OECD countries
Source: Authors’ calculations based on OECD structural databases.
4.0
3.5
3.0
2.5
2.0
1.5
1.0
0.5
0.0
4.0
3.5
3.0
2.5
2.0
1.5
1.0
0.5
0.0
10.0
9.0
8.0
7.0
6.0
5.0
4.0
3.0
2.0
1.0
0.0
1980
1982
1984
1986
1988
1990
1992
1994
1996
1998
2000
2002
2004
2006
2008
2010
% GDP
Continental Europe Australia United Kingdom United States
Power generation and transport
Community, social and personal services
Total
% GDP
%GDP

INFRASTRUCTURE VERSUS OTHER INVESTMENTS IN THE GLOBAL ECONOMY AND STAGNATION HYPOTHESES
OECD JOURNAL: FINANCIAL MARKET TRENDS – VOLUME 2014/2 © OECD 201514
Overall, total infrastructure spending in the USA and continental Europe has moved
up from the 4-5% range in the early 1980s to the 5-6% range in 2010. While the composition
is very different, Australia has moved up from the bottom end of those ranges in the early
1980s to the top end by 2010.
This national accounts data is of limited value however. It does not separate private
infrastructure from government investment, the relative extent of which differs between
countries, and certainly comparable emerging market data are not available. While the
focus of the stagnation discussion is on the falling natural interest rate, this national
accounts data cannot be matched with the return on equity and other financial features of
investing firms that would help to distinguish between different hypotheses.
Private company data
To help provide a picture of what is happening to investment in the private sector in
different regions, capital spending by companies in industries associated with
infrastructure and for other non-financial sectors is collected for all listed companies
from the Bloomberg global equity index consisting of more than 9 000 companies.13 The
data are described in Annex 1. It is important to analyse investment associated with
infrastructure alongside other industries as the characteristics are very different:
infrastructure is more capital intensive, is more associated with state ownership, and is
less associated with multi-national enterprise (MNE) activity in global value chains than is
the case for non-infrastructure.
The following corporate concepts will be used to explore ideas about which
hypotheses seem to find support in the data.
● Financial structure is calculated as the ratio of long-term debt (D) to “enterprise value”,
or debt plus equity (E), i.e. D/(D + E).
● The return on equity (ROE) will be used to proxy the “natural interest rate” (net income/
shareholders equity). The cost of equity is the dividend plus buyback yield added to the
trend growth in company earnings. The borrowing rate is the AAA corporate bond rate in
the country where the company is listed.
● To understand the flow accounting concepts, it will be helpful to keep in-mind a simplified
accounting identity:
Operating Cash Flow + Net Borrowing = Capital Expenditure + Dividends and Buybacks + Net
Asset Purchases + Net Cash Accumulation
Operating cash flow (net income adjusted for receivables, payables and inventory
changes) is a key concept that pertains to how much cash companies are generating to
maintain and grow their businesses without external financing. They can use internal and
external financing: to invest; pay dividends or undertake net share buybacks; buy assets
(net) with cash (e.g. buying stakes in other companies); or they may simply accumulate
cash balances in the bank. The company data is aggregated up to the USA, Europe (the
European Union and Switzerland), Japan and all emerging market countries. The data of
course can be disaggregated to any individual country, and all financial concepts are
perfectly matched with the companies whose capital spending is being anlaysed.
Corporate sales and capital spending
Sales and capital expenditure by companies for infrastructure and (non-financial) non-
infrastructure industries are shown in billions of dollars in Figures 3 and 4, respectively.

INFRASTRUCTURE VERSUS OTHER INVESTMENTS IN THE GLOBAL ECONOMY AND STAGNATION HYPOTHESES
OECD JOURNAL: FINANCIAL MARKET TRENDS – VOLUME 2014/2 © OECD 2015 15
● Infrastructure sales and capital spending (Figure 3): in general sales growth appears to exhibit
signs of stagnation post the crisis, particularly in Europe. Japan has been falling behind
over a much longer period. Emerging market sales have done better, passing Europe in
dollar terms (but not the USA). The picture is different for capital spending, however,
where the US shows less sign of stagnation post the crisis, while emerging markets and
Europe certainly do. Japan has been stagnant for much longer.
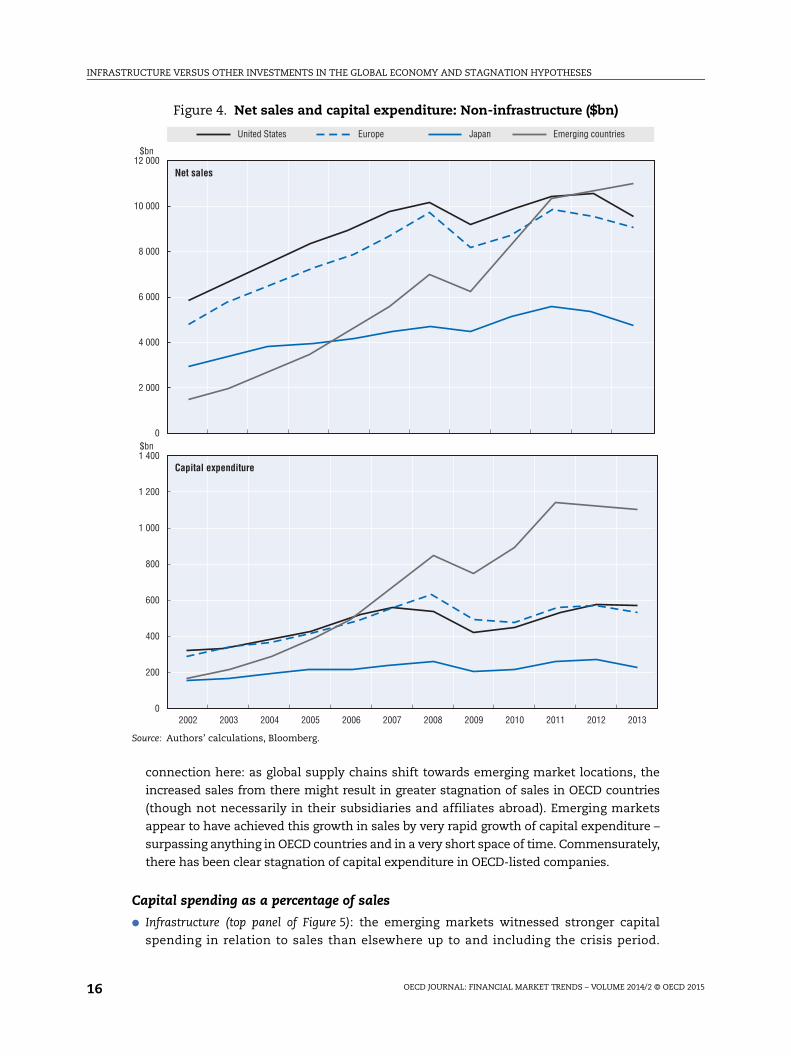
● Non-infrastructure sales and capital spending (Figure 4): the most striking pattern here is the
very strong growth in emerging market sales (though 2013 may be the start of a reversal).
From being well below in 2002 emerging company sales are now stronger than all other
regions. The US, Europe and Japan, on the other hand, do appear to have slowed since
the crisis (Japan for much longer). It would seem reasonable to suppose that there is a
Figure 3. Net sales and capital expenditure: Infrastructure ($bn)
Source: Authors’ calculations, Bloomberg.
$bn
1 500
2 500
2 000
0
350
300
250
200
150
100
50
02002 2003 2004 2005 2006 2007 2008 2009 2010 2011 2012 2013
1 000
500
$bn
United States Europe Japan Emerging countries
Net sales
Capital expenditure
INFRASTRUCTURE VERSUS OTHER INVESTMENTS IN THE GLOBAL ECONOMY AND STAGNATION HYPOTHESES
OECD JOURNAL: FINANCIAL MARKET TRENDS – VOLUME 2014/2 © OECD 201516
connection here: as global supply chains shift towards emerging market locations, the
increased sales from there might result in greater stagnation of sales in OECD countries
(though not necessarily in their subsidiaries and affiliates abroad). Emerging markets
appear to have achieved this growth in sales by very rapid growth of capital expenditure –
surpassing anything in OECD countries and in a very short space of time. Commensurately,
there has been clear stagnation of capital expenditure in OECD-listed companies.
Capital spending as a percentage of sales
● Infrastructure (top panel of Figure 5): the emerging markets witnessed stronger capital
spending in relation to sales than elsewhere up to and including the crisis period.
Figure 4. Net sales and capital expenditure: Non-infrastructure ($bn)
Source: Authors’ calculations, Bloomberg.
12 000
10 000
8 000
6 000
4 000
2 000
0
1 400
1 200
1 000
800
600
400
200
02002 2003 2004 2005 2006 2007 2008 2009 2010 2011 2012 2013
$bn
United States Europe Japan Emerging countries
Net sales
$bn
Capital expenditure

INFRASTRUCTURE VERSUS OTHER INVESTMENTS IN THE GLOBAL ECONOMY AND STAGNATION HYPOTHESES
OECD JOURNAL: FINANCIAL MARKET TRENDS – VOLUME 2014/2 © OECD 2015 17
Subsequently, these ratios have been declining in complete contrast to the USA where
they have been rising. The USA now invests the greatest ratio of infrastructure to sales.
Japan’s capital spending share is the smallest, and that of Europe is gradually declining.
In relation to US sales, there is no sign of ’stagnation’ in US infrastructure investment
post the crisis, but the reverse appears to be the case in emerging markets. Europe and
Japan invest less than the US and emerging markets.
● Non-infrastructure (bottom panel of Figure 5): The emerging market capital spending ratio to
sales appears to be extremely capital extensive, dwarfing the investment of other
regions. Notwithstanding the huge share, the trend for emerging markets is in the
downward direction since 2009. The US ratio of investment to sales, while much smaller,
has been rising since the crisis (inconsistent with stagnation views).
The company data analysed to this point appear to be broadly consistent with
stagnation of sales of companies listed in the US, Europe and Japan. But this is not the case
Figure 5. Capital spending as a percentage of company sales
Source: Authors’ calculations, Bloomberg.
% net sales
United States Europe Japan Emerging countries
% net sales
20
18
16
14
12
10
8
6
4
2
0
14
12
10
8
6
4
2
02002 2003 2004 2005 2006 2007 2008 2009 2010 2011 2012 2013
Infrastructure
Non-infrastructure
INFRASTRUCTURE VERSUS OTHER INVESTMENTS IN THE GLOBAL ECONOMY AND STAGNATION HYPOTHESES
OECD JOURNAL: FINANCIAL MARKET TRENDS – VOLUME 2014/2 © OECD 201518
for companies listed in emerging markets (including advanced country subsidiaries and
minority stakes), where sales in non-infrastructure (mainly consumer goods) have been
booming as has investment. This is broadly consistent with the view that investment and
sales are shifting globally in a very meaningful way to emerging markets where local
companies, western subsidiaries and minority interests are positioning to take advantage
of global supply chains and trade in value added. The investment in emerging markets is
also consistent with the heavy savings and investment development strategy described
earlier.
What sort of infrastructure investment?
The regional percentage of total infrastructure spending in four different categories:
telecommunications, cable and satellite; transport; electricity and pipelines; and oil and
related industries are shown in in the left panel of Figure 6. Investment as a share of sales
by sector and country is shown in the right panel.
With its natural energy resource availability, the US listed companies devotes a huge
45% of capital spending on infrastructure in the oil-related industries: oil exploration, oil
refining, and oil and gas drilling. Exploration and production by integrated oil and gas firms
have dominated investment in this industry in the USA, rising sharply from the mid-2000s
(fracking has been a large part of this). Perhaps related to this has been strong growth in
electricity, gas and pipelines and transport in the USA. The US appears to have moved on
from the tech boom sector of telecom, cable and satellite.
Some emerging market countries also have huge natural resources, and the share of
infrastructure investment in them has been rising continuously, though not as a share of
sales (on the right hand side) as in the USA. Electricity gas and pipelines had been rising up
until the crisis, but the trend has reversed downwards in recent years. Transport has the
smallest share on infrastructure investment, and it has been very weak since 2009. While
the overall share of telecom, mobile and satellite has been falling in EMEs, it is nevertheless
still very important at around 40% of the total, and as a share of sales EMEs tend to invest
more than other countries.
Japan and Europe, with poor natural resource endowments devote very little to oil-
related industries. Instead, both Europe and Japan invest by far the largest proportion in
telecommunications, cable- and satellite-related industries. Given its shortage of natural
resources and dependence on other regions for gas, Europe’s investment in electricity gas
and pipelines is substantial, both as a share of the total spend and as a share of net sales
within the sector. Japan also devotes a high overall share to transport, almost double
anywhere else, which seems odd in a small heavily-populated geography, where
diminishing returns may be problematic.
IV. What do the company financial data say about stagnation and risk?
Debt-to-enterprise-value ratios
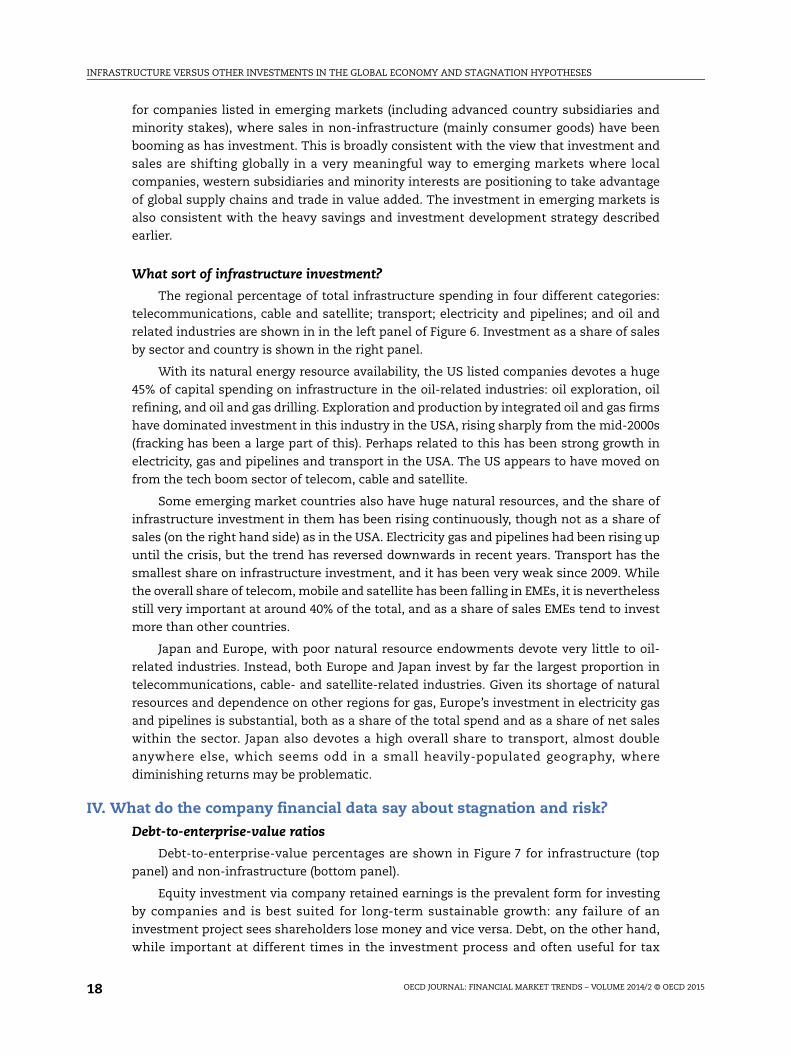
Debt-to-enterprise-value percentages are shown in Figure 7 for infrastructure (top
panel) and non-infrastructure (bottom panel).
Equity investment via company retained earnings is the prevalent form for investing
by companies and is best suited for long-term sustainable growth: any failure of an
investment project sees shareholders lose money and vice versa. Debt, on the other hand,
while important at different times in the investment process and often useful for tax

INFRASTRUCTURE VERSUS OTHER INVESTMENTS IN THE GLOBAL ECONOMY AND STAGNATION HYPOTHESES
OECD JOURNAL: FINANCIAL MARKET TRENDS – VOLUME 2014/2 © OECD 2015 19
advantages, remains with the firm when investments fail. Debt-financed over-investment
was a key characteristic of the Asia crisis of the late 1990s. Borrowing to pay dividends and
buybacks, which is encouraged by the tax system, would also work towards a debt bias and
against long-term investment.
A number of observations about debt-to-enterprise-value ratios stand out:
● Investment in infrastructure is associated with higher debt ratios than in other
industrial groupings, due to: early stage financing needs; longer horizons for revenue
benefits; and/or taking advantage of interest deductibility in the tax structuring of
ownership and management rights. In emerging markets SOE banks also play a large
Figure 6. The structure of infrastructure investment: USA, Europe, Japan and emerging economies
Source: Bloomberg, authors’ calculations.
20
70
60
50
40
30
20
10
0
70
60
50
40
30
10
0
20
70
60
50
40
30
10
0
20
70
60
50
40
30
10
0
2002
2003
2004
2005
2006
2007
2008
2009
2010
2011
2012
2013 20
0220
0320
0420
0520
0620
0720
0820
0920
1020
1120
1220
13
25
20
15
10
5
0
12
10
8
6
4
0
2
25
20
15
10
5
0
161412
864
10
20
United States EuropeJapan Emerging countries
% total
United States EuropeJapan Emerging countries
% total
% net sales
% net sales
% total % net sales
% total % net sales
Telecom, cable and satellite
Transport
Electricity, gas and pipelines
Oil related industries
Telecom, cable and satellite
Transport
Electricity, gas and pipelines
Oil related industries
INFRASTRUCTURE VERSUS OTHER INVESTMENTS IN THE GLOBAL ECONOMY AND STAGNATION HYPOTHESES
OECD JOURNAL: FINANCIAL MARKET TRENDS – VOLUME 2014/2 © OECD 201520
role in financing infrastructure and may operate with less-than-commercial terms. For
all countries, debt-to-enterprise value is about 30% for infrastructure, and 20% for other
industries (on average) over the period shown.
● While there is a lot of press about individual US companies borrowing too much to return
capital to shareholders via dividends and buybacks (while foreign subsidiaries hold cash
earnings and royalty payments abroad), this is not reflected as a general tendency in the
overall data for debt-to-enterprise-value trends. The ratio for US infrastructure
companies has been trending down since 2008, and at 25% of enterprise value is below the
global average. For non-infrastructure US companies there is no sign of an upward trend.
● Japan (a country where stagnation has been at work for a long time) has the highest
debt-to-enterprise-value by some margin (42% average for infrastructure and 28% for
other industries). For both infrastructure and other industries debt ratios post the crisis
are generally higher than mid 2000 levels.
Figure 7. Debt-to-enterprise-value ratios
Source: Bloomberg, authors’ calculations.
60
50
40
30
20
10
0
40
35
30
20
25
15
10
02002 2003 2004 2005 2006 2007 2008 2009 2010 2011 2012 2013
5
%
Infrastructure
%
Non-infrastructure
United States Europe Japan Emerging countries

INFRASTRUCTURE VERSUS OTHER INVESTMENTS IN THE GLOBAL ECONOMY AND STAGNATION HYPOTHESES
OECD JOURNAL: FINANCIAL MARKET TRENDS – VOLUME 2014/2 © OECD 2015 21
● Europe is closer to Japan in debt structure for infrastructure, and the post-crisis levels
appear more challenging than before. Non-infrastructure industries do not appear out of
line with US ratios.
● The situation is very different in emerging markets. The debt ratios were low prior to the
crisis (13% for infrastructure and 9% for other industries in 2007). Subsequently debt-to-
enterprise-value ratios have been rising rapidly. For infrastructure the level has moved
up quickly to over 30% of enterprise value, and for other industries to 25%, in both cases
now approaching Japanese levels.
Encouraging sustainable long-term investment requires retained earnings to be put to
work and initial public offerings (IPOs) for new companies and less reliance on debt. The
global patterns are uneven, but it seems that the speed of acceleration of borrowing in
emerging markets is much greater than elsewhere and reminiscent of 1990s Asia crisis
trends.
Rates of return on equity
The rate of return on equity for infrastructure and for other industrial companies in
the four country groupings are set out in panels one and two of Figure 8, respectively.
While the averages are around 10%, they vary over time and across regions. The over-
investment notion mentioned by Glenn Stevens appears consistent with some of the ROE
data. For example, it is immediately apparent that Japan, a country known for over-
investment in previous decades, has average ROEs that sit well below that of other
countries in non-infrastructure (though it has begun to move up in more recent years).
More generally:
● The ROE for infrastructure: is less cyclical compared to other industries. Consistent with
the idea of over investment during the tech boom and bust, the ROE is extremely low in
the early 2000s in OECD countries, and recovers in 2004. However, in both Europe and
emerging countries the ROE appears to begin moving down from even before the crisis of
2008-09. The US ROE, on the other hand, has moved up since the crisis towards the
highest level of the period shown (to 14%, very far from the notion of a falling natural
rate). In the energy-related infrastructure in the US there appears to be no sign of
stagnation.
● The ROE for non-infrastructure: is more cyclical, but also shows some broader downward
movement in the emerging markets and Europe, whereas the US has fully recovered to
pre-crisis levels of around 14%. Japanese ROEs appear to be rising, though it is still the
lowest at just under 8%.
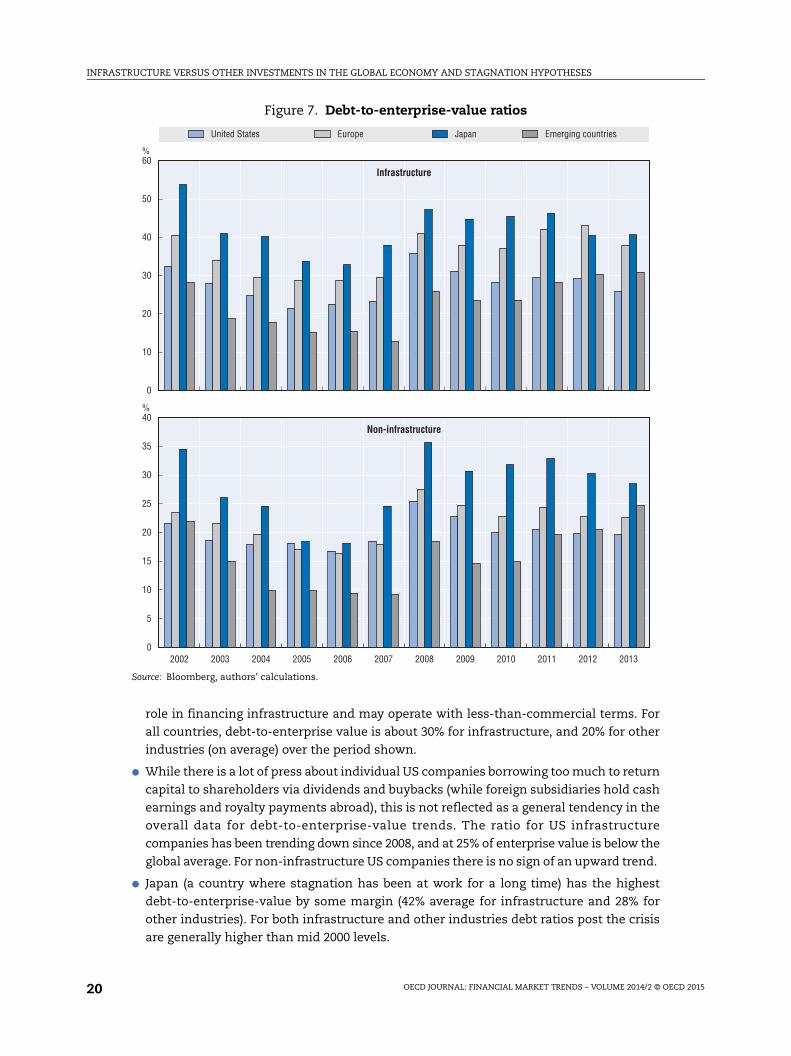
● Some European detail on ROEs: The above discussion has made reference to the special
problems of Europe in running a monetary union in the face of asymmetric real shocks
emanating from emerging markets. Two questions arise: do European countries like
Switzerland and the UK that have floating exchange rates do better than their euro area
counterparts; and do companies in countries in the south of Europe face greater ROE
pressures compared to those in the north? Figure 9 shows the ROEs for the non-
infrastructure sector of seven European countries. This sector is much larger in size than
infrastructure and is more directly in competition with emerging markets.
Since peaking in 2005, following the recovery after the tech bust recession, ROEs have
been under downward pressure in the euro-area countries, but particularly so in the case

INFRASTRUCTURE VERSUS OTHER INVESTMENTS IN THE GLOBAL ECONOMY AND STAGNATION HYPOTHESES
OECD JOURNAL: FINANCIAL MARKET TRENDS – VOLUME 2014/2 © OECD 201522
of France, Italy and Spain. Germany, a major exporter of high-technology capital goods, has
held up rather well. The Swiss and UK economies with floating exchange rates have had
the best overall performance of company ROEs in the face of the crisis and the pressures of
globalisation. In 2013 the UK ROE for the companies covered is 11.5% and for Switzerland
12.2%, versus 10% for German companies, 7.5% for France and Italy and 3.7% for Spain.
The downward pressure on ROEs outside of the USA are consistent with a number of
interpretations, but two hypotheses come to mind: i) possible over investment in non-
infrastructure related to financial repression and the savings glut notion in emerging
markets; and ii) possible governance problems in infrastructure that raise costs and
reduce competitiveness (absence of a competitive banking system supported by capital
controls, local content requirements, ownership restrictions, role for SOEs, competition
restrictions in industry, etc.) in both advanced (particularly Europe)14 and emerging
countries. These problems may be compounded in southern European problems which
cannot adjust exchange rates in the face of structural differences with the north, and
hence may have a need to adjust governance and competition impediments even more
aggressively.
Figure 8. ROEs matched to the companies in each grouping
Source: Bloomberg, authors’ calculations.
20
15
10
5
0
20
15
10
5
0
%
Infrastructure
Emerging countries United States Europe Japan
%
Non-infrastructure
2002 20052003 2004 20072006 2008 2009 2010 2011 2012 2013
INFRASTRUCTURE VERSUS OTHER INVESTMENTS IN THE GLOBAL ECONOMY AND STAGNATION HYPOTHESES
OECD JOURNAL: FINANCIAL MARKET TRENDS – VOLUME 2014/2 © OECD 2015 23
ROE minus the cost of equity
Retained earnings fund most private investment in both infrastructure and other
industries. Countries with systems that rely more heavily on borrowing (Europe and Japan)
have not had a good economic record on successful investment to support long-term
growth. If the ROE is less than the cost of equity company managers cannot create value,
the net present value of investments is negative, and they might be incentivised to return
cash to shareholders. The cost of equity15 matched to the companies in this study is
compared to the ROEs in Figure 10.
● Emerging markets: The ROE minus the cost of equity has recently become negative for
both infrastructure and non-infrastructure companies, and noticeably so for the
former. This reinforces the notion that there may be serious governance problems
related to restrictions on ownership, SOE activity, etc. that make it difficult for private
companies to add value in the infrastructure sector. This affects other industries
directly. In the non-infrastructure sector (declining) returns are typically just below the
cost of equity.
● Japan: The ROE is low though improving, but the cost of equity is also very low due to its
low dividend yield and weaker earnings-per-share (EPS) growth. Managers in Japan have
a greater incentive now to create value by retaining equity to invest than in the prior lost
decades.
● United States: The data for the US do not seem consistent with stagnation theories. The
clearly positive ROE and cost of equity differentials for both infrastructure and other
industries are higher than elsewhere and suggest managers can certainly create
value.
● Europe: lower ROEs matched with a somewhat lower cost-of-equity hurdle is the main
cause of the positive differential (lower dividends, buybacks and EPS growth). There is
clearly plenty of scope for companies to add value, yet they appear to be holding back.
Figure 9. European ROEs
Source: Bloomberg, authors’ calculations.
25
2002 2003 2004 2005 2006 2007 2008 2009 2010 2011 2012 2013
20
15
10
5
0
-5
%
France United Kingdom Germany SwitzerlandSpainItaly

INFRASTRUCTURE VERSUS OTHER INVESTMENTS IN THE GLOBAL ECONOMY AND STAGNATION HYPOTHESES
OECD JOURNAL: FINANCIAL MARKET TRENDS – VOLUME 2014/2 © OECD 201524
The ROE minus the cost of debt
Debt overall plays a lesser role in financing investment that retained earnings, but is a
relatively more important source of external finance in infrastructure than in other industries.
The ROE minus the AAA corporate rate in the jurisdiction concerned is shown in Figure 11 for
infrastructure companies in the top panel and for other industries in the bottom panel.
Once AAA borrowing rates are subtracted from ROEs a similar configuration emerges
for the infrastructure companies in the OECD countries, particularly since the crisis.
Interest rates appear to have fallen far enough to be consistent with borrowing for an
investment cycle. Japan already had low borrowing rates and the rise in the ROE has done
most of the work in improving the attractiveness of debt-financed investment. The US and
Europe have reduced rates substantially compared to pre-crisis years by around 300 basis
points improving the relative attractiveness of borrowing. The US situation looks
particularly outstanding in this respect, with the ROE rising and AAA rates falling.
The stagnation hypothesis appears to be more apparent in the case of emerging
market infrastructure. Since 2008, the ROE spread to the AAA borrowing rate has remained
low, and significantly below OECD countries. Here it has to be borne in mind that most EME
corporate debt is in higher risk category than AAA, and for many companies the net
present value of such investment projects would be negative. The “governance” factors
Figure 10. ROE minus the cost of equity
Source: Bloomberg, authors’ calculations.
%
Emerging countries United States Europe Japan
%
10Infrastructure
Non-infrastructure
5
0
-5
-10
-15
10
5
0
-5
-10
-15
2002 2003 2004 2005 2006 2007 2008 2009 2010 2011 2012 2013

INFRASTRUCTURE VERSUS OTHER INVESTMENTS IN THE GLOBAL ECONOMY AND STAGNATION HYPOTHESES
OECD JOURNAL: FINANCIAL MARKET TRENDS – VOLUME 2014/2 © OECD 2015 25
discussed earlier reduce the ability of managers to provide value for shareholders. The
combined influence of these factors increases risk premiums associated with investment
in these countries and add to borrowing costs.16
For non-infrastructure companies the broad picture is the same, though the emerging
market spread to AAA interest rates looks a little more attractive than is the case for
infrastructure, possibly helping to explain the noticeable difference in investment patterns
between the two sectors.
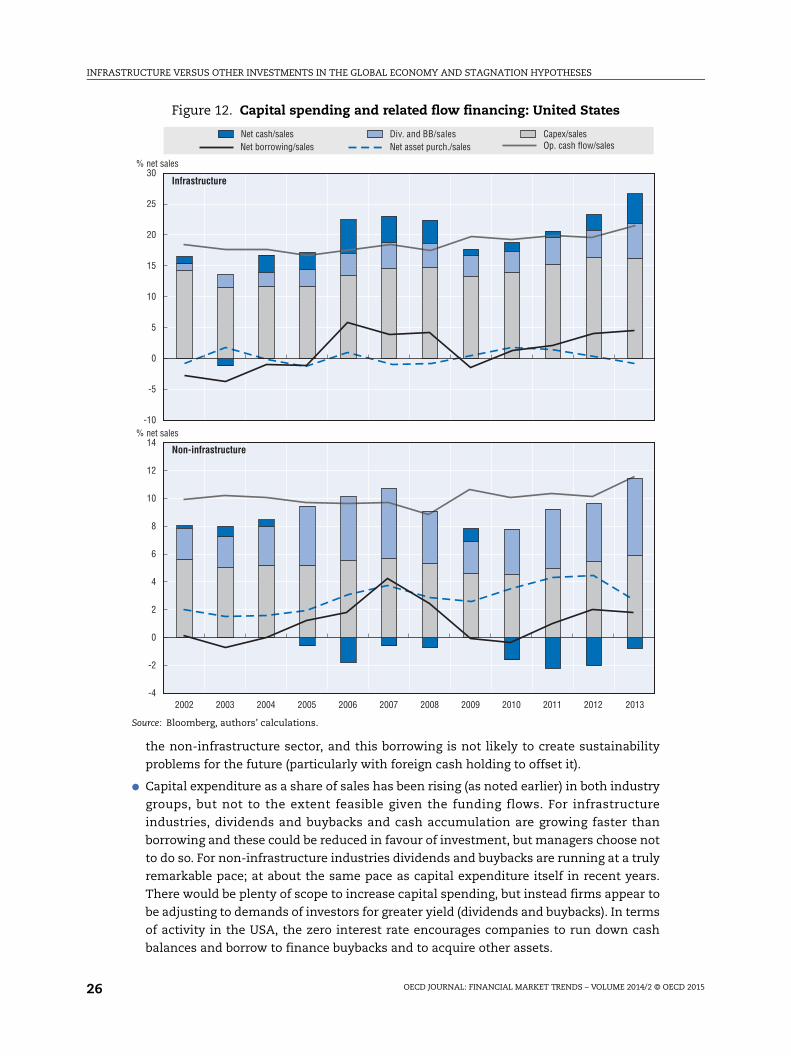
United States company financing flows
The flow financing concepts for companies in infrastructure and non-infrastructure
industries in the Unites States are shown in Figure 12.
● Operating cash flow as a share of sales is rising for both infrastructure (since 2005) and
non-infrastructure industries (since 2008), and is more than sufficient to cover both
investment and buybacks.
● Borrowing was strong just prior to the crisis in both sectors and has been picking up
again since 2010. This seems to be broadly correlated to the cycle of dividends and
buybacks. However, it is worth recalling from Figure 7 that the USA has the lowest debt-
to-enterprise-value ratio of all the country groupings here, in both infrastructure and for
Figure 11. ROE minus the AAA corporate bond rate
Source: Bloomberg, authors’ calculations.
15Infrastructure
Non-infrastructure
10
5
0
-5
-10
-15
15
10
5
0
-5
-10
-152002 2003 2004 2005 2006 2007 2008 2009 2010 2011 2012 2013
%
Emerging countries United States Europe Japan
%
INFRASTRUCTURE VERSUS OTHER INVESTMENTS IN THE GLOBAL ECONOMY AND STAGNATION HYPOTHESES
OECD JOURNAL: FINANCIAL MARKET TRENDS – VOLUME 2014/2 © OECD 201526
the non-infrastructure sector, and this borrowing is not likely to create sustainability
problems for the future (particularly with foreign cash holding to offset it).
● Capital expenditure as a share of sales has been rising (as noted earlier) in both industry
groups, but not to the extent feasible given the funding flows. For infrastructure
industries, dividends and buybacks and cash accumulation are growing faster than
borrowing and these could be reduced in favour of investment, but managers choose not
to do so. For non-infrastructure industries dividends and buybacks are running at a truly
remarkable pace; at about the same pace as capital expenditure itself in recent years.
There would be plenty of scope to increase capital spending, but instead firms appear to
be adjusting to demands of investors for greater yield (dividends and buybacks). In terms
of activity in the USA, the zero interest rate encourages companies to run down cash
balances and borrow to finance buybacks and to acquire other assets.
Figure 12. Capital spending and related flow financing: United States
Source: Bloomberg, authors’ calculations.
% net sales
Net borrowing/sales Net asset purch./sales Op. cash flow/salesNet cash/sales Capex/sales
30
25
20
15
10
5
0
-5
-10
14
12
10
8
6
4
2
0
-2
-4
Infrastructure
Non-infrastructure
2002 2003 2004 2005 2006 2007 2008 2009 2010 2011 2012 2013
% net sales
Div. and BB/sales

INFRASTRUCTURE VERSUS OTHER INVESTMENTS IN THE GLOBAL ECONOMY AND STAGNATION HYPOTHESES
OECD JOURNAL: FINANCIAL MARKET TRENDS – VOLUME 2014/2 © OECD 2015 27
European company financing flows
The flow financing concepts for European companies in infrastructure and non-
infrastructure industries are shown in Figure 13.
● Operating cash flows have not been rising like those in the USA. Infrastructure is flat and
for non-infrastructure industries there is a clear downward shift after the crisis
(following the aid provided via subsidies in 2009), consistent with margin pressures.
Borrowing rose for two years in 2011 and 2012, also possibly helped by support measures
in some countries in 2009 (including guarantees and interest rate subsidies). But
borrowing has fallen back to zero for these companies in 2013.
Figure 13. Capital spending and related flow financing: Europe
Source: Bloomberg, authors’ calculations.
25
20
15
10
5
0
-5
14
12
10
8
6
4
2
0
-2
2002 2003 2004 2005 2006 2007 2008 2009 2010 2011 2012 2013
% net sales
Net borrowing/sales Net asset purch./sales Op. cash flow/salesNet cash/sales Div. and BB/sales Capex/sales
% net sales
Infrastructure
Non-infrastructure

INFRASTRUCTURE VERSUS OTHER INVESTMENTS IN THE GLOBAL ECONOMY AND STAGNATION HYPOTHESES
OECD JOURNAL: FINANCIAL MARKET TRENDS – VOLUME 2014/2 © OECD 201528
● Dividends and buybacks are in line with those of the USA in infrastructure, but are only
half of what US companies pay (per unit of sales) in non-infrastructure industries. While
there is no marked tendency for this component to rise in aggregate in Europe,
companies in the UK and Switzerland (not shown) do indeed look very similar to the
USA, with very strong growth in buybacks. The accumulation of cash balances has
declined, and the net acquisition of assets is much less than in the USA.
● As noted in Figure 7, debt/equity ratios are high for European infrastructure and this,
combined with a weak economy, is not conducive to raising even more debt to fund
capital expenditure. Debt levels are not especially high in non-infrastructure industries,
and new borrowing is weak due to both (banking) supply and also to demand factors.
Japanese company financing flows
The flow financing concepts for Japanese companies in infrastructure and non-
infrastructure industries are shown in Figure 14.
● Operating cash flow as a ratio to sales for infrastructure (in the top panel) is around 60%
higher than for other industries (bottom panel). While this is also the case in other
country groups, Japan is unique in that the ROEs are also much lower in non-
infrastructure, suggesting that other factors are at work. Borrowing overall is flat in both
sectors, as companies try to deal with restructuring from high debt-to-enterprise-value
ratios from the past.
● For non-infrastructure companies operating cash flow is well in excess of any capital
spending, and dividends and buybacks are miniscule compared to companies in other
countries. Non-infrastructure companies appear to prefer acquiring other assets such as
shares in other companies. This may reflect in part some effect of vertical kieretsu
structures in Japan, as well as participation in global value chains.
● Tax rules appear to have a large impact on dividend repatriation from foreign subsidiaries.
For non-infrastructure industries there is a sudden rise in operating earnings in 2009-10,
presumably related to the tax reform at the time, which also results in a corresponding
drop in borrowing. A greater role for foreign dividends may explain some of the rise in
operating earnings in recent years. The tax reform of 2009-10 has had a big impact on the
observed behaviour of multi-national companies (De Mooij and Saito, 2014). In 2009 most
of the dividends received by parent companies were exempted from tax if the ownership
in the foreign company is at least 25 percent. Foreign subsidiaries as a result began to
remit more dividends to Japanese parents.
Like Europe, Japan is traditionally more debt financed compared to the USA, and its
debt-to-enterprise-value ratios are higher in both infrastructure and other industries (see
Figure 7). The Japanese corporate tax rate is often mentioned as a contributor to these high
debt ratios compared to other countries (De Mooij and Saito, 2014). Presumably a major
objective of policy in Japan would be to use tax reform and other measures reduce debt
ratios and to make equity holdings more attractive. As noted earlier, investment in equity
is ultimately the best way to fund long-term investment.
Emerging market company financing flows
The situation in emerging markets shown in Figure 15 is quite different to that in
advanced countries.

INFRASTRUCTURE VERSUS OTHER INVESTMENTS IN THE GLOBAL ECONOMY AND STAGNATION HYPOTHESES
OECD JOURNAL: FINANCIAL MARKET TRENDS – VOLUME 2014/2 © OECD 2015 29
Prior to the mid 2000s operating cash flow as a share of sales was ample to fund
capital spending and dividends and buybacks in both sectors. However, from 2004
operating cash flow has been moving down continuously, even ignoring the impact of the
crisis. This emerging market experience is consistent with margin compression.
Notwithstanding this, capital expenditure continued to rise as a share of net sales until
2008, in both sectors.
● In the case of infrastructure: Capital spending rose and peaked at 18.6% of net sales in 2008
(compared to 14.7% in the USA) and subsequently has fallen sharply to 13.8% in 2013
(while the USA has moved up to over 16%). Prior to 2006 operating cash flow was
sufficient to fund capital expenditure and buybacks and, with a marked rise in
borrowing (to 11% of sales), net asset acquisitions also rose. Subsequently, as the
Figure 14. Capital spending and related flow financing: Japan
Source: Bloomberg, authors’ calculations.
12
10
8
6
4
2
0
-2
-42002 2003 2004 2005 2006 2007 2008 2009 2010 2011 2012 2013
% net sales
Net borrowing/sales Net asset purch./sales Op. cash flow/salesNet cash/sales Div. and BB/sales Capex/sales
20
15
10
5
0
-5
-10% net sales
Infrastructure
Non-infrastructure

INFRASTRUCTURE VERSUS OTHER INVESTMENTS IN THE GLOBAL ECONOMY AND STAGNATION HYPOTHESES
OECD JOURNAL: FINANCIAL MARKET TRENDS – VOLUME 2014/2 © OECD 201530
downtrend in operating cash flow followed, capital expenditure and acquisitions have
been cut back and borrowing has been falling as a share of net sales.
● For non-infrastructure companies: Capital intensity seems to be extraordinary compared to
other regions. It peaked at over 12% of sales in 2008 (compared to levels in the range of
5-6% for the USA, Europe and Japan), subsequently moving down to a still high 10%
(versus a 4.8 to 5.9% range elsewhere in 2013). Net asset acquisitions following the crisis
are lower than for the period before it. Operating cash flow declined, particularly after
2010, and capital expenditure and borrowing to fund it has remained firm (particularly
in the past three years).
The debt-to-enterprise value ratio for infrastructure at 31% in Figure 7 is approaching
the high levels for Japan and Europe (over 40%). The trend for non-infrastructure emerging
Figure 15. Capital spending and related financing: Emerging countries
Source: Bloomberg, authors’ calculations.
30
25
20
15
10
5
0
-5
20
15
10
5
0
-52002 2003 2004 2005 2006 2007 2008 2009 2010 2011 2012 2013
% net sales
Net borrowing/sales Net asset purch./sales Op. cash flow/salesNet cash/sales Div. and BB/sales Capex/sales
% net sales
Infrastructure
Non-infrastructure

INFRASTRUCTURE VERSUS OTHER INVESTMENTS IN THE GLOBAL ECONOMY AND STAGNATION HYPOTHESES
OECD JOURNAL: FINANCIAL MARKET TRENDS – VOLUME 2014/2 © OECD 2015 31
market industries is approaching the high debt-versus-equity bias of Japan: this ratio rose
from a trough of 9% in 2007 to around 25% in 2013. The apparent sharp upward movement
in debt versus equity in emerging markets is a concern. Emerging markets debt ratios
appear to be moving exactly in the opposite directions to those in the USA: the US bias
towards equity is more conducive to sustainable long-term investment than the emerging
markets tendency towards higher debt.
V. “Openness” measures to capture potential “governance costs” for investorsGovernment policies of financial repression (to help fund their own expenditures
cheaply) and exchange rate targeting to support export market share carry direct cost for
companies that use banks and capital markets to fund investment. Financial repression
measures include the capping of interest rates, high bank reserve requirements,
prescriptive policies for bank holding of government debt, government ownership of
domestic banks and restrictions on the transfer of assets abroad via capital controls.
Exchange rate targeting includes foreign exchange intervention combined with the use of
explicit capital controls as well as the use of bank regulation and currency-based measures
(that restrict the free movement of capital without having appeared to impose direct
control on cross-border flows). These measures raise transactions costs in the capital
markets faced by firms and reduce the breadth and depth of markets that lead to liquidity
problems (particularly in crisis periods).
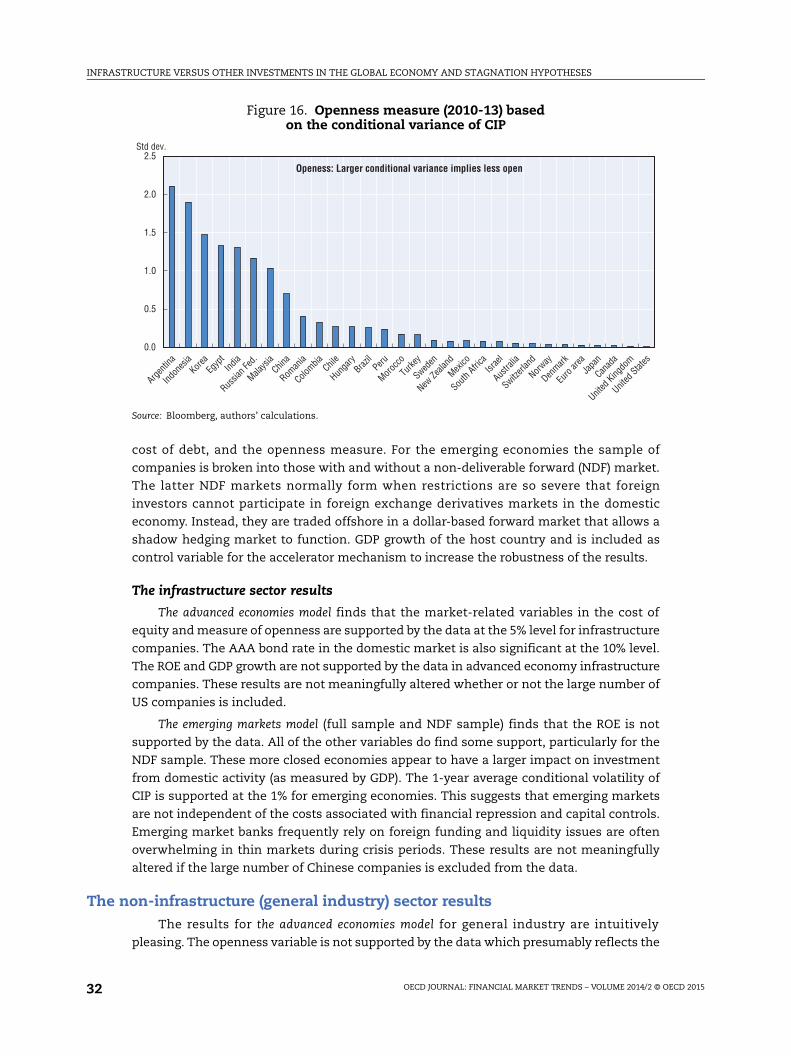
To capture the influence of such governance issues that reduce the openness of
economies via their banking systems, the 1-year (average) conditional variance of Covered
Interest Parity (CIP) is used (the technical details of which are set out in Annex 2). CIP is
chosen as it excludes currency risk and focuses on return differentials between currencies
which (apart from low transactions cost and white noise) should not be persistently
present in a competitive and open financial system. Movements towards greater openness
should see covered differentials diminish and their variance decline over time as arbitrage
channels are allowed to operate. The extent of deviations from CIP and the speed with
which they can be arbitraged away for the domestic banking system versus open-economy
dollar prices can be modelled as an autoregressive structure in both the mean and the
variance, and the estimated conditional variance can be used as a measure of openness of
the banking system (3-month interbank interest rates and the matching foreign exchange
forward and spot rates are used). The average portfolio-flow openness (as opposed to FDI
openness) for the period 2010-13 is shown for a wide range of developed and developing
countries in Figure 16.
VI. A panel study of investment based on the above factorsA panel regression study of the observations of company capital spending discussed in
the above analysis provides some interesting insights into the determinants of
infrastructure and other-industry investment in advanced versus emerging economies.17 A
vast number of observations are used (i.e., a total of 60,741) and the methodology and
results are set out in the Annex 2. The results discussed here may be found in Table A.2.3.
The dependent variable is company capital expenditure as a share of net sales, so that it is
imposed that capital spending of the company moves in line with its sales, as can be
observed in Figures 3 and 4 above. The model is therefore seeking to explain capital
spending deviations from company sales with a number of explanatory variables. These
include those introduced earlier in the historical discussion: the ROE, the cost of equity, the
INFRASTRUCTURE VERSUS OTHER INVESTMENTS IN THE GLOBAL ECONOMY AND STAGNATION HYPOTHESES
OECD JOURNAL: FINANCIAL MARKET TRENDS – VOLUME 2014/2 © OECD 201532
cost of debt, and the openness measure. For the emerging economies the sample of
companies is broken into those with and without a non-deliverable forward (NDF) market.
The latter NDF markets normally form when restrictions are so severe that foreign
investors cannot participate in foreign exchange derivatives markets in the domestic
economy. Instead, they are traded offshore in a dollar-based forward market that allows a
shadow hedging market to function. GDP growth of the host country and is included as
control variable for the accelerator mechanism to increase the robustness of the results.
The infrastructure sector results
The advanced economies model finds that the market-related variables in the cost of
equity and measure of openness are supported by the data at the 5% level for infrastructure
companies. The AAA bond rate in the domestic market is also significant at the 10% level.
The ROE and GDP growth are not supported by the data in advanced economy infrastructure
companies. These results are not meaningfully altered whether or not the large number of
US companies is included.
The emerging markets model (full sample and NDF sample) finds that the ROE is not
supported by the data. All of the other variables do find some support, particularly for the
NDF sample. These more closed economies appear to have a larger impact on investment
from domestic activity (as measured by GDP). The 1-year average conditional volatility of
CIP is supported at the 1% for emerging economies. This suggests that emerging markets
are not independent of the costs associated with financial repression and capital controls.
Emerging market banks frequently rely on foreign funding and liquidity issues are often
overwhelming in thin markets during crisis periods. These results are not meaningfully
altered if the large number of Chinese companies is excluded from the data.
The non-infrastructure (general industry) sector resultsThe results for the advanced economies model for general industry are intuitively
pleasing. The openness variable is not supported by the data which presumably reflects the
Figure 16. Openness measure (2010-13) based on the conditional variance of CIP
Source: Bloomberg, authors’ calculations.
2.5
2.0
1.5
1.0
0.5
0.0
Argenti
na
Indon
esia
Korea
Egyp
tInd
ia
Russia
n Fed
.
Malays
iaChin
a
Roman
ia
Colombia Chil
e
Hunga
ryBraz
ilPeru
Morocc
oTu
rkey
Sweden
New Ze
aland
Mexico
South
Africa
Israe
l
Austra
lia
Switzerl
and
Norway
Denmark
Euro
areaJa
pan
Canad
a
United
Kingdo
m
United
States
Std dev.
Openess: Larger conditional variance implies less open
INFRASTRUCTURE VERSUS OTHER INVESTMENTS IN THE GLOBAL ECONOMY AND STAGNATION HYPOTHESES
OECD JOURNAL: FINANCIAL MARKET TRENDS – VOLUME 2014/2 © OECD 2015 33
greater international orientation of non-infrastructure MNEs listed in advanced economies.
Such companies have a broader set of choices as to the location of capital spending and
intellectual property, for funding sources and for how earnings are used (for cash
accumulation in low tax zones, capital expenditure, buybacks and the matching currency
between revenues and liability flows). The openness measure will be less relevant for such
companies compared to the more domestic-oriented infrastructure firms. The ROE, the
cost of equity, and GDP growth are all strongly supported by the data at the 1% level. A
multi-national company with foreign subsidiaries and affiliates is first and foremost
subject to competition and market metrics are crucial for investment decisions compared
to the regulated infrastructure firms and relatively closed emerging markets where rent
seeking behaviour is often present.
The results for the emerging markets model are also of some interest. The ROE is not
supported by the data so market metrics are less evident in decision making. This may
reflect the greater role of the state and SOEs in the investment process. Companies in
relatively more open emerging countries are similar to the general industrial sector of
advanced countries in that the openness variable is not significant. The cost of equity, the
AAA bond rate and GDP growth are all supported by the data at the 1% level. For the
grouping of companies in countries with NDF markets the openness variable is significant
at the 1% level. The cost of debt and GDP growth are correctly signed and significant at the
1% level, while the cost of equity finds no support. Borrowing from state-owned banks may
play a bigger role in funding in these more closed economies.
VII. Drawing together some of the threads
Summary of trends
Based on an examination of trends in listed companies there appears to be no one
generalisation about “stagnation” in the global economy that one can make. Instead, a
number of interesting observations can be made based on an examination of the data from
many thousands of listed companies.
● Equity is the most prevalent form of funding investment in all industries, but infrastructure
companies use more debt financing compared to non-infrastructure companies.
Funding infrastructure with debt is most prevalent in the two bank-oriented countries:
Japan and Europe as compared to the USA.
● It does appear that infrastructure sales and investment are stagnating in most countries,
but not in the United States to 2013, where heavy investment in oil-related companies is
45% of all infrastructure investment.
● Emerging market non-infrastructure company sales and investment are booming while
(relatedly) they are stagnating in advanced countries. Advanced country companies also
invest in affiliates in emerging markets, as global value chains and the tax-related location
of intellectual property, royalties and earnings are used to create shareholder value.
● Emerging markets are seeing a marked decline of operating cash flow (net income
adjusted for distorting accruals) per unit of sales, symptomatic of margin pressure.
Company ROEs are weakening. These observations are consistent with over-investment
and the misallocation argument related to “governance” problems.
● The ROE versus the cost of equity are the lowest in emerging markets. This is an
indicator of over-investment. The heavy investment in emerging markets based on a
different model of development may be a factor here, particularly in non-infrastructure
INFRASTRUCTURE VERSUS OTHER INVESTMENTS IN THE GLOBAL ECONOMY AND STAGNATION HYPOTHESES
OECD JOURNAL: FINANCIAL MARKET TRENDS – VOLUME 2014/2 © OECD 201534
industries. Capital controls and exchange rate management may also augment the cost
of debt and equity.
● Margins and ROEs appear to be rising in the US, improving in Japan but are declining
somewhat in Europe (though not to the same extent in all countries). There is a clear
difference between European countries with their own floating exchange rates (the UK
and Switzerland) and euro-area countries. Southern European countries (which compete
more with emerging markets) appear to face more ROE pressure.
● Emerging market operating cash flow is simply not enough to fund investment in non-
infrastructure industries. Consequently, investment in infrastructure and other
industries has been associated with a very rapid rise of debt at the expense of equity. For
non-infrastructure industries debt-to-enterprise-value levels are rapidly approaching
Japanese levels of indebtedness that were associated with years of over investment.
● Operating cash flow is not a constraint on investment in the USA or in other advanced
countries (as it is in emerging markets). However, buybacks are very strong in the USA
and are also firm in parts of Europe (and particularly the UK and Switzerland). These
buybacks are at the expense of both investment and the wage gains that are needed for
more inclusive growth. Where royalties and earnings are based abroad for tax reasons,
tax deductible borrowing can be used to carry out buybacks in the home economy.
● A strong bias of infrastructure investment towards telecommunications and transport
areas does not appear to be associated with the avoidance of stagnation trends (Japan
and Europe). Lack of natural energy resources in Japan and Europe reduces the scope for
diversification of infrastructure investment and may contribute to stagnation pressure.
● Operating cash flow per unit of sales is always larger in infrastructure investment, but
this is not matched in respect to ROEs which are generally lower there than for other
industries. This could suggest a poor allocation of investment, which is more likely to
come about when investment is not based on market mechanisms, and is dominated by
subsidies, ownership restrictions, product market regulations, and an excessive role of
governments and SOE activity.
There appears then to be a twin paradox in the global economy when examining the
detailed data of companies in advanced and emerging economies. Some are investing too
much in non-infrastructure industries, which is driving down ROEs and creating margin
pressure globally, while others carry out too little long-term investment in favour of
buybacks and the accumulation of cash. Governance problems appear to be associated
with the poor performance of the infrastructure sector. A number of thoughts about policy
follow the above observations about the data.
Removing obstacles to investment returns and reducing the cost of equity
Bankable returns that companies achieve (ROEs) and the cost of capital (both debt and
equity) were found to be key factors in investment, particularly in the larger general
industrial sector, in the econometric results. General industry is much larger than
infrastructure and its growth is needed to increase demand for the latter. Easy monetary
policy that reduces interest rates and boost share prices can therefore be helpful. However, an
excessive reliance on easy monetary policy may become counterproductive. Asset prices and
borrowing can go too far, setting up potential future crisis situations. Too low interest rates in
advanced economies also lead to poor investment choices (such as excessive investments in
real estate) and may also lead to an inter-temporal misallocation of resources. Monetary
INFRASTRUCTURE VERSUS OTHER INVESTMENTS IN THE GLOBAL ECONOMY AND STAGNATION HYPOTHESES
OECD JOURNAL: FINANCIAL MARKET TRENDS – VOLUME 2014/2 © OECD 2015 35
policy needs to be balanced with policies that improve bankable returns to investment.
Greater competition, freer trade and regulatory and tax reforms come to mind.
Market metrics appear to be less powerful in infrastructure generally, and particularly
in the more closed emerging economies. There is a need to remove obstacles to
competition and market forces. Impediments to efficient profitable investment include:
restrictions on foreign ownership; lack of competition that leads to rent-seeking behaviour;
poor corporate governance;18 lack of competitive neutrality with respect to SOE involvement
in the economy; corrupt government procurement processes; lack of competitive
neutrality between public and private companies; local content requirements (OECD,
2015a); political interference in the pricing of public goods (relevant for infrastructure);
legal delays and excessive court costs; costly micro regulations that restrict access to
markets; and so on. These distorting factors are present in both advanced and emerging
markets. Such conditions complicate efforts to improve productivity and they add to costs
for other industries.
The accelerator mechanism
The results in the panel study also found that the GDP accelerator mechanism was
important, particularly for general industry. Policies that enhance stable crisis-free GDP
growth and avoid beggar-my-neighbour strategies are essential, including inter alia: open
world trade, non-distorting supportive economic policy; completing regulatory reform in
the financial sector and normalising interest rates, thereby giving companies a better
picture of what the exit from the policy responses to the crisis might actually look like.
Financial market openness and avoiding emerging market crises
While financial repression may be necessary in the early stages of economic
development (to harness savings and investment) a closed financial system appears to
impose costs that soon become a negative factor for growth. Restrictions affecting financial
market openness were found to be a significant negative factor for corporate investment in
the above econometric findings. For emerging markets the cost of funding via debt and/or
equity is directly affected by financial repression. Furthermore, capital flight is more
prevalent in such countries during crisis periods. Ultimately, reducing financial repression
and particularly capital controls will have to be an essential element of building a
framework for sustainable global growth.19
Unsustainable corporate buyback strategies in western countries
Executives of non-infrastructure companies in the USA, the UK and Switzerland are
increasingly rewarding shareholders with short-term share price gains via buybacks at the
expense of long-term investment. With very low interest rates and tax incentives to do so,
executives of firms carry out buybacks rather than investing for the long term. By doing so
they drive the share price up and reduce the cost of equity (via the reduced dividend yield)
in relation to the ROE, raising the scope to create more value in the same way, and often
with institutional investors cheering them on. But this is a self-defeating mechanism, as it
occurs at the expense of the long-term investment that is necessary to promote higher
potential growth and the asset backing needed to support ageing populations (pensions
and health care) in the future.
Buybacks benefit company executives and mutual fund managers (whose performance
is measured over short periods) both of whom are rewarded with stock options and awards.

INFRASTRUCTURE VERSUS OTHER INVESTMENTS IN THE GLOBAL ECONOMY AND STAGNATION HYPOTHESES
OECD JOURNAL: FINANCIAL MARKET TRENDS – VOLUME 2014/2 © OECD 201536
A typical executive of a large firm has something like 80% of his or her compensation
derived from equity participation (Lazonick, 2014). Buybacks enable executives more easily
to meet quarterly and or annual EPS targets on which their remuneration is based. Driving
up the share price to push stock options ’into the money’ increases the personal gain of
executives, while reducing the scope for investment. Where this is permitted to be carried
through by off-market share purchases at fixed price or via a Dutch auction tender process,
there is a strong possibility of discrimination amongst shareholders.20
Driving down the number of shares outstanding and pushing up the short-term share
price in these ways does not benefit the economy in the longer run. The policy options to
deal with this include:
● Revisiting corporate law and regulatory rules concerning buybacks, and in the limit to
restrain them directly.
● Revisiting executive option and share allocation schemes to align them with long-term
investment objectives, as opposed to EPS targets.
● Reducing the attractiveness of borrowing to carry out buybacks. Monetary policy
normalisation and the tax treatment of interest costs, capital gains and dividends are
most important in this respect.
There are many costs associated with regulations, listing requirements, risk controls
and reporting that not all smaller companies can afford – capacity building and
simplification in the SME sector can help to reduce these costs. Market rules (such as tick
sizes) and the increased use of new technology (electronic and dark exchanges, high
frequency trading and passive funds management) have far reaching implications for price
discovery and hence for the allocation of investment and the ability of firms to carry out
IPOs. These rules need further attention by policy makers.
Avoiding another emerging market crisis and rebalancing the global economy
A particular concern in the above analysis of corporate data is that investment
appears in general to be less efficient in emerging markets. ROEs are declining and have
become too low versus the cost of equity and debt. At the same time, borrowing to finance
investment appears to be very strong in the general industrial sector of emerging markets.
These were ingredients of the Asia crisis.
Addressing problems in the international financial system would aim to allow more
scope to normalise interest rates in advanced economies, where low rates have been a
response to the damage to the traded goods sector caused by under-valued emerging
market exchange rates,21 and would help to reduce the inefficiency of investment in
emerging economies. In short, there may need to be a new Bretton-Woods-style conference
to deal with the damaging incompatibility of very different economic and financial
systems and a full reform of the international monetary system.
Notes
1. Amongst many examples see Krugman (2012) and Krugman (2014).
2. See the OECD-WTO-UNCTAD reports to the G20 on new restrictive measures (2014).
3. As drawn to make these points in Krugman (2012).
4. There is no arbitrage to equalise covered returns globally. Strong capital controls that take many direct and hidden forms ensure that these conditions (e.g. covered interest parity) don’t hold.
INFRASTRUCTURE VERSUS OTHER INVESTMENTS IN THE GLOBAL ECONOMY AND STAGNATION HYPOTHESES
OECD JOURNAL: FINANCIAL MARKET TRENDS – VOLUME 2014/2 © OECD 2015 37
5. These ideas are developed in Blundell-Wignall and Roulet (2014), and some of the analysis there was used in OECD (2014b).
6. See OECD (2013a), OECD (2015b) and Della-Croce and Sharma (2014).
7. See OECD New Approaches to Economic Challenges work, OECD (2014).
8. Via Heckscher-Ohlin mechanisms.
9. Bernanke (2005) has referred to the issue of a saving glut. This is estimated to be worth some 300 basis points to the end of 2013 in Blundell-Wignall and Roulet (2014).
10. See OECD (2014b), and Weild, Kim and Newport (2013).
11. See Blundell-Wignall and Roulet (2013) where the incentive to buybacks is modelled.
12. See OECD STAN, the database for structural analysis. http://stats.oecd.org/Index.aspx?DataSetCode= STAN08BIS.
13. This leaves aside private equity companies, but since there is arbitrage between the listed and unlisted sector this should be quite representative as to what is happening.
14. This may be a north-south issue in Europe too. Southern countries compete more with emerging markets and are subject to greater margin pressure that the higher technology north. The south seems to have been less able to make structural reforms to improve governance issues and bridge competitiveness gaps.
15. The cost of equity is the cost to the investor of retaining a dollar of earnings for investment and the ROE would need to be greater in order to create shareholder value. It is measured here as the dividend and buyback yield plus the underlying trend in EPS growth for each company.
16. Blundell-Wignall and Roulet (2014) in a panel regression study of global companies show that capital control restrictions, measured by the conditional variance of deviations from covered interest parity, have a significantly negative impact on company investment.
17. Annex 1 provides further details about the sample used in the regressions. A co-integration and error correction approach is used. The error correction results imply causal relationships.
18. Where mitigating risks requires the public sector to fill gaps via public-private partnerships it is essential to have the right governance structure of boards. The way in which the board is composed, and the role of the governments as providers of capital, needs to be clearly defined. The OECD has developed a useful set of principles to help guide policymakers in these respects. See OECD (2013a), and OECD (2013b).
19. See Blundell-Wignall and Roulet (2014). Capital controls are show to have a highly significant negative effect on investment.
20. For example favouring professional versus retail holders, and amongst all shareholders, depending on capital gains and income tax rates where dividend imputation is available.
21. This key global issue is not so much about overall current account imbalances which are also affected by saving-investment imbalances in the government and household sectors as opposed to the corporate sector. It is about where investment and jobs are located in the private sector. There is a need for less financial repression and more consumption and open trade in emerging economies so that the gain from trade can be achieved more fruitfully for all players.
References
Bernanke, B. (2005), “The Global Saving Glut and the U.S. Current Account Deficit”, Remarks at the Sandridge Lecture, Virginia Association of Economists, Richmond, available at www.federalreserve. gov/boarddocs/speeches/2005/200503102/.
Blundell-Wignall, A. and C. Roulet, (2013), “Long-term Investment and the Buyback Puzzle”, OECD Journal, Financial Trends, Vol. 2013/1.
Blundell-Wignall, A. and C. Roulet, (2014), “Problems in the International Financial System”, OECD Journal, Financial Trends, Vol. 2014/1.
Della Croce, R. and R. Sharma (2014), “Insurers and Pension Funds as Long-Term Investors: An Approach to Infrastructure Investment”, OECD Working Papers on Finance, Insurance and Private Pensions, No.38, OECD.

INFRASTRUCTURE VERSUS OTHER INVESTMENTS IN THE GLOBAL ECONOMY AND STAGNATION HYPOTHESES
OECD JOURNAL: FINANCIAL MARKET TRENDS – VOLUME 2014/2 © OECD 201538
De Mooij, R. and I. Saito (2014), “Japan’s Corporate Income Tax: Facts, Issues and Reform Options”, IMF Working Paper WP/14/138.
Gordon, R.J. (2014), “The Demise of U.S. Economic Growth: Restatement, Rebuttal, and Reflections”, NBER Working Paper No. 19895, February.
Krugman, P. (2012), “Natural Born Recovery Killers”, The New York Times, 4 September.
Krugman, P. (2014), “Secular Stagnation, Coalmines, Bubbles, and Larry Summers”, The New York Times, 16 November.
Lazonick, W. (2014), “Profits Without Prosperity”, Harvard Business Review, September.
OECD (2013a), G20/OECD High-Level Principles of Long-term Investment Financing by Institutional Investors, September.
OECD (2013b), Economic Policy Reforms: Going for Growth. Paris.
OECD-WTO-UNCTAD (2014), Reports on G20 Trade and Investment Measures, available at www.oecd. org/daf/inv/investment-policy/g20.htm.
OECD (2014), New Approaches to Economic Challenges (NAEC): The Financial Stream, OECD, Paris; available at www.oecd.org/naec/NAEC-Finance-Stream-2014.pdf.
OECD (2015a), Overcoming Barriers to International Investment in Clean Energy, OECD Publishing, Paris (forthcoming).
OECD (2015b). Fostering infrastructure investment: Lessons learned from OECD Investment Policy Reviews, OECD Publishing, Paris (forthcoming).
Stevens, G.R. (2014), “Challenges to Economic Policy”, address to the Anika Foundation Luncheon, 22 July, www.rba.gov.au/speeches/2014/sp-gov-220714.html.
Summers, L.H. (2014), “U.S. Economic Prospects: Secular Stagnation, Hysteresis, and the Zero Lower Bound”, Business Economics Vol. 49, No. 2.
Weild, D., E. Kim and L. Newport (2013), “Making Stock Markets Work to Support Economic Growth (implications for governments, regulators, stock exchanges, corporate issuers and their investors)”, OECD Corporate Governance Working Papers No. 10, http://dx.doi.org/10.1787/5k43m4p6ccs3-en.
White, W. (2012), “Ultra Easy Monetary Policy and the Law of Unintended Consequences”, Working Paper No. 126, Federal Reserve Bank of Dallas, Globalization and Monetary Policy Institute; available at www.dallasfed.org/assets/documents/institute/wpapers/2012/0126.pdf.

INFRASTRUCTURE VERSUS OTHER INVESTMENTS IN THE GLOBAL ECONOMY AND STAGNATION HYPOTHESES
OECD JOURNAL: FINANCIAL MARKET TRENDS – VOLUME 2014/2 © OECD 2015 39
ANNEX 1
Data and sample description
Two different sets of data are used in this paper to establish the stylised facts: national
accounts data for annual real gross fixed capital formation are extracted from the OECD
STAN Database for structural analysis over the period 1980-2010; and private company data
based on the Bloomberg World Equity Index including 9 403 listed companies in 75 countries
and 104 sectors over the period 2002-13. The 44 infrastructure sectors include 1 328 companies
(i.e., 848 in advanced economies and 480 in emerging economies) and the 60 other sectors
excluding financial companies include 8 075 companies (i.e., 5 104 in advanced economies
and 2 971 in emerging economies). Table A.1.1 and Table A.1.2 below present the number of
companies by sector and country.

INFRASTRUCTURE VERSUS OTHER INVESTMENTS IN THE GLOBAL ECONOMY AND STAGNATION HYPOTHESES
OECD JOURNAL: FINANCIAL MARKET TRENDS – VOLUME 2014/2 © OECD 201540
Table A.1.1. Distribution of companies by sector and country
Advanced economies
Infrastructure sector
Other sectors (excl. financials)
Emerging economies
Infrastructure sector
Other sectors (excl. financials)
Australia 33 159 Argentina 2 13
Austria 4 32 Bahrain 1 1
Belgium 8 35 Bosnia and Herzegovina 2 35
Canada 60 225 Brazil 32 129
Chinese Taipei 15 211 Bulgaria 1 5
Cyprus2 3 7 Chile 14 38
Czech Republic 3 5 China (People’s Republic of) 142 1 222
Denmark 10 38 Colombia 7 11
Estonia 1 1 Croatia 2 19
Finland 4 54 Egypt 5 48
France 35 173 FYR of Macedonia 2 6
Germany 25 176 Gabon 1 0
Greece 13 41 Hungary 1 3
Hong Kong, China 37 210 India 47 209
Ireland 2 30 Indonesia 7 59
Italy 22 82 Israel 7 71
Japan 59 890 Jordan 5 8
Jersey 2 5 Kenya 1 2
Lithuania 1 0 Korea 19 162
Luxembourg 2 13 Kuwait 3 30
Monaco 1 1 Malaysia 22 59
Netherlands 13 71 Mexico 12 59
New Zealand 12 13 Montenegro 1 1
Norway 23 31 Morocco 2 10
Portugal 6 14 Oman 1 4
Singapore 19 83 Pakistan 3 19
Slovenia 2 14 Peru 3 24
Spain 18 83 Philippines 12 31
Sweden 8 99 Poland 9 34
Switzerland 9 111 Qatar 6 10
United Kingdom 65 355 Romania 4 64
United States 333 1 842 Russia 51 192
Saudi Arabia 3 55
Senegal 1 0
Serbia 3 67
South Africa 5 76
Sudan 1 0
Thailand 18 71
Turkey1 5 53
Ukraine 8 38
United Arab Emirates 5 18
Venezuela 1 1
Viet Nam 3 14
TOTAL 848 5 104 TOTAL 480 2 971
1. Footnote by Turkey.The information in this document with reference to “Cyprus” relates to the southern part of the Island. There is no single authority representing both Turkish and Greek Cypriot people on the Island.Turkey recognises the Turkish Republic of Northern Cyprus (TRNC). Until a lasting and equitable solution is found within the context of the United Nations, Turkey shall preserve its position concerning the “Cyprus issue”.2. Footnote by all the European Union Member States of the OECD and the European Union.The Republic of Cyprus is recognised by all members of the United Nations with the exception of Turkey. The information in this document relates to the area under the effective control of the Government of the Republic of Cyprus.Source: Bloomberg, authors’ calculations.
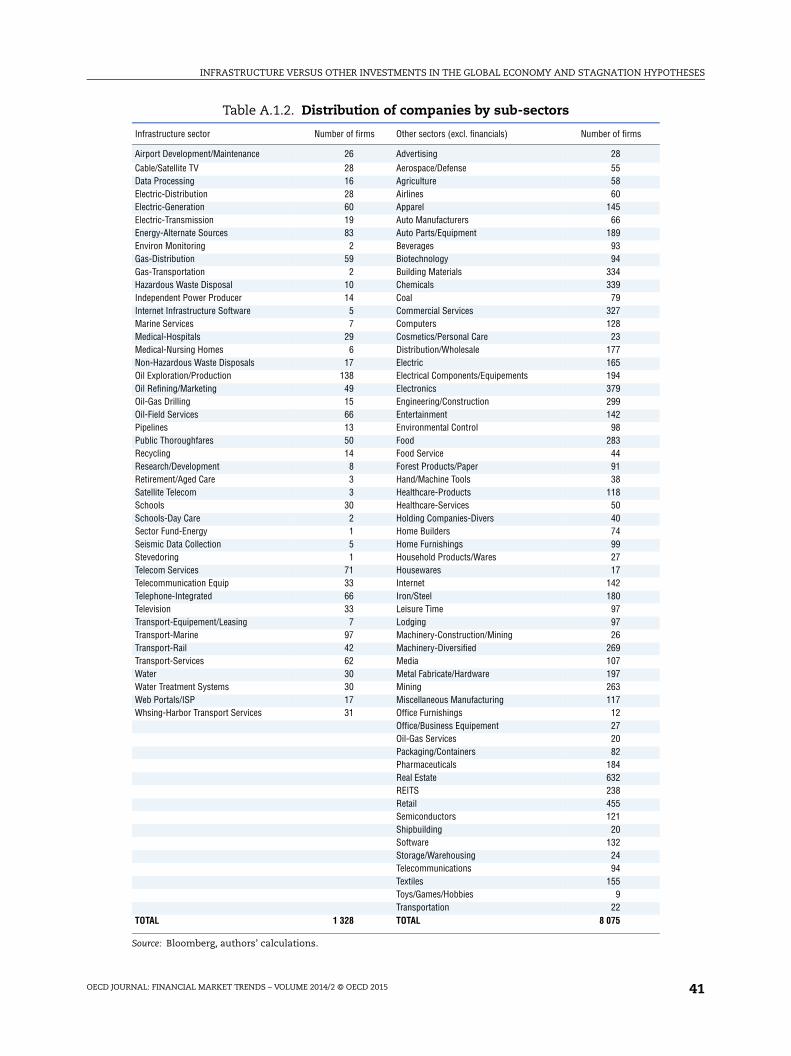
INFRASTRUCTURE VERSUS OTHER INVESTMENTS IN THE GLOBAL ECONOMY AND STAGNATION HYPOTHESES
OECD JOURNAL: FINANCIAL MARKET TRENDS – VOLUME 2014/2 © OECD 2015 41
Table A.1.2. Distribution of companies by sub-sectors
Infrastructure sector Number of firms Other sectors (excl. financials) Number of firms
Airport Development/Maintenance 26 Advertising 28Cable/Satellite TV 28 Aerospace/Defense 55Data Processing 16 Agriculture 58Electric-Distribution 28 Airlines 60Electric-Generation 60 Apparel 145Electric-Transmission 19 Auto Manufacturers 66Energy-Alternate Sources 83 Auto Parts/Equipment 189Environ Monitoring 2 Beverages 93Gas-Distribution 59 Biotechnology 94Gas-Transportation 2 Building Materials 334Hazardous Waste Disposal 10 Chemicals 339Independent Power Producer 14 Coal 79Internet Infrastructure Software 5 Commercial Services 327Marine Services 7 Computers 128Medical-Hospitals 29 Cosmetics/Personal Care 23Medical-Nursing Homes 6 Distribution/Wholesale 177Non-Hazardous Waste Disposals 17 Electric 165Oil Exploration/Production 138 Electrical Components/Equipements 194Oil Refining/Marketing 49 Electronics 379Oil-Gas Drilling 15 Engineering/Construction 299Oil-Field Services 66 Entertainment 142Pipelines 13 Environmental Control 98Public Thoroughfares 50 Food 283Recycling 14 Food Service 44Research/Development 8 Forest Products/Paper 91Retirement/Aged Care 3 Hand/Machine Tools 38Satellite Telecom 3 Healthcare-Products 118Schools 30 Healthcare-Services 50Schools-Day Care 2 Holding Companies-Divers 40Sector Fund-Energy 1 Home Builders 74Seismic Data Collection 5 Home Furnishings 99Stevedoring 1 Household Products/Wares 27Telecom Services 71 Housewares 17Telecommunication Equip 33 Internet 142Telephone-Integrated 66 Iron/Steel 180Television 33 Leisure Time 97Transport-Equipement/Leasing 7 Lodging 97Transport-Marine 97 Machinery-Construction/Mining 26Transport-Rail 42 Machinery-Diversified 269Transport-Services 62 Media 107Water 30 Metal Fabricate/Hardware 197Water Treatment Systems 30 Mining 263Web Portals/ISP 17 Miscellaneous Manufacturing 117Whsing-Harbor Transport Services 31 Office Furnishings 12
Office/Business Equipement 27Oil-Gas Services 20Packaging/Containers 82Pharmaceuticals 184Real Estate 632REITS 238Retail 455Semiconductors 121Shipbuilding 20Software 132Storage/Warehousing 24Telecommunications 94Textiles 155Toys/Games/Hobbies 9Transportation 22
TOTAL 1 328 TOTAL 8 075
Source: Bloomberg, authors’ calculations.

INFRASTRUCTURE VERSUS OTHER INVESTMENTS IN THE GLOBAL ECONOMY AND STAGNATION HYPOTHESES
OECD JOURNAL: FINANCIAL MARKET TRENDS – VOLUME 2014/2 © OECD 201542
ANNEX 2
The determinants of capital expenditures: Empirical evidence for a global sample
of non-financial companies
To investigate the determinants of firms’ (excluding financial firms’) capital
expenditures, a fairly standard model is postulated, incorporating microeconomic and
macroeconomic variables. The dependent variable is company’s capital expenditure which
is measured as a share of the firm’s net sales.
The explanatory variables are:
● The return on equity (ROE) is the ratio of net income to total common equity of the
company. It is a measure of a firm’s ability to retain earnings for the purpose of capital
expenditures. The capital expenditure variable is expected to have a positive relationship
with this variable.
● The cost of equity is measured as the dividend yield of the company plus the trend rate
of growth of earnings. A higher cost of equity discourages firms to retain earnings for the
purpose of capital expenditures. The capital expenditure variable is expected to have a
negative relationship with this variable.
● The cost of debt is measured as the AAA-rating corporate bond index of the country
location of the company minus the one year government bond yield. A higher AAA bond
yield compared to the risk free rate discourages firms from borrowing to increase their
capital expenditures. The capital expenditure variable is expected to have a negative
relationship with this variable.
● Economic growth is measured by real GDP growth in the home country (GDP). It is the annual
per cent change in real gross domestic product of the country location of the firms. The
capital expenditures variable is expected to have a positive relationship with this variable.
● The 1-year average conditional volatility of Covered Interest Parity (CIP) is the conditional
standard deviation calculated using a GARCH (1,1) model.1 Along with interest parities, the
conditional variance of CIPs might be a measure of dynamic capital mobility. Indeed, with
greater capital mobility, not only covered differential rates but also the variance would
decline over time. CIP is calculated using deliverable and non-deliverable forward rates.2 The
greater the volatility, the more CIP is deviating from the zero equilibrium. This phenomenon
is observed in countries with strong capital control measures. Stronger controls on capital
flows discourage firms to retain earnings for the purpose of capital expenditures. The capital
expenditures variable is expected to have a negative relationship with this variable.

INFRASTRUCTURE VERSUS OTHER INVESTMENTS IN THE GLOBAL ECONOMY AND STAGNATION HYPOTHESES
OECD JOURNAL: FINANCIAL MARKET TRENDS – VOLUME 2014/2 © OECD 2015 43
Estimation method and dataWhen economic theory suggests – as in the case of investment models – that there
exists an equilibrium relationship between integrated variables, co-integration and vector-
error-correction models (VECM) provide an efficient estimator to describe short- run
dynamics. Beyond these pure econometric reasons, co-integration techniques and VECM
are especially useful in modelling investment. As Hubbard and Hassett (2002) argue, a
number of fundamental variables affecting investment move together over the business
cycle. This causes simultaneity problems. Shifts in the investment function (often
associated with the business cycle) imply a positive relationship between the user cost of
capital and investment, while interest rate shocks cause negative correlation between the
two. If the first dominates, the user cost elasticity will be small, and accelerator effects (the
impact of output on investment) large. This problem could be circumvented by focusing on
the long-run relationship instead. In addition, VECM allows a rich dynamic representation
of the data, which often turns out to be very useful given the sluggish nature of capital
stock adjustment and investment. In this paper Engel and Granger methodology is used.
All annual companies and market data are extracted from Bloomberg and Datastream.
Macroeconomic data were also extracted from OECD and IMF Databases. The econometric
analysis is run on a global sample of 8 774 listed companies from 56 countries and
104 sectors over the period 2002-13.3 Table A.2.1 presents some general descriptive
statistics of the variables included in the model. Table A.2.2 contains correlation
coefficients among all explanatory variables.
Table A.2.1. Summary descriptive statistics of the sample
Mean Median Maximum Minimum Std. dev.
Capital expenditures (% net sales) 11.52 4.87 199.88 -40.77 19.84
ROE 10.54 10.25 100.00 -99.94 18.65
Cost of equity 10.12 8.63 30.00 0.50 7.32
Cost of debt 1.42 1.17 10.85 -1.61 1.73
Real GDP growth rate 3.66 2.80 28.50 -14.80 3.96
1Y average conditional vol. of CIP 0.27 0.03 2.92 0.00 0.44
Source: Bloomberg, Datastream, authors’ calculations, IMF (2002-2013). All variables are expressed in percentage.
Table A.2.2. Correlations among the main explanatory variables
ROE Cost of equity Cost of debt Real GDP growth rate 1Y average conditional vol. of CIP
ROE 1.00
Cost of equity 0.10 1.00
0.00
Cost of debt 0.02 0.03 1.00
0.00 0.00
Real GDP growth rate 0.08 0.17 -0.12 1.00
0.00 0.00 0.00
1Y average conditional 0.03 0.19 -0.03 0.45 1.00
volatility of CIP 0.00 0.00 0.00 0.00
Note: Correlation coefficients are calculated using a balanced sample. Figures in italics indicate-values of the T-statistics that test for null hypothesis of Pearson’s coefficients of correlation equal to 0.

INFRASTRUCTURE VERSUS OTHER INVESTMENTS IN THE GLOBAL ECONOMY AND STAGNATION HYPOTHESES
OECD JOURNAL: FINANCIAL MARKET TRENDS – VOLUME 2014/2 © OECD 201544
ResultsRegressions are run on the global panel of non-financial companies for the years 2002 to
2013, involving some 63 482 observations. This study focuses on the differences which may
exist between firms operating in the infrastructure sector and firms operating in other
economic sectors in alternately advanced and emerging economies. In addition, regressions
are run including countries with only a deliverable forward (DF) market or countries with
only a non-deliverable forward (NDF) market.4 The results are shown in Table A.2.3.
Table A.2.3. The determinants of investment of non-financial companies focusing on the impact of the cost of equity
Co-integration equation (dependent variable: capital expenditure, % net sales)
Variables
Infrastructure Non-infrastructure
Advanced economies –
DF
Emerging economies – DF and NDF
Emerging economies –
NDF
Advanced economies –
DF
Emerging economies – DF and NDF
Emerging economies –
DF
Emerging economies –
NDF
ROE: Ratio of net income to total common equity of the company
0.004 (0.33)
-0.02 (-0.71)
-0.01 (-0.34)
0.02*** (3.49)
-0.01 (-1.12)
0.01 (0.63)
-0.02 (-1.51)
Cost of equity: Dividend yield of the company plus the trend rate of growth of earnings
-0.14** (-2.13)
-0.12 (-1.24)
-0.28** (-2.29)
-0.13*** (-3.19)
-0.15*** (-3.26)
-0.42*** (-4.60)
-0.04 (-0.68)
Cost of debt: Yield of AAA-rating corporate bond index of the country location of the company minus 1-year government bond yield
-0.23* (-1.80)
-0.28*** (-2.66)
-0.34*** (-2.65)
-0.62*** (-8.81)
-0.22*** (-5.58)
-0.30*** (-4.62)
-0.18*** (-3.58)
Real GDP growth rate 0.02 (0.31)
0.44*** (3.16)
0.82*** (4.98)
0.09*** (2.71)
0.17*** (3.77)
0.10*** (2.40)
0.20*** (3.49)
1-year average conditional volatility of Covered Interest Parity: Conditional standard deviation calculated using a GARCH (1,1) model
-0.06** (-2.31)
-0.04*** (-4.27)
-0.03*** (-3.17)
-0.01 (-0.85)
-0.01*** (-4.02)
-0.01 (-0.70)
-0.01*** (-3.75)
C0.19*** (20.82)
0.22*** (11.45)
0.22*** (8.93)
0.11*** (22.46)
0.14*** (17.14)
0.17*** (9.84)
0.12*** (11.86)
R2 0.73 0.54 0.53 0.64 0.54 0.63 0.52
F-Stat 19.49 7.04 6.94 14.45 7.95 10.57 7.56
Prob(F) 0.00 0.00 0.00 0.00 0.00 0.00 0.00
Durbin-Watson Stat. 1.26 1.27 1.27 1.44 1.44 1.24 1.46
Total obs. 5 416 2 726 2 319 36 533 18 721 2 672 16 049
Error correction equation (dependent variable: change in capital expenditure, % net sales)
Variables
Infrastructure Non-infrastructure
Advanced economies –
DF
Emerging economies – DF and NDF
Emerging economies –
NDF
Advanced economies –
DF
Emerging economies – DF and NDF
Emerging economies –
DF
Emerging economies –
NDF
1 Year lagged value of VECM residuals -0.67*** (-23.32)
-0.66*** (-21.29)
-0.66*** (-20.61)
-0.80*** (-38.49)
-0.73*** (-30.23)
-0.66*** (-7.53)
-0.74*** (-27.34)
Δ ROE: Ratio of net income to total common equity of the company
0.05*** (4.33)
0.09*** (3.73)
0.09*** (3.21)
0.03*** (4.56)
0.07*** (8.96)
0.04* (1.69)
0.07*** (8.09)
Δ Cost of equity: Dividend yield of the company plus the trend rate of growth of earnings
0.002 (0.02)
-0.01 (-0.10)
0.09 (0.57)
-0.20*** (-4.76)
-0.01 (-0.11)
0.03 (0.32)
-0.03 (-0.47)
Δ Cost of debt: Yield of AAA-rating corporate bond index of the country location of the company minus 1-year government bond yield
0.04 (0.36)
-0.22*** (-2.38)
-0.20* (-1.69)
0.24*** (3.70)
0.10*** (2.41)
0.13* (1.62)
0.10* (1.78)
Δ Real GDP growth rate -0.03 (-0.63)
-0.08 (-0.87)
0.02 (0.21)
0.04* (1.82)
0.01 (0.40)
-0.03 (-0.56)
0.05 (1.14)
Δ 1-year average conditional volatility of Covered Interest Parity: Conditional standard deviation calculated using a GARCH (1,1) model
0.02 (1.42)
-0.01 (-1.03)
-0.01 (-1.23)
-0.01 (-0.94)
0.003 (1.52)
0.003 (0.70)
0.004 (1.58)

INFRASTRUCTURE VERSUS OTHER INVESTMENTS IN THE GLOBAL ECONOMY AND STAGNATION HYPOTHESES
OECD JOURNAL: FINANCIAL MARKET TRENDS – VOLUME 2014/2 © OECD 2015 45
Notes
1. If we denote y generically as the CIP, a time-series model that captures the autoregressive (AR) structure in both the mean and the variance can be written as:
where is the ARCH term (the squared error term in the previous time period) of q order,
generally being news about volatility from the previous period; is the GARCH term (the
conditional variance in the previous time period) of p order. Thus, yt follows an AR(h) process with
a conditional variance equation described by a GARCH (p,q) process. The GARCH model is
implemented via maximum likelihood estimation of the log-likelihood function. The estimated
conditional variance will give us an indication of the evolution of capital mobility. In this paper,
GARCH(1,1) model is adopted, which is sufficient to capture the dynamics of the conditional
variance of y. The properties of the dataset are examined before the analysis of the empirical
results. The Phillips-Perron (PP) test is employed. It is found that the null hypothesis of one unit
root can be rejected in all of the time series. CIP time series are driven by AR(1) processes. It is also
identified that the estimated coefficients are significant and all the diagnostic statistics are
reasonable.
2. CIP is calculated using deliverable forward (DF) rates for countries with only a DF market. For countries with only an NDF market and for countries with both DF and NDF markets, CIP is calculated using the NDF rate.
3. The sample presented in Annex 1 is restricted because of data availability to calculate the conditional volatility of conditional volatility of Covered Interest Parity (CIP). The following list details the 56 countries considered for this econometric analysis: Argentina; Australia; Austria; Belgium; Brazil; Bulgaria; Canada; Chile; China (People’s Republic of); Chinese Taipei; Colombia; Cyprus; Czech Republic; Denmark; Egypt; Estonia; Finland; France; Germany; Greece; Hong Kong, China; Hungary; India; Indonesia; Ireland; Israel; Italy; Japan; Korea; Lithuania; Luxembourg; Malaysia; Mexico; Monaco; Morocco; Netherlands; New Zealand; Norway; Pakistan; Peru; Philippines; Poland; Portugal; Romania; Russia; Singapore; Slovenia; South Africa; Spain; Sweden; Switzerland; Thailand; Turkey; United Kingdom; United States; Venezuela.
4. All advanced economies in the sample have only a deliverable forward market. In addition, because the sample of companies operating in infrastructure sectors located in emerging economies includes a relatively low number of observations, the regression results are not presented in the paper as they might not be reliable enough.
Table A.2.3. The determinants of investment of non-financial companies focusing on the impact of the cost of equity (cont.)
Error correction equation (dependent variable: change in capital expenditure, % net sales)
Variables
Infrastructure Non-Infrastructure
Advanced economies –
DF
Emerging economies – DF and NDF
Emerging economies –
NDF
Advanced economies –
DF
Emerging economies – DF and NDF
Emerging economies –
DF
Emerging economies –
NDF
C-0.01
(-0.67)-0.01
(-0.77)-0.03
(-1.30)0.02***
(3.17)-0.01
(-1.53)-0.02
(-0.97)-0.01
(-0.90)
R2 0.41 0.41 0.41 0.46 0.43 0.42 0.43
F-Stat 4.60 3.70 3.75 5.95 4.33 3.69 4.43
Prob(F) 0.00 0.00 0.00 0.00 0.00 0.00 0.00
Durbin-Watson Stat. 1.74 2.05 2.07 1.94 2.04 2.22 2.02
Total obs. 4 642 2 235 1 909 31 832 15 773 2 181 13 592
Note: This table shows the results of estimating a VECM model for an unbalanced panel of 8 774 listed companies from 56 countries and 104 sectors over the period 2002-2013. Cross-section and time fixed effects are used in the regressions as is the White diagonal covariance method. *, ** and *** indicate statistical significance at the 10%, 5% and 1% levels, respectively.
y y y with Nt t h t h t t t 0 1 120 ( , )
tt
q
tt
p
t j2
01
1 12
12
2
1 12t
22t j
t2

From:OECD Journal: Financial Market Trends
Access the journal at:http://dx.doi.org/10.1787/19952872
Please cite this article as:
Blundell-Wignall, Adrian and Caroline Roulet (2015), “Infrastructure versus other investments in the globaleconomy and stagnation hypotheses: What do company data tell us?”, OECD Journal: Financial MarketTrends, published online first.
DOI: http://dx.doi.org/10.1787/fmt-2014-5js4sbd025d6
This work is published on the responsibility of the Secretary-General of the OECD. The opinions expressed and argumentsemployed herein do not necessarily reflect the official views of the Organisation or of the governments of its member countries.
This document and any map included herein are without prejudice to the status of or sovereignty over any territory, to thedelimitation of international frontiers and boundaries and to the name of any territory, city or area.
You can copy, download or print OECD content for your own use, and you can include excerpts from OECD publications,databases and multimedia products in your own documents, presentations, blogs, websites and teaching materials, providedthat suitable acknowledgment of OECD as source and copyright owner is given. All requests for public or commercial use andtranslation rights should be submitted to [email protected]. Requests for permission to photocopy portions of this material forpublic or commercial use shall be addressed directly to the Copyright Clearance Center (CCC) at [email protected] or theCentre français d’exploitation du droit de copie (CFC) at [email protected].