infrastructure & poverty linkages · 2014-06-09 · infrastructure & poverty linkages a...
TRANSCRIPT

Infrastructure & Poverty Linkages
A Literature Review
Adam Brenneman ([email protected]) & Michel Kerf ([email protected])
December 18, 2002
Thanks to Ian Alexander, Harold Alderman, Penelope Brook, Donald Bundy, Lizette Burgers, Antonio Estache, Vivien Foster, Joshua Gallo, Jonathan Halperin, Ellen Hamilton, Charles Kenny, Michael Klein, Barbara Lee, Christina Malmberg-Calvo, Andrew Mason, Lucio Monari, Slobodan Mitric, Anne Quisumbing, Peter Roberts, Jennifer Sara, Richard Scurfield, Nemat Shafik, Suzanne Smith, Sumter Lee Travers, and Wendy Wakeman for their review and contributions

Table of Contents
Page Intro/Cover Note 1 Infrastructure & Poverty Linkages Table 3 Energy
Underpinning Growth 7 Increasing Economic Opportunities 12 Direct Savings 16 Improving Education 18 Supporting Effective Governance 22 Improving Health 24 Direct Impact on Well-Being 31 Bibliography 34
Information & Communications Technologies Underpinning Growth 40 Increasing Economic Opportunities 45 Direct Savings 48 Improving Education 50 Supporting Effective Governance 53 Improving Health 57 Direct Impact on Well-Being 58 Fiscal Impact 59 Bibliography 61
Transport Underpinning Growth 66 Increasing Economic Opportunities 70 Direct Savings 74 Improving Education 78 Supporting Effective Governance 82 Improving Health 84 Direct Impact on Well-Being 89 Fiscal Impact 92 Bibliography 93
Water & Sanitation Underpinning Growth 99 Increasing Economic Opportunities 100 Direct Savings 102 Improving Education 105 Supporting Effective Governance 107 Improving Health 108 Direct Impact on Well-Being 113 Bibliography 115
i
Infrastructure and Poverty Alleviation
Cover Note
This document presents the results of a review of the literature on the poverty alleviation impact of increased access to infrastructure services in four sectors (energy, water and sanitation, information and communication technologies, and transportation). In the present document, the concept of “increased access to infrastructure services” may encompass increased quantity of infrastructure services, increased affordability of infrastructure services, or, in certain cases, increased quality of infrastructure services. The objective of the document is twofold. First, it constitutes an attempt at classifying the different types of poverty alleviation impacts into eight categories which would be relevant for all four infrastructure sectors. These eight categories are: (i) growth-enhancing impacts; (ii) increase of economic opportunities specifically targeted to the poor; (iii) direct savings; (iv) improved education; (v) improved governance framework; (vi) improved health; (vii) direct impact on well-being; (viii) fiscal impact (coupled with pro-poor policies). These eight categories were originally identified by a cross-sector working group on Infrastructure and Poverty set up in FY00 by Nemat Shafik, VP for Private Sector Development and Infrastructure, and chaired by Penelope Brook and Michel Kerf. These eight categories are ordered, in the present document, in a way which reflects, as closely as possible, the order in which the MDGs are listed. Second, the present document attempts to shed light on what is known, and not known, about the nature and strength of the linkages which exist between increased access to infrastructure services and poverty alleviation.
The present exercise is limited by a number of factors which should be kept in mind by the reader: - The document focuses only on the poverty alleviation impact of increased
infrastructure access. It does not discuss the policy issues associated with the question of how to increase access (such as how to prioritize, or address the trade off which might exist, between increasing the physical stock of infrastructure and increasing the affordability of infrastructure services etc…).
- Much of the literature on the benefits of increased access to infrastructure services does not distinguish between the benefits derived by the poorest and those derived by other classes of the population. Therefore, unless a specific mention is made to the contrary, one should not assume that the impacts described in the present document predominantly affect the poorest. Nonetheless, the document reflects the evidence which exists about impacts specifically on the poorest, and when such evidence is unavailable, the focus is on impacts on people in the poorest countries.
- Because the paper only presents evidence available in the existing literature, the fact that some specific linkages between increased infrastructure access and poverty alleviation may not appear in the paper, or the fact that the existing evidence on a particular link is scant, does not necessarily mean that this link does
1
not exist or is weak in reality. It may be that some linkages which do exist are simply not (much) discussed in the literature.
- No attempt was made to present an exhaustive list of all published material on the relevant topics. Rather, the goal was to try to identify and illustrate the types of impact for which there seems to be good empirical evidence available.
- The document relies on a review of sources available on the internet and in the Joint World Bank – IMF Library. It is still a work in progress, however, and it is unlikely that all these sources have been exhausted. In addition, other important material might be available elsewhere. Comments and suggestions for further work would be appreciated and may be directed to Adam Brenneman ([email protected]) and Michel Kerf ([email protected]).
Some of the points which appear to emerge from the evidence which has been collected are the following: - There is very strong evidence of growth-enhancing impacts in all infrastructure
sectors except water/sanitation. - The impacts of increased access to infrastructure services on education appear to
be strong. This is particularly true for transport and energy services which impact education in many different ways. Transport-related impacts, for example, occur mainly through reduced travel time to schools, easier establishment of schools, and reduced environmental hazards that affect educational performance. Energy-related impacts, for their part, occur through the possibility to study at night, the use of more sophisticated equipment in schools, and increased family incomes as well as reduced time to collect traditional fuels which reduce families’ needs to rely on the labor of the children.
- There appears to be scant evidence of impacts of increased access to infrastructure services on governance framework, except in the field of telecommunications. It may be a case where some existing links have not been much explored in the literature, as mentioned above. Transportation for example, because it facilities communications, could be expected to have an impact on governance.
- There is strong evidence of positive health impacts of increased access to infrastructure services, particularly for water/sanitation, energy, and transportation although less so for telecommunications.
- Evidence focused specifically on the fiscal impacts of increased access to infrastructure services is generally weak, except in the telecommunications sector, where it has been shown that enhanced communications and information processing can help manage budgets more efficiently. Once again, it is likely to be a case where strong linkages might exist, without having been studied in the literature (after all, if growth impacts are strong as pointed out above, fiscal impacts could be expected to be noticeable also).
- The types of linkages which exist between increased access to infrastructure services and poverty alleviation appear to be broadly the same in all regions. The amount of research which has been conducted appears however to vary between regions, with more evidence available to demonstrate those links in regions where the physical stock of infrastructure is greatly insufficient than in regions where access problems tend to stem from affordability and reliability issues.
2
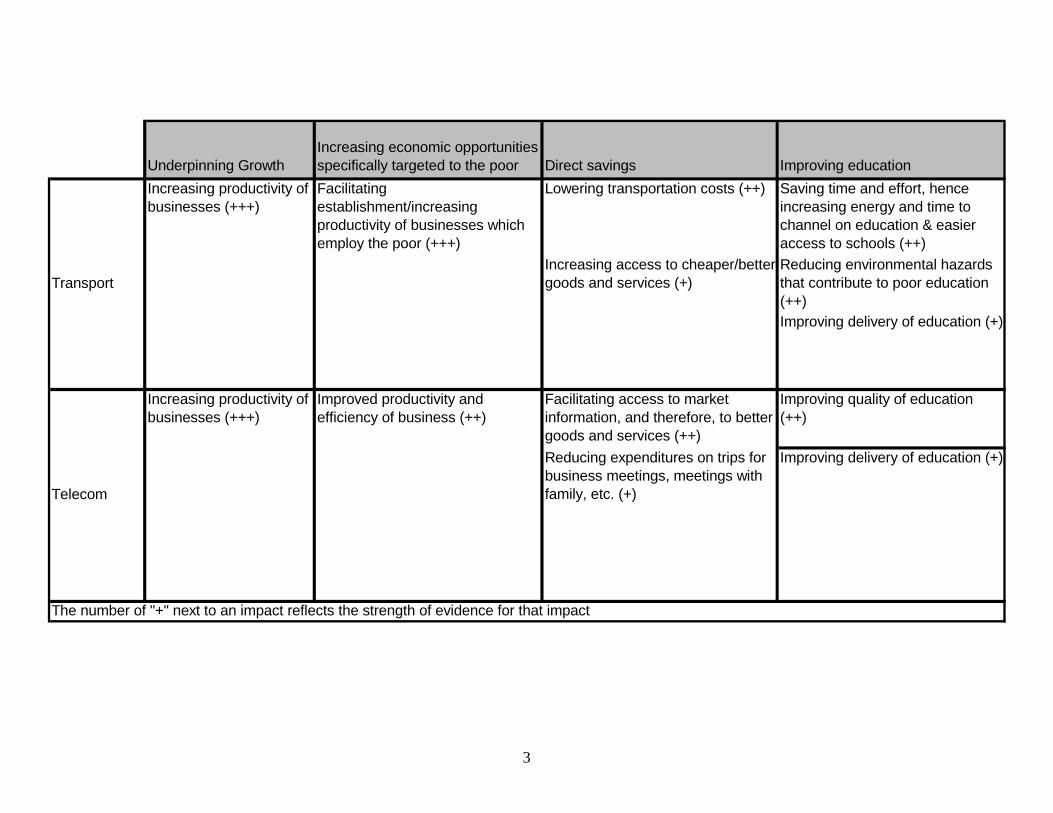
Underpinning GrowthIncreasing economic opportunities specifically targeted to the poor Direct savings Improving education
Increasing productivity of businesses (+++)
Facilitating establishment/increasing productivity of businesses which employ the poor (+++)
Lowering transportation costs (++) Saving time and effort, hence increasing energy and time to channel on education & easier access to schools (++)
Increasing access to cheaper/better goods and services (+)
Reducing environmental hazards that contribute to poor education (++)Improving delivery of education (+)
Increasing productivity of businesses (+++)
Improved productivity and efficiency of business (++)
Facilitating access to market information, and therefore, to better goods and services (++)
Improving quality of education (++)
Reducing expenditures on trips for business meetings, meetings with family, etc. (+)
Improving delivery of education (+)
Transport
Telecom
The number of "+" next to an impact reflects the strength of evidence for that impact
3
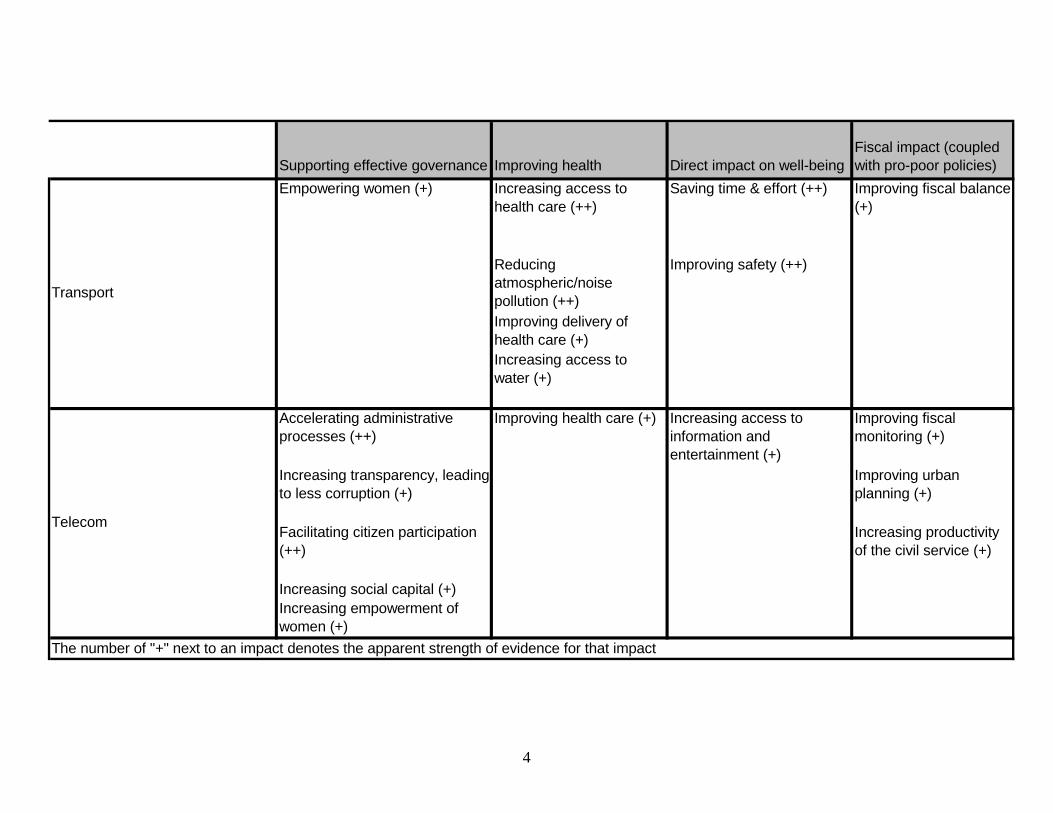
Supporting effective governance Improving health Direct impact on well-beingFiscal impact (coupled with pro-poor policies)
Empowering women (+) Increasing access to health care (++)
Saving time & effort (++) Improving fiscal balance (+)
Reducing atmospheric/noise pollution (++)
Improving safety (++)
Improving delivery of health care (+)Increasing access to water (+)
Accelerating administrative processes (++)
Improving health care (+) Increasing access to information and entertainment (+)
Improving fiscal monitoring (+)
Increasing transparency, leading to less corruption (+)
Improving urban planning (+)
Facilitating citizen participation (++)
Increasing productivity of the civil service (+)
Increasing social capital (+)Increasing empowerment of women (+)
Telecom
The number of "+" next to an impact denotes the apparent strength of evidence for that impact
Transport
4

Underpinning GrowthIncreasing economic opportunities specifically targeted to the poor Direct savings Improving education
Increasing productivity of businesses (+)
Saving time and efforts, hence, increasing productivity (+)
Lowering costs of water (+++) Improving access to education because of reduction of time spent fetching water (++)
Improving health, hence, increasing productivity (+)
Reducing medical expenditures (+) Improving educational performance due to reduction of water-related diseases (+)
Increasing productivity of businesses that employ the poor (+)
Increasing productivity of businesses (+++)
Increasing productivity of businesses owned by or that employ the poor, hence, increasing incomes (+++)
Lowering costs of energy (++) Increasing literacy and time for reading because of improved lighting (++)
Reducing damage to manufacturing from power outages and surges (++)
Facilitating establishment of businesses that employ the poor (+)
Increasing educational performance due to improved school quality because of electrification (+)
The number of "+" next to an impact reflects the strength of evidence for that impact
Increasing household income and decreasing time spent collecting traditional fuels, thus increasing time for children to spend on education and increasing likelihood of school attendance (++)
Water and Sanitation
Energy
5

Supporting effective governance Improving health Direct impact on well-beingFiscal impact (coupled with pro-poor policies)
Empowering women (+) Improving hygiene and health (+++)
Reducing time and effort needed to fetch water (++)
Empowering women (+) Reducing respiratory illness because of cleaner fuel (+++)
Reducing time and efforts to gather wood/biomass (+)
Improving delivery of health care (+)
Increasing access to information (via radio, telecom, etc.)
Lowering calorie expenditure (+)
Improving standard of living (+)
Reducing household accidents (e.g. burns or poisoning) (+)Reducing fertility (+)Increasing boiling of water, refrigeration of food, hence, reduced illness (+)
The number of "+" next to an impact reflects the strength of evidence for that impact
Water and Sanitation
Energy
6

Energy Impacts on Poverty
Underpinning Growth
- Increasing productivity of businesses
A lack of adequate energy services in a country has a strong and negative impact on that country’s economy. Many businesses will not locate in areas without adequate energy services for reasons including an inability to use electric machinery or technology, the lower education and health levels of workers in unelectrified areas, and the poor standard of living associated with areas lacking electricity. Likewise, businesses that already exist need energy to grow and expand beyond local customer bases. Agricultural output is significantly impacted by a lack of electrification and the depletion of wood and other resources to be used as fuel has a negative impact on agricultural output as well As a result of lowered non-agricultural and agricultural output, GDP’s growth potential remains unrealized, which impacts the poor by decreasing business opportunities and employment. Providing adequate electricity and energy services can help raise GDP, productivity and employment, all of which create a positive environment for reducing poverty.
Global Quantitative Evidence Based on data from the Penn World Tables and from “A Database of World
Stocks of Infrastructure” (Canning, 1998) from 1960 to 1990, the log of electrical generating capacity per worker was positively correlated (coefficient = 0.012, t ratio = 0.5) with the log of GDP per worker in low income countries, using the Cobb-Douglas production function, also accounting for paved roads, human capital, and capital per worker... Likewise, when combined with capital or human capital, the log of electricity per worker was positively correlated with output per worker with coefficients of 0.069 (t ratio = 6.07) and 0.152 (t ratio = 9.31), respectively.. Source: (B, p. 35-36) Based on data from the Penn World Tables and from “A Database of World
Stocks of Infrastructure” (Canning, 1998) from 1960 to 1990, the average rates of return to electrical generating capacity as measured by increases in GDP are 63% for Algeria, 46% for Argentina, 61% for Bangladesh, 92% for Bolivia, 10% for Brazil, 40% for the Central African Republic, 41% for Chile, 54% for China, 28% for Colombia, 114% for Congo, 25% for Costa Rica, 36% for Cyprus, 25% for the Dominican Republic, 45% for Ecuador, 45% for Egypt, 17% for El Salvador, 32% for Fiji, 105% for the Gambia, 25% for Ghana, 18% for Guatemala, 95% for Honduras, 24% for India, 106% for Indonesia, 11% for Jamaica, 40% for Jordan, 125% for Kenya, 31% for R.o. Korea, 54% for Malawi, 77% for Malaysia, 51% for Mali, 51% for Mexico, 34% for Myanmar, 40% for Nepal, 20% for Nicaragua, 12% for Niger, 18% for Pakistan, 21% for Panama, 6% for Papua New Guinea, 21% for Peru, 44% for the Philippines, 7% for Portugal, 6% for Senegal, 27% for Sri Lanka, 35% for Syria, 42% for Thailand, 40% for Tunisia, 32% for Turkey, 70% for Uganda, 30% for Uruguay, 24% for Yugoslavia, and 5% for Zimbabwe. In 20
7

out of those 51 countries, the rate of return to electricity exceeded that of capital. Source: (B, p. 41-42). Assuming that the ratio of electricity consumption to economic growth rate
for the past two decades in developing countries remains constant, the future ratio will continue to be approximately 1.4. This means that in order to support economic growth of 10%, electricity generation would have to expand approximately 14%. Source: (E, p. 9)
Regional Quantitative Evidence Based on data from the International Energy Agency from 1971 to 1995, in
Latin America and Asia, the electricity/energy ratio is very strongly correlated with GDPPPP/capita, with coefficients of 0.739 and 0.948 respectively, indicating that as electricity becomes a more predominant fuel, incomes rise. Source: (J, p. 933) In Africa, a survey of 32 countries in 1990, showed that the amount of
difference between the actual share of manufactures in total exports and the predicted share (based on coefficient of regressions excluding African countries) was strongly correlated with generating capacity (kw per 100 workers), with a coefficient of 0.16. Source: (F, p. 386)
Local Quantitative Evidence In India, the benefits of rural electrification programs estimated in 1988 (since
the start of the programs in 1951) included an additional net 7.23 million hectares irrigated because of electric pumps, resulting in an additional 32.87 million tons of grain produced, and an additional 2.081 billion man days of employment in the agricultural sector. Source: (C, p. 492) In Peru, based on results from LSMS surveys from 1994 to 1997, an analysis
of the factors influencing transitions in and out of poverty showed that access to electricity was significantly and positively correlated with a transition out of a state of poverty (coeff = 0.029) and negatively correlated with transitions into poverty (coeff = -0.063) and staying in a state of poverty (coeff = -0.049). Source: (D, p. 18) Using low shadow wages of R2 per hour (equivalent to less than half the
“MLL”), and based on a conservative average of five hours per week collecting wood, it has been estimated that the opportunity costs of collecting firewood for women come to Rand 1.5 billion per year in the aggregate in South Africa. Source : (K, p. 71) Based on a study of aggregate development indicators for 17 Indian states
between 1970 and 1994, increasing the proportion of villages electrified in a state by 10% would increase state-level GDP by 12%. Source: (L, p. 61) A study of 73 provinces in the Philippines with data from 1988 through 1997
shows that the change in access to electricity between 1998 and 1997 was strongly and positively correlated with a reduction in poverty levels as defined by Balisacan (1999), with a coefficient of 0.277. Source: (G, p. 25) A survey taken in 1980 of 631 households in India from Punjab, Andhra
Pradesh, Maharashtra and West Bengal states showed that the percentage of
8
the population of a village living in poverty was strongly and negatively correlated with the year that the village was electrified, when controlling for population, percentage of area irrigated, yield per acre, land concentration index, percentage of scheduled castes, and percent working in industry (coeff = -.32, t statistic = -3.23). Source: (H, p. 143) A rural study in India using data over time from 85 districts in thirteen states
found that 2% of growth in aggregate output could be attributed to electrification, through its impacts on irrigation. Source: (I, p. 64)
- Reducing damage to manufacturing from power outages and surges
Unreliable energy services can have a profoundly negative effect on an economy. Many businesses depend on a constant and reliable supply of electricity to power machinery. Such machinery is often sensitive to power surges and fluctuations in voltage. Moreover, restarting such machinery can be a long process, one that is often compounded by extended power outages. Furthermore, an unreliable energy supply can affect suppliers of intermediate goods, and can cost businesses that must unexpectedly halt production reputations based on on-time product delivery. By helping generation, transmission, and distribution entities improve the quality and reliability of their electricity supply, energy projects can help reduce the costs of power outages and surges.
Global Quantitative Evidence Based on a series of studies conducted by the Oak Ridge Laboratory in
January 1988 entitled “The Impact of Inadequate Electricity Supply in Developing Countries,” the authors concluded that power outages cause, on average, economic losses of US$1 per kWh not supplied. Source: (E, p. 130) Studies have shown that the cost of power outages to the industrial sector was
estimated at US$0.90/kWh not supplied in Pakistan, US$2.02/kWh in Argentina, US$2.56/kWh in Indonesia, and from US$1.86 to US$3.39/kWh in Colombia. Source: (I, p. 17)
Regional Quantitative Evidence According to a 1985 study of 15,000 bulk-electricity-using industrial
establishments in India by NCAER between 1982 and 1984 the cost to Indian industry of unreliable electricity supplies has been equal to about 1.5% of GNP. Likewise, a 1987 study prepared for the Water and Power Development Authority of Pakistan and USAID showed that in Pakistan, power shortages in the industrial sector have led to a 1.8% decrease in GDP and a 4.2% decrease in the country’s foreign exchange earnings. Source: (E, p. 130)
Local Quantitative Evidence According to World Bank estimates, Bangladesh experiences economic losses
totaling over US$1 billion per year due to unreliable energy supplies and power outages. Source: (A)
9

In the Indian states of Haryana and Karnataka, the copportunity cost of unreliable power in the manufacturing sector (as calculated using the production loss approach) is approximately 1% of value added in Haryana and 2.2% of value added in Karnataka. In the agricultural sector, the opportunity cost (calculated through loss in crop production) of unreliable power supplies are 3.1% of value added in Haryana and 13.3% in Karnataka. Source: (I, p. 17)
Sources A: U.S. Department of Energy. “Bangladesh.” Energy Information Administration Country Analysis Briefs. Washington, DC: US Department of Energy, 2002. http://www.eia.doe.gov/emeu/cabs/bangla.html B: Canning, David & Bennathan, Esra. “The Social Rate of Return on Infrastructure Investments.” Washington, DC: World Bank, 1997. C: Khurana, S. “Rural electrification in India.” In Power Systems in Asia and the Pacific, with Emphasis on Rural Electrification. New York: United Nations, 1990. pp. 489-495. D: Torero, Maximo. “The Access and Welfare Impacts of Telecommunications Technology in Peru.” Discussion Papers on Development Policy No. 37. Bonn: Zentrum Für Entwicklungsforschung (Center for Development Research), June 2000. E: U.S. Agency for International Development, Office of Energy. Power Shortages in Developing Countries: Magnitude, Impacts, Solutions, and the Role of the Private Sector. A Report to Congress. Washington, DC: USAID, March 1988. F: Wood, Adrian & Mayer, Jorg. “Africa’s export structure in a comparative perspective.” Cambridge Journal of Economics 25 (2001): 369-394. G: Baliscalan, Aresenio M. “Pathways of Poverty Reduction: Rural Development and Transmission Mechanisms in the Philippines.” Asia and Pacific Forum on Poverty. Manila: Asian Development Bank, 5-9 February, 2001. H: Barnes, Douglas F. Electric Power for Rural Growth: How Electricity Affects Rural Life in Developing Countries. Boulder, CO: Westview Press, 1988. I: World Bank. “India: Power Sector Reform and the Poor.” Washington, DC: World Bank, 2002. J: Ferguson, Ross; Wilkinson, William & Hill, Robert. “Electricity Use and Economic Development.” Energy Policy 28 (2000): 923-934.
10

K: Eberhard, Anton & Van Horen, Clive. Poverty and Power: Energy and the South African State. London: UCT and Pluto: 1995. L: Nagaraj, R; Varoudakis, A.; Veganzones, M-A. “Long-Run Growth Trends and Convergence Across Indian States.” Journal of International Development 12 (2000): 45-70.
11
Energy Impacts on Poverty
Increasing Economic Opportunities Specifically Targeted to the Poor
- Increasing productivity of businesses owned by or that employ the poor, hence, increasing incomes
Businesses in communities where the poor live are frequently less productive without electricity or other modern energy sources. Without access to electricity, businesses are often less productive because they are unable to take advantage of many technological advances, such as machinery or ICTs that require electricity. Low-tech businesses suffer because they are restricted to working only in the daytime – darkness often means the end of a productive working day. Thus, a lack of modern energy sources can frequently make businesses less productive. Electricity and other modern energy sources can help improve product quality by allowing businesses to use machinery that is more precise and more reliable. By improving access to electricity or other modern energy sources, energy projects can help improve the productivity of small businesses that are owned by or employ the poor, leading to increases in income, employment, and entrepreneurial opportunities.
Local Quantitative Data In Peru, electrification allowed a dairy collective to increase the price per liter
for milk from US$0.06 to US$0.11 because of improvements in product reliability (less spoilage.) Source: (A, p. 52) Based on data from the World Bank 2nd and 3rd Rural Electrification Projects
in Bangladesh and the Bangladesh Rural Electrification and Renewable Energy Development Projects, areas which were targeted under a rural electrification project had incomes 50% higher than in control areas, 22% of which has been attributed to electrification (=10% higher incomes specifically due to electrification.) The poverty rate was 34% in project areas, compared to 41% in control areas. Electrified households had incomes 33% higher than in control areas, and 66% higher than non-electrified houses in project areas. Working hours in electrified households increased from 9 to 14 hours a day, and turnover increase by 34%.. Source: (B, p. 5) A 1979 study of the Miasmis peninsula in the Philippines, covering 560,490
residents showed that after a rural electrification project, electrified households had 20% higher mean incomes than non-electrified non-project area households, and 106% higher mean incomes than non-electrified project area households. These gains were attributed mainly to the ability to do more work at night, construction of modern irrigation systems, ability to cultivate more irrigation-dependent crops, and increase job opportunities due to new electricity-dependent enterprises. These effects were particularly evident among women, who reported 70% higher incomes for electrified project-area households than non-electrified non-project area households and 160% higher than non-electrified project area households. Source: (C, p. 76-77)
12

Based on a sample of 5,000 households divided equally among electrified and unelectrified villages from eastern Thailand, the number of months that a family had been using electricity was found to be positively correlated (coeff = 0.08) with household income. It was also found to be positively correlated with the number of women working in the non-agricultural sector (coeff=0.04) Source : (D, p. 107-111) In Thailand, villages that participated in a rural electrification program
reported that 14% of households had at least one “worker increase” after availability of electricity, almost half of which were women. The additional economic activities generated on average 67 additional baht per family per month. The total average indirect tangible economic benefits from electrification are estimated at 228 baht per year, of which 12% is due to lighting savings, 39% due to agricultural labor savings, 25% due to cottage industry benefits, and 24% is due to cooking savings. Source : (D, p. 71-72) A survey taken in 1980 of 631 households in India from Punjab, Andhra
Pradesh, Maharashtra and West Bengal states showed that because of rural electrification, residents were able to buy electric pumpsets. As a result, as the number of pumpsets used increased from 0 to 40 per 1000 persons in a village, the average percentage of farmland irrigated rose from 16 to 66%. This was confirmed by a study showing that the number of years since village electrification was correlated with the percentage of land irrigated, when controlling for credit factors, proximity to markets, schools, cities, transport services, means of communication, number of newspapers read, trouble with getting agricultural inputs and contact with agricultural extension workers.(coefficient = 0.22, t statistic = 3.91). Source : (F, p. 48-50) A survey taken in 1980 of 631 households in India from Punjab, Andhra
Pradesh, Maharashtra and West Bengal states showed that the number of years since village electrification is strongly correlated with the agricultural innovation index when controlling for credit factors, proximity to markets, schools, cities, transport services, means of communication, number of newspapers read, trouble with getting agricultural inputs and contact with agricultural extension workers, with a coefficient of 0.22 (t statistic = 2.31). Agricultural innovation is strongly correlated with the yield per acre, with coefficients of 0.27 (t statistic = 3.35) officially and 0.42 (t statistic = 5.47) for the “community leader”. Source : (F, p. 53-55) Based on data from the 1998 Tanzania Peri-Urban study, which surveyed 592
households with 1,592 people, the presence of electricity in a village increased income from non-farm business activities by 61%. Incomes from non-farm employment in villages with electricity were 109 times the incomes from non-farm employment in villages without electricity. Source: (G, p. 400) Based on study of 4,813 households from the 1985-86, 1994, and 1997 Peru
LSMS studies (which maintained the same format), access to electricity increases the share of ones income from self-employed non-agricultural activities, with a coefficient of 0.124 (when controlling for age, gender, education, experience, credit, livestock, land, distance to markets, land productivity, and regional differences.) Source: (H, p. 505)
13

Based on a study of 1,861 people in rural Nicaragua in 1998, access to a electricity was strongly and positively correlated with total income (coeff = 0.318), and was especially correlated with non-farm wage income. Non-farm wage incomes for people with access to a paved road were over 3 times those of people without access to a paved road. Source: (I, p. 440) A 1986 survey of 3,961 men aged 14-35 who had completed some school in
Honduras showed that there was a strong and positive correlation between the percentage of schools in a town with electricity and the future incomes of its students. The study showed that for an increase of one standard deviation from the mean percentage of schools with electricity (from 31.5% to 56.5%), future incomes increased by 3.28% using reduced form-earnings equations and 21.5% taking into account the additional schooling that is correlated with electrification. The study controlled for other variables, such as percentage of teachers with professional degrees, student/teacher ratios, marriage, migratory status, regional differences, and post-educational experience. Source: (J, p. 168)
- Facilitating establishment of businesses that employ the poor
Whether or not a community has access to modern energy sources can be a major determinant of the ease of establishment of businesses that employ the poor. Businesses that use machinery or technology that requires electricity simply cannot be established without the purchase of high-cost generators. Businesses that need good lighting or need to be open at night are at a significant disadvantage if they cannot take advantage of electric lighting. Likewise businesses that do not necessarily require electricity experience higher costs and less productivity because biomass and other non-modern fuels are more expensive and harder to gather. Thus, it is frequently more difficult or more expensive to establish businesses in communities where the poor live, as a result of their lack of access to modern energy sources. Energy projects, by improving access to electricity or other modern energy sources could make it easier for communities to attract businesses that would employ the poor.
Local Quantitative Data A survey of 243 firms conducted in 1998 in Uganda showed that inadequate
electricity sources was ranked as the most important constraint to investment. Firms on average did not receive electricity from the public grid for 89 operating days on average, which led to 77% of large firms (in addition to 44% of medium and 16% of small firms) purchasing generators, representing 25% of their total investment in equipment and machinery in 1997. Source : (E, p. 5) A survey of 243 firms conducted in 1998 in Uganda showed that for a firm
without a privately owned generator, a one percent increase in the number of days without power results in a 0.45% reduction in investment. Source : (E, p. 15-16)
14

Sources
A: Alderdice, April & Rogers, John H. “Renewable Energy for Microenterprise.” Golden, CO: National Renewable Energy Laboratory, Nov. 2000. http://www.rsvp.nrel.gov/vpconference/vp2000/handbooks/microenterprise_handbook.pdf B: Songco, Jocelyn A. ‘Do Rural Infrastructure Investments Benefit the Poor? Evaluating Linkages: A Global View, A Focus on Vietnam.” Working Paper 2796. Washington, DC: World Bank, February 2002. C: Herrin, Alejandro. “Rural Electrification and Fertility Change in the Southern Philippines.” Population and Development Review 5:1 (Mar. 1979): 61-86. D: Piampiti, Suwanlee; Yongkittikul, Twatchai; Rodmanee, Laddwal; Pasandhanatorn, Vanawipha. Demographic and Economic Impact of Rural Electrification in Northeastern Thailand. Bangkok: The National Institute of Development Administration, 1982. E: Reinikka, Ritva & Svenson, Jakob. “How Inadequate Provision of Public Infrastructure and Services Affects Private Investment.” Washington, DC: World Bank, December 15, 1999. F: Barnes, Douglas F. Electric Power for Rural Growth: How Electricity Affects Rural Life in Developing Countries. Boulder, CO: Westview Press, 1988. G: Lanjouw, Peter; Quizon, Jamie; Sparrow, Robert. “Non-agricultural earnings in peri-urban areas of Tanzania: evidence from household survey data.” Food Policy 26 (2001): 385-403 H: Escobal, Javier. “The Determinants of Non-farm Income Diversification in Rural Peru.” World Development 29 no. 3 (2001): 497-508. I: Corral, Leonardo. “Rural Non-farm Incomes in Nicaragua.” World Development 29 no. 3 (2001): 427-442. J: Bedi, Arjun Singh & Edwards, John H. Y. “The impact of school quality on earnings and educational returns—evidence from a low-income country.” Journal of Development Economics 68 (2002) 157-185.
15

Energy Impacts on Poverty
Direct Savings
- Lowering costs of energy
Modern energy is still beyond the reach of many people in developing countries. Many poor people consume no modern fuels – such as coal, kerosene, electricity, natural gas, or liquefied petroleum gas – and must rely instead on low-quality fuels such as wood or animal dung. The poor are often ready to pay the full cost of a reliable supply of modern energy. In fact, often they already pay more for low-quality energy sources like biomass than better-off people pay for good-quality services, like on-grid electricity. Moreover, the amount the poor pay for energy tends to represent a much larger share of their income than it does for the better-off. Because higher-quality modern energy sources are cheaper and more efficient, providing access to electricity, natural gas, liquid gases, and other non-biomass sources can help the poor save significant amounts of money while receiving better-quality energy.
Global Quantitative Data In cases where kerosene or propane gas is easily accessible, helping the poor
gain access to gas stoves may help them save money. A gas stove emits 50 times less pollutants than a wood stove and is 5 times more efficient, leading to lower fuel consumption and hence, lower fuel costs. Source: (B, p. 8)
Local Quantitative Data In Madagascar, connecting households in 16 towns (approx. 30,000 new
connections) to the electric grid led to an estimated aggregate annual savings of US$1.5-2 million per year in avoided costs on other fuels. Likewise, the marketing of charcoal stoves (approx. 60,000) saves US$1.8 million per year in reduced costs on cooking fuels. Source: (A, p. 8) A 1986 study of energy costs of lighting equipment in India showed that a
kerosene wick lamp consumes 130 times the amount of fuel as does a 60-watt electric light bulb when normalized to produce the same amount of output. Thus, households using electric light bulbs would save large amounts of money on fuel while receiving improved lighting, as compared to kerosene lamps. Source : (C, p. 34) A 1983 study of urban cooking fuels in Nigeria showed that the effective price
of electricity (2.4-2.8 kobo per MJ of useful heat) was three to five times cheaper than firewood (8.7-14.2) and 1.5 times cheaper than charcoal (3.5-4.4). Hence, if households were connected to the electric grid, they would realize significant savings when compared to the costs of wood or charcoal. Source : (C, p. 34) A study of electrified and unelectrified homes in Cape Town showed that
homes with access to electricity spent between 3 and 5% of their incomes on energy expenditures, whereas unelectrified homes spent between 14 and 16% of their incomes on energy. Source : (D, p. 64)
16

In Tblisi, Georgia, most familes cope with the cost of bad electricity by using kerosene stoves. At an average cost of 15 Lari per month, the use of these stoves is far more expensive than the cost of electricity, which is an average of 5 Lari per month. If the family uses wood, the cost of coping is even greater, 30 Lari per month. Source: (E, p. 13-14)
Sources A: World Bank. “Household Energy and Poverty.” Indoor Air Pollution: Energy and Health for the Poor 4 (May 2001). http://wbln0023.worldbank.org/Networks/HD/hddocs.nsf/c11fbff6c1b77f9985256686006dc949/e4a55e49b0f3e28785256a68006a8b09/$FILE/4th-IAP-Newsletter.pdf B: Goldemberg, Jose. “Energy and Human Well Being.” UNDP Discussion Paper Series 62. New York: United Nations Development Program, 2001. C: Leach, Gerald. “Energy and the Urban Poor.” IDS Bulletin 18.1 (1987): 31-38. D: Eberhard, Anton & Van Horen, Clive. Poverty and Power: Energy and the South African State. London: UCT and Pluto: 1995 E: Dudwick, Nora. “Georgia: A Qualitative Study of Impoverishment and Coping Strategies.” Technical Paper no. 4. in World Bank. Georgia: Poverty and Income Distribution vol. II. Washington, DC: World Bank, 1999.
17

Energy Impacts on Poverty
Improving Education
- Increasing literacy and time for reading because of improved lighting. One of the major uses of energy by the poor is for lighting. While electricity or other modern fuels provide a cheap and good source of light, other fuels, such as biomass provide very little light at a very high cost. As a result, many poor households are poorly and infrequently lit at night. Since many children from poor households work during the day, often, the nighttime is the only time when they can study. Consequently, with such poor lighting, many children in poor homes are not able to study or read at night, which hinders their educational progress. By connecting households to more modern sources of energy, such as electricity, energy projects can help increase the amount of time that children can study or read, improving educational performance.
Local Quantitative Data A survey taken in 1980 of 608 households in Colombia from the North Coast
and Central regions showed that 72% of children read in the evening if they had electricity compared to only 43% without electricity. (D, p. 104) A survey taken in 1980 of 631 households in India from Punjab, Andhra
Pradesh, Maharashtra and West Bengal states showed that 42% of children read after electrification compared to 33% of children in unelectrified households. Source: (D, p. 104) A survey conducted in 1986 of 50 electrified households in the Philippines
showed that 58% of the respondents in the survey reported that their children studied longer and/or more conveniently at night after electrification (the figure was 53% for the low income portion of the households.) Source: (F, p. 316) In a study of rural electrification in Malaysia, 80% of families indicated that
electric light had made it easier for children to study. Source: (E, p. 100) In Indonesia, a survey conducted between October 1980 and February 1981 in
Central Java of 217 electricity adopters showed that 71% reported that their children study longer due to electricity use. Source: (G, p. 61) In Andhra Pradesh, India, 26% of the poorest seventh of urban residents and
26% of the poorest eighth of rural residents reported that power interruptions negatively impacted education. Source: (J, p. 32)
- Increasing educational attainment due to improved school quality because of
electrification Communities that lack access to modern sources of electricity are often at a serious educational disadvantage because their schools lack electricity for lighting, heating, and other educational tools. Schools without electricity are often poorly lit, making it harder for children to study and read. A lack of electricity means that schools are
18

unable to use modern educational tools, such as television or radio or computers. Likewise, educational performance can be affected by inadequate heating in the winter. By connecting schools to more modern sources of energy, such as electricity, energy projects can help schools improve educational performance.
Local Quantitative Data A 1986 survey of 3,961 men aged 14-35 who had completed some school in
Honduras showed that there was a strong and positive correlation between the percentage of schools in a town with electricity and the educational attainment of its students. The study showed that for an increase of one standard deviation from the mean percentage of schools with electricity (from 31.5% to 56.5%), educational attainment rose by 0.28 years. The study controlled for other variables, such as percentage of teachers with professional degrees, student/teacher ratios, marriage, migratory status, regional differences, and post-educational experience. Source: (I, p. 168)
- Increasing household income and decreasing time spent collecting traditional
fuels, thus increasing time for children to spend on education and increasing likelihood of school attendance.
The presence of electricity or other modern energy sources in a community can significantly increase the chances that a child in that community will attend school. Because electricity is positively correlated with income, the presence of electricity in a village often means that poor families can earn enough to forego the labor of their children and send them to school. Access to modern energy frees time for education – time that would otherwise be spent collecting traditional fuels or in much less productive manual labor. Thus, connecting households, schools and businesses to an electric grid can significantly increase the likelihood of school attendance and the amount of time that children can spend on education.
Local Quantitative Data In Malaysia, 82% of parents surveyed after a rural electrification project said
that it had improved their children’s’ education. Source: (A, Annex 2 p. 13) A multipurpose household survey was conducted in 87 villages of 29 thanas in
Bangladesh in 1991-1992, stratified by whether or not the household participated in a rural credit program. This survey showed that if all schools were provided with electricity supplies, the female dropout rate would decrease 3%, the female failure rate would drop 1%, and the average number of years in school would increase to 4.38 years (from 4) for boys and 4.45 (from 4) for girls. Source: (B, p. 46) Based on the 1990-1991 Morocco living Standards Survey of nearly 20,000
individuals in 3360 households, a 10% increase in the presence of electricity in a (rural) village would lead to a 4.8% increase in school participation for boys, and a 8.2% increase in school participation for girls. If every village had electricity, enrollment for boys would jump from 68% to 80% and girls would jump from 29% to 51%, with overall enrollment increasing from 49%
19

to 66%. Likewise, school attainment would increase from 5.15 to 5.53 years for boys (with a slight decrease for girls.) Source: (C, p. 47) A survey taken in 1980 of 631 households in India from Punjab, Andhra
Pradesh, Maharashtra and West Bengal states showed that the percentage of eligible children attending school was strongly and positively correlated with the percentage of households with electricity, when controlling for the distance from schools, agricultural innovation index, double-cropping, yield per acre, proximity to services, and distance from mass media. (coeff = 0.51, t statistic = 6.07). Likewise, A survey taken in 1980 of 608 households in Colombia from the North Coast and Central regions showed that the head of household’s education level was strongly linked to whether or not the household had electricity when controlling for income and regional differences (coeff = 0.28, t statistic = 6.131). Source: (D, p. 121) Based on a study of aggregate development indicators for 17 Indian states
between 1970 and 1994, the enrollment rates of both primary and secondary schools were positively correlated with the percentage of villages electrified in those states, with coefficients of 0.1 and 0.03 respectively. Source: (H, p. 58)
Sources A: World Bank. “Rural Electrification in Asia: A Review of Bank Experience.” OED Report. Washington, DC: World Bank OED, 1994. B: Khandker, Shaidur. “Education Achievements and School Efficiency in Rural Bangladesh,” World Bank Discussion Paper 319. Washington, DC: World Bank, March, 1996. C: Khandker, Shahidur; Lavy, Victor & Filmer, Deon. “Schooling and Cognitive Achievements of Children in Morocco.” World Bank Discussion paper 264. Washington, DC: World Bank, October, 1994. D: Barnes, Douglas F. Electric Power for Rural Growth: How Electricity Affects Rural Life in Developing Countries. Boulder, CO: Westview Press, 1988. E: Foley, Gerald. Electricity for Rural People. London: Panos Institute, 1990. F: Venkataraman, K. “Rural electrification in the Asian and Pacific region.” In Power Systems in Asia and the Pacific, with Emphasis on Rural Electrification. New York: United Nations, 1990. pp. 310-332. G: Brodman, Janice. “Rural Electrification and the Commercial Sector in Indonesia.” Discussion Paper D-73L. Washington, DC: Resources for the Future, 1982. H: Nagaraj, R; Varoudakis, A.; Veganzones, M-A. “Long-Run Growth Trends and Convergence Across Indian States.” Journal of International Development 12 (2000): 45-70.
20

I: Bedi, Arjun Singh & Edwards, John H. Y. “The impact of school quality on earnings and educational returns—evidence from a low-income country.” Journal of Development Economics 68 (2002) 157-185. J: World Bank. “India: Power Sector Reform and the Poor.” Washington, DC: World Bank, 2002.
21

Energy Impacts on Poverty
Supporting Effective Governance - Empowering women
Governance frameworks, in general, tend to be negatively affected when segments of the population are unable to fully participate in civil society or are particularly overburdened with certain responsibilities. The poor, who are already disadvantaged in terms of their participation in civil society experience even further negative impacts when there are inadequate sources of energy because women are then tasked with the chore of collecting firewood or alternative energy sources. As a result, women spend many hours a day collecting firewood instead of being economically productive or improving their education. Because of this, women tend to have less power in their communities, and are unable to participate in civil society or government with the same standing as men. Although improving access to modern energy sources, particularly electricity does not guarantee increases in gender equality, it can empower women to be able to more fully participate in civil society, positively affecting governance frameworks.
Global Quantitative Evidence On average, women and children spend approximately 0.5 to 2 hours per day
collecting wood. Source: (A, p. 20). Regional Quantitative Evidence In a study of 769 women’s time expenditures in sub-Saharan Africa (Ghana,
Tanzania, Zambia), households on average spent between .29 hours (Tanga) and 2.48 hours (Zambia) collecting firewood per day, or 107-908 hours per year. If the need for firewood could be supplanted with alternative energy sources, such as electricity, that time could be used for other productive activities, such as education or income generation. Source: (B, p. 19-20)
Local Quantitative Evidence Based on data from the 1994-1997 LSMS studies in Peru, the use of biomass
fuel sources is strongly and negatively correlated with the portion of a woman’s day that is devoted to self-employment (coeff = -0.106), while being positively correlated with the portion of a woman’s day devoted to housework (coeff = 0.081). Source: (C, p. 32-34)
Sources A: Ballard-Tremeer, G ; Bruce, N ; Ezzati, M.; Lvovsky, K.; Smith, K.; von Schirnding, Y. “Addressing the Impact of Household Energy and Indoor Air Pollution in the Health of the Poor – Implications for Policy Action and Intervention Measures.” Working Paper WG5: 12. Washington, DC: WHO Commission on Macroeconomics and Health, 2000.
22

B: Calvo, Christina Malmberg. “Case Study on the Role of Women in Rural Transport: Access of Women to Domestic Facilities.” SSATP Working Paper No. 11. Washington, DC: World Bank, 1994. C: Ilahi, Nadeem. “Gender and the Allocation of Adult Time: Evidence from the Peru LSMS Panel Data.” Working Paper 2744. Washington, DC: World Bank, December 2001.
23

Energy Impacts on Poverty
Improving Health
- Reducing respiratory illness because of cleaner fuel
Biomass or other unclean energy sources are the most commonly used fuels by the poor in developing countries, largely as a result of the lack of other energy services. However, this widespread use of biomass fuel can severely and negatively impact the health of the poor. Use of biomass fuel for cooking leads to indoor air pollution, which damages the respiratory health of millions in developing countries, with enormous cost to families and to the economy. The use of unclean fuels for internal combustion engines in cars, trucks, and other transportation modes leads to widespread air pollution which further damages respiratory health. In some cases, an increase in the volume of energy services provided may increase the risks associated with environmental and noise pollution. However, evidence also suggests that increases in access to energy sources that are cleaner than traditional, biomass, and other fuels, can help reduce the incidence of respiratory illness.
Global Quantitative Data Approximately 53 million Disability Adjusted Life Years [DALYs] (4% of
the global total, from 5.5% in India to 0.9% in Latin America) as well as 1,800,000 deaths (from 5.8% of total deaths in China to 1% in Latin America) can be attributed to use of unclean/solid fuels in the early 1990s. In order to avoid one DALY, one could replace traditional stoves with improved biomass stoves at a cost of US$50-100 per DALY avoided. The cost of avoiding one DALY through the use of kerosene and LPG stoves would be between US$150-200 per day. Source: (D, p. 16-28) If poor households replaced their biomass fuels with a liquid petroleum gas
burner (US$30-120), cylinder and regulator (US$50-60) and fuel (US$1-2 per week in India), they could realize a 50-90% reduction in particulate indoor air pollution. A kerosene stove (US$30-50) and fuel (US$1-3/week)), charcoal (US$5-10 plus US$1/week for fuel), or grid electricity (US$20-50 plus US0.5-2 per week for electricity) would lead to similar reductions. Source: (D, p. 49) 130,000 premature deaths and 50-70 million incidents of respiratory illness
occur each year due to episodes of urban air pollution in developing countries, half of them in East Asia. Source : (O, p. 1121) More than 1.5 billion urban dwellers are exposed to levels of ambient air
pollution above the recommended maximum levels, leading to 400,000 deaths each year that can be directly attributable to air pollution. Source : (P, p. 15) Using demographic & household surveys (DHS) conducted from 1990
onward in 60 developing countries, regressions of water and mortality data show that access electricity is significantly correlated with a reduction in child mortality rates, even when controlling for income, with a coefficient of –1.77. In order to avert one infant death per 1000 births, access to electricity would
24

have to increase by 1.34%. In order to avert one under-5 child death per 1000 births, access to electricity would have to increase by 0.58%. Source: (Q, p. 27-29)
Regional Quantitative Data It is estimated that exposure to wood smoke, usually from the use of biomass
fuel for cooking and lighting, accounts for one third of all cancers of the nasopharynx and the larynx in South America, and that the odds ratio for cancer for people exposed to wood smoke is 2.7 times that of those not exposed. Source: (D, p. 10)
Local Quantitative Data Based on data from Kenya, replacing wood fuels with charcoal would reduce
exposure to indoor PM10 (Particulate Matter <10 micrograms) by 80%, reducing childhood ALRI (lower respiratory infections) between 21% and 44%. Source : (D, p. 19) A study of 500 children in the Gambia showed that children in huts where
cooking with biomass fuels was conducted were six times more likely to contract respiratory illnesses than other children. In India, women who did not smoke but cooked with biomass fuels had death rates from chronic respiratory illnesses similar to that of heavy male smokers. Source: (A, p. 5) Health surveys of 430 children in Evaton/Sebokeng during the winter showed
that children in homes that used coal as an energy source were 190% more likely to develop lower respiratory illness than children from electrified homes. Source: (B, p. 5) In Guatemala, birth weights were on average 63 grams lower for babies born
in households using wood as a fuel versus cleaner fuels. Source: (D, p. 11) In India, a hospital-based case-control study in Delhi found an odds ratio of
62% for cataracts when comparing people using liquid petroleum gas and biomass fuel. This means that people using biomass fuel had 1.61 times the odds of those using liquid petroleum gas for getting cataracts. Source: (D, p. 11) In Rural Mexico, use of biomass fuels was associated with a 4% decrease in
forced expiratory volume in one second/forced vital capacity (FEV1/FVC), and exposure to kitchen particle concentrations of 1000 µg /m³ was associated with a 2% decrease in FEV1 (FEV1/FVC and FVC are both standard indicators of respiratory health). Source: (E, p. 1082) A study of children aged 11-17 in rural Nepal found an adjusted odds ratio of
2.3 for asthma amongst those using biomass fuels compared to gas or kerosene. Source: (E, p. 1083) A study of 784 cases of cancers of the upper aero-digestive tract in Brazil
showed that the adjusted odds ratio for such cancers was 2.21 for patients using wood stoves, compared to those using cleaner fuels, taking into account positively confounding variables. This was particularly pronounced for females, whose odds ratio was 4.11, compared to 2.42 for men. Source: (F, p. 938-939)
25
A study of cattle-handlers and domestic workers, including 55 randomly-selected households (including 93 infants and children, 229 individuals between 5 and 49 years of age, and 23 aged 50 or older) in central rural Kenya found that exposure to particulate matter caused by a stove led to an odds ratio of 3.01 for acute respiratory illnesses at the 200-500 µg /m³ level, and 7.93 µg /m³ at the >7000 level when controlling for other factors. Source: (G, p. 623) A study conducted in the Gambia that began in 1990 and ended in 1993 of
543 children showed that the odds ratio for deaths due to acute lower respiratory illnesses for children always carried on their mother’s backs while cooking in the Gambia is 3.21 times that of children not carried on their mother’s backs, almost wholly due to smoke from biomass combustion. Source : (L, p. 1178) A study conducted over a two year period in the Gambia with a study
population of 80 pneumoccoccal cases and 159 health controls showed that the odds ratio for acute lower respiratory illnesses for children carried on their mother’s backs while cooking is 2.61 times that of children not carried on their mother’s backs, almost wholly due to smoke from biomass combustion. Source : (K, p. 889) A study using data on 37,000 Brazilian children from Demographic & Health
Surveys in 1974 and 1975 showed that access to electricity (number of connections per 1000 households) was significantly correlated with an infant’s (under 5 months) health (child height for age), with a coefficient of 1.669. Source: (R, p. 320)
- Improving delivery of health care
The lack of modern energy sources negatively impacts health centers. Without electricity for refrigeration, health clinics cannot safely administer vaccines or a number of other medicines. Without a constant source of good lighting, which is not achievable using candles or other non-electrified sources, doctors cannot safely perform operations or even adequately examine a patient at night. Many doctors and nurses simply won’t serve at health clinics that don’t have outdoor lighting to provide for their safety. Thus, it is difficult, if not impossible to establish a safe and efficient health clinic that provides quality health care services without electricity or more modern energy sources. Energy projects, by providing electrical connections to health clinics, can help in the establishment and maintenance of health care facilities.
Regional Quantitative Data The Cold Chain Program in Africa provided photovoltaic cells to health
clinics for their vaccine refrigerators. In Uganda and Ghana, who both participated in the study, the mean time between failures for refrigerators was 2.6 years and 4 years respectively. In Mali, which did not participate in the study, vaccine refrigerators exceeded the maximum temperature limit (constituting a mechanical failure) 20% of the time. Source: (C, p. 30) In South Africa, out of 9 rural clinics surveyed, 7 had unreliable radio-
communication, 5 reported unreliable vaccine storage and 3 reported non-
26
functional lighting schemes which decreased staff safety, all due to unreliable energy sources. Source: (H, p. 91)
- Lowering calorie expenditure
Improving access to clean and efficient energy sources can positively impact the food security of the poor. Energy affects the food security of the poor because people, predominantly women, have to collect firewood for cooking and lighting, lacking other energy sources. This mundane task puts a great amount of physical stress on the body, which requires the expenditure of large amounts of food calories. In food scarce-areas, where calorie expenditure is necessarily limited, such physical exertion can significantly and negatively impact health. By providing alternative, non-biomass sources of energy that do not need to be collected by lower-income households, energy sector projects can reduce food stress.
Global Quantitative Evidence Based on data gathered by Ramanathan and Nag from energy cost studies, and
from estimations of female and child (10 years old) energy costs conducted by the same authors, and based on a 1977 survey of six rural villages in the vicinity of Karnataka state showed that the calorie cost per minute to gather firewood is estimated to be 5.2 calories per minute (cpm), 4.4 cpm, and 4.6 cpm to walk to the source of firewood for men, women, and children respectively, and 6.4 cpm, 5.5 cpm. and 5.7 cpm to return with an average load of wood for men and women respectively. Based on these estimates, men expend 115 calories (5% of daily total), women 122 (5%) and children 74 (5%) on gathering firewood. If alternative and more readily available fuels replaced firewood, those calories could be saved, which would be important in communities with low nutritional intakes. Source: (J, p. 330-331)
- Reducing household accidents (e.g. burns or poisoning)
The lack of modern energy sources for cooking, heating, and lighting is almost ubiquitous among the poor in developing countries, the result of a lack of alternative sources of energy, such as electricity or liquid fuels. The use of such non-modern energy sources can be particularly hazardous to health in a household, especially in households with children. Cooking with biomass fuels significantly increases the risk of burns because of the open and uncontrolled flames that they generate. The use of paraffin as a cooking fuel, common among the poor, has been linked with significant incidences of poisoning among children. Energy projects, such as electrification, or provision of liquid fuels, which provide a more controlled flame, can significantly reduce household injuries and accidents such as burns and poisoning among the poor.
Local Quantitative Evidence Based on 1993 data, in South Africa, a reduction of approximately 35,000
burn incidents per year could be achieved by substituting electricity for other
27

fuels. This would reduce health sector costs in South Africa by SAR406 million, assuming a 54% switch to electricity as the sole energy source. Source: (H, p. 43) Based on 1993 data, a total of 4,899 poisoning deaths due to paraffin a year in
South Africa could be averted if most households substituted electricity for other fuels. Source: (H, p. 43)
- Reducing fertility
The effects that modern energy sources, such as electricity, have on incomes can positively impact health. For example, because electricity and other modern energy sources raise incomes, many families no longer see the need for additional labor for income-generating activities. Since children are frequently used as a source of labor in family businesses, the increased incomes often mean that many families elect to have fewer children. This reduces overall stress on the family and the risk of birth-related health problems for the mother. By providing modern energy sources to poor households, energy sector projects can help reduce birth rates, which can translate into further improvements in health for a family.
Local Quantitative Evidence A 1979 study of the Miasmis peninsula in the Philippines, covering 560,490
residents showed that households affected by a rural electrification project reported a 9.2% decline in fertility over two years, compared to a 0.5% decline in the previous year. This was largely attributed to increased economic prospects which placed lower benefits on children (7% of those electrified said that they would rely on their children in their old age, compared to 16% in the non-electrified project areas and 15% in the non-electrified non-project areas. Likewise, 54% of parents in electrified households found children less useful than when they were children, compared to 46% in non-electrified project-area zones, and 32% in non-electrified non-project zones.) Source: (I, pp. 68-79)
- Increasing boiling of water, refrigeration of food, hence reduced illness
In many developing countries, the poor lack access to modern energy sources such as electricity or liquid fuels. To compensate for the lower efficiency of the biomass fuels that they use, the poor need to collect larger amounts of fuel for daily use. Because of the large amount of time it takes to collect enough firewood, dung, or other biomass fuels, many people are unable to collect an adequate amount to satisfy all needs. In order to conserve the fuel that they do collect, many energy-poor households boil less water and cook less healthy food, increasing the risk of intestinal illness and malnutrition. By providing modern energy sources, such as electricity, to the poor, energy projects can often increase boiling of water and consumption of healthier food, decreasing the health risks of unclean water or food.
28

Local Quantitative Evidence 72% of respondents to a survey of recently electrified households in Malaysia
reported that their health had improved as a result of refrigerated food and greater ease in boiling water. Source : (M, p. 100)
Sources A: World Bank, Vice Presidency for Private Sector Development and Finance. “Rural Energy and Development for Two Billion People.” Washington, DC: World Bank, 1996 http://www.worldbank.org/html/fpd/energy/e4_files/rural.pdf B: Foster, Vivien. “Measuring the Impact of Energy Reform – Practical Options.” Viewpoint Note No. 210. Washington, DC: World Bank, 2000. http://www.worldbank.org/html/fpd/notes/210/210foste.pdf C: Jimenez, Antonio & Olson, Ken. “Renewable Energy for Rural Health Clinics.” Golden, CO: National Renewable Energy Laboratory, Sep. 1998. http://www.rsvp.nrel.gov/vpconference/vp2000/handbooks/health_clinic_handbook.pdf D: Ballard-Tremeer, G ; Bruce, N ; Ezzati, M.; Lvovsky, K.; Smith, K.; von Schirnding, Y. “Addressing the Impact of Household Energy and Indoor Air Pollution in the Health of the Poor – Implications for Policy Action and Intervention Measures.” Working Paper WG5: 12. Washington, DC: WHO Commission on Macroeconomics and Health, 2000. E: Bruce, Nigel; Perez-Padilla, Rogelio; Albalak, Rachel. “Indoor air pollution in developing countries: a major environmental and public health challenge.” Bulletin of the World Health Organization 78:9 (2000): 1078-1092. F: Pintos, Javier; Franco, Eduardo L.; Kowalski, Luiz P.; Oliveira, Benedito; Curado, Maria P. “Use of wood stoves and risk of cancers of the upper aero-digestive tract a case control study.” International Journal of Epidemiology 27 (1998): 936-940. G: Ezzati, Majid & Kammen, Daniel M. “Indoor air pollution from biomass combustion and acute respiratory infections in Kenya: an exposure-response study.” The Lancet 358 (August 25, 2001): 619-624. H: Community Health Research Group. “Electrification and Health: The Interface between Energy, Development, and Public Health, Technical Report.” Tygerberg, South Africa: Medical Research Council, 1995. I: Herrin, Alejandro. “Rural Electrification and Fertility Change in the Southern Philippines.” Population and Development Review 5:1 (Mar. 1979): 61-86. J: Batliwala, Srilatha. “Rural Energy Scarcity and Nutrition: A New Perspective.” Economic and Political Weekly XVII.9 (February 27, 1982): 329-333.
29

K: O’Dempsey, T.J.D.; McArdle, T.F.; Morris, J; Llloyd-Evans, N.; Baldeh, I.; Laurence, B.E.; Secka, O.; Greenwood, B.M. “A Study of Risk Factors for Pneumococcal Disease among Children in a Rural Area of West Africa.” International Journal of Epidemiology 25.4 (1996): 885-893. L: de Fransico, M.; Morris, J.; Hall, A.J.; Armstrong Schellenberg, J.R.M.; & Greenwood, B.M. “Risk Factors for Mortality from Acute Lower Respiratory Tract Infections in Young Gambian Children.” International Journal of Epidemiology 22.6 (1993): 1174-1182. M: Foley, Gerald. Electricity for Rural People. London: Panos Institute, 1990. N: Murthy, N.S.; Panda, Manoj; Parikh, Jyoti. “Economic development, poverty reduction and carbon emissions in India.” Energy Economics 19 (1997): 327-354. O: McMichael, Anthony J. “The Urban Environment and Health in a world of increasing globalization: issues for developing countries.” Bulletin of the World Health Organization 78.9 (2000): 1117-1126 P: Nunan, Fiona & Satterwaithe, David. “The Urban Environment.” Urban Governance, Partnership and Poverty Theme Paper 6. London: University of Birmingham & International Institute for Environment and Development, March, 1999. Q: Wang, Limin. “Health Outcomes in Poor Countries and Policy Implications: Empirical Findings from Demographic and Health Surveys.” Working Paper 2831. Washington, DC: World Bank, April, 2002. R: Thomas, D. & Strauss, J. “Prices, infrastructure, household characteristics and child height.” Journal of Development Economics 39 (1992): 301-331.
30
Energy Impacts on Poverty
Direct Impact on Well-Being
- Reducing time and efforts to gather wood/biomass In much of the developing world, the rural poor are not in reach of the electrical grid, and the urban poor lack connections to it. Consequently, the poor frequently use inefficient fuel sources, predominantly biomass, for their day-to-day needs. Since biomass is often not readily available, the poor spend large amounts of time collecting wood or other fuel sources for cooking, heating, and lighting. This time burden is largely borne by women, who could otherwise be using their time for more productive and potentially income-earning purposes. By providing electrical connections to both rural and urban households, energy projects, particularly electrification projects, can have a direct impact on well-being by decreasing or eliminating the time spent by the poor collecting biomass energy sources.
Global Quantitative Evidence According to a study by the World Energy Council in 1999, on average,
women and children spend approximately 0.5 to 2 hours per day collecting wood. By providing alternative energy sources, women and children could spend that time on other productive activities, such as education or income generation. Source: (B, p. 20).
Regional Quantitative Evidence In a study of 769 women’s time expenditures in sub-Saharan Africa (Ghana,
Tanzania, Zambia), households on average spent between .29 hours (Tanzania) and 2.48 hours (Zambia) collecting firewood per day, or 107-908 hours per year. If using alternative energy sources, such as electricity, could eliminate the need for firewood the time spent collecting it could be used for other productive activities, such as education or income generation. Source: (F, p. 19-20)
- Improving access to information (via radio, telecom, etc.)
In many areas where the poor live, access to modern energy sources such as electricity is very limited. Without electricity, many modern appliances, such as televisions or radios are inoperable. As a result, the poor experience decreased access to sources of information and entertainment that come from such appliances. Without electricity, even reading is difficult at night because of a lack of electric lighting. Without these sources of information, the poor tend to be less well-informed than other sectors of the population. By providing electrical connections to both rural and urban households, energy projects, particularly electrification projects, can help improve access of the poor to sources of information and entertainment.
31

Local Quantitative Evidence In India, households involved in a rural electrification project showed an
average increase of 2 man-hours-per-day in radio usage and an average increase of 1 man-hour-per-day devoted to reading. Source: (A, p. 16) Based on a survey taken in 1980 of 631 households in India from Punjab,
Andhra Pradesh, Maharashtra and West Bengal states, the percentage of households with electricity was positively and strongly correlated with literacy (coeff = 0.23). Likewise, in Colombia, electrified households were more likely read magazines and newspapers (coefficient = 0.25). Source: (C, p. 121)
- Improving standard of living
Energy poverty leads to a decreased standard of living. This decreased standard of living reflects the lack of ability to use modern appliances, poorer health and education, and other negative impacts associated with a lack of access to modern energy sources. By providing electrical connections to both rural and urban households, energy projects, particularly electrification projects, can help improve the overall standard of living of the poor.
Local Quantitative evidence In the Philippines, a survey of five rural electrification cooperatives taken in
1986, covering 50 households (20 low income households) showed that 60% of low-income households impacted by a rural electrification project reported that housework was easier because of electric lighting. Source : (D, p. 317) In the Philippines, a survey of five rural electrification cooperatives taken in
1986, covering 50 households (20 low income households) showed that 48% of households impacted by a rural electrification project (40% of low income households) reported improved peace and order and security because of electrification. Source : (D, p. 321) In Indonesia, a survey conducted between October 1980 and February 1981 in
Central Java of 217 electricity adopters showed that 64% of respondents reported that they had increased safety due to electricity use. Source: (E, p. 61) In Andhra Pradesh, a socio-economic assessment showed that 16% of the
poorest eighth of the rural population reported benefits accruing from electrification in terms of comfort, while an additional 5% reported improved household work. 44% reported that power interruptions negatively impact household work. Likewise, 52% of the poorest seventh of the urban population in Andhra Pradesh reported that power outages negatively impacted household work. Source: (G, p. 30-32) In the Philippines, a survey of five rural electrification cooperatives taken in
1986, covering 50 households (20 low income households) showed that 86% of households impacted by a rural electrification project reported that electricity had improved leisure activities. Source: (D, p. 313)
32

Sources A: World Bank. “Rural Electrification in Asia: A Review of Bank Experience.” OED Report. Washington, DC: World Bank OED, 1994. B: Ballard-Tremeer, G ; Bruce, N ; Ezzati, M.; Lvovsky, K.; Smith, K.; von Schirnding, Y. “Addressing the Impact of Household Energy and Indoor Air Pollution in the Health of the Poor – Implications for Policy Action and Intervention Measures.” Working Paper WG5: 12. Washington, DC: WHO Commission on Macroeconomics and Health, 2000. C: Barnes, Douglas F. Electric Power for Rural Growth: How Electricity Affects Rural Life in Developing Countries. Boulder, CO: Westview Press, 1988. D: Venkataraman, K. “Rural electrification in the Asian and Pacific region.” In Power Systems in Asia and the Pacific, with Emphasis on Rural Electrification. New York: United Nations, 1990. pp. 310-332. E: Brodman, Janice. “Rural Electrification and the Commercial Sector in Indonesia.” Discussion Paper D-73L. Washington, DC: Resources for the Future, 1982. F: Calvo, Christina Malmberg. “Case Study on the Role of Women in Rural Transport: Access of Women to Domestic Facilities.” SSATP Working Paper No. 11. Washington, DC: World Bank, 1994. G: World Bank. “India: Power Sector Reform and the Poor.” Washington, DC: World Bank, 2002.
33

Energy Impacts on Poverty
Sources: Albouy, Yves & Nadifi, Nadia. “Impact of Power Sector Reform on the Poor: A review of Issues and the Literature.” ESMAP Technical Paper 002. Washington, DC: World Bank, 1999. Alderdice, April & Rogers, John H. “Renewable Energy for Microenterprise.” Golden, CO: National Renewable Energy Laboratory, Nov. 2000. http://www.rsvp.nrel.gov/vpconference/vp2000/handbooks/microenterprise_handbook.pdf Baliscalan, Aresenio M. “Pathways of Poverty Reduction: Rural Development and Transmission Mechanisms in the Philippines.” Asia and Pacific Forum on Poverty. Manila: Asian Development Bank, 5-9 February, 2001. Ballard-Tremeer, G ; Bruce, N ; Ezzati, M.; Lvovsky, K.; Smith, K.; von Schirnding, Y. “Addressing the Impact of Household Energy and Indoor Air Pollution in the Health of the Poor – Implications for Policy Action and Intervention Measures.” Working Paper WG5: 12. Washington, DC: WHO Commission on Macroeconomics and Health, 2000. Barnes, Douglas F. Electric Power for Rural Growth: How Electricity Affects Rural Life in Developing Countries. Boulder, CO: Westview Press, 1988. Barnes, Douglas. “Population Growth, Wood Fuels, and Resource Problems in Sub-Saharan Africa.” Industry and Energy Department Working Paper 26. Washington, DC: World Bank, March 1990. Barnes, Douglas F.; van der Plas, Rovert and Floor, Willem. “Tackling the rural energy problem in developing countries.” Finance and Development 34.2 (June, 1997): 11-15. Batliwala, Srilatha. “Rural Energy Scarcity and Nutrition: A New Perspective.” Economic and Political Weekly XVII.9 (February 27, 1982): 329-333. Bedi, Arjun Singh & Edwards, John H. Y. “The impact of school quality on earnings and educational returns—evidence from a low-income country.” Journal of Development Economics 68 (2002) 157-185. Binswanger, Hans P.; Khandker, Shahidur R. & Rosenzweig, Mark R. “How Infrastructure and Financial Institutions Affect Agricultural Output and Investment in India.” Working Paper 163. Washington, DC: World Bank, March 1989. Brodman, Janice. “Rural Electrification and the Commercial Sector in Indonesia.” Discussion Paper D-73L. Washington, DC: Resources for the Future, 1982.
34
Bruce, Nigel; Neufield, Lynette; Boy, Erick & West, Chris. “Indoor biofuel air pollution and respiratory health: the role of confounding factors among women in highland Guatemala.” International Journal of Epidemiology 27 (1998): 454-458.
Bruce, Nigel; Perez-Padilla, Rogelio; Albalak, Rachel. “Indoor air pollution in developing countries: a major environmental and public health challenge.” Bulletin of the World Health Organization 78:9 (2000): 1078-1092. Calvo, Christina Malmberg. “Case Study on the Role of Women in Rural Transport: Access of Women to Domestic Facilities.” SSATP Working Paper No. 11. 1994. http://www.worldbank.org/afr/ssatp/SSATPWP11.pdf Canning, David & Bennathan, Esra. “The Social Rate of Return on Infrastructure Investments.” Washington, DC: World Bank, 1997. Chisari, Omar; Estache, Antonio & Romero, Carlos. “Winners and Losers from Utility Privatization in Argentina: Lessons from a General Equilibrium Model.” Working Paper 1824. Washington, DC: World Bank, 1997. Community Health Research Group. “Electrification and Health: The Interface between Energy, Development, and Public Health, Technical Report.” Tygerberg, South Africa: Medical Research Council, 1995. Corral, Leonardo. “Rural Non-farm Incomes in Nicaragua.” World Development 29 no. 3 (2001): 427-442. Dudwick, Nora. “Georgia: A Qualitative Study of Impoverishment and Coping Strategies.” Technical Paper no. 4. in World Bank. Georgia: Poverty and Income Distribution vol. II. Washington, DC: World Bank, 1999. Eberhard, Anton & Van Horen, Clive. Poverty and Power: Energy and the South African State. London: UCT and Pluto: 1995 Escobal, Javier. “The Determinants of Non-farm Income Diversification in Rural Peru.” World Development 29 no. 3 (2001): 497-508. Ezzati, Majid & Kammen, Daniel M. “Indoor air pollution from biomass combustion and acute respiratory infections in Kenya: an exposure-response study.” The Lancet 358 (August 25, 2001): 619-624. Ferguson, Ross; Wilkinson, William & Hill, Robert. “Electricity Use and Economic Development.” Energy Policy 28 (2000): 923-934. Foley, Gerald. Electricity for Rural People. London: Panos Institute, 1990.
35

Foster, Vivien. “Measuring the Impact of Energy Reform – Practical Options.” Viewpoint Note No. 210. Washington, DC: World Bank, 2000. http://www.worldbank.org/html/fpd/notes/210/210foste.pdf de Francisco, M.; Morris, J.; Hall, A.J.; Armstrong Schellenberg, J.R.M.; & Greenwood, B.M. “Risk Factors for Mortality from Acute Lower Respiratory Tract Infections in Young Gambian Children.” International Journal of Epidemiology 22.6 (1993): 1174-1182. Gavan, James D. & Tyers, Rodney. “ Agricultural Analysis for Energy Planning.” In deLucia, Russel J. & Jacoby, Henry D. et al. Energy Planning for Developing Countries : A Study of Bangladesh. Baltimore, MD: Johns Hopkins University Press, 1982. Goldemberg, Jose & Johansson, Thomas B. “Energy and an Instrument for Socio-Economic Development.” In Jose Goldemberg and Thomas B. Johansson. Energy as an Instrument for Economic Development. New York, NY: UNDP, 1995. Goldemberg, Jose. “Energy and Human Well Being.” UNDP Discussion Paper Series 62. New York: United Nations Development Program, 2001. Goldstein, Ellen. “The Impact of Rural Infrastructure on Rural Poverty: Lessons for South Asia.” Internal Discussion Paper 131, South Asia Region. Washington, DC: World Bank, June 1993. Greeley, Martin. “Energy and Agriculture: Interactions and Impact on Poverty.” IDS Bulletin 18.1 (1987): 47-54. Haughland, Torleif; Ingeberg, Kjetil & Roland, Kjell. “Price Reforms in the power sector: The World Bank’s role.” Energy Policy 15.13 (1997): 1041-1049. Herrin, Alejandro. “Rural Electrification and Fertility Change in the Southern Philippines.” Population and Development Review 5:1 (Mar. 1979): 61-86. Ilahi, Nadeem. “Gender and the Allocation of Adult Time: Evidence from the Peru LSMS Panel Data.” Working Paper 2744. Washington, DC: World Bank, December 2001.
Jimenez, Antonio & Lawand, Tom. “Renewable Energy for Rural Schools.” National Golden, CO: Renewable Energy Laboratory, Nov. 2000. http://www.rsvp.nrel.gov/vpconference/vp2000/handbooks/schools_handbook.pdf Jimenez, Antonio & Olson, Ken. “Renewable Energy for Rural Health Clinics.” Golden, CO: National Renewable Energy Laboratory, Sep. 1998. http://www.rsvp.nrel.gov/vpconference/vp2000/handbooks/health_clinic_handbook.pdf
36

Jones, Gary J. & Thompson, Griffin. “Renewable Energy for African Development.” Solar Energy 58 (1996) pp. 103-109. Kammen, Daniel M. “From Energy Efficiency to Social Utility: Lessons form Cookstove Design, Dissemination and Use.” In Jose Goldemberg and Thomas B. Johansson. Energy as an Instrument for Economic Development. New York, NY: UNDP, 1995. Khandker, Shahidur; Lavy, Victor & Filmer, Deon. “Schooling and Cognitive Achievements of Children in Morocco.” World Bank Discussion paper 264. Washington, DC: World Bank, October, 1994. Khandker, Shaidur. “Education Achievements and School Efficiency in Rural Bangladesh,” World Bank Discussion Paper 319. Washington, DC: World Bank, March, 1996. Khurana, S. “Rural electrification in India.” In Power Systems in Asia and the Pacific, with Emphasis on Rural Electrification. New York: United Nations, 1990. pp. 489-495. Lanjouw, Peter; Quizon, Jamie; Sparrow, Robert. “Non-agricultural earnings in peri-urban areas of Tanzania: evidence from household survey data.” Food Policy 26 (2001): 385-403 Leach, Gerald. “Energy and the Urban Poor.” IDS Bulletin 18.1 (1987): 31-38. Macedo, Isaias de Carvalho. “Converting Biomass to Liquid Fuels: Making Ethanol from Sugar Cane in Brazil.” In Jose Goldemberg and Thomas B. Johansson. Energy as an Instrument for Economic Development. New York, NY: UNDP, 1995. Meibodi, Ali Emami. “Efficiency considerations in the Electricity Supply Industry: the case of Iran.” SEEDS Working Paper. Surrey, England: Department of Economics, Surrey, July 1998. Monari, Lucio. “Power Subsidies: A Reality Check on Subsidizing Power for Irrigation in India.” Viewpoint Note 244 (April, 2002). Washington, DC: World Bank, 2002. Murthy, N.S.; Panda, Manoj; Parikh, Jyoti. “Economic development, poverty reduction and carbon emissions in India.” Energy Economics 19 (1997): 327-354. Nagaraj, R; Varoudakis, A.; Veganzones, M-A. “Long-Run Growth Trends and Convergence Across Indian States.” Journal of International Development 12 (2000): 45-70. Nijkamp, Peter. “Improving Urban Environmental Quality: Socioeconomic Possibilities and Limits.” In Pernia, Ernesto M. ed. Urban Poverty in Asia: A Survey of Critical Issues. Hong Kong: Oxford University Press, 1994.
37
Nunan, Fiona & Satterwaithe, David. “The Urban Environment.” Urban Governance, Partnership and Poverty Theme Paper 6. London: University of Birmingham & International Institute for Environment and Development, March, 1999. O’Dempsey, T.J.D.; McArdle, T.F.; Morris, J; Llloyd-Evans, N.; Baldeh, I.; Laurence, B.E.; Secka, O.; Greenwood, B.M. “A Study of Risk Factors for Pneumococcal Disease among Children in a Rural Area of West Africa.” International Journal of Epidemiology 25.4 (1996): 885-893. Omar, F.H. & Zin, M.Y. MD. “Rural Electrification in Malaysia.” In Power Systems in Asia and the Pacific, with Emphasis on Rural Electrification. New York: United Nations, 1990. pp. 521-524. Piampiti, Suwanlee; Yongkittikul, Twatchai; Rodmanee, Laddwal; Pasandhanatorn, Vanawipha. Demographic and Economic Impact of Rural Electrification in Northeastern Thailand. Bangkok: The National Institute of Development Administration, 1982. Pintos, Javier; Franco, Eduardo L.; Kowalski, Luiz P.; Oliveira, Benedito; Curado, Maria P. “Use of wood stoves and risk of cancers of the upper aero-digestive tract a case control study.” International Journal of Epidemiology 27 (1998): 936-940. Reinikka, Ritva & Svenson, Jakob. “How Inadequate Provision of Public Infrastructure and Services Affects Private Investment.” Washington, DC: World Bank, December 15, 1999. Songco, Jocelyn A. ‘Do Rural Infrastructure Investments Benefit the Poor? Evaluating Linkages: A Global View, A Focus on Vietnam.” Working Paper 2796. Washington, DC: World Bank, February 2002. Suarez, Carlos E. “Energy Needs for Sustainable Human Development.” In Jose Goldemberg and Thomas B. Johansson. Energy as an Instrument for Economic Development. New York, NY: UNDP, 1995. Sullivan, James B, “Private Participation in the Electric Power Sector.” in Boeker, Paul H. Latin America’s Turnaround: Privatization, Foreign Investment and Growth. San Francisco: International Center for Economic Growth, Institute of the Americas and ICS Press, 1993 Thomas, D. & Strauss, J. “Prices, infrastructure, household characteristics and child height.” Journal of Development Economics 39 (1992): 301-331. Torero, Maximo. “The Access and Welfare Impacts of Telecommunications Technology in Peru.” Discussion Papers on Development Policy No. 37. Bonn: Zentrum Für Entwicklungsforschung (Center for Development Research), June, 2000.
38

U.S. Agency for International Development, Office of Energy. Power Shortages in Developing Countries: Magnitude, Impacts, Solutions, and the Role of the Private Sector. A Report to Congress. Washington, DC: USAID, March, 1988. U.S. Department of Energy. “Bangladesh.” Energy Information Administration Country Analysis Briefs. Washington, DC: US Department of Energy, 2002. http://www.eia.doe.gov/emeu/cabs/bangla.html Venkataraman, K. “Rural electrification in the Asian and Pacific region.” In Power Systems in Asia and the Pacific, with Emphasis on Rural Electrification. New York: United Nations, 1990. pp. 310-332. Wang, Limin. “Health Outcomes in Poor Countries and Policy Implications: Empirical Findings from Demographic and Health Surveys.” Working Paper 2831. Washington, DC: World Bank, April, 2002. Wood, Adrian & Mayer, Jorg. “Africa’s export structure in a comparative perspective.” Cambridge Journal of Economics 25 (2001): 369-394. World Bank. “Household Energy and Poverty.” Indoor Air Pollution: Energy and Health for the Poor 4 (May 2001). http://wbln0023.worldbank.org/Networks/HD/hddocs.nsf/c11fbff6c1b77f9985256686006dc949/e4a55e49b0f3e28785256a68006a8b09/$FILE/4th-IAP-Newsletter.pdf World Bank. “Indonesia Rural Electrification Review.” Report 6144-IND. Washington, DC: World Bank, 1986. World Bank. “Rural Electrification in Asia: A Review of Bank Experience.” OED Report. Washington, DC: World Bank OED, 1994. World Bank, Vice Presidency for Private Sector Development and Finance. “Rural Energy and Development for Two Billion People.” Washington, DC: World Bank, 1996 http://www.worldbank.org/html/fpd/energy/e4_files/rural.pdf World Bank. “World Development Report 2000/2001: Attacking Poverty.” Oxford: Oxford University Press, 2001. http://www.worldbank.org/poverty/wdrpoverty/draft100.htm
39

Information and Communications Technology Impacts on Poverty
Underpinning Growth
- Increasing productivity of businesses
Many developing countries face low levels of investment because they have little communications infrastructure. Investors tend to locate their businesses in areas that have efficient and affordable ICT-based services because of the expanded access to markets and information that ICT-based services provide. Furthermore, because ICT services help to raise the level of income, education, and health in a country, investors are even more drawn to countries with high levels of teledensity, computers, and other ICT-based mediums. For similar reasons, as teledensity and ICT penetration increase, so do innovation and creativity, improving the prospects for entrepreneurial activities and employment. Some evidence exists that the growth spurred by investment in ICT-based services may impact the poor less positively than other parts of the population. However, some evidence also shows that expanding ICT-based services in a country as a whole can enhance the climate for investment and entrepreneurial activities, improving the general state of the economy. This raises GDP per capita, which creates a positive environment for reducing poverty.
Global Quantitative Data Based on data for 2000 from the World Development Indicators, GDP growth
of a country and the number of actual/expected telephones per capita present in a country were found to be strongly and positively correlated, with an equation of GDP growth = 2.0378 (telephones per capita)^0.296 (R2 = 0.2126). Source: (A, p. 16) Average annual percent income per capita growth between 1960 and 1985 in
73 countries was positively correlated with the log of the number of initial telephones per capita, controlling for whether or not the country was in the tropics, whether or not the country was landlocked, the Openness index of the country, life expectancy, working age ratio, growth of the working age population, and the initial number of years of education, based on data from the Penn World Tables. (coefficient = 0.261, t statistic = 1.18). Source: (M, p. 10) A study found that if a country has one more phone per 100 people than the
average number of phones expected for its income and size, foreign direct investment increases $0.03 per $100 when compared with countries with average numbers of phones. Source: (A, p. 11) Countries with private involvement in the telecommunications sector see
increases in foreign direct investment of $0.34 per $100 and on average 1.2 more phones per 100 people than when compared with comparable countries without private provision of service. Source: (A, p. 11) Between 1960 and 1990, the number of telephones per worker was
significantly and positively correlated with the GDP per worker coeff = 0.144,
40
t statistic = 3.74). This relationship was slightly less positive for developing countries (coeff = 0.139, t statistic = 3.18). Source: (D, p. 16) A study of data from 49 countries from 1957 to 1977 showed that
telecommunications infrastructure, as indicated by the average stock of telephones, is significantly and positively correlated with GDP growth (coeff = 0.0093, t statistic = 4.133). For example, if Burma (0.399 telephones per hundred population in 1957) had Mexico’s telecommunications stock (1.31 telephones per hundred population in 1957), their growth rate would have moved from 0.041 to 0.065. If Burma had Canada’s stock (29.03 telephones per 100 population in 1957), its growth would have been 0.082. Source: (F, p. 185-191) According to a study of innovativeness conducted in 2000, economic
creativity and information technology in developing countries are strongly and positively correlated, with coefficients of 0.54 for Internet hosts and 0.53 for personal computers. Excluding Africa, the figure jumps to 0.81 for Internet hosts in Latin America and 0.88 for Internet hosts in East Asia. Source: (G, p. 13) Based on a study of 119 countries over the period 1960-1989, the number of
telephone lines per thousand inhabitants is strongly positively correlated with per-capita GDP growth, with a coefficient of 0.4148. Source: (H, p. 516) Various studies show that a consumer surplus exists because of various cost
savings achieved by telecommunications investment. In Egypt, the cost saving identified was residential office, and a surplus of 280% was derived. In Bangladesh, the cost savings identified was for transport, the surplus was 150%. In Uganda, agricultural transport savings achieved a surplus of 50%. In Kenya, avoided foreign-exchange loss showed a surplus of 100%. In India, the bus transport cost saved was from 300%-500%. In Costa Rica, the call revenue from telephones achieved a consumer surplus of 66%. In Botswana, a study of payphones showed a consumer surplus of 780%. Source: (J, p. 15) Data on teledensity and GDP for 43 countries, both developed and developing
from 1975 through 1990 showed that output per capita was strongly and positively correlated with high levels of teledensity, as expressed in telecommunications investment as a share of national income (coeff= 0.102) and number of mainlines per working age population (coeff = 0.107). Source: (P, p. 902) A study of the relationships between infrastructure and foreign direct
investment in 71 countries between 1988 and 1997 using data from the World Development Indicators showed that the number of phones per 1,000 population is strongly and positively correlated with the level of foreign direct investment in a country, with a coefficient of 0.623, when accounting for openness of the economy, regional differences, government consumption, inflation, money supply, political instability and GDP growth. Source: (Q, p. 113)
Regional Quantitative Data
41

A study growth statistics between 1960 and 1989 for sub-Saharan Africa and Latin America showed that the log of telephones per worker was significantly and positively correlated with real per-capita GDP growth, with a coefficient of 0.007 (t statistic = 2.71), controlling for differences by decade, whether the country was African or Latin American, initial income, education levels, political stability (assassinations), financial depth, black market premiums, and fiscal surpluses. Source: (I, p. 1210) As a result of inadequate telecommunications infrastructure, Africa’s
aggregate GDP was 1% lower than it would have been with sufficient telecommunications. Source: (B, p. 139) In Africa, a survey of 36 countries in 1990 showed that the amount of
difference between the actual share of manufactures in total exports and the predicted share (based on coefficient of regressions excluding African countries) was strongly correlated with the number of telephones in the country (per 1,000 workers), with a coefficient of 0.24. Source: (O, p. 386)
Local Quantitative Data In Sri Lanka, farmers received approximately 80-90% of retail price for their
goods after the implementation of telephones, before telephones they received only 50-60%. Source: (C, p. 28) A survey of 74 Indian Garment Manufacturing firms located in Okhla
conducted between September 1997 and February, 1998 showed that a higher level of IT adoption by garment manufacturing firms tended to make a firm more likely to be export intensive (coeff = 0.80268, t statistic = 4.062). Source: (E, p. 17) In Yemen, the annual losses due to inadequate communications infrastructure
and its effect on transportation was estimated to be $11,666,094 due to idle time due to transport breakdowns, $155,292 due to perished goods due to transport breakdowns. On the Aden-Mukalla-Seiyun road alone, unused return loads due to inadequate communications were estimated to be $17,096,606. An estimated $9,013,962 in losses could be avoided by improving access to telephones along the road at a cost of $600,000 per year. Source: (K, p. 141) In Peru, based on results from LSMS surveys from 1994 to 1997, the effect of
access to a telephone positively correlated (coefficient = 0.051, z score = 0.670) with transition out of poverty. Likewise, access to a telephone was negatively correlated with a transition into poverty (coefficient = -0.1, z score = -1.174), and with staying in poverty (coefficient = -0.446, z score = -4.417). Source: (L, p. 18) In China, data provided between 1978 and 1997 showed that a £1000
investment by the government in telecommunications is likely to raise agricultural GDP by £1,910, rural GDP by £6,980 and reduce the number of poor by 2.6 people. In Western China, rural GDP would be increased by £4,130 and the number of poor would be reduced by 10.1 people. Source: (N, p. 7)
42
In India, if states with “Poor” investment climates improved telecommunications, as expressed by e-mail usage to the best level observed in India, average business growth rates in those states would rise 1.7%. Source: (R, p. 69)
Sources A: Grace, Jeremy; Kenny, Charles; Liu, Jia; Qiang, Christine; Reynolds, Taylor. “Information and Communication Technologies and Broad-Based Development: A Partial Review of the Evidence.” Washington, DC: World Bank, February 2001. http://wbln0018.worldbank.org/ict/resources.nsf/e2ad793628a4445385256943006e80f4/1dda15ac468eb637852569fb0053cb77/$FILE/graceetal0214.doc B: World Bank. Can Africa Claim the Twenty-First Century? Washington, DC: World Bank, April 2000. C: Goldstein, Ellen. “The Impact of Rural Infrastructure on Rural Poverty.” Internal Discussion Paper 131. Washington, DC: World Bank, June 1993. D: Canning, David. “Telecommunications and Aggregate Output.” CAER II Discussion Paper 56. Cambridge, MA: Harvard Institute for International Development, December 1999. E: Lal, K. “Information Technology and Exports: A Case Study of India Garments Manufacturing Enterprises.” ZEF Discussion Papers on Development Policy No. 15. Bonn: Zentrum Für Entwicklungsforschung (Center for Development Research), August 1999. F: Norton, Seth. “Transaction Costs, Telecommunications, and the Microeconomics of Macroeconomic Growth.” Economic Development and Cultural Change 41.1 (October, 1992): 175-196. G: Chong, Alberto & Micco, Alejandro. “The Internet and the Ability to Innovate in Latin America.” Working Paper 464. Washington, DC: Inter-American Development Bank (IADB), January 2002. H: Bougheas, Spiros; Demetriades, Panicos O. & Mamuneas, Theofanis P. “Infrastructure, Specialization and Economic Growth.” Canadian Journal of Economics 33.2 (May, 2000): 506-522. I: Easterly, William & Levine, Ross. “Africa’s Growth Strategy: Policies and Ethnic Divisions.” The Quarterly Journal of Economics (November, 1997): 1203-1250. J: Clarkstone, A; Cleevely, D.D.; Dymond, A.C.; Hills, T.D.; Lauder, G. Rural Telecoms Handbook: Systems, Planning and Assessment. Vol. 1. Cambridge, England: Analysys Publications, 1989.
43

K: Saunders, Robert J.; Warford, Jeremy J. & Wellenius, Bjorn. Telecommunications & Economic Development, 2nd ed. Baltimore, MD: Johns Hopkins University Press for the World Bank, 1994. L: Torero, Maximo. “The Access and Welfare Impacts of Telecommunications Technology in Peru.” Discussion Papers on Development Policy No. 37. Bonn: Zentrum Für Entwicklungsforschung (Center for Development Research), June 2000. M: Canning, David. “Telecommunications Infrastructure, Human Capital, and Economic Growth.” CAER II Discussion Paper 55. Cambridge, MA: Harvard Institute for International Development, September 1999. N: Willoughby. “Infrastructure and Pro-Poor Growth: Implications of Recent Research.” London: DFID, 2002. O: Wood, Adrian & Mayer, Jorg. “Africa’s export structure in a comparative perspective.” Cambridge Journal of Economics 25 (2001): 369-394. P: Madden, Gary & Savage, Scott J. “Telecommunications and economic growth.” International Journal of Social Economics 7/8/9/10 (2000): 893-906. Q: Asiedu, Elizabeth. “On the Determinants of Foreign Direct Investment to Developing Countries: Is Africa Different?” World Development 30 no. 1 (2002): 107-119. R: World Bank. “Improving the Investment Climate in India.” Washington, DC: World Bank, February, 2002.
44

Information and Communications Technology Impacts on Poverty
Increasing of Economic Opportunities Specifically Targeted to the Poor - Improving productivity and efficiency of businesses
One of the greatest constraints to starting, developing, and expanding a business, particularly a small business owned by or that employs the poor is lack of information. Merchants who cannot get adequate information about products and markets often pay higher-than-market prices for inputs and sell finished goods at lower-than-market prices. Farmers who cannot get access to information about new techniques and technologies often produce less output than those farmers who are up-to-date on agricultural innovations. Likewise, agricultural producers who are unaware of market conditions, many of whom are poor, receive less income than those who operate in information-rich conditions. Businesses owned by the poor that lack these types of information, often suffer from the absence of adequate ICT-based services – often, a simple telephone call would suffice to obtain the necessary piece of information. Further constraining the development of businesses in rural areas that employ the poor are the large distances that employees and managers must travel to conduct business, much of which could be conducted over the phone. These trips decrease productivity and increase costs. Improving access to ICT-based services allows businesses to more effectively communicate with markets, other businesses and other important sources of information over the telephone or the Internet, enabling them to reap substantial productivity and income gains.
Global Quantitative Data Globally, countries where the telecommunications sector is delivering its full
potential, with sector revenues composing 2-3% of GDP, have achieved a faster growth in income for the poorest twenty percent of the population, based on data from the ITU and World Bank. Source: (H, p. 2)
Regional Quantitative Data A survey of 144 SMEs in Tanzania, and 151 SMEs in Kenya conducted
between November 1999 and May 2000 showed that 88% and 76% of SMEs perceived that computer applications increased management efficiency and competitiveness respectively. Likewise, approximately 83% considered that mobile phones significantly or very significantly helped the business to expand regionally, while the figure was 75% for fixed line phones and 73% for faxes. Source: (B, p. 15) According to a survey of 144 SMEs in Tanzania, and 151 SMEs in Kenya
conducted between November 1999 and May 2000, the use of a fax machine was found to be significantly and positively correlated with output (coeff = 0.435, t statistic =2.342) due to the increased access to formal information that the fax machine provides. Source: (B, p. 21)
45
Local Quantitative Data In India, computerization of the train reservations system in New Delhi led to
a reduction in the time needed to purchase a ticket from several hours to fifteen minutes, translating into an aggregate savings of 20,000 man-hours per day. Source: (A, p. 1) In rural India, prices paid to farmers have increased 3 to 5% because of
publication of grain prices on Internet modules installed in local villages. Source: (C, p. 3) In Zambia, a 1999 survey of 21,000 farmers found that 50% of farmers
credited radio-backed farm forums with increasing their crop yields. Source: (E, p. 17) In Peru, Ashaninka Indian villagers have raised incomes by 10% by using the
Internet to market organically grown oranges in Lima. Source: (F, p. 2) In a survey of 176 telephone subscribers (77 business and 99 residential) in
Sri Lanka conducted in 1984, 50% increased the volume of their business, 40% increased profits or incomes, 33% increased the regional extent of their business, and 10% increased the variety of their business as a result of the telephone. Source: (G, p. 25) In a survey conducted in 1981 of 9 firms in Nairobi, Kenya on the benefits of
telecommunications, an average estimated 5.1% increase in profits was expected to accrue primarily as a result of business expansion and reduced labor time. Source: (G, p. 181) A survey of 274 firms (87 urban, 56 peri-urban and 131 rural) located in
central Java, drawn from a sample of 2500 medium and large manufacturing firms showed that the availability of a telephone connection is significantly more important than the proximity of a large city (control factor), with a coefficient of 1.64 (t value = 4.14). This value was higher than the values for “high expected growth in local/regional market,” and “speed of procedure for obtaining land,” the second and third most important locational decision factors. Source: (H, p. 129) Based on twenty case studies from Kenya conducted in 1987, if
telecommunications facilities were improved (generally, the addition of exchanges and extensions to the phone network), firms would be able to increase export earnings by an average of 0.74% because of increased access to markets and market information. Likewise, because of increased market information, firms would save an average of 0.07% on their import bills. Overall, the firms would increase total export earnings by 0.75%, improving the foreign exchange position by ksh 33 million. If these cases were extrapolated to the Kenyan export sector as a whole, the improved telecommunications would lead to an increase of ksh 186 million. Source: (I, p. 141-145) In Bangladesh, a 1998 survey of 60 farmers, 50 living in 50 target villages
having received a GTC village pay-phone, and 10 living in a control village not receiving a village pay-phone, showed that those farmers living in villages with GTC pay-phones received prices that were 7% higher for rice paddy, 8%
46
higher for eggs, and 9% higher for foreign exchange than those living in villages without phones. Source: (J, p. 31)
Sources A: Dubard, Trip. “Cities and the Information Revolution.” The Urban Age 3 no.1 (Feb, 1995): 1, 4-8. B: Matambalya, Francis & Wolf, Susanna. “The Role of ICT for the Performance of SMEs in East Africa.” ZEF Discussion Papers on Development Policy No. 42. Bonn: Zentrum Für Entwicklungsforschung (Center for Development Research), December 2001. C: Jafri, Anwar; Dongre, Amitabh, Tripathi, V.N.; Aggrawal, Aparajita & Shrivastava, Shashi. “Information Communication Technologies and Governance: The Gyandoot Experiment in Dhar District of Madhya Pradesh, India.” Working Paper 160. London: Overseas Development Institute, April 2002. D: Dymond, Andreze; Juntunen, Niina; Navas-Sabater, Juan. “Telecommunications and Information Services for the Poor: Toward a Strategy for Universal Access.” World Bank Discussion Paper No. 432. Washington, DC: World Bank, April 2002. E: Kenny, Charles. “The Costs and Benefits of ICTs for Direct Poverty Alleviation.” Washington, DC: InfoDev/World Bank, January, 2002. F: Dasgupta, Susmita; Lall, Somik & Wheeler, David. “Policy Reform, Economic Growth and the Digital Divide: An Econometric Analysis.” Washington, DC: World Bank, 2001. G: Saunders, Robert J.; Warford, Jeremy J. & Wellenius, Bjorn. Telecommunications & Economic Development, 2nd ed. Baltimore, MD: Johns Hopkins University Press for the World Bank, 1994. H: Rietveld, Piet; Kameo, Daniel; Schipper, Youdi & Vlaanderen, Niels. “Infrastructure and Industrial Development: The Case of Central Java.” Bulletin of Indonesian Economic Studies 30.2 (August 1994): 119-132. I: ITU. Contribution of Telecommunications to the Earning/Savings of Foreign Exchange in Developing Countries. Geneva; ITU, April, 1988. J: Bayes, Abdul; von Braun, Joachim.; Akhter, Rasheda. “Village Pay Phones and Poverty Reduction: Insights from a Grameen Bank Initiative in Bangladesh.” ZEF Discussion Papers on Development Policy No. 8. Bonn: Zentrum Für Entwicklungsforschung (Center for Development Research), June 1999.
47
Information and Communications Technology Impacts on Poverty
Direct Savings
- Facilitating access to market information, and therefore, to better goods and services
In many developing countries, market operations are inefficient because of a lack of information about market conditions. As a result, people or businesses buying goods and services often pay more than economic costs because they are unaware of lower prices from other market participants. Furthermore, the goods and services purchased may often be inferior because of lack of knowledge about the locations of superior goods and services. Improving access to ICT-based services allows people and businesses to gather better information about market conditions and consequently obtain better prices and goods with less effort by using telephones and the Internet to communicate with other market participants.
Local Quantitative Data In Chile, provision of information on equipment and material costs over the
internet reduced costs of providing information to farmers by 40% and vastly improved the speed at which information was transmitted from the previous 45 days it took for the same information to be transmitted by print media. Source: (A, p. 21) In 1980, power outages in the COELBA system in Bahia, Brazil were reduced
from an average of 190.92 times per month to 174 times per month as a result of improvements in the telecommunications network that improved maintenance efforts. Likewise, the duration of outages was reduced from 0.8 hours to 0.6 hours, 0. 8 hours to 0.6 hours, and 0.85 hours to 0.64 hours from 8 :00 am to 6 :00 pm, 6 :00 pm to 12 :00 am, and 12 :00 am to 8 :00 am respectively. Source: (C, p. 183)
- Reducing expenditures on trips for business meetings, meetings with family, etc.
Most poor people spend one of the largest portions of their income on transport. Whether in rural or urban areas, they often travel vast distances to conduct business or speak to family members. These trips are usually taken at great expense to the poor, both in terms of the cost of the trip and the opportunity costs of spending time on travel. Access to ICT-based services can save the poor substantial amounts of money by allowing people to do business over the phone instead of having to travel to conduct their business in person.
Local Quantitative Evidence In Bangladesh, consumers of local phone offices provided with the help of the
Grameen Telecom Village Telephone initiative helped save callers between 1.93 and 8.44 times the cost of the phone call, translating into real savings of
48

132-490 Taka (US$2.70 to US$10 per call) representing the avoided cost of travel to Dhaka to collect a remittance. Source: (B, p. 30)
Sources A: Grace, Jeremy; Kenny, Charles; Liu, Jia; Qiang, Christine; Reynolds, Taylor. “Information and Communication Technologies and Broad-Based Development: A Partial Review of the Evidence.” Washington, DC: World Bank, February 2001. http://wbln0018.worldbank.org/ict/resources.nsf/e2ad793628a4445385256943006e80f4/1dda15ac468eb637852569fb0053cb77/$FILE/graceetal0214.doc B: Richardson, Don; Ramirez, Ricardo & Haq, Moinul. “Grameen Telecom’s Village Phone Programme in Rural Bangladesh: A Multi-Media Case Study.” Ontario: Telecommons Development Group, March 17, 2000. C: Saunders, Robert J.; Warford, Jeremy J. & Wellenius, Bjorn. Telecommunications & Economic Development, 2nd ed. Baltimore, MD: Johns Hopkins University Press for the World Bank, 1994.
49

Information and Communications Technology Impacts on Poverty
Improving Education
- Improving quality of education
Many students can benefit from teaching strategies that diverge from traditional lectures and pen and paper methods. Often, these new teaching strategies harness the multimedia power of many information technologies to invigorate the learning process. Schools in developing countries that lack access to ICTs are at a distinct disadvantage because they cannot offer these new teaching strategies and learning methods. ICT-based services can allow schools to use modern teaching methods and strategies to improve educational performance
Global Quantitative Evidence In five case studies from around the world, Interactive Radio Instruction
resulted in improved test scores in various subjects: in Bolivia, math students had pass rates of 35% with IRI, 22.5% without. In South Africa, English in Action students improved as much as 24% for people who listened to 66 programs or more, 13% for 34-66 lessons and 7% for less than 33 lessons. Effect sizes for IRI were .94, .58, .24, .36, .72 and .34 for Bolivian Math, Nicaraguan math, Northeast Thai math, Papua New Guinea Science, South African English, and Honduras Adult Ed (Spanish for females). Source: (B, p. 28) A survey of 383 teachers participating in the WORLD Program sponsored by
the World Bank, which uses ICT to provide collaborative learning opportunities with other secondary students around the globe (Brazil, Colombia, Chile, Ghana Mauritania, Mozambique, Paraguay, Peru, Senegal, South Africa, Uganda and Zimbabwe), and 158 teachers not participating in the program showed that 5% more WORLD teachers reported increased student performance (approx. 37% v. 32%), and 26% more reported that their students had a good knowledge of current events (62% v. 36%). In addition, 77% of WORLD teachers reported that the program helped them design projects for students, and 76% reported that computers helped them learn more about the subject matter that they were teaching. These surveys were taken two years after the project had been implemented. Source: (E, p. 18-24)
Local Quantitative Evidence The use of same-language subtitling technology (SLS) to teach reading in
India led to dramatic gains in Gujarat, India. For monosyllabic words, children who saw SLS films averaged improvements of 1.05, whereas un-subtitled films saw an improvement of 0.26, and no film at all saw a decrease of 1.15. For two-syllable words, the increase was 2.70 for SLS, 1 for non-SLS, and 0.42 for the control group. For three syllable words, the scores were 3.9 for SLS, 2.5 for non-SLS, and 2.28 for the control group. Likewise, the average world-level reading improvements were similar: 1.6 for SLS
50

compared to 0.23 for non-SLS and 0.47 for the control group for two-syllable words. Source: (D, p. 134) In Burkina Gaso, Cameroon, Senegal, Cote d’Ivoire, and Madagascar, a
survey of 2,000 to 2,5000 children in 100 schools in each country showed that the presence of a television or radio in a child’s household was strongly and positively correlated with that child’s share of correct answers on a math and French test, with a coefficient of 0.017. Source: (F, p. 1706)
- Improving delivery of education
The cost of building schools in remote rural areas with diffuse populations is high, so many of the rural poor in developing countries are often unable to attend school at all. Because they lack access to schools and formal instruction, children living in remote rural areas often receive inadequate education. In other cases, many students would benefit from sharing discussions, exchanges, or other learning opportunities with other people who are so far away that inter-action in person would be prohibitively expensive. Additional ICT-based services may not always improve access of the poor to education. However, some evidence shows that ICT-based services can be used to set up distance-learning programs, which can provide education to children in rural areas and allow for discussions and exchanges between people separated by large distances.
Regional Quantitative Data In the Caribbean, use of a telephone-based conference system for university
classes allowed the University of the West Indies to offer a conference at a cost of US$1,000/day, compared to the US$11,000 it would have cost if the conference had been held face-to-face. Source: (A, p. 12)
Local Quantitative Data In Gujarat, Madhya Pradesh and Karnataka, India, governments began to use
distance learning based on ICTs for teacher training. A survey of participants in the program found that 82% saw the ICT-based distance-learning program as a better method than the traditional methods of teacher training. Source: (C, p. 111) In Jhabua, India, development oriented programs were broadcast over
television and interactive terminals to rural areas. After a second survey was conducted during the course of the programs, 37% of people in the program reported farm improvements as a result of information learned and increased awareness of development areas rose in various fields by 20% to 28%. Source: (C, p. 114)
Sources A: World Bank. “Telecommunications Sector Background and Bank Group Issues: A Joint World Bank/IFC Seminar.” Washington, DC: World Bank/IFC, February 16, 1994.
51

B: Dock, Alan & Helwig, John. “Interactive Radio Instruction: Impact, Sustainability, and Future Directions.” Education and Technology Technical Notes Series 4.1. Washington, DC: World Bank/USAID, 1999. C: Bhatia, B.S. “Satcom for Extension Training.” In Bhatnagar, Subhash & Schware, Robert. Information and Communication Technology in Rural Development: Case Studies from India. Washington, DC: World Bank, 2000. D: Kothari, Brij & Takeda, Joe. “Same Language Subtitling for Literacy: Small Change for Colossal Gains.” In Bhatnagar, Subhash & Schware, Robert. Information and Communication Technology in Rural Development: Case Studies from India. Washington, DC: World Bank, 2000. E: Kozma, Robert & McGhee, Raymond. “World Links for Development: Accomplishments and Challenges, Monitoring and Evaluation Annual Report.” Washington, DC: SRI International for the World Bank, 2000. F: Michaelowa, Katharina. “Primary Education Quality in Francophone Sub-Saharan Africa: Determinants of Learning Achievement and Efficiency Considerations.” World Development 29 no. 10 (2001): 1699-1716.
52

Information and Communications Technology Impacts on Poverty
Supporting Effective Governance
- Accelerating administrative processes One of the largest constraints to development in many economies is the “red tape” of bureaucracy. Mishandled and excessive paperwork can lead to reductions in state revenues, increases in the time it takes for the poor to get social services, and increases in costs for businesses because of long waiting times for permits and other necessary approvals. This paperwork is often inadequately maintained, resulting in a poor record of government action, leading to decreased accountability. Such red tape can have a devastating effect on a small or medium enterprise owned by a poor person, because, when combined with their low asset bases, significant bureaucratic delays can leave businesses vulnerable to failure. By using information technology to computerize many administrative processes previously handled using paperwork, ICT-based services can accelerate administrative processes, leading to improved governance.
Local Quantitative Evidence “In Mexico, satellite-generated images are dramatically improving the
capacity of the government to fight fires in the wilderness. By helping the administration focus their resources on the most critical incidents, the technology has contributed to a decline of more than 50 percent in the geographical area impacted by fires over the last year.” Source: (B, p. 12) In Uganda, inadequate telecommunications infrastructure led to government
officials making 40,000 trips instead of using the telephone, wasting over 250 person-years of government time, costing the government US$600,000. Source: (E) In Andhra Pradesh, use of computers to accelerate administrative processes in
the deed registration office has reduce the time needed for valuation of properties from one hour to a theoretical minimum of ten minutes, the sale of stamp paper from 30 minutes to a theoretical minimum of 10 minutes, registration of a deed from 1-7 days to a theoretical minimum of 1 hour, issuance of an encumbrance certificate fro1m 1-5 days to a theoretical minimum of 10 minutes, and issuance of certified copies of documents from 1-3 days to a theoretical minimum of 10 minutes. Source: (G, p. 56)
- Increasing transparency, leading to less corruption
In many developing countries, pen and paper record-keeping systems combined with poor financial controls provide ample opportunities for corruption. Powerful people often take advantage of the poor oversight of funds targeted to help the poor associated with pen-and-paper accounting systems, leaving lower income residents without funding for the social, educational or other services that they need. Likewise, without proper oversight, large bureaucracies often allow civil servants to ask for
53
bribes to accomplish simple administrative procedures. By implementing ICT-based financial and regulatory control systems, governments can get up-to-date information that can help monitor administrative processes and help prevent corruption and graft.
Local Quantitative Evidence In Andhra Pradesh, India, networked computers have been used in the reform
of processes to register deeds and stamp duties. Using traditional methods, this took 13 cumbersome steps in a highly opaque process that invited bureaucratic delay and corruption. It took from three to as many as 15 days- and the process involved the registration of over 120 million documents a year. Using a new, networked system, the same task can be accomplished in just over two hours, with far less opportunity for graft. Source: (C, p. 27-28) “In Indonesia, for example, government officials discouraged by the weak
enforcement of water pollution standards developed a public access information database rating the degree of firm compliance with pollution discharges. As the World Bank notes: ‘Even before the information was made public, firms hurried to improve their ratings. After publication, citizen’s groups used the ratings to pressure under-performing factories to clean up. Regulators, meanwhile, could focus their limited enforcement resources on the worst offenders. In the first 15 months of the program, roughly a third of the unsatisfactory performers came into compliance with the regulations.’ (World Bank, 1998, p.13).” Source: (A, p. 36-37)
- Facilitating citizen participation
Citizen participation is one of the most important factors in improving governance structures. Without citizen participation from all sectors of society, governance structures will be inherently prejudiced in favor of those sectors of society providing inputs. In many developing countries, it is the poor population that is frequently discriminated against because of their lack of ability to participate in social activities for a wide variety of reasons. By giving poor citizens the opportunity to participate in governance structures through the world wide web or e-mail, ICT-based services can help improve governance.
Local Quantitative Data In Argentina a survey of 78 NGOs in 2000 showed that 20.7% reported that
internet use enhanced access to information, 20.5% reported easier publicizing of activities, 19.3% reported enhance communication with other organizations and 15.1% reported streamlined administrative tasks. Likewise, 14.5% use the internet to gain access to municipal information. Source: (D, p. 70-71)
- Increasing Social Capital
Social capital is one of the building blocks of civil society. Without formal and informal interaction between citizens, many studies find that governance suffers because of a lack of active and interested citizens. Yet in many societies, many
54

sections of the population, particularly the poor, are marginalized and lack this social interaction due to cultural, religious, gender-based or ethnicity-based constraints. ICTs can help facilitate social interaction, thus improving the quality of civil society, and hence, governance.
Local Quantitative Data. In a survey of 176 telephone subscribers in Sri Lanka, 77 business and 99
residential, 70% increased the number of contacts they had with other people as a result of the installation of telephone service. Source: (F, p. 25)
- Empowering women
Governance frameworks, in general, tend to be negatively affected when segments of the population are unable to fully participate in civil society or are particularly overburdened with certain responsibilities. The poor, who are already disadvantaged in terms of their participation in civil society, experience even further negative impacts when there are inadequate information and communication technology-based services because women who are unable to leave their house for cultural or religious reasons are unable to be full participants in society. Although improving access to ICTs, particularly to telephones, does not guarantee gender equality, it can positively affect governance frameworks because it empowers women to be able to more fully participate in civil society.
Local Quantitative Evidence
In Bangladesh, the Grameen Bank’s Village Phone operator program allows
women to earn incomes of 14,400 taka (US$300) per year in addition to any other sources of income. This is US$14 more than the US$286 average per capita income of Bangladesh. Source: (H, p. 21)
Sources
A: Grace, Jeremy; Kenny, Charles; Liu, Jia; Qiang, Christine; Reynolds, Taylor. “Information and Communication Technologies and Broad-Based Development: A Partial Review of the Evidence.” Washington, DC: World Bank, February 2001. http://wbln0018.worldbank.org/ict/resources.nsf/e2ad793628a4445385256943006e80f4/1dda15ac468eb637852569fb0053cb77/$FILE/graceetal0214.doc B: Global ICT Department. “The Networking Revolution: Opportunities and Challenges for Developing Countries.” InfoDev Working Paper. Washington, DC: World Bank, June 2000. http://wbln0018.worldbank.org/ict/resources.nsf/c701be8cd977a3cc852569490049e219/4735389276f5d6ce8525694a0070ccd7/$FILE/Networking%20Revolution.doc
55

C: Kenny, C; Navas-Sabater, J.; Qiang, C. “PSI-PRSP ICT-Toolkit.” Washington, DC: World Bank, April 2001. http://www.worldbank.org/poverty/strategies/chapters/ict/ict0409.pdf D: Finquelievich, Susana. “Electronic Democracy: Buenos Aires and Montevideo.” Cooperation South [UNDP Publication] 1 (2001): 61-81. E: Panos. “Telecommunications Development and the Market: Problems and Promises.” Media Briefing No. 23. London: Panos, 1997. http://www.panos.org.uk/briefing/telecoms.htm F: Saunders, Robert J.; Warford, Jeremy J. & Wellenius, Bjorn. Telecommunications & Economic Development, 2nd ed. Baltimore, MD: Johns Hopkins University Press for the World Bank, 1994. G: Satyanarayana, J. “Computer-Aided Registration of Deeds and Stamp Duties.” In Bhatnagar, Subhash & Schware, Robert. Eds. Information and Communication Technology in Rural Development: Case Studies from India. Washington, DC: 2000. H: Richardson, Don; Ramirez, Ricardo & Haq, Moinul. “Grameen Telecom’s Village Phone Programme in Rural Bangladesh: A Multi-Media Case Study.” Ontario: Telecommons Development Group, March 17, 2000.
56

Information and Communications Technology Impacts on Poverty
Improving Health
- Improving health care
One of the greatest challenges for many health care providers is obtaining adequate information about patients. Health care providers spend a large amount of time and effort obtaining patient records and performing routine tests on patients. Without ICTs, needed information may not be found and routine tests can take a long time. Even if it is found, the resources spent in obtaining it may be greater than they would have been using ICTs. This mismanagement of information can have negative consequences; inadequate information on a patient’s condition can lead doctors to recommend sub-optimal treatments. ICT-based services can help to improve health by allowing health care providers to exchange information over the phone or over the Internet, reducing inefficient expenditures of time and resources and improving the ability of health care providers to identify the most effective treatments.
Local Quantitative Data In Mozambique, it is estimated that use of telemedicine could save up to
US$10,000 per year for the central hospitals based on transportation costs for inappropriate referrals. Source: (A, p. 15) In Jordan, a telemedicine-based heart monitor system was able to eliminate
50% of unnecessary cardiac referrals, which would have cost the health center an additional US$167,500 over a period of three months in one district of the ministry of health. Source: (A, p. 38)
Sources A: Telecommunication Development Bureau. “Telemedicine and Developing Countries – Lessons Learned.” Geneva: International Telecommunications Union, August 27, 1999.
57

Information and Communications Technology Impacts on Poverty
Direct Impact on Well-Being
- Increasing access to information and entertainment
In many communities where the poor live, especially in rural areas, sources of information are very limited. Newspapers and magazines are often not delivered, or not delivered in a timely manner, and other than word-of-mouth, there is often no independent source of news about the community or the nation as a whole. Likewise, there is often limited access to sources of entertainment and culture: many cultural performances never reach the rural areas or urban slums where the poor live. The few, limited possibilities that do exist are usually far out of the price range of the poor. The mass-media nature of information and communications technologies, however, would allow both information and culture to be brought to diffuse populations, including the poor, for free or relatively little money with just the installation of a receiver. Thus, projects that help connect the poor to ICT-based services can help bring additional sources of news, information, culture and entertainment that could not be accessed before.
Local Quantitative Evidence A survey of 100 households in Delhi in India in 2000 showed that 45% of
households were confident that greater access t radio, T.V., telephone and computers would improve their quality of life through entertainment. Source: (A, p. 34)
Sources A: Pigato, Miria. “Information and Communication Technology, Poverty, and Development in sub-Saharan Africa and South Asia.” Africa Region Working Paper 20. Washington, DC: World Bank, August 2001.
58
Information and Communications Technology Impacts on Poverty
Fiscal Impact (coupled with pro-poor policies)
- Improving fiscal monitoring
In many developing countries, fiscal monitoring is conducted using paper and a pen. Such methods are time-consuming, and because of a lack of funding for adequate record keeping, many transactions and debts are never noted. This is especially evident with tax collection, where millions of dollars in taxes go uncollected each year because of inadequate record-keeping and poor-quality surveys. Likewise, inadequate or incorrect data in planning processes can lead to misdirected subsidies and poorly planned projects. By computerizing fiscal monitoring systems and by using information technology to adequately survey and value property, information and communications technology can lead to a decrease in lost revenues. The additional revenues realized by utilizing ICTs for improved fiscal monitoring and planning can then be redirected towards education, health, and other programs that help the poor.
Local Quantitative Evidence In Pusan, Korea, implementation of a computerized tax collection system
helped increase tax collection 6%, halving the city’s debt. Source: (A, p. 4) In Sentarang City, Indonesia, implementation of a GIS system to survey
property helped lead to a 30% increase in tax collection. Source: (A, p. 4)
- Improving urban planning
Urban planning is a difficult task, especially in areas where the poor live, because these areas are frequently unmapped or inaccurately mapped. This inaccurate information can make it difficult for planners and city officials to plan infrastructure investments, many of which could potentially benefit the poor. Such infrastructure investments often represent large portions of budgets, and thus any waste can significantly impact the fiscal state of governments. By giving governments opportunities to use GIS systems and other advanced data collection systems, information and communications technology can help city planners make better informed decisions, decreasing misdirected funds. The additional revenues realized by utilizing ICTs for improved fiscal monitoring and planning can then be redirected towards education, health, and other programs that help the poor.
Local Quantitative Evidence In Gujarat state, India, the installation and usage of a software system to
design a canal system eliminated wasteful techniques, saving the local government 7%. In other demonstrations, the software always saved at least 3%. Source: (B, p. 36)
59

- Increasing productivity of the civil service Many civil servants, who perform important record-keeping jobs for their governments are unable to realize their full productivity because of a lack of ICT services. Writing, record-keeping, and searching for information takes far longer using a pencil and paper than it does with computers. Likewise, telephones have allowed many civil servants to communicate with one another without leaving the office, thus saving time on business-related trips. ICT-based projects can help civil servants operate more efficiently, thus saving governments money. The additional revenues realized by utilizing ICTs for improved fiscal monitoring and planning can then be redirected towards education, health, and other programs that help the poor.
Local Quantitative Evidence “In Singapore, for example, the government spends approximately US$ 100
million per year on ICTs for the Civil Service. Studies have found that every dollar spent on this program has generated US$ 2.70 in returns due to expanded productivity and reduced operational costs. As a result, over 1,500 jobs have been eliminated from the public payrolls and an additional 3,500 jobs have been reoriented towards more productive outputs” Source: (C, p. 26) In Singapore, the Customs and Excise Department reports that processing
imports and exports electronically costs 70% less than paper-based systems. Source: (C, p. 27)
Sources A: Dubard, Trip. “Cities and the Information Revolution.” The Urban Age 3.1 (Feb, 1995): 1, 4-8. B: Bhatnagar, S.C. “Use of Information Technology in Rural Development: Lessons from the Indian Experience.” In Cyranek, Gunther & Bhatnagar, S.C. eds. Technology Transfer for Development. New Delhi: Tata McGraw-Hill, 1992. C: Grace, Jeremy; Kenny, Charles; Liu, Jia; Qiang, Christine; Reynolds, Taylor. “Information and Communication Technologies and Broad-Based Development: A Partial Review of the Evidence.” Washington, DC: World Bank, February 2001. http://wbln0018.worldbank.org/ict/resources.nsf/e2ad793628a4445385256943006e80f4/1dda15ac468eb637852569fb0053cb77/$FILE/graceetal0214.doc
60

Information and Communications Technology Impacts on Poverty
Sources Asiedu, Elizabeth. “On the Determinants of Foreign Direct Investment to Developing Countries: Is Africa Different?” World Development 30 no. 1 (2002): 107-119. Barnes, Douglas F. Electric Power for Rural Growth: How Electricity Affects Rural Life in Developing Countries. Boulder, CO: Westview Press, 1988. Bayes, Abdul; von Braun, Joachim; Akhter, Rasheda. “Village Pay Phones and Poverty Reduction: Insights from a Grameen Bank Initiative in Bangladesh.” ZEF Discussion Papers on Development Policy No. 8. Bonn: Zentrum Für Entwicklungsforschung (Center for Development Research), June 19 Bedi, Arjun S. “The Role of Information and Communication Technologies in Economic Development: A Partial Survey.” ZEF Discussion Papers on Development Policy No. 7. Bonn: Zentrum Für Entwicklungsforschung (Center for Development Research), May 1999. Bhatia, B.S. “Satcom for Extension Training.” In Bhatnagar, Subhash & Schware, Robert. Information and Communication Technology in Rural Development: Case Studies from India. Washington, DC: World Bank, 2000. Bhatnagar, S.C. “Use of Information Technology in Rural Development: Lessons from the Indian Experience.” In Cyranek, Gunther & Bhatnagar, S.C. eds. Technology Transfer for Development. New Delhi: Tata McGraw-Hill, 1992. Bougheas, Spiros; Demetriades, Panicos O. & Mamuneas, Theofanis P. “Infrastructure, Specialization and Economic Growth.” Canadian Journal of Economics 33.2 (May, 2000): 506-522. Canning, David. “Telecommunications and Aggregate Output.” CAER II Discussion Paper 56. Cambridge, MA: Harvard Institute for International Development, December 1999. Canning, David. “Telecommunications Infrastructure, Human Capital, and Economic Growth.” CAER II Discussion Paper 55. Cambridge, MA: Harvard Institute for International Development, September 1999. Chong, Alberto & Micco, Alejandro. “The Internet and the Ability to Innovate in Latin America.” Working Paper 464. Washington, DC: Inter-American Development Bank (IADB), January 2002.
61

Clarkstone, A; Cleevely, D.D.; Dymond, A.C.; Hills, T.D.; Lauder, G. Rural Telecoms Handbook: Systems, Planning and Assessment. Vol. 1. Cambridge, England: Analysys Publications, 1989. Dasgupta, Sasmita; Lall, Somik; Wheeler, David. “Policy Reform, Economic Growth, and the Digital Divide: An Econometric Analysis.” World Bank Policy Research Working Paper 2567. Washington, DC: World Bank, March 2001. Dock, Alan & Helwig, John. “Interactive Radio Instruction: Impact, Sustainability, and Future Directions.” Education and Technology Technical Notes Series 4.1. Washington, DC: World Bank/USAID, 1999. Dubard, Trip. “Cities and the Information Revolution.” The Urban Age 3:1 (Feb, 1995): 1, 4-8. Dymond, Andreze; Juntunen, Niina; Navas-Sabater, Juan. “Telecommunications and Information Services for the Poor: Toward a Strategy for Universal Access.” World Bank Discussion Paper No. 432. Washington, DC: World Bank, April 2002. Easterly, William & Levine, Ross. “Africa’s Growth Stragedy: Policies and Ethnic Divisions.” The Quarterly Journal of Economics (November, 1997): 1203-1250. Estache, Antonio; Manacorda, Marco; Valletti, Tommaso M. “Telecommunications Reforms, Access Regulation, and Internet Adoption in Latin America.” Policy Research Working Paper 2802. Washington, DC: World Bank, March 2002. Finquelievich, Susana. “Electronic Democracy: Buenos Aires and Montevideo.” Cooperation South [UNDP Publication] 1 (2001): 61-81. Global ICT Department. “The Networking Revolution: Opportunities and Challenges for Developing Countries.” InfoDev Working Paper. Washington, DC: World Bank, June 2000. http://wbln0018.worldbank.org/ict/resources.nsf/c701be8cd977a3cc852569490049e219/4735389276f5d6ce8525694a0070ccd7/$FILE/Networking%20Revolution.doc Goldstein, Ellen. “The Impact of Rural Infrastructure on Rural Poverty.” Internal Discussion Paper 131. Washington, DC: World Bank, June 1993. Grace, Jeremy; Kenny, Charles; Liu, Jia; Qiang, Christine; Reynolds, Taylor. “Information and Communication Technologies and Broad-Based Development: A Partial Review of the Evidence.” Washington, DC: World Bank, February 2001. http://wbln0018.worldbank.org/ict/resources.nsf/e2ad793628a4445385256943006e80f4/1dda15ac468eb637852569fb0053cb77/$FILE/graceetal0214.doc ITU. Contribution of Telecommunications to the Earning/Savings of Foreign Exchange in Developing Countries. Geneva; ITU, April 1988.
62

Jafri, Anwar; Dongre, Amitabh, Tripathi, V.N.; Aggrawal, Aparajita & Shrivastava, Shashi. “Information Communication Technologies and Governance: The Gyandoot Experiment in Dhar District of Madhya Pradesh, India.” Working Paper 160. London: Overseas Development Institute, April 2002. Kayani, Rogati & Dymond, Andrea. “Options for Rural Telecommunications Development.” World Bank Technical Paper no. 359. Washington, DC: World Bank, June 1997. Kenny, C; Navas-Sabater, J.; Qiang, C. “PSI-PRSP ICT-Toolkit.” Washington, DC: World Bank, April 2001. http://www.worldbank.org/poverty/strategies/chapters/ict/ict0409.pdf Kenny, Charles. “The Costs and Benefits of ICTs for Direct Poverty Alleviation.” Washington, DC: World bank, January 2002. Kothari, Brij & Takeda, Joe. “Same Language Subtitling for Literacy: Small Change for Colossal Gains.” In Bhatnagar, Subhash & Schware, Robert. Information and Communication Technology in Rural Development: Case Studies from India. Washington, DC: World Bank, 2000. Kozma, Robert & McGhee, Raymond. “World Links for Development: Accomplishments and Challenges, Monitoring and Evaluation Annual Report.” Washington, DC: SRI International for the World Bank, 2000. Lal, K. “Information Technology and Exports: A Case Study of India Garments Manufacturing Enterprises.” ZEF Discussion Papers on Development Policy No. 15. Bonn: Zentrum Für Entwicklungsforschung (Center for Development Research), August 1999. Madden, Gary & Savage, Scott J. “Telecommunications and economic growth.” International Journal of Social Economics 7/8/9/10 (2000): 893-906. Madden, Gary & Savage, Scott J. “Telecommunications productivity, catch-up, and innovation.” Telecommunications Policy 23 (1999): 65-81. Matambalya, Francis & Wolf, Susanna. “The Role of ICT for the Performance of SMEs in East Africa.” ZEF Discussion Papers on Development Policy No. 42. Bonn: Zentrum Für Entwicklungsforschung (Center for Development Research), December 2001. Michaelowa, Katharina. “Primary Education Quality in Francophone Sub-Saharan Africa: Determinants of Learning Achievement and Efficiency Considerations.” World Development 29 no. 10 (2001): 1699-1716.
63

Murphy, Paud; Anzalone, Steve; Bosch, Andrea & Moulton, Jeanne. “Enhancing Learning Opportunities in Africa: Distance Education and Information and Communication Technologies for Learning. Washington, DC: World Bank, March 2002. Norton, Seth. “Transaction Costs, Telecommunications, and the Microeconomics of Macroeconomic Growth.” Economic Development and Cultural Change 41.1 (October, 1992): 175-196. Panos. “Telecommunications Development and the Market: Problems and Promises.” Media Briefing No. 23. London: Panos, 1997. http://www.panos.org.uk/briefing/telecoms.htm Pigato, Miria. “Information and Communication Technology, Poverty, and Development in sub-Saharan Africa and South Asia.” Africa Region Working Paper 20. Washington, DC: World Bank, August 2001. Richardson, Don; Ramirez, Ricardo & Haq, Moinul. “Grameen Telecom’s Village Phone Programme in Rural Bangladesh: A Multi-Media Case Study.” Ontario: Telecommons Development Group, March 17, 2000. Rietveld, Piet; Kameo, Daniel; Schipper, Youdi & Vlaanderen, Niels. “Infrastructure and Industrial Development: The Case of Central Java.” Bulletin of Indonesian Economic Studies 30.2 (August 1994): 119-132. Satyanarayana, J. “Computer-Aided Registration of Deeds and Stamp Duties.” In Bhatnagar, Subhash & Schware, Robert. Eds. Information and Communication Technology in Rural Development: Case Studies from India. Washington, DC: 2000. Saunders, Robert J.; Warford, Jeremy J. & Wellenius, Bjorn. Telecommunications & Economic Development, 2nd ed. Baltimore, MD: Johns Hopkins University Press for the World Bank, 1994. Telecommunication Development Bureau. “Telemedicine and Developing Countries – Lessons Learned.” Geneva: International Telecommunications Union, August 27, 1999. Torero, Maximo. “The Access and Welfare Impacts of Telecommunications Technology in Peru.” Discussion Papers on Development Policy No. 37. Bonn: Zentrum Für Entwicklungsforschung (Center for Development Research), June 2000. Willoughby. “Infrastructure and Pro-Poor Growth: Implications of Recent Research.” London: DFID, 2002. Wood, Adrian & Mayer, Jorg. “Africa’s export structure in a comparative perspective.” Cambridge Journal of Economics 25 (2001): 369-394.
64
World Bank. Can Africa Claim the Twenty-First Century? Washington, DC: World Bank, April 2000. World Bank. “Improving the Investment Climate in India.” Washington, DC: World Bank, February, 2002. World Bank. “Telecommunications Sector Background and Bank Group Issues: A Joint World Bank/IFC Seminar.” Washington, DC: World Bank/IFC, February 16, 1994.
65

Transport Impacts on Poverty
Underpinning Growth - Increasing productivity of businesses
Many countries in the developing world lose competitiveness because of inadequate transportation infrastructure and services. The production of goods and services and both international and domestic trade in these is often heavily tied to the ability of a country to provide not only adequate and efficient port services, but also an efficient distribution network thereafter. Many businesses will not locate in a country or regions within a country that has inadequate transportation infrastructure because it is more difficult to efficiently move goods and obtain labor. Improving the transportation infrastructure and services in a country contributes to an improved business climate and improved productivity of businesses in general, creating a positive environment for reducing poverty
Global Quantitative Evidence A study using the costs of shipping a 40’ freight (lightly packed) container
from Baltimore, MD to various destinations around the world showed that a 10% drop in transportation costs in any country would have the effect of increasing trade in that country by 25%. Source: (B, p. 27) Doubling shipping costs to a country reduces the GDP of that country by
0.5%. Infrastructure deficiency accounts for 40% of all shipping costs in developing countries. Source: (A, p. 2) Improving port efficiency from the 25th percentile to the 75th percentile (of all
ports in the world) reduces shipping costs to that port by 12%. Source: (A, p. 3) Although a median landlocked economy has only 30% of the trade of a
median coastal economy, improving the transportation infrastructure would increase the landlocked economy’s trade to 40% of that of a comparable coastal economy. Source: (B, p. i) The percentage of roads paved and road density are both positively correlated
with crop yield, with elasticity coefficients of 0.305 and 0.058 respectively. Likewise, both the percentage of roads paved and road density are positively correlated with aggregate output, with elasticity coefficients of 0.263 and 0.121. Source: (F, p. 120-121) In a study of shipping costs in Colombia, Nepal, Mozambique, Angola, Côte
d'Ivoire, and Chad, the cost of immobilization may account for 50% of a foreign trade transaction and the cost of the foreign trade transaction may account for up to 70% of the cost of an average commodity. Source: (E, p. 27)
66

Regional Quantitative Evidence UNCTAD (1998) estimates that freight costs as a percentage of the total value
of imports are almost 14% in Sub-Saharan Africa, while only 4% for the developed countries and 8% for the developing countries as a whole. Source: (C, p. 3) In 1990, net freight payments absorbed 15% of Africa’s net export earnings,
compared with the 5.8% average for developing countries. Source: (D, p. 25) In Africa, a survey of 36 countries in 1990 showed that the amount of
difference between the actual share of manufactures in total exports and the predicted share (based on coefficient of regressions excluding African countries) was strongly correlated with the amount of paved roads (km per 100,000 workers), with a coefficient of 0.32.. Source: (I, p. 386)
Local Quantitative Evidence Based on data from 85 randomly drawn districts in India from the Additional
Rural Income Survey, the elasticity of bank expansion with respect to road density is estimated at 0.80, impacting agricultural output by influencing the location of branch banks. For the period 1971-81, changing access to commercial banks led to a 23 percent increase in fertilizer demand, as well as substantial (13-46 percent) increases in investment in pump-sets, tracts, draught animals and milk animals. Source: (H, p. 10) Using state-level data gathered from 1970 to 1993, research showed that in
India, a government investment of one billion rupees on roads was found to decrease overall income poverty (using head-count measures) by 0.87%. Source: (G, p. 77) A study in India using data from the International Crops Research Institute for
the Semi-Arid Tropics from 1970 through 1974, with 5,450 observations of irrigated and non-irrigated districts showed that for irrigated districts, road density (km roads/1000 sq km cropped land) was strongly and positively correlated with agricultural output in irrigated zones, with a coefficient of 0.189. The same study, using poverty data from 1990 to 1994 showed that in irrigated areas, an investment of one million rupees (1994 prices) invested in roads would reduce the number of poor in irrigated areas by 8.02, and in rain-fed zones from 1 to 165 persons. Source: (J, p. 426) In the Ukraine, excess transport costs reach about 3.8% of GDP. Transport
costs add about 12.8% to transaction costs, compared with a European norm of 8%. Source: (K, p. 35) A study of 85 districts in thirteen states in India found that 7% of growth in
aggregate output can be attributed to road investment (through increased access to markets for farmers). Source: (L, p. 64) Based on a village-level study of the contribution of different factors to
growth in aggregate output, road investments (as judged by the 1000s of km per sq. km) was responsible of 7% of the aggregate growth in India between 1971 and 1981. Source: (M, p. 7)
67

Sources A: Clark, Ximena; Dollar, David; Micco, Alejandro. “Maritime Transport Costs and Port Efficiency.” Policy Research Working Paper 2781. Washington, DC: World Bank, February 2002. B: Limao, Nuna & Venables, Anthony. “Infrastructure, Geographical Disadvantage & Transportation Costs.” Policy Research Working Paper 2257. Washington, DC: World Bank, December 1999. C: Pedersen, Poul Ove. “The Changing Structure of Transport under Trade Liberalisation and Globalization and its Impact on African Development.” CDR Working Paper 00-1. Copenhagen: Centre for Development Research, January 2000. D: Booth, David; Hanmer, Lucia; Lovell, Elizabeth. “Poverty and Transport.” London: Overseas Development Institute. June 2000. E: de Castro, Carlos F. “Trade and Transport Facilitation: A Review of Current Issues and Operational Experience.” SSATP Working Paper 27. Washington, DC: World Bank, June 1996. F: Binswanger, Hans; Yang, Maw-Cheng; Bowers, Alan; Mundlak, Yair. “On the Determinants of Cross-Country Aggregate Agricultural Supply.” Journal of Econometrics 36 (1987): 111-131. G: Fan, Shenggen; Hazell, Peter; Thorat, Sukhadeo. “Government Spending, Growth And Poverty: An Analysis Of Interlinkages In Rural India.” EPTD Discussion Paper 33. Washington, DC: International Food Policy Research Institute, March 1998. H: Goldstein, Ellen. “The Impact of Rural Infrastructure on Rural Poverty: Lessons for South Asia.” Internal Discussion Paper 131. Washington, DC: World Bank, June 1993. I: Wood, Adrian & Mayer, Jorg. “Africa’s export structure in a comparative perspective.” Cambridge Journal of Economics 25 (2001): 369-394. J: Fan, Shenngen, Hazell, Peter & Haque, T. “Targeting public investments by agro-ecological zone to achieve growth and poverty alleviation goals in rural India.” Food Policy 25 (2000): 411-428. K: World Bank. “Republic of Ukraine Transport Sector Review.” Report 18636. Washington, DC: World Bank, 1998. L: World Bank. “India: Power Sector Reform and the Poor.” Washington, DC: World Bank, 2002.
68

M: Pouliquen, Louis. “Infrastructure and Poverty.” Unknown: 2000.
69

Transport Impacts on Poverty
Increasing Economic Opportunities Specifically Targeted to the Poor
- Facilitating establishment/increasing productivity of businesses which employ the poor
The poor who live in areas with inadequate transport service find themselves at a significant economic disadvantage. Businesses tend not to locate in transportation-poor areas, and those that do tend to be less productive, meaning less employment and lower wages for their workers in the long run. Thus, enterprises which employ the poor are often in areas with unimproved roads, and frequently encounter problems because they are difficult to access, by consumers, employees, and suppliers. These problems can be particularly acute for agricultural and other rural producers whose livelihoods are dependent on their ability to get their produce to a market. Improving transportation for businesses that serve the poor and to and from markets can significantly contribute to the growth of businesses that employ the poor.
Global Quantitative Evidence A study of developing countries found that transportation costs account for
50% of marketing costs, which in turn account for 25%-60% of the costs of agricultural products. Thus, agricultural products with higher transportation costs will be significantly less competitive because they will have to be sold at higher prices or with lower profit margins. Source: (E, p. 9)
Regional Quantitative Evidence Research in Asia found that in villages with better access to roads, fertilizer
costs were 14 percent lower, wages were 12 percent higher and crop output was 32 percent higher. Source: (D, p. 9)
Local Quantitative Evidence In the Zhengang district of Bhutan, families earned on average $176 a year in
Trong and Gewog, which are within 0 to 0.5 days walking time from a road, over two times more than in six other surveyed villages, which are 1 to 3 days walking time from a road which earned $71 a year on average. Source: (A, p. 7) A 1987 survey of 188 communities showed that in Madagascar, the economic
costs of transporting grain for traders were 39 Malagasy Francs/hour/kg of wheat for the extra time it takes to transport wheat to a market for traveling distances of up to 2 hours, and then 29.54 fmg/hour/kg from 2 to 8 hours, and 6.13 fmg/hour/kg thereafter. Source: (C, p. 22). A study of villages in Bangladesh compared outcomes in a matched sample of
sixteen villages having comparable soil and agronomic conditions, topography, and water regimes, and found somewhat higher (24%) agricultural incomes in the villages with better access (via roads), and a larger increment (78%) in incomes from livestock and fisheries. The study also
70

found that agricultural wages were higher (by 12%) and total wage income almost doubled (92%) in villages with better access (via roads). Source: (E, p. 25) In Madagascar, construction of a road to a village previously isolated
(accessible only by air and foot) led to a 35% increase in household disposable income, 52% of it going to households in the poorest 10% of the population. Farmers living within 5km of the road benefited 50% more than less centrally located farmers. Source: (F, p. 65) In the Philippines, a study of 586 out of 4,684 households affected by the
construction of 6 rural roads, showed gross household income increase of 28% (40% for farmers, 20% for non-farmers.) Production volumes of seven major marketable crops increased by nearly 40% in two years since the implementation of the project. Average farmgate prices rose 59%, while market prices rose 26% a year after the completion of the project. Furthermore, 69% of the products before the roads project were sold at the farm, typically collecting a lower price, whereas after the roads project, 60% of goods were sold at markets where they could be sold at higher prices. Commercial enterprises grew 113% following the completion of the roads project as well. Much of this change was was largely attributed to a 54% reduction in the cost of transport. Source: (N, p. 6-11) In Bangladesh, areas surrounding roads that were rehabilitated realized a 16%
increase in agricultural production (by value) because of design standards that improved drainage from roads so that drainage would irrigate fields. Source: (G, p. 1) In areas where paved roads are shown to be an appropriate intervention,
construction of such roads can have a positive impact on non-agricultural income. Based on data from the 1998 Tanzania Peri-Urban study, which surveyed 592 households with 1,592 people, the presence of an asphalt road in a village increased the probability of work in non-farm activities by 6%, and increases income from non-farm business activities by 36%. Source: (H, p. 400) In areas where paved roads are shown to be an appropriate intervention,
construction of such roads can have a positive impact on non-agricultural income. Based on a study of 1,861 people in rural Nicaragua in 1998, access to a paved road was strongly and positively correlated with total income (coeff = 0.769), and was especially correlated with non-farm wage income. Non-farm wage incomes for people with access to a paved road were over 11 times those of people without access to a paved road. Source: (I, p. 440) A study of the share of transport costs in final prices in Congo (f/k/a Zaire)
using a survey of 1,405 traders in October, 1990, showed that while the number of kilometers traveled to transport a product to market always negatively impacted the share of the final price that the producer received, the number of kilometers of good roads traveled had significantly less impact than the number of kilometers traveled on bad roads (coeff = -0.02140 for good roads, -0.05808 for bad roads). Source: (J, p. 484)
71

In Albania, 49% of farmers say that a lack of adequate transportation is their biggest marketing problem. Source: (K, p. 27) A study in Vietnam of 25 communes affected by rural roads projects and 103
communes not affected by rural roads projects showed that between 1997, when the project was first implemented, and 1999, access to credit improved in those communes affected by the projects. 4.55% more communes affected by the rural roads projects had access to Agricultural Bank credit, compared to an decrease of 22.73% for communes not affected by the rural roads projects. Source: (L, p. 46) A study in Vietnam of 25 communes affected by rural roads projects and 103
communes not affected by rural roads projects showed that between 1997, when the project was first implemented, and 1999, households in communes where the project was implemented saw an average decrease of 2.073 person days sold as labor for cultivation (7.431 in the poorest 40% of project communes) while the average number of person days sold as labor to industry/handicraft increased by 0.1 days (2.53 days). Source: (L, p. 46-51) A study conducted by GRADE in Peru, with a sample of 1,400 potato
producers in the districts of Pazos and Huaramba found that price per kg of potatoes and the sales/production ratios were higher when road access was in condition (S0.47/kg and 0.76 respectively) than when road access was in poor condition (S0.36/kg and 0.66). Source: (M, p. 99) An impact evaluation study conducted with 2,038 households after a rural
roads project was implemented in Peru found that 26.5% of focus groups impacted by the road access component of the project felt that they had higher incomes compared to just 16.3% of control groups. Also, 32% of the focus groups felt that non-agricultural income was more stable, compared to just 22% of the control group, and 28.6% found that overall income was more stable, compared to just 21% of control groups. Source: (M, p. 113)
Sources A: World Bank. “Project Appraisal Document: Bhutan Rural Access Project.” Report No: 19795-BHU. Washington, DC: World Bank, November 1999. B: Calvo, C. Malmberg; Gannon, C.; Gwilliam, K.; Liu, Z. “Transport: Infrastructure & Services – Technical Notes.” PRSP Toolkit. Washington, DC: World Bank, May 2001. http://www.worldbank.org/poverty/strategies/chapters/transport/trtn0509.pdf C: Gannon, Collin & Liu, Zhu. “Poverty & Transport.” TWU-30. Washington, DC: World Bank, September 1997. D: Spencer, Dunstan. “Infrastructure And Technology Constraints To Agricultural Development In The Humid And Subhumid Tropics Of Africa.” EPTD Discussion Paper 3. Washington, DC: IFPRI, 1994.
72
E: Creightney, Cavelle D. “Transport and Economic Performance: A Survey of Developing Countries.” World Bank Technical Paper Number 232. Washington, DC: World Bank, November 1993. F: Minten, Bart. “Infrastructure, Market Access, And Agricultural Prices: Evidence From Madagascar.” MSSD Discussion Paper 26. Washington, DC: IFPRI, March, 1999. G: USAID. “Food and Agriculture in Bangladesh: A Success Story.” Dhaka: USAID Bangladesh, June 2001. http://www.usaid.gov/bd/files/food_success.pdf. H: Lanjouw, Peter; Quizon, Jamie; Sparrow, Robert. “Non-agricultural earnings in peri-urban areas of Tanzania: evidence from household survey data.” Food Policy 26 (2001): 385-403. I: Corral, Leonardo. “Rural Non-farm Incomes in Nicaragua.” World Development 29 no. 3 (2001): 427-442. J: Minten, Bart; Kyle, Steven. “The effect of distance and road quality on food collection, marketing margins, and traders wages: evidence from the former Zaire.” Journal of Development Economics 60 (1999): 467-495. K: De Soto, Hermine; Gordon, Peter; Gedeshi, Ilir; Sinoimeri, Zamira. “A Qualitative Assessment of Poverty in 10 Areas of Albania.” Washington, DC: World Bank, 2001. L: van de Walle, Dominique & Cratty, Dorothyjean. “Impact Evaluation of a Rural Road Rehabilitation Project.” Washington, DC: World Bank, January, 2002. M: World Bank. “Project Appraisal Document on a Proposed Loan in the Amount of US$50 Million to the Republic of Peru for the Second Rural Roads Project.” Report No. 22110-PE. Washington, DC: World Bank, 2001. N: USAID/Philippines Provincial Development and Republic of the Philippines - Department of Local Government and Community Development. “Rural Roads Evaluation Report.” Washington, DC: USAID, 1978.
73

Transportation Impacts on Poverty
Direct Savings
- Lowering transportation costs
Transportation costs are often disproportionately high for the poor. Rural transport in many developing countries is expensive and inefficient because of long distances, poor condition of infrastructure and low density of demand. The poor quality of roads in many developing countries increases the“wear and tear” on vehicles and their operating costs. In urban areas, poor traffic management means that vehicles spend greater amounts of time in congested traffic, increasing fuel consumption and delays. Improving roads can lower the costs of transportation. Provided that competition and appropriate regulation encourage transport service providers to pass on the reduction in cost to transport users, this will result in transport being more affordable for users who are poor.
Global Quantitative Evidence Reducing a road’s roughness from 14 IRI (International Roughness Index) to
6 IRI would save between 12% and 22% in vehicle operating costs. A reduction from 14 IRI to 3 IRI would save from 17% to 33% in vehicle operating costs. Source: (D, p. 44) Each dollar not spent on road maintenance leads to a $3.00 increase in vehicle
operating costs as a result of poor road conditions. Source: (G, p. 5)
Local Quantitative Evidence In Morocco, after implementation of a World Bank transport project to
increase the quantity and quality of rural roads, the percentage of bigger, lower cost trucks in the project area increased at least 500%, resulting in a 50% decrease in transportation costs. Source: (B, p. 6) In cases where paved roads are shown to be an appropriate intervention, they
can help reduce the costs of non-motorized transport, which is heavily utilized by the poor. For example, in Bangladesh, costs of non-motorized transport on unpaved roads were shown to be 2.5 times that of paved roads. Source: (A, p. 30) In Ghana, after a rural roads rehabilitation project, costs for transporting
maize on the improved roads was 2000 cedis/100kg of maize, compared to 3000 cedis on unimproved roads. Likewise, a shared taxi was 1200 cedis compared to 1500, a minibus was 1200 cedis compared to 1000, and an emergency taxi cost 15000-20000 cedis compared to 25000-30000. Source: (E, p. 3) An impact evaluation study conducted after the first Rural Roads Project in
Peru showed that on average, car fares on control roads rose 33.5% compared to 13.9% for roads rehabilitated by the project. Likewise, minibus fare rose 33.6% compared to 12.8% for project roads. Bus fare rose 19.5% on control
74

roads compared to 12.9% on project roads. Lastly, truck fare rose 23% on control roads compared to 9% on project roads. Source: (J, p. 109) In Bangkok and Singapore, installation of automatic traffic control systems
reduced the average amount spent on fuel by consumers by 18%. Source: (H, p. 26)
- Increasing access to cheaper/better goods and services
Transportation projects lower the costs of goods and services, including those used by poor people. A major component of the cost of both goods and services is transportation, especially in rural and remote areas where many poor people live. In developing countries, a lack of transportation infrastructure frequently increases the distance and time a good or service must travel to reach its recipient, making transportation costs significantly higher. Building infrastructure that reduces the time it takes to transport goods and services can significantly lower the costs of services and products for the poor.
Global Quantitative Evidence A study using the costs of shipping a 40’ freight (lightly packed) container
from Baltimore, MD to various destinations around the world showed that improving transportation infrastructure (km of road, km of paved roads, km of railroads, telephones) at a destination port by one standard deviation from the world mean (for transportation infrastructure) would reduce transportation costs for internationally shipped goods by US$1200 (based on data from a shipping firm), or 19% cif/fob (based on data from the IMF). While this intervention may not directly impact the poor, if the reduction of costs is passed on to consumers, costs of imported consumer goods may decrease. Likewise, if transportation service providers pass on the cost to consumers, farmers and other exporters may experience reduced transportation costs. Source: (F, p. 6-8) A study using the costs of shipping a 40’ freight (lightly packed) container
from Baltimore, MD to various destinations around the world showed that improving transportation infrastructure to the best 25th percentile in a landlocked destination country and the transit countries through which the goods pass reduces the additional transportation cost “burden” of being landlocked from 58% to 39% (based on data from a shipping firm), or from 42% to 26% cif/fob (based on data from the IMF). While this intervention may not directly impact the poor, if the reduction of costs is passed on to consumers, costs of imported consumer goods may decrease. Likewise, if transportation service providers pass on the cost to consumers, farmers and other exporters may experience reduced transportation costs. Source: (F, p. 16)
Local Quantitative Evidence In Morocco, a study conducted in 1985 and a follow-up survey conducted in
1995 after a rural roads project rehabilitated old roads and built new roads
75

showed that the cost of butane fuel dropped from Dh20 to Dh11 in Chefahaouen, with similar decreases reported in other affected zones. Source: (C, p. 38) Data from a 1994 fertilizer marketing survey undertaken as part of USAID’s
Development of Competitive Markets Program in Ethiopia of 4,942 households showed that the probability of using fertilizer increased by 18%, 9%, 19%, 22%, 20%, 17%, 15% and 15% in seven regions because of cheaper costs if a farmer had access to an all-weather road. Source: (I, p. 22) An impact evaluation study conducted after the first Rural Roads Project in
Peru showed that on average,, freight rates per kg declined 14% on project roads compared to 1.2% on control roads. Likewise, truck freight declined 8.7 percent on project roads compared to just 0.7% on control roads. While this intervention may not directly impact the poor, if the reduction of costs is passed on to consumers, costs of imported consumer goods may decrease. Likewise, if transportation service providers pass on the cost to consumers, farmers and other exporters may experience reduced transportation costs.. Source: (J, p. 109)
Sources A: Lebo, Jerry & Schilling, Dieter. “Design and Appraisal of Rural Transport Infrastructure: Ensuring Basic Access for Rural Communities.” World Bank Technical Paper 496. Washington, DC: World Bank, April 2001. B: Calvo, C. Malmberg; Gannon, C.; Gwilliam, K.; Liu, Z. “Transport: Infrastructure & Services – Technical Notes.” PRSP Toolkit. Washington, DC: World Bank, May 2001. C: World Bank. “Socioeconomic Impact of Rural Roads: Impact Evaluation Report for the Fourth Highway Project in Morocco.” OED Report 15808-MOR. Washington, DC: World Bank, June 1996. D: World Bank. “Vietnam Moving Forward: Achievements And Challenges In The Transport Sector.” Washington, DC: World Bank, April 1999. E: World Bank. “Ghana: Building a Stronger Transportation System.” Precis 189 (Spring, 2000). Washington, DC: World Bank, 2000. F: Limao, Nuna & Venables, Anthony. “Infrastructure, Geographical Disadvantage & Transportation Costs.” Policy Research Working Paper 2257. Washington, DC: World Bank, December 1999. G: Gyamfi, Peter and Ruan, Guillermo. “Road Maintenance by Contract: Dissemination of Good Practice in Latin America and the Caribbean Region.” Latin America and the Caribbean Regional Studies Program Report 44. Washington, DC: World Bank, 1996.
76

H: Midgley, Peter. “Urban Transport in Asia: An Operational Agenda for the 1990s.” World Bank Technical Paper 224. Washington, DC: World Bank, March 1994. I: Croppenstedt, Andre & Demeke, Mulat. “Determinants of Adoption and Levels of Demand for Fertiliser for Cereal Growing Farmers in Ethiopia.” Working Paper 96-3. Oxford: Center for the Study of African Economies, March 1996. J: World Bank. “Project Appraisal Document on a Proposed Loan in the Amount of US$50 Million to the Republic of Peru for the Second Rural Roads Project.” Report No. 22110-PE. Washington, DC: World Bank, 2001.
77

Transportation Impacts on Poverty
Improving Education
- Saving time and effort , hence increasing energy and time to channel on education & easier access to schools
Children who live in areas without adequate water supplies usually assist with water collection, spending large amounts of time transporting the water to their households. Poor transport can exacerbate this problem, further increasing the time children of the poor spend on water collection and hence decreasing their time for educational activities. Children who live in rural and remote areas that are unserved by transport face a further challenge, in that they often cannot even get to a school without walking many miles. As a result, children of the poor who help to support their families and lack the time to make long journeys to and from school remain unable to access education. Reducing the amount of time it takes to reach important community resources, such as clean water can give children more time to participate in education. Furthermore, adequate transport services for poor communities can reduce the amount of time it takes their children to get to school, thus increasing their access to education.
Local Quantitative Evidence In Morocco, a study conducted in 1985 and a follow-up survey conducted in
1995 after a rural roads project rehabilitated old roads and built new roads showed that enrollment in schools in affected areas went from 28% before intervention to 68%, and female enrollment more than trebled. Source: (B, p. 6) In Andrha Pradesh, the female literacy rate is 60% higher in villages with all-
season road access compared with villages with sporadic access. Source: (A, p. 1) In the Zhengang district of Bhutan, the enrollment of girls in schools is three
time higher in Trong and Gewog, which are within 0 to 0.5 days walking time from a road than in six other surveyed villages, which are 1 to 3 days walking time from a road. Source: (I, p. 7) In Bhutan, based on comparisons of villages lacking access to a road to
villages with access to a road, it is estimated that providing access to a road in a village translates to an increase in school attendance of 75 to 100 people. Source: (A, p. 74) In Morocco, a study conducted in 1985 and a follow-up survey conducted in
1995 after a rural roads project rehabilitated old roads and built new roads showed that the school enrollment in zones affected by the rural roads project increased from 28% to 68%, whereas in “control” zones, it increased only to 51%. Overall, boys’ enrollment in school increased 108% whereas girls’ enrollment increased 220%. Source: (B, p. 30) Based on 1993 survey of 12,558 children in Zambia, the access to a passable
road decreased the probability of child labor by 4.05% and 6.83% for eight
78
year olds and thirteen year olds respectively, while increasing the probability of school attendance by 8.83% and 6.53% respectively. Source: (C, p. 17-24) Using a sample of 1,733 students in rural Ghana from the Ghanian Living
Standards Measurement Survey, researchers showed that the access to a road in a village increases the probability of a child from that village of going to a primary school by 4.3% for children aged 5-12 and 8.8% for children aged 9-12. Source: (D, p. 302) A study using data from the 1985-1986 Peru Living Standards Survey on 718
children between the ages of 10 and 18 who live in rural areas that had not completed secondary school nor dropped out of primary school showed that an increase in travel time to a local school was negatively correlated with the likelihood of school attendance (coefficient = -0.35). The enrollment rate was 56% for children within one hour of a school, 42% for 1-2 hours, 29% for 2-4 hours, and 25% for more than 4 hours. Source: (E, p. 254, 267) In situations where construction of a paved road is appropriate, it can have a
positive impact on school attendance, particularly of girls. A study of 6801 children (ages 7-20) from 2397 households in Morocco showed that the presence of a paved road in the community especially influences the schooling outcomes of rural children. In the absence of a paved road, 21 per cent of rural girls, as compared to 58 per cent of rural boys, ever attend school. If a paved road exists, the school participation rate increases to 48 per cent for girls and 76 per cent for boys. Source: (F, p. 13) After a rural roads project was implemented in Peru, an impact evaluation
survey of 2,038 households found that 55% of those impacted by the road access component of the project believed that it improved school infrastructure, 59% believed that it reduced student absenteeism, 53% believed that it improved student’s performance, and 71% believed that it improved the execution of extra-curricular activities. Source: (J, p. 112) In the Philippines, a study of 586 out of 4,684 households affected by the
construction of 6 rural roads showed that enrollment increased 10% while dropouts decreased 55%. In addition, there was a 23% increase in the average number of household members enrolled in school. Source: (K, p. 17)
- Reducing environmental hazards that contribute to poor education
Environmental factors can negatively impact the educational achievement of those children who do attend school. For example, leaded gasoline, common in many developing countries, has been positively linked to reductions in IQ due to decreased blood flow to the brain. The children of many poor families experience increased exposure to leaded gasoline in urban areas where the buses, jitneys and trucks that frequent poor areas leave their communities polluted with exhaust. Thus, interventions aimed at increasing the volume of transport services may increase the negative impacts to education associated with environmental pollution. However, complementary interventions that encourage the use of fuels such as unleaded gasoline that are less harmful to the environment can help improve the overall educational performance of children.
79

Global Quantitative Evidence In large cities where leaded gasoline is still used, it accounts for 80 to 90
percent of airborne lead pollution. Lead contamination and exposure in cities are typically 3 to 4 times higher than in the suburbs and 10 times higher than in rural areas. As a result of this exposure, children living in the inner cities may suffer as much as a 4-point IQ loss compared with those in the suburbs. Lead can be removed from gasoline at a cost of US$0.01-US$0.02 per liter. Source: (G, p. 5, 9) According to a review of epidemiological studies (CDC, 1991), a 10
microgram per deciliter (µg/dl) increase in blood lead (the best indicator of current exposure) can be associated with a 2.5 point decrease in the IQ of exposed children. Source: (H, p. 1)
- Improving delivery of education
In many remote rural areas where the poor live, the delivery of social services faces many challenges. For example, it is frequently hard to attract qualified personnel to work in such areas without basic infrastructure services, such as transport. This problem is often experienced by schools in poor rural areas, where a lack of transport discourages teachers from working Inadequate transport also increases the cost and lowers the effectiveness of other support for providing school services. As a result, initiatives to improve rural education lack strong support, leaving the poor underserved in this key respect. Ensuring that adequate transport is available for children and teachers to reach school, can make a key contribution to improving education for the poor.
Local Quantitative Evidence In Morocco, a study conducted in 1985 and a follow-up survey conducted in
1995 after a rural roads project rehabilitated old roads and built new roads showed that the number of schools in the project zones increased from 3 to 13.5 after the rural roads project was implemented. In the “control” zones, the increase was from 2 to 3. Source: (B, p. 32) After a rural roads project was implemented in Peru, an impact evaluation
survey of 2,038 households found that 69% of those impacted by the road access component of the project believed that it improved teachers willingness to teach and rapport, 63% believed that it had a positive impact on teacher recruiting, and 79% believed that improved female teachers’ safety when traveling. Source: (J, p. 112)
Sources A: Lebo, Jerry & Schilling, Dieter. “Design and Appraisal of Rural Transport Infrastructure: Ensuring Basic Access for Rural Communities.” World Bank Technical Paper 496. Washington, DC: World Bank, April 2001.
80

B: World Bank. “Socioeconomic Impact of Rural Roads: Impact Evaluation Report for the Fourth Highway Project in Morocco.” OED Report 15808-MOR. Washington, DC: World Bank, June 1996. C: Nielsen, Helena Sykt. “Child Labor and School Attendance: Two Joint Decisions.” Working Paper 98-15. Aarhus, Denmark: Centre for Labor Market and Social Research, October 1998. D: Lavy, Victor. “School Supply Constraints and Children’s Educational Outcomes in Rural Ghana.” Journal of Development Economics 51 (1996): 291-314. E: Gertler, Paul & Glewwe, Paul. “The Willingness to Pay for Education in Developing Countries: Evidence from Rural Peru.” Journal of Public Economics 42 (1990): 251-275. F: Khandker, Shahidur R.; Lavy, Victor & Filmer, Deon. “Schooling and Cognitive Achievements of Children in Morocco.” World Bank Discussion Paper No. 264. Washington, DC: World Bank, 1994. G: Lovei, Magda. “Eliminating A Silent Threat: World Bank Support for the Phaseout of Lead from Gasoline.” Environmental Department Working Paper. Washington, D.C.: World Bank, 1999. H: Lovei, Magda. “Phasing Out Lead From Gasoline: Worldwide Policy Experience and Implications.” World Bank Technical Paper 397. Washington, D.C.: World Bank, January 1998. I: World Bank. “Project Appraisal Document: Bhutan Rural Access Project.” Report No: 19795-BHU. Washington, DC: World Bank, November 1999. J: World Bank. “Project Appraisal Document on a Proposed Loan in the Amount of US$50 Million to the Republic of Peru for the Second Rural Roads Project.” Report No. 22110-PE. Washington, DC: World Bank, 2001. K: USAID/Philippines Provincial Development and Republic of the Philippines - Department of Local Government and Community Development. “Rural Roads Evaluation Report.” Washington, DC: USAID, 1978.
81

Transportation Impacts on Poverty
Supporting Effective Governance - Empowering women
Constrained mobility is often one of the significant challenges women face in becoming more active in a community. In rural communities, transport infrastructure and services are generally planned and controlled by men, frequently limiting the independent mobility opportunities of women. Moreover, women often bear a disproportionate transport-related burden as compared with men, and the resulting demands on their time put them at a further disadvantage for effective community involvement. Although access to transport does not guarantee increased gender equality, providing transport services that allow women to be more mobile and reduce their time burden can increase women’s empowerment by allowing them to participate more in community affairs.
Regional Quantitative Evidence Based on interviews with 769 households in Tanzania, Ghana, and Zambia,
the average woman in sub-Saharan Africa spends 0.92 to 2.35 hours per day on transportation for domestic chores. Source: (B, p. 28) In Africa, 65% of the transport burden of households is borne by women.
Source: (C, p. 68)
Local Quantitative Evidence In Morocco, a study conducted in 1985 and a follow-up survey conducted in
1995 after a rural roads project rehabilitated old roads and built new roads showed that after a rural roads project, the average number of women working outside of a farm in a project zone increased from 0.15 to 3. Source: (A, p. 28) Women located in a village on a main road in Cameroon were able to spend
more time producing food to sell, and made an average income of $570, more than twice the $225 earned by women in an isolated village located one and a half hours from the road. Source: (C, p. 70)
Sources A: World Bank. “Socioeconomic Impact of Rural Roads: Impact Evaluation Report for the Fourth Highway Project in Morocco.” OED Report 15808-MOR. Washington, DC: World Bank, June 1996. B: Calvo, Christina Malmberg. “Case Study on the Role of Women in Rural Transport: Access of Women to Domestic Facilities.” SSATP Working Paper No. 11. Washington, DC: World Bank, 1994.
82

C: Booth, David; Hanmer, Lucia; Lovell, Elizabeth. “Poverty and Transport.” London: Overseas Development Institute, June 2000.
83

Transport Impact on Poverty
Improving Health
- Increasing access to healthcare
The poor often lack adequate health care simply because they cannot get to a health center. Many areas where the poor live, both rural and urban, are not served by public transport so that the inhabitants have no option but to walk. In the case of health clinics, this can often mean journeys on foot of many miles; difficult when in good health, and often be impractical or dangerous for those who are sick. When transportation costs are high, or when health centers are difficult to access or take a long time to reach, many poor people stop seeking health care altogether. Reducing the cost and time to reach health centers through improved transport frequently leads to an increase in timely access of the poor to health care.
Local Quantitative Evidence In Morocco, a study conducted in 1985 and a follow-up survey conducted
after a rural roads project rehabilitated old roads and built new roads in 1995 showed that visits to hospitals and health care centers by women in affected areas increased from 1.1 to 2.4 per year and from 2.3 to 3.1 respectively. Source: (A, p. 37) A 1973 survey in Lusaka showed that 50% of patients attended hospitals if
they were within 5km of their homes. However, only 2% of patients attended hospitals if they were between 30km and 44km from their homes. Source: (C, p. 8) In Jamaica, 73.1% of women reported that mobility was a problem with
respect to access to prenatal healthcare services. Source: (G, p. 18) In Tanzania a series of baseline and impact evaluation studies of the USAID-
Funded Agricultural Transport Assistance Program showed that 34% and 52.5% of residents in two villages affected by a rural roads project reported improved access to health care (29% and 25% respectively, reported no change). Source: (H, p. 31) A study in the Philippines showed that a 10% increase in distance (by time)
from a health care center is associated with a 2% increase in mortality rates. Source: (I, p. 39) 11.5% of African people, according to a 1995 household survey reported that
the unavailability or high cost of transport was the major barrier to obtaining health care (24.1% of rural South African reported traveling more than one hour to the nearest health care facility.) Source: (L, p. 10) A study in Vietnam of 25 communes affected by rural roads projects and 103
communes not affected by rural roads projects showed that between 1997, when the project was first implemented, and 1999, the amount of time it took to reach a hospital decreased significantly. On average, the time to walk to the closest hospital decreased by 16.824 minutes for all households in
84

communes affected by the project, and 21.9 minutes for the poorest 40% of communes affected by the project. Source: (O, p. 45) After a rural roads project was implemented in Peru, an impact evaluation
survey of 2,038 households found that 70% believed that the project improved health infrastructure and equipment, 90% felt that the road access component of project improved the number of attendances, 76% believed that it improved the health personnel’s willingness to treat, 91% believed it improved timely attendance to emergencies, 77% believed it increased access to medicines and 82% believed that it increased specialization of doctors treating patients. Source: (P, p. 112)
- Reducing atmospheric/noise pollution
Motor vehicles are a major source of air pollution. In urban areas, these problems are exacerbated when congestion causes vehicles to idle for long periods of time, increasing harmful emissions. Many vehicles comply with neither emission nor noise standards, even if such standards exist. Some interventions aimed at increasing the availability of transport may also increase atmospheric and noise pollution. However, complementary interventions can improve traffic management and encourage the use of less polluting fuels thus reducing environmental problems which may negatively impact the health of the poor.
Global Quantitative Evidence Standard automobiles (assuming 2 occupants) generate 16 grams of carbon
dioxide, 1.32 grams of hydrocarbons, 0.55 grams of NOx, and 0.1 grams of SOx, and 0.165 grams of particulate matter per passenger-km at low speeds (30 kmph). At higher speeds (60 kmph), those figures would drop to 9.38g of CO, 0.55g of hydrocarbons, 0.38g of NOx, 0.05g, of SOx and trace amounts of particulate matter. Source: (E, p. 43) Giving buses “priority turns” would reduce vehicle emissions by 7%, while
giving buses exclusive streets or freeway privileges would reduce vehicle emissions by 60%. Source: (E, p. 91) In simulated urban traffic operations, a comparison between free-flowing and
heavily congested peak-hour traffic flows indicated that free-flowing traffic would reduce fuel consumption by 31% and a reduce HC, CO, and NOx emissions by 54%, 52%, and 2 % respectively. Source: (E, p. 91) A 1 µg/meter³ increase in ambient lead concentrations is estimated to cause
44,800 to 97,000 cases of hypertension per year in males between 20 and 70, 180 to 500 non-fatal heart attacks, and 200-650 premature deaths in males between 40-59. The use of 100 metric tons of leaded gasoline per day is estimated to increase lead concentrations in the blood by 2.1 µg/dl based on data from the United States. Source: (K, p. 3)
85

Local Quantitative Evidence In Bangkok, a study of exposure to carbon monoxide levels found that while
in a car, people were exposed to twice the amount of carbon monoxide as they would be exposed to in their houses, even when a charcoal stove was being used in the home. Source: (D, p. 19) In Bangkok, average noise levels along densely traveled roads were 74-80db,
higher than the 70db limit recommended by the USEPA. More than 7% of buses, 60% of trucks, and 25% of minibuses emitted more than 100db at a distance of 0.5 m. Source: (D, p. 19) In Mexico City, 40% of lead accumulation in the blood of school children was
attributed to their exposure to areas with heavy vehicle traffic. Source: (J, p. 4) By converting from leaded to unleaded gasoline in Singapore as well as other
urban transport interventions, the level of lead concentration in the air decreased from 0.3 units in 1991 to 0.2-0.1 in 1993. After an area license scheme was implemented, the total amount of Nitrogen Oxide in the air decreased from 167 and 151 in April and May (pre-scheme) to 112 and 128 in August and September (post-scheme). Source: (M, p. 792-795) In Bangkok, the impact of urban air pollution was 51 million restricted
activity days and 1,400 excess deaths in 1989 from particulates, 20,000-50,000 people at risk of angina pain/day and 900,000-2,300,000/day at risk of minor effects from carbon monoxide, 200,000-500,000 cases of hypertension a year, 300-900 heart attacks and stroke, 200-400 deaths, 400,000-700,000 IQ points lost in children per year, all due to lead, and 90-100 cancer cases per year due to air-toxins from mobile sources. Source: (N, p. 263)
- Improving delivery of health care In remote rural areas where the poor tend to live it is frequently hard to attract qualified personnel to provide social services, such as health care, without basic infrastructure services, such as transport. This problem is especially acute for health care, where the pool of qualified doctors and nurses may be especially small and concentrated in urban areas. As a result, many clinics that serve areas where the poor live are understaffed, so that even those who can reach the clinics are likely to receive inadequate health care. More effective transport between rural communities and urban centers can help make it easier to establish and staff health-care centers and to give them adequate support.
Local Quantitative Evidence In Morocco, a study conducted in 1985 and a follow-up survey conducted in
1995 after a rural roads project rehabilitated old roads and built new roads showed that the number of full-time medical staff per clinic in affected areas increased from 0 to 3 or 4 per health center. Source: (A, p. 33) An OED study of a feeder-roads project in Brazil which surveyed 23 villages
showed that after project implementation, the number of inhabitants per
86

hospital bed decreased from 740.2, 550.2, and 636.6 in three regions to 629.5, 542.2, and 573.3 respectively. Source: (B, p. 25)
- Increasing access to clean water
The poor often live far from sources of potable water, so transportation is a significant factor for them in water collection. Because inadequate transport makes water collection time consuming and burdensome, the poor often consume less water, and the water that they do consume is frequently of poor quality, giving rise to high rates of intestinal disease and childhood mortality. Improving access to clean water sources through improved transport can encourage the use of clean water, and hence improve the general health of the communities they serve.
Regional Quantitative Evidence In a series of studies on a total of 769 households in Zambia, Ghana, and
Tanzania, surveys showed that when trips to collect water were only 5 or 15 minutes, 10.4 liters of water per day were consumed by each family member, whereas when the walk was 22 minutes consumption sunk to 10 liters per day, and 33 minutes traveling time to collect water was linked to consumption of 7.9 liters per day. Source: (F, p. 12)
Sources A: World Bank. “Socioeconomic Impact of Rural Roads: Impact Evaluation Report for the Fourth Highway Project in Morocco.” OED Report 15808-MOR. Washington, DC: World Bank, June 1996. B: World Bank. “Impact Evaluation Report: Feeder Roads in Bahia.” OED Report 16738. Washington, DC: World Bank, June 1997. C: Ellis, Simon & Hine, John. “The Provision of Rural Transport Services: Approach Paper.” SSATP Working Paper No. 37. Washington, DC: World Bank, April 1998. D: Midgley, Peter. “Urban Transport in Asia: An Operational Agenda for the 1990s.” World Bank Technical Paper 224. Washington, DC: World Bank, March 1994. E: Faiz, Asif; Sinha, Kumares; Walsh, Michael; Varma, Amiy. “Automotive Air Pollution Issues and Options for Developing Countries.” Working Paper 492. Washington, DC: World Bank, August 1990. F: Calvo, Christina Malmberg. “Case Study on the Role of Women in Rural Transport: Access of Women to Domestic Facilities.” SSATP Working Paper No. 11. Washington, DC: World Bank, 1994. G: Feifer, Chris Naschak. “Maternal Health in Jamaica: Health Needs, Services, and Utilization.” Working Paper 539. Washington, DC: World Bank, November 1990.
87

H: Davis, Tony; Lucas, Kimberly; Rikard, Ken. “Agricultural Transport Assistance Program: Impact Study.” Washington, DC: US Agency for International Development, January 1996. I: Booth, David; Hanmer, Lucia; Lovell, Elizabeth. “Poverty and Transport.” London: Overseas Development Institute. June 2000. J: Doumani, Fadi M. & Listorti, James A. “Environmental Health: Bridging the Gaps.” World Bank Discussion Paper 422. Washington, DC: World Bank, May 2001. K: Lovei, Magda. “Phasing Out Lead From Gasoline: Worldwide Policy Experience and Implications.” World Bank Technical Paper 397. Washington, D.C.: World Bank, January 1998. L: Ross, Fiona; Matzopoulos, Richard & Phillips, Rozett. The Role of Rural Electrification in Promoting Health in South Africa. EDRC Report Series. Cape Town: Energy & Development Research Center, 1997. M: Chin, Anthony T. “Containing Air Pollution and Traffic Congestion: Transport Policy and the Environment in Singapore.” Atmospheric Environment 30.5 (1996): 787-801. N: Nijkamp, Peter. “Improving Urban Environmental Quality: Socioeconomic Possibilities and Limits.” In Pernia, Ernesto M. ed. Urban Poverty in Asia: A Survey of Critical Issues. Hong Kong: Oxford University Press, 1994. O: van de Walle, Dominique & Cratty, Dorothyjean. “Impact Evaluation of a Rural Road Rehabilitation Project.” Washington, DC: World Bank, January, 2002. P: World Bank. “Project Appraisal Document on a Proposed Loan in the Amount of US$50 Million to the Republic of Peru for the Second Rural Roads Project.” Report No. 22110-PE. Washington, DC: World Bank, 2001.
88

Transport Impact on Poverty
Direct Impact on Well-Being
- Saving time & effort
Mobility and access are major factors in the daily lives of the poor. In many developing countries, the time spent in transit by the poorest occupies a large portion of the day, in both rural and urban situations. In cities, traveling to and from work can take several hours, often on foot, especially for the poor who tend to live in lower-income areas that border higher-income cities. In rural areas poor households spend large parts of the day collecting water and fuel and traveling to markets. Improving transport can save significant time and effort for users, allowing for more time and energy to be spent on other purposes.
Global Quantitative Evidence According to the UNHCS Global Indicators Database, of 16 developing cities
with populations of 4,000,000 or more, five (Bucharest, Jakarta, Kinshasa, Lagos and Manila) cited one-way commutes of 1.25 hours or more. Source: (B, p. 9)
Regional Quantitative Evidence Based on studies of 840 people in villages in Burkina Faso, Uganda and
Zambia conducted in 1993, the average rural African adult spends 1.25 hours on essential travel and transport a day, the bulk being spent on domestic (75%) and agricultural/market (24% purposes). Source: (C, p. 20)
Local Quantitative Evidence A study in Vietnam of 25 communes affected by rural roads projects and 103
communes not affected by rural roads projects showed that between 1997, when the project was first implemented, and 1999, time burdens decreased for those communes affected by the projects. 27.27% fewer communes affected by the rural roads projects reported that time to collect firewood had increased over the past two years, compared to an increase of 9.09% for communes not affected by the rural roads projects. On average, the amount of time it took to walk to the closest motorable road decreased by 3 minutes in communes affected by the project (3.8 minutes for the poorest 40% of the population in communes affected by the project), 9.8 minutes to the closest passenger transport (36.5 minutes), 0.4 minutes to the closest navigable waterway (138.5 minutes), and 14 minutes to the closest post office (42.9 minutes). Source: (G, p. 45-50) A study of two villages, one with poor transport access in Zambia and one
with good road access in Burkina Faso showed that residents in the town with poor road access spent more than twice the amount of time on transport that
89

those in the village with good access spend (695 hours per adult per annum v. 279 hours per adult per annum.) Source: (C, p. 21) After a rural roads project was carried out in the 12 departments of Peru
ranking highest in poverty rates, using post-project data over a representative sample of roads and tracks improved by the project, travel times on average decreased by 50%. Source: (H, p. 42)
- Improving safety
Traffic accidents are a frequent problem in many developing countries because of poorly designed roads. While not the most important factor in road safety, poor road design is a partial cause of many pedestrian and motorist deaths every year in addition to permanently disabling many more. These accidents tend to affect the poor more profoundly because as pedestrians they will often be in a particularly vulnerable position and because of their reduced access to health care. Beyond the health consequences of poor traffic safety, traffic accidents can hinder the ability of the poor to increase their economic security because of lost days of work and lowered productivity. While in some cases, improving transport services may increase traffic-related safety problems, evidence also suggests that improving the design of roads for better traffic safety can lead to a decrease in traffic-related problems.
Global Quantitative Evidence A number of surveys show that an increase in lane width from 2.7m to 3.4m
can be expected to reduce accident rates by 30%, while a similar increase in shoulder width can reduce rates by 20%. An increase in roadway width from 5 to 10 m can reduce accident rates by 36%, from 5m to 13m would reduce accident rates 44%. Installation of climbing lanes on rural two-lane roads will reduce accident rates by 25% on average. An increase in the cross-slope on horizontal road sections form 0 to 2.5% can reduce accident rates between 10 and 15%. Source: (E, p. 65-85) Based data from 1980 to 1995, more than 85% of all deaths and 90% of
disability adjusted life years lost from road traffic injuries occur in developing countries. Among children aged 0-4 and 5-14 years, the number of fatalities per 100,000 population was about six times greater than in high income countries in 1998. Source: (F, p. 1139)
Regional Quantitative Evidence In 1991 in Eastern/Central Europe (Romania, Slovakia, Czech Republic,
Poland, Bulgaria, Hungary), the cost of traffic accidents (according to estimates) to the regional economy was estimated to be US$2.85 billion, or 1.5% of GNP per year. Source: (D, p. 5)
Local Quantitative Evidence In Tanzania, as a result of raised zebras, bus bays, street realignment, defense
bollards and protecting sidewalks, traffic accidents in a project zone decreased 1000% after traffic safety modifications were constructed. Source: (A, p. 11)
90

Sources A: Calvo, C. Malmberg; Gannon, C.; Gwilliam, K.; Liu, Z. “Transport: Infrastructure & Services – Technical Notes.” PRSP Toolkit. Washington, DC: World Bank, May 2001. http://www.worldbank.org/poverty/strategies/chapters/transport/trtn0509.pdf B: World Bank Urban Transport Group. “Cities on the Move: A World Bank Urban Transport Strategy Review.” Washington, DC: World Bank, October 2001. C: Barwell, Ian. “Transport & The Village: Findings from African Village-Level Travel & Transport Surveys & Related Studies.” World Bank Discussion Paper 344. Washington, DC: World Bank, 1996. D: Gerondeau, Christian; Bouzigues, Jean-Baptiste; Ellinghaus, Dieter; Hobbs, Adrian; Lowe, Peter; Wall, John. “Road Safety in Central Europe: Bulgaria, Hungary, Poland, Romania, Czech Republic and Slovakia.” TWU-19. Washington, DC: World Bank, November 1993. E: Carlsson, Gunnar & Hedman, Karl-Olov. “A Systematic Approach to Road Safety in Developing Countries.” World Bank Technical paper INU-63. Washington, DC: World Bank, January 1990. F: Nantulya, Vinand M. & Reich, Michael R. “The neglected epidemic: road traffic injuries in developing countries.” British Medical Journal 324 (May 11, 2002): 1139. G: van de Walle, Dominique & Cratty, Dorothyjean. “Impact Evaluation of a Rural Road Rehabilitation Project.” Washington, DC: World Bank, January, 2002. H: Grootaert, Christiaan. “Socioeconomic Impact Assessment of Rural Roads: Methodology and Questionnaires.” Roads and Rural Transport TG and Transport Economics and Poverty TG. Washington, DC: World Bank, 2002.
91

Transport Impact on Poverty
Fiscal Impact (coupled with pro-poor policies)
- Improving fiscal balance
Without transportation infrastructure, businesses, and hence business tax bases, cannot expand. In the short-run, such infrastructure investments may have a negative impact on a government’s fiscal position because of the high initial costs of infrastructure and the need to budget for the recurrent cost of maintenance. Transport services can be improved in the short run to better cover recurrent infrastructure costs and expanded to meet increased demand in the long run, so as to increase fiscal returns by widening the tax base, giving more financial resources to the government to spend on education, health, and other programs to benefit the poor.
Local Quantitative Evidence In Morocco, a study conducted in 1985 and a follow-up survey conducted in
1995 after a rural roads project rehabilitated old roads and built new roads showed that after a rural roads project, tax revenues in the project zone increased from Dh 1,500 to Dh 10,000 in ten years. Source: (A, p. 28)
Sources A: “Socioeconomic Impact of Rural Roads: Impact Evaluation Report for the Fourth Highway Project in Morocco.” OED Report 15808-MOR. Washington, DC: World Bank, June 1996.
92

Transport Impact on Poverty
Sources African Development Bank. African Development Report 1999. Abidjan: African Development Bank, 1999. Ahmed, Raisuddin & Hossain, Mahabub. “Developmental Impact of Rural Infrastructure in Bangladesh.” Research Report 83. Washington, DC: International Food Policy Research Institute in collaboration with the Bangladesh Institute of Development Studies, October 1990. Anangyo, Gordon J. “The Northern Tier Countries of the Greater Horn of Africa: Comparative Costs of Transport.” Technical Paper No. 60. Washington, DC: USAID, July 1997. Asian Development Bank. “Assessing The Impact Of Transport And Energy Infrastructure On Poverty Reduction.” Manila: Asian Development Bank, September 2001. Baliscalan, Aresenio M. “Pathways of Poverty Reduction: Rural Development and Transmission Mechanisms in the Philippines.” Asia and Pacific Forum on Poverty. Manila: Asian Development Bank, 5-9 February, 2001. Barwell, I; Edmonds, G.A.; Howe, J.D.G.F.; de Veen, J. Rural Transport in Developing Countries. London: Intermediate Technology Publications, 1985. Barwell, Ian. “Transport & The Village: Findings from African Village-Level Travel & Transport Surveys & Related Studies.” World Bank Discussion Paper 344. Washington, DC: World Bank, 1996. Binswanger, Hans; Yang, Maw-Cheng; Bowers, Alan; Mundlak, Yair. “On the Determinants of Cross-Country Aggregate Agricultural Supply.” Journal of Econometrics 36 (1987): 111-131. Booth, David; Hanmer, Lucia; Lovell, Elizabeth. “Poverty and Transport.” London: Overseas Development Institute. June 2000. Bray, Mark. “Counting the Full Cost: Parent and Community Financing of Education in East Asia.” Washington, DC: World Bank, November 1996. Calvo, Christina Malmberg. “Case Study on the Role of Women in Rural Transport: Access of Women to Domestic Facilities.” SSATP Working Paper No. 11. Washington, DC: World Bank, 1994.
93

Calvo, C. Malmberg; Gannon, C.; Gwilliam, K.; Liu, Z. “Transport: Infrastructure & Services.” PRSP Toolkit. Washington, DC: World Bank, May 2001. http://www.worldbank.org/poverty/strategies/chapters/transport/tran0509.pdf Calvo, C. Malmberg; Gannon, C.; Gwilliam, K.; Liu, Z. “Transport: Infrastructure & Services – Technical Notes.” PRSP Toolkit. Washington, DC: World Bank, May 2001. http://www.worldbank.org/poverty/strategies/chapters/transport/trtn0509.pdf Canagarajah, Sudharshan & Nielsen, Helena Sykt. “Child Labor and Schooling in Africa: A Comparative Study.” SP Discussion Paper 9916. Washington, DC: World Bank, July 1999. Carlsson, Gunnar & Hedman, Karl-Olov. “A Systematic Approach to Road Safety in Developing Countries.” World Bank Technical paper INU-63. Washington, DC: World Bank, January 1990. Chin, Anthony T. “Containing Air Pollution and Traffic Congestion: Transport Policy and the Environment in Singapore.” Atmospheric Environment 30.5 (1996): 787-801. Clark, Ximena; Dollar, David; Micco, Alejandro. “Maritime Transport Costs and Port Efficiency.” Policy Research Working Paper 2781. Washington, DC: World Bank, February 2002. Connerly, Ed. & Schroeder, Larry. "Rural Transport Planning: Approach Paper.” SSATP Working Paper 19. Washington, DC: World Bank, October 1996. Corral, Leonardo. “Rural Non-farm Incomes in Nicaragua.” World Development 29 no. 3 (2001): 427-442. Creightney, Cavelle D. “Transport and Economic Performance: A Survey of Developing Countries.” World Bank Technical Paper Number 232. Washington, DC: World Bank, November 1993. Croppenstedt, Andre & Demeke, Mulat. “Determinants of Adoption and Levels of Demand for Fertiliser for Cereal Growing Farmers in Ethiopia.” Working Paper 96-3. Oxford: Center for the Study of African Economies, March 1996. Davis, Tony; Lucas, Kimberly; Rikard, Ken. “Agricultural Transport Assistance Program: Impact Study.” Washington, DC: USAID, January 1996. de Castro, Carlos F. “Trade and Transport Facilitation: A Review of Current Issues and Operational Experience.” SSATP Working Paper 27. Washington, DC: World Bank, June 1996. De Soto, Hermine; Gordon, Peter; Gedeshi, Ilir; Sinoimeri, Zamira. “A Qualitative Assessment of Poverty in 10 Areas of Albania.” Washington, DC: World Bank, 2001.
94

Doumani, Fadi M. & Listorti, James A. “Environmental Health : Bridging the Gaps.” World Bank Discussion Paper 422. Washington, DC: World Bank, May 2001.
Ellis, Simon & Hine, John. “The Provision of Rural Transport Services: Approach Paper.” SSATP Working Paper No. 37. Washington, DC: World Bank, April 1998. Faiz, Asif; Sinha, Kumares; Walsh, Michael; Varma, Amiy. “Automotive Air Pollution Issues and Options for Developing Countries.” Working Paper 492. Washington, DC: World Bank, August 1990. Fan, Shenngen, Hazell, Peter & Haque, T. “Targeting public investments by agro-ecological zone to achieve growth and poverty alleviation goals in rural India.” Food Policy 25 (2000): 411-428. Fan, Shenggen; Hazell, Peter; Thorat, Sukhadeo. “Government Spending, Growth And Poverty: An Analysis Of Interlinkages In Rural India.” EPTD Discussion Paper 33. Washington, DC: International Food Policy Research Institute, March 1998. Feifer, Chris Naschak. “Maternal Health in Jamaica: Health Needs, Services, and Utilization.” Working Paper 539. Washington, DC: World Bank, November 1990. Gannon, Collin & Liu, Zhu. “Poverty & Transport.” TWU-30. Washington, DC: World Bank, September 1997. Gautam, Surhid & Queiroz, Cesar. “Road Infrastructure and Economic Development: Some Diagnostic Indicators.” Working Paper 921. Washington, DC: World Bank, June 1992. Gavirira, Juan. “Port Privatization and Competition in Colombia.” Viewpoint Note 167 (December 1998). Washington, DC: World Bank, December 1998. Gerondeau, Christian; Bouzigues, Jean-Baptiste; Ellinghaus, Dieter; Hobbs, Adrian; Lowe, Peter; Wall, John. “Road Safety in Central Europe: Bulgaria, Hungary, Poland, Romania, Czech Republic and Slovakia.” TWU-19. Washington, DC: World Bank, November 1993. Gertler, Paul & Glewwe, Paul. “The Willingness to Pay for Education in Developing Countries: Evidence from Rural Peru.” Journal of Public Economics 42 (1990): 251-275. Goldstein, Ellen. “The Impact of Rural Infrastructure on Rural Poverty: Lessons for South Asia.” Internal Discussion Paper 131. Washington, DC: World Bank, June 1993. Grootaert, Christiaan. “Socioeconomic Impact Assessment of Rural Roads: Methodology and Questionnaires.” Roads and Rural Transport TG and Transport Economics and Poverty TG. Washington, DC: World Bank, 2002.
95
Gyamfi, Peter and Ruan, Guillermo. “Road Maintenance by Contract: Dissemination of Good Practice in Latin America and the Caribbean Region.” Latin America and the Caribbean Regional Studies Program Report 44. Washington, DC: World Bank, 1996. Howe, John. “The Impact of Rural Roads on Poverty Alleviation: A Review of the Literature.” In Howe, John & Richards, Peter. Rural Roads and Poverty Alleviation. London: Intermediate Technology Publications, 1984. Jacoby, Hanan. “Access to Markets and the Benefits of Rural Roads.” Working Paper 2028. Washington, DC: World Bank, December 1998. Khandker, Shahidur R.; Lavy, Victor & Filmer, Deon. “Schooling and Cognitive Achievements of Children in Morocco.” World Bank Discussion Paper No. 264. Washington, DC: World Bank, 1994. Lanjouw, Peter; Quizon, Jamie; Sparrow, Robert. “Non-agricultural earnings in peri-urban areas of Tanzania: evidence from household survey data.” Food Policy 26 (2001): 385-403. Lavy, Victor. “School Supply Constraints and Children’s Educational Outcomes in Rural Ghana.” Journal of Development Economics 51 (1996): 291-314. Lebo, Jerry & Schilling, Dieter. “Design and Appraisal of Rural Transport Infrastructure: Ensuring Basic Access for Rural Communities.” World Bank Technical Paper 496. Washington, DC: World Bank, 2001. Limao, Nuna & Venables, Anthony. “Infrastructure, Geographical Disadvantage & Transportation Costs.” Policy Research Working Paper 2257. Washington, DC: World Bank, December 1999. Lovei, Magda. “Eliminating A Silent Threat: World Bank Support for the Phaseout of Lead from Gasoline.” Environmental Department Working Paper. Washington, D.C.: World Bank, 1999. Lovei, Magda. “Phasing Out Lead From Gasoline: Worldwide Policy Experience and Implications.” World Bank Technical Paper 397. Washington, D.C.: World Bank, January 1998. Midgley, Peter. “Urban Transport in Asia: An Operational Agenda for the 1990s.” World Bank Technical Paper 224. Washington, DC: World Bank, March 1994. Minten, Bart. “Infrastructure, Market Access, And Agricultural Prices: Evidence From Madagascar.” MSSD Discussion Paper 26. Washington, DC: International Food Policy Research Institute, March 1999.
96

Minten, Bart; Kyle, Steven. “The effect of distance and road quality on food collection, marketing margins, and traders wages: evidence from the former Zaire.” Journal of Development Economics 60 (1999): 467-495. Nantulya, Vinand M. & Reich, Michael R. “The neglected epidemic: road traffic injuries in developing countries.” British Medical Journal 324 (May 11, 2002): 1139. Nielsen, Helena Sykt. “Child Labor and School Attendance: Two Joint Decisions.” Working Paper 98-15. Aarhus, Denmark: Centre for Labor Market and Social Research, October 1998. Nijkamp, Peter. “Improving Urban Environmental Quality: Socioeconomic Possibilities and Limits.” In Pernia, Ernesto M. ed. Urban Poverty in Asia: A Survey of Critical Issues. Hong Kong: Oxford University Press, 1994. Pedersen, Poul Ove. “The Changing Structure of Transport under Trade Liberalisation and Globalization and its Impact on African Development.” CDR Working Paper 00-1. January 2000. Copenhagen: Centre for Development Research, 2000. Pouliquen, Louis. “Infrastructure and Poverty.” Unknown: 2000. Riverson, John; Gaviria, Juan and Thriscutt, Sydney. “Rural Roads in Sub-Saharan Africa: Lessons from World Bank Experience.” World Bank Technical Paper 141. Washington, DC: World Bank, July 1991. Rogers, Halsey. “The Role and Effectiveness of Development Assistance: Lessons from World Bank Experience.” Washington, DC: World Bank, March 2002. Ross, Fiona; Matzopoulos, Richard & Phillips, Rozett. The Role of Rural Electrification in Promoting Health in South Africa. EDRC Report Series. Cape Town: Energy & Development Research Center, 1997. Spencer, Dunstan. “Infrastructure And Technology Constraints To Agricultural Development In The Humid And Subhumid Tropics Of Africa.” EPTD Discussion Paper 3. Washington, DC: International Food Policy Research Institute, 1994. USAID. “Food and Agriculture in Bangladesh: A Success Story.” Dhaka: USAID Bangladesh, June 2001. http://www.usaid.gov/bd/files/food_success.pdf. USAID/Philippines Provincial Development and Republic of the Philippines - Department of Local Government and Community Development. “Rural Roads Evaluation Report.” Washington, DC: USAID, 1978. Triche, Thelma. “Road Policy Reform in Sub-Saharan Africa: 1991-1995.” SSATP Working Paper 25. Washington, DC: World Bank, January 1996.
97

van de Walle, Dominique & Cratty, Dorothyjean. “Impact Evaluation of a Rural Road Rehabilitation Project.” Washington, DC: World Bank, January, 2002. Wood, Adrian & Mayer, Jorg. “Africa’s export structure in a comparative perspective.” Cambridge Journal of Economics 25 (2001): 369-394. World Bank. “Can Africa Claim the Twenty-First Century?” Washington, DC: World Bank, April 2000. World Bank Urban Transport Group. “Cities on the Move: A World Bank Urban Transport Strategy Review.” Washington, DC: World Bank, October 2001. World Bank. “Ghana: Building a Stronger Transportation System.” Precis 189 (Spring, 2000). Washington, DC: World Bank, 2000. World Bank. “Impact Evaluation Report: Feeder Roads in Bahia.” OED Report 16738. Washington, DC: World Bank, June 1997. World Bank. “Panama: Poverty Assessment and Strategies for Poverty Reduction.” Human Development Department. Report No. 18801-PAN. Washington, DC: World Bank, June 1999. World Bank. “Project Appraisal Document: Bhutan Rural Access Project.” Report No: 19795-BHU. Washington, DC: World Bank, November, 1999. World Bank. “Project Appraisal Document on a Proposed Loan in the Amount of US$50 Million to the Republic of Peru for the Second Rural Roads Project.” Report No. 22110-PE. Washington, DC: World Bank, 2001. World Bank. “Republic of Ukraine Transport Sector Review.” Report 18636. Washington, DC: World Bank, 1998. World Bank. “Socioeconomic Impact of Rural Roads: Impact Evaluation Report for the Fourth Highway Project in Morocco.” OED Report 15808-MOR. Washington, DC: World Bank, June 1996. World Bank. “Vietnam Moving Forward: Achievements And Challenges In The Transport Sector.” Washington, DC: World Bank, April 1999. World Bank. World Development Report 1994. London: Oxford University Press, 1994.
98

Water & Sanitation Impacts on Poverty
Underpinning Growth - Increasing productivity of businesses
Many countries experience slow economic growth as a result of inadequate infrastructure. Potable water and sanitation services are important parts of infrastructure that many of these countries lack. Inadequate water supplies can directly hinder the establishment and development of businesses. In addition, many companies simply will not invest in areas where there is a lack of clean drinking water or poor/non-existent sanitation services because of the poor health and education levels with which they are associated. Providing clean drinking water and adequate sanitation services can help increase aggregate economic growth, which translates into greater employment and higher wages for the poor.
Regional Quantitative Evidence In Africa, the cost of lost labor because of the time spent gathering water was
estimated at US$2 billion per year for 40 billion hours. Source: (C, p. 1) Local Quantitative Evidence A study conducted by WSP in 1997 showed that in Melang, Indonesia, the
cost to the economy due to typhoid and other diseases caused by lack of adequate sanitation is estimated at US$4.7 billion per year, or US$12 per month per household. Source: (A, p. 21) Based on the September, 1998 EPHPM survey in Honduras, extreme poverty
(as measured by the squared poverty gap) would be reduced by 3.35% by providing universal access to in-home water connection, and by 5.16% by providing universal access to piped sanitation services, not accounting for any indirect benefits from access to water. Source: (B, p. 41)
Sources A: Bosch, Christopher; Hommann, Kristen; Rubio, Gloria M.; Sadoff, Claudia; Travers, Lee. “PRSP Toolkits – Water, Sanitation & Poverty – Technical Notes.” Washington, DC: World Bank, April 2001. http://www.worldbank.org/poverty/strategies/chapters/water/wattn509.pdf B: World Bank. “Honduras Poverty Assessment 2000.” Report 20531-HO. Washington, DC: World Bank, June 2001. C: Ling, Jack C.S. & Reader-Wilstein, Cynthia. “Water – A vital wellspring for human development.” Amsterdam, Netherlands: International Water and Sanitation Center, 1993. http://www.irc.nl/themes/communication/vital.html
99

Water & Sanitation Impacts on Poverty
Increasing Economic Opportunities Specifically Targeted to the Poor
- Saving time and efforts, hence, increasing productivity
Because many of the poor lack nearby access to potable water sources, they must spend significant amounts of time collecting water, reducing the amount of time that could be spent on economically productive activities. Providing access to potable water which can reduce the amount of time otherwise spent collecting water may allow households to spent greater amounts of time on economically productive activity.
Local Quantitative Evidence Based on the September, 1998 EPHPM survey in Honduras, families in the
lowest income quintile that did not have access to water in the house could expect to see a 7.32% increase in income if they had access, and a 11% increase in income if they had a piped sanitary connection to the house (the methodology uses the expected increase in rent as a proxy for the income benefits access to infrastructure would convey). Source: (B, p. 40) Based on a study of 380 households from 20 communities In Sri Lanka, the
savings as a result of not having to collect water due to a World-Bank funded Community Water and Sanitation Project were equal to hours that, if applied to labor, would produce a 20% increase in family income, assuming a 40 hour week, 64 minutes per day saved on average, and a wage rate for unskilled agricultural labor of Rs8.4/hour . Source: (D, p. 25) Based on a study of 1,861 people in rural Nicaragua in 1998, access to a clean
water was strongly and positively correlated with total income (coeff = 0.298), and was especially correlated with non-farm self-employment. Non-farm self-employment incomes for people with access to clean water were over 3 times those of people without access to a paved road. Source: (E, p. 440)
- Improving health, hence, increasing productivity
Because of poor sanitation services and the fact that much of the water consumed by the poor is unclean, many of the poor suffer from a greater incidence of illness. These illnesses often cause high levels of absenteeism from work, which the leads to lost wages. Helping to ensure that the poor have access to clean water sources and adequate sanitation services can help reduce the incidence of waterborne illness, reducing absenteeism from work and thus increasing incomes.
Local Quantitative Evidence In Morocco, the costs over twenty-five years due to water-related diarrhea
morbidity were US$13 million, composed of the costs of treatment plus lost wages calculated at the minimum wage for patients between 25 and 59. Mortality from diarrhea was estimated to cost US$67 million between 1995
100

and 2020, accounting for per-capita GDP for 40 years for people under 25 and 25 years for people over 25, assuming to grow 1.4% annually and discounted 5% Using similar calculations, typhoid would cost Morocco approximately US$2.9 million between 1995 and 2020. Source: (A, p. 10-15)
- Increasing productivity of businesses which employ the poor
Many businesses that employ the poor depend on water for production of goods. A lot of enterprises, especially those that deal with food processing, need to have a clean and a consistent water supply to maintain the quality of their products. Other enterprises will not locate or expand in areas without adequate sources of water because of the decreased productivity due to waterborne illness and other efficiency losses related to inadequate supplies of water. Providing connections to water supplies that are both sanitary and consistent can help make it easier to establish businesses and maintain the productivity of those businesses.
Local Quantitative Evidence In Sub-Saharan Africa, a study of the effects of increased and improved water
supply on Wobuzeni, Uganda found that a typical small firm that consumed four jerricans of water per day, and switched from water vendors to kiosks as their source of water would see profits increase by 24% as a result of cheaper water supplies. In addition, 20% of firms reported increased sales of goods because of improved water supplies, and 12% reported increased demand for products. Source: (C, p. 31)
Sources A: Sadoff, Claudia. “The Price of Dirty Water: Pollution Costs in the Sebou Basin.” Environmental Economics Paper Series No. 38. Washington, DC: World Bank, June 1996. B: World Bank. “Honduras Poverty Assessment 2000.” Report 20531-HO. Washington, DC: World Bank, June 2001. C: Davis, Jennifer; Kang, Alice; Vincent, Jeffrey; Whittington, Dale. “The Value of Improved Water Supply to Microenterprises in sub-Saharan Africa.” Consulting Assistance on Economic Reform II (CAER II) Discussion Paper 49. Cambridge: Harvard University Center for International Development, October 1999. D: World Bank. “Sri Lanka Impact Evaluation Report: Community Water Supply and Sanitation Report.” OED Report No. 18113. Washington, DC: World Bank, June 1998. E: Corral, Leonardo. “Rural Non-farm Incomes in Nicaragua.” World Development 29 no. 3 (2001): 427-442.
101

Water & Sanitation Impacts on Poverty
Direct Savings
- Lowering costs of water
In many cities, poor households are forced to choose between unsafe and distant sources of water or purchasing water from local vendors. The cost of water purchased from vendors often exceeds the cost of water provided through a household or community connection. Not only is the water purchased from vendors expensive, but it is frequently of poor quality, requiring it to be boiled using expensive fuel resources. These charges significantly increase the amount of money that the poor must use to sustain themselves. Improving the access of the poor to clean sources of water can save many households money that they would otherwise have to spend on vended water or fuel for boiling water.
Global Quantitative Evidence In cities of low income countries, the high cost of purchasing water from
water vendors often falls disproportionately on the poor because their living situations prohibit them from accessing in-house water connections or standpipes provided by water companies. In Abdijan, the cost of water from water vendors is 5 times the prices of that charged by the public utility, 12 to 25 times that of the utility in Dhaka, 10 times the price in Istanbul, 4 to 9 times the price in Kampala, 28 to 83 times the price in Karachi, 4 to 10 times the price in Lagos, 17 times the price in Lima, 7 to 10 times the price in Lome, 7 to 11 times the price in Nairobi, 17 to 100 times the price in Port-au-Prince, 20 to 60 times the price in Surabaya, and 16 to 34 times the price in Tegucigalpa. Source: (G, p. 21)
Local Quantitative Evidence “In Port-au-Prince Haiti, households with private water connections were
found to pay $1.00 per cubic meter, while those lacking connections and forced to rely on private vendors were paying anywhere between $5.50 and $16.50 per cubic meter (World Water Council, 2000).” Source: (A, p. 2) In Jakarta, Indonesia, the cost for residents without adequate water supplies to
boil water for the entire city is equal to 1.1% of the city’s GDP in 1987 dollars. Boiling water for the average household costs about Rp33 per day, based on the cost of boiling 4.4L of water (the average family consumption) by using kerosene fuel (the most common fuel) for approximately 15-20 minutes. Source: (B, p. 9) In Paraguay, families affected by a piped-water system funded by the World
Bank (Paraguay Rural Water I) reported an 8% savings in family income as a result of not having to purchase bottled water from vendors. Source: (D, p. 15)
102

Based on micro-level research conducted in 1991, in Istanbul, the poor population spends 5% of its income annually to supplement water supplies due to an inadequate and unreliable piped water system. Source: (F, p. 30) The average woman in rural Kenya needs to spend US$11.36 per year to buy
food to compensate for the calories they utilize to collect water. This figure was derived by calculating the cost of supplying 240 calories per day using maize, using a 1999 figure of $0.46 per kG of maize, which provides an average of 3500 calories per kg. Source: (C, p. 26) In Albania, 85% of people without access to piped water say that bottled water
is too expensive to use. Source: (H, p. 50) In Greater Baku, Azerbaijan, those who earn less than 25,000 manat per
month spend 7.1% of their incomes on measures to cope with the poor quality of drinking water, compared with just 2.1% of those whose incomes are greater than 100,000 manat. Source: (I, p. 6) The total cost of coping with poor water supplies in Baku, Azerbaijan is
estimated to range from 1,125 manat per month in the Western periphery of the city to 2,616 manat per month in the Eastern periphery of the city. This represents, on average, 7.1% of the income of the lowest income group Source: (J, p. 23, 36) The average opportunity cost (foregone income) for collecting water due to
inadequate water supplies in Baku, Azerbaijan is 16% of monthly income for the lowest income group in the population. Source: (J, p. 35) According to a study of independent water providers in the capital cities of
Benin, Guinea, Mali, Kenya, Cote d’Ivoire, Uganda, Mauritania, Burkina Faso, Senegal, and Tanzania, the cost of getting water delivered door-to-door is about $2 to $6 per cubic meter, about four times as much as water from a standpipe, $0.60 to $1.50 per cubic meter, and six times as much as water from a home tap, which costs $0.30 to $1.00. Source: (K, p. 32) A survey of 600 urban households with in-house connections in Delhi showed
that the average cost of water supply unreliability was Rs2,182, composed of the costs of coping strategies, opportunity costs, and the costs of water borne diseases. For households earning less than Rs1,250 per year, the costs of unreliable water are equal to 15.7% of their income, compared to 5.5% for the next highest income group. Source: (L, p. 129-131)
- Reducing medical expenditures
One of the major causes of health problems in many countries is waterborne disease, and for children, one of the largest causes of death is diarrhea. Waterborne disease and, in particular, diarrhoeal incidence can be linked to poor sanitation services. As a result, many poor people must spend significant resources on medical care for the illnesses that can result from the unhygienic practices associated with poor sanitation services. Providing better access to sanitation services can help reduce the incidence of waterborne disease and children’s diarrhea, directly reducing the expenditures that families must make on costly medical care.
103
Local Quantitative Evidence In Karachi, people living in areas without adequate sanitation and/or hygiene
education spend six times more on medical treatments than do people who have such services. Source: (E, p. 6)
Sources A: United Nations. “Third United Nations Conference on the Least Developed Countries, LDCIII Infrastructure Development Session.” Brussels: United Nations, May 2001. B: Bhatia, Ramesh & Falkenmark, Malin. “Water Resource Policies and the Urban Poor: Innovative Approaches and Policy Imperatives.” Water and Sanitation Current Series. Washington, DC: World Bank, 1993. C: Rosen, Sydney & Vincent, Jeffrey R. “Household Water Resources and Rural Productivity in sub-Saharan Africa: A Review of the Evidence.” Cambridge: Harvard Institute for International Development, July 1999. D: World Bank. “Rural Water Projects: Lessons from OED Evaluations.” OED Report 21096. Washington, DC: World Bank, August 2000. E: UNICEF. “Sanitation for All – Promoting Dignity and Human Rights.” New York: UNICEF, January 2001. F: World Bank. “World Development Report 1994.” World Bank. “World Development Report 1994.” London: Oxford University Press, 1994. G: Vanderschueren, Franz; Wegelin, Emiel & Wekwete, Kadmiel. “Policy Programme Options for Urban Poverty Reduction.” Urban Management Programme Policy Paper 20. Washington, DC: World Bank, September 1996. H: De Soto, Hermine; Gordon, Peter; Gedeshi, Ilir; Sinoimeri, Zamira. “A Qualitative Assessment of Poverty in 10 Areas of Albania.” Washington, DC: World Bank, 2001. I: World Bank. “Azerbaijan Water Supply and Sanitation Sector Review and Strategy.” Report No. 20711. Washington, DC: World Bank, 2000. J: World Bank. “Azerbaijan: Baku Water Supply Project.” Social Assessment Series no. 17. Washington, DC: World Bank, 1995. K: Collignon, Bernard & Vezina, Marc. “Independent Water and Sanitation Providers in African Cities.” Washington, DC: Water and Sanitation Program, April, 2000. L: Zerah, Marie-Helene. Water: Unreliable Supply in Delhi. New Delhi: Monhar for Centre de Sciences Humaines, 2000.
104

Water & Sanitation Impacts on Poverty
Improving Education
- Improving access to education because of reduction of time spent fetching water Because many of the poor lack nearby access to potable water sources, they must spend significant amounts of time collecting water. Frequently, this chore is assigned to children, usually girls. Even collecting the minimal quantity of water to support a family every day can take up large amounts of time. Because of the time and effort they spend collecting water, many children of poor families, particularly girls, do not have adequate time to attend school. Connecting towns or homes to clean sources of potable water that reduce or eliminate the time that children spend collecting water often allows more children of poor families to attend school.
Regional Quantitative Evidence A study showed that in Africa, access to piped water increased school
attendance between 2 and 16%. Specifically, in Burkina Faso the increase was 7%; in Djibouti, 9%; in Ethiopia, 8%; I Ghana, 6%; in Guinea, 16%; in Cote d’Ivoire, 13%; in Kenya, 2%; in Madagascar, 13%; in Niger, 6%; in Mauritania, 10%; in South Africa, 4%; in Senegal, 16%; in Tanzania, 7%, in Uganda, 6%. Source: (A, p. 30)
Local Quantitative Evidence Based on data from a rural Indian household survey conducted between 1968
and 1971 from 4000 households across the country matched with 1971 district level Indian census data on health and family planning programs and infrastructure , researchers determined that getting water from a river led to a decrease in the “School attendance index” (a household-specific index of the school attendance of children in the household aged 5 and over which standardizes for the age distribution of the children given fixed age patterns of attendance based on mean population age trajectories) by 4.09, while households that got water from a tap saw an increase in the school attendance index of 7.33. By doubling the number of families with access to a water tap and a well, the school attendance index would rise 20%. Source: (B, p. 221-222) Lessons learned from a DPHE-UNICEF study in 1994 and 1998 in
Bangladesh showed that provision of water and sanitation facilities in schools increased girls’ attendance by 15%. Source: (C)
- Improving educational performance due to reduction of water-related diseases
Many children of poor families in developing countries who lack access to adequate sources of clean water and sanitation service become infected with harmful parasites that are transmitted by unclean water or by fecal matter. These parasites often make children perform worse in school because of decreased energy, discomfort, and pain
105

caused by the parasites. In more severe cases, the parasites cause children to miss entire days of school, hampering their educational progress. Helping to ensure that children have access to clean water and adequate sanitation services can prevent parasitic infections that are linked to poor performance in school and absenteeism.
Local Quantitative Evidence A study of 10 schools composing 680 children not being treated for intestinal
parasites that were surveyed 3 times in a fifteen month interval in Tanzania showed that a 1% reduction the presence of the Schistomiasis worm, a parasite acquired from unclean water, would lead to a 1.3% increase in scores on pegboard dominant tests (a cognitive test), a 10% increase in sentence reading, and a 4.1% increase on arithmetic tests, when controlling for socioeconomic status and anthropometric variables. Source: (D, p. 25-29) In Nigeria, it was estimated that Guinea Worm, a parasitic infection caused by
poor quality of drinking water, was responsible for 60% of all school absenteeism. Source: (E, p. 145)
Sources A: Blackden, Mark & Bhanu, Chitra. “Gender, Growth, and Poverty Reduction in Sub-Saharan Africa SPA Status Report” World Bank Technical Paper 428. Washington, DC: World Bank, March 1999. B: Rosensweig, Mark & Wolpin, Kenneth. “Government Interventions and Household Behavior in a Developing Country.” Journal of Development Economics 10 (1982): 209-225. C: World Bank. “Core Intervention 2: Provision of Safe Water and Sanitation.” School Health at a Glance. Washington, DC: World Bank, undated. http://wbln0018.worldbank.org/hdnet/hddocs.nsf/c840b59b6982d2498525670c004def60/489122cbc270b63185256a4e00697986?OpenDocument D: Bhargava, Alok; Bundy, Donald A.P.; Jukes, Matthew; and Sachs, Jeffrey D. “Modeling the Effects of Health Status and the Educational Infrastructure on the Cognitive Development of Tanzanian School Children.” CMH Working Paper WG1-2. Cambridge, MA: Harvard University Center for International Development, March 2001 E: Doumani, Fadi M. & Listorti, James A. “Environmental Health : Bridging the Gaps.” World Bank Discussion Paper 422. Washington, DC: World Bank, May, 2001.
106

Water & Sanitation Impacts on Poverty
Supporting Effective Governance
- Empowering women
The burden of collecting water is particularly heavy on women. Because poor women are frequently tasked with water collection for their households, they often must spend large amounts of time performing this arduous task. As a result, many women in poor communities lack the time to engage in economically productive activities, or even to become involved in social activities. Without their own income or time to engage in social activities, many women lack the economic and social resources to become empowered in their communities. Although providing water connections to households does not guarantee gender equality, it can free large amounts of time for women, allowing them to participate economically and socially in society.
Regional Quantitative Evidence In sub-Saharan Africa, in 4 out of 6 countries surveyed, women saved over
one hour per day after they began using a new and improved water source in their villages. One of the other two villages saved between 17 and 86 minutes per day. Source: (A, p. 32)
Local Quantitative Evidence In Rural Pakistan, women saved 1.5 hours/day with access to an improved
water system. Source: (B, p. 49) Based on a survey of 550 households in 12 slums in Andhra and Madya
Pradesh, India, 68% of residents reported a time saving as a result of improvements in water supplies, with 56% reporting a decline in the burden of collection for women, and 46% reported an improvement in the quantity and quality of water supply. Source: (C, p. 107)
Sources A: Calvo, Christina Malmberg. “Case Study on the Role of Women in Rural Transport: Access of Women to Domestic Facilities.” SSATP Working Paper No. 11. Washington, DC: World Bank 1994. B: World Bank. “World Development Report 1994.” London: Oxford University Press, 1994. C: Amis, Philip. “Rethinking UK aid in urban India: reflections on an impact assessment study of slum improvement projects.” Environment & Urbanization 13.1 (April, 2001): 101-113.
107
Water & Sanitation Impacts on Poverty
Improving Health - Improving hygiene & health
In many developing countries, the poor lack access to adequate sources of clean water or sanitation services. In urban areas, water and sanitation systems often do not reach the areas where the poor live, whereas many rural areas lack clean water and sanitation altogether. As a result, many poor people must get their water from untreated and unclean sources, such as rivers or lakes and participate in unhygienic sanitation practices. Consumption of such unclean water and unhygienic sanitation causes a wide variety of illnesses, ranging from parasitic worms to giardia and other intestinal diseases that can cause diarrhea. These diseases are particularly dangerous for children and are responsible for a large percentage of child mortality in developing countries. Providing better access to a clean and safe water source and improving sanitation services can help reduce the incidence of waterborne disease and children’s diarrhea, directly increasing standards of health and decreasing child mortality.
Global Quantitative Evidence According to Esrey, a survey of 49 studies on diarrhoeal morbidity showed an
average 22% reduction, with the 19 most rigorous of those studies showing a 26% reduction as a result of improved water and sanitation. Eleven studies showed an average 29% reduction in ascariasis, with the four most rigorous also showing a 29% reduction due to improved water and sanitation services. Three studies on diarrhoeal mortality showed an average 65% reduction due to improved water and sanitation, with the two most rigorous showing an average 78% reduction. Nine studies on hookworm showed that improved water and sanitation would result in a 4% reduction, with the most rigorous study reporting the same. Four studies conducted on the effects of water on schistosomiasis showed an average 73% reduction, with the three most rigorous showing a 77% reduction with improvements in water and sanitation. Thirteen studies on trachoma revealed an average 50% reduction as a result of improved water and sanitation, with the seven most rigorous showing a 27% reduction. Studies on child mortality and water and sanitation showed a 60% reduction, with the six most rigorous showing a 55% reduction as a result of improvements in water and sanitation. Source: (L, p. 611) Clean water and good sanitation is considered a pre-requisite for achieving a
25% reduction in diarrhea. In South America, bringing water and sanitation coverage to 100% would decrease child (under five) mortality due to diarrhea by 22%; in South Asia, it would decrease by 21%, and in West Africa, 21%. Source: (I, p. 163-178) At any one given time, 50% of the urban population in developing countries is
suffering from one or more of the main diseases associated with inadequate provision of water and sanitation services. Improved water and sanitation
108
could bring about an 80-100% reduction in morbidity from cholera, typhoid, leptospirosis and scabies, 60-70% in trachoma, conjunctivitis, yaws and schistosomiasis and 40-50% in tularaemeia, paratyphoid, bacillary dysentery, amoebic dysentery, gastro-enteritis, lice-borne diseases, diarrhoeal diseases, ascariasis and skin infections. Source: (K, p. 7) According to estimates made in 1996, approximately 96,392 DALYs in the
world in 1990 were attributable to poor water supply, or 6.8% of all DALYs. In addition, 2,668,200 deaths were attributable to poor water supply and sanitation, or 5.3% of total deaths and 85,520,000 years of life were lost, or 9.4 of all YLLs. Regionally, 101,000 DALYs and 1,100 deaths in established market economies, 128,000 DALYs and 2400 deaths in the Former Soviet Union and Eastern Europe, 27,463,000 DALYs and 839,900 deaths in India, 4,231,000 DALYs and 81,400 deaths in China, 13,192,000 DALYs and 354,300 deaths in the rest of Asia and the Pacific Islands, 29,870,000 DALYs and 875,600 deaths in sub-Saharan Africa, 5,183,000 DALYs and 135,300 deaths in Latin America and the Caribbean, and 13,224,000 and 378,200 deaths in the “middle eastern crescent” were attributable to poor water supply, sanitation, and personal and domestic hygiene in 1990. Source: (N, p. 312) Water and sanitation problems are responsible for 6.7% of deaths and 7.6% of
DALYs in least developed countries. Source: (F) Implementing a secondary sewage treatment process would be effective at
removing 50-90% of the cysts that cause giardia. Likewise, a properly constructed sewage treatment pond would be effective at removing 100% of the cysts that cause giardia. Source: (H, p. 321) According to Varley, et al, the cost of adding just hardware (infrastructure) to
avert one case of childhood diarrhea is US$168.81; to avert one death, the cost is US$39,270. However, when combined with software, the costs decrease to US$60.58 and US$14,253 respectively. Source: (G, p. 14) Using 101 demographic & household surveys (DHS) conducted from 1990
onward in developing countries in Asia, Africa, Latin America, and Europe/Eurasia, regressions of water and mortality data show that at a national level, in order to avert one child death per 1000 births, access to flush toilets would have to increase 1.3% or access to pit-latrines would have to increase by 3.3%. In order to avert one under-five child death per 1000 births, access to flush toilets would have to increase 1.37%, pit latrines 1.86%. These figures were calculated when controlling for Income, other exogenous social indicators, policy indicators, and country-specific variables. Source: (J, p. 30)
Regional Quantitative Evidence 875,000 deaths, in addition to 1,088,000 disability life years are lost each year
to diseases directly attributable to poor water supply, sanitation, and hygiene in sub-Saharan Africa. Source: (A, p. 21) A study of 20 sub-Saharan African countries showed that while 70% of those
countries with high life expectancies have access to clean water, only 38% of those countries with low life expectancies do. Using a classification tree analysis, access to safe water was assigned a “discriminant” value of 49,
109

ranking it as the fourth most important determinant of health outcomes, after access to health care, income, and fertility rate. Source: (D, p. 11-15) Improving water quality and waste/sanitation management in sub-Saharan
Africa could potentially reduce the number of disability-adjusted life years by 31,208,000, or 8-9% of all DALYs. Source: (H p. 25)
Local Quantitative Evidence A 1990 study of three villages in Nigeria showed that providing access to
clean water by drilling boreholes reduced incidences of wasting in children from 6.7% to 2.8%. Source: (A, p. 32) In Paraguay, villages that were not served by a World Bank project that
provided piped potable water systems had seven times more deaths from diarrhea than those that were served by the project. Likewise, 95% of all reports of stomach distress came from villages that were not served by the system. The piped water system was constructed at a cost of US$12.5 million (US$102.46 per capita, 122,000 people served) Source: (E, p. 11, 53) Based on the Demographic Health Census conducted in 1996 in Brazil, 62.5%
of the mortality gap between rich people and impoverished people can be explained by lack of access to sanitation and water services. Source: (E, p. 24) A study of household effects on nutrition in Mozambique using the Maputo
Integrated Household Survey which covered 1,816 households in greater Maputo, including the greenbelt or semi-rural areas around the city showed that having one’s own toilet was strongly and positively correlated with the Z-score accorded to a child’s height before they reached 24 months, with a coefficient of 6.46. Likewise, sharing a toilet facility was strongly and negatively correlated with height, with a coefficient of –0.98 for children under 24 months and –1.51 for all children. The study controlled for age, income, education, mother’s height and age, presence of health facilities, and regional variables. Source: (O p. 583) In Albania, 60% of households attribute their health problems to poor water
quality and inadequate sanitation. Source: (P p. xiv) In Albania, 18% of those whose health has worsened since 1990 blame water
and sanitation services for the deterioration in their condition. Source: (P p. 64) According to a study in Greater Baku, Azerbaijan, 9 to 13% of households
report illnesses due to unsafe drinking water. This was especially true among people earning less than 100,000 manat per month, 19% of whom reported illness due to drinking water compared to 10% of those earning over 100,000 manat per month. Drinking water problems have been confirmed by a 1996 study that showed that 30% of water samples did not meet bacteriological standards, 80% did not meet turbidity standards, and 78% did not meet residual chlorine standards. Source: (Q, p. 5) A study using data on 3,509 children in 2,600 households in Romania from
the 1994 Integrated Household Study showed that when controlling for parent’s education, age, and ethnicity, poor sanitary conditions of a toilet were
110

strongly negatively correlated with a child’s height-for-weight Z-score, with a coefficient of –0.313 for rural boys and -0.247 for rural girls. Source: (R, p. 2045) A study using data on 37,000 Brazilian children from Demographic & Health
Surveys in 1974 and 1975 showed that access to both water and sanitation (number of connections per 1000 households) was significantly correlated with a child’s health (child height for age), with a coefficient of 0.234 and 0.353 respectively, and particularly in the urban sector (coefficients – 0.371 and 0.490 respectively). Source: (S, p. 320) A study using data from a multipurpose survey in the Bicol region of the
Phulippines conducted in 1978 on 1,903 households showed that access to piped water into ones home was significantly and positively correlated with the quality of child nutrition (a proxy for child health) with a coefficient of 0.441, as was piped water to one’s yard (coeff –0.217). Source: (T, p. 171)
Sources A: Rosen, Sydney & Vincent, Jeffrey R. “Household Water Resources and Rural Productivity in sub-Saharan Africa: A Review of the Evidence.” Cambridge: Harvard Institute for International Development, July 1999. B: Shi, Anquing. “How Access to Urban Potable Water and Sewerage Connections Affects Child Mortality.” Working Paper 1028. Washington, DC: World Bank, 1993. C: Makule, Diane. “Water and Sanitation: Gender Perspective.” Durban, South Africa: 23rd WEDC Conference, 1997. http://www.lboro.ac.uk/departments/cv/wedc/papers/23/grouph/lakule.pdf D: McCarthy, F. Desmond & Wolf, Holger. “Comparative Life Expectancy in Africa.” Policy Research Working Paper 2668. Washington, DC: World Bank, 2001. E: World Bank. “Public Expenditures for Poverty Alleviation in Northeast Brazil.” Report 22425-BR. Washington, DC: World Bank, June 2001. F: Mehta, Sumi & Smith, Kirk R. “Estimating the Global Burden of Disease from Indoor Air Pollution.” Methodology for assessment of environmental burden of disease: Report on the ISEE session on environmental burden of disease. Buffalo: ISEE, 22 August 2000. http://www.who.int/environmental_information/Disburden/wsh00-7/Methodan6-5.htm G: Jha, Prabhat & Vaz, Lara. “Noe on the Health Impact of Water and Sanitation Services.” CMH Working Paper Series WG5: 23. Geneva: World Health Organization, June 2001. H: Doumani, Fadi M. & Listorti, James A. “Environmental Health : Bridging the Gaps.” World Bank Discussion Paper 422. Washington, DC: World Bank, May 2001.
111

I: Becker, Stan & Black, Robert E. “A Model of the Effect of Health Interventions on Child Mortality: Example of Interventions for Diarrhoeal Diseases.” in Boerma, Tris; Gray, Ronald & Rashad, Hoda. Evaluation of the Impact of Health Interventions. Liege, Belgium: International Union for the Scientific Study of Population, 1995. pp. 157-188. J: Wang, Limin. “Determinants of Child Mortality in LDCs in the 1990s: Empirical Findings from Demographic and Health Surveys.” Washington, DC: World Bank, April, 2002. K: Nunan, Fiona & Satterwaithe, David. “The Urban Environment.” Urban Governance, Partnership and Poverty Theme Paper 6. London: University of Birmingham & International Institute for Environment and Development, March, 1999. L: Esrey, S.A; Potash, J.B.; Roberts, L.; Shiff, C. “Effects of Improved Water Supply and Sanitation on Ascariasis, Diarrhea, Dracunculiasis, Hookworm Infection, Schistosomiasis and Trachoma.” Bulletin of the World Health Organization 89 no. 5 (1991): 609-621. M: Cochrane, Susan H. & Guilkey, David K. “The Effects of Fertility Intentions and Access to Services on Contraceptive Use in Tunisia.” Economic Development and Cultural Change 43 no. 4 (July, 1995): 779-799. N: Murray, Christopher J.L. & Lopez, Alan D. “Quantifying the burden of disease and injury attributable to ten major risk factors.” In Murray, Christopher J.L. & Lopez, Alan D. eds. The Global Burden of Disease. Cambridge, MA: Harvard School of Public Health on behalf of the World Health Organization and the World Bank. O: Sahn, David E. & Aldrerman, Harold. “On the Determinants of Nutrition in Mozambique: The Importance of Age-Specific Effects.” World Development 25 no. 4 (1997): 577-588. P: De Soto, Hermine; Gordon, Peter; Gedeshi, Ilir; Sinoimeri, Zamira. “A Qualitative Assessment of Poverty in 10 Areas of Albania.” Washington, DC: World Bank, 2001. Q: World Bank. “Azerbaijan Water Supply and Sanitation Sector Review and Strategy.” Report No. 20711. Washington, DC: World Bank, 2000. R: Skoufias, Emmanuel. “Determinants of Child Health During the Economic Transition in Romania.” World Development 26 no. 11 (1998): 2045-2056. S: Thomas, D. & Strauss, J. “Prices, infrastructure, household characteristics and child health.” Journal of Development Economics 39 (1992): 301-331. T: Horton, Susan. “Child Nutrition and Family Size in the Philippines.” Journal of Development Economics 23 (1986): 161-176.
112

Water & Sanitation Impacts on Poverty
Direct Impact on Well-Being
- Reducing time and effort needed to fetch water Many areas where the poor live lack access to any sort of potable water source, and many of the poor must travel prohibitively long distances to use public water distribution points. In order to obtain adequate supplies of water for drinking, cooking, and washing, many poor people frequently travel over one hour each way. Such journeys are arduous, considering the volume and weight of water needed to sustain an entire family. As a result, many poor people, particularly women and girls, must spend significant portions of their time collecting water, leaving little free time for education, recreation, or economically productive activities. Providing access to adequate water supplies can reduce and often nearly eliminate the amount of time and effort people, and particularly women, must spend to provide themselves and their households with water.
Regional Quantitative Evidence In Sub-Saharan Africa, in 4 out of 6 countries surveyed, women saved over
one hour per day after they began using a new and improved water source in their villages. One of the other two villages saved between 17 and 86 minutes per day. Source: (B, p. 32) A simple average of time costs for carrying water in sub-Saharan Africa listed
in thirteen studies shows that the average water-carrier in sub-Saharan Africa spends 60 minutes/day collecting water. Source: (A, p. 58) Village-level surveys of transport time conducted with 840 households in 20
villages in sub-Saharan Africa showed that If households in were brought within 6 minutes walking time of a potable water source, between 125 and 942 hours, depending on the current state of physical infrastructure in the community, would be saved per year in travel time. Source: (E, p. 28) The “Drawers of Water” study of 16 sites in Uganda, Tanzania, and Kenya
showed that between 1972 and 2000, urban east African households without access to piped water experienced an average increase of 218% (over time) in the amount of time it took to collect water. Source: (F, p. 37-38)
Local Quantitative Evidence A 1990 study of three villages in Nigeria showed that providing access to
clean water by drilling boreholes, the average time per person spent each day collecting water fell from 360 minutes to 45 minutes. Source: (A, p. 63) In Sri Lanka, households reported saving 30 hours per month after a mixed
pipe/handpump potable water system was installed by the World Bank. The system was constructed at a cost of US$33 million (US$50.77 per capita, 650,000 people served). Source: (C, p. 14, 53) In Rural Pakistan, women saved 1.5 hours/day with access to an improved
water system. Source: (D, p. 49)
113

Based on a survey of 550 households in 12 slums in Andhra and Madya Pradesh, India,, 68% of residents reported a time saving as a result of improvements in water supplies, with 56% reporting a decline in the burden of collection for women, and 46% reported an improvement in the quantity and quality of water supply. Source: (G, p. 107)
Local Qualitative Evidence In Midrita, Albania, families who don’t have water taps in their homes have to
obtain water from sources that are generally thirty minutes away. Source: (H, p. 51)
Sources A: Rosen, Sydney & Vincent, Jeffrey R. “Household Water Resources and Rural Productivity in sub-Saharan Africa: A Review of the Evidence.” Cambridge: Harvard Institute for International Development, July, 1999. B: Calvo, Christina Malmberg. “Case Study on the Role of Women in Rural Transport: Access of Women to Domestic Facilities.” SSATP Working Paper No. 11. Washington, DC: World Bank 1994. C: World Bank. “Rural Water Projects: Lessons from OED Evaluations.” OED Report 21096. Washington, DC: World Bank, August 2000. D: World Bank.. “World Development Report 1994.” London: Oxford University Press, 1994. E: Barwell, Ian. “Transport & The Village: Findings from African Village-Level Travel & Transport Surveys & Related Studies.” World Bank Discussion Paper 344. Washington, DC: World Bank, 1996. F: Thompson, John; Porras, Ina T.; Wood, Elisabeth; Tumwine, James K, Mujwahuzi, Munguti Katui-Katua & Johnstone, Nick. “Waiting at the tap: changes in urban water use in East Africa over three decades.: Environment and Urbanization 12.2 (October 2000): 37-52. G: Amis, Philip. “Rethinking UK aid in urban India: reflections on an impact assessment study of slum improvement projects.” Environment & Urbanization 13.1 (April, 2001): 101-113. H: De Soto, Hermine; Gordon, Peter; Gedeshi, Ilir; Sinoimeri, Zamira. “A Qualitative Assessment of Poverty in 10 Areas of Albania.” Washington, DC: World Bank, 2001.
114

Linkages between Water & Sanitation and Poverty Alleviation Sources Amis, Philip. “Rethinking UK aid in urban India: reflections on an impact assessment study of slum improvement projects.” Environment & Urbanization 13.1 (April, 2001): 101-113. Asian Development Bank. “Water for All: the Water Policy of the Asian Development Bank.” October 2000. http://www.adb.org/Documents/Policies/Water/water.pdf Barja, Gover & Urquiola, Miguel. “Capitalization, Regulation & The Poor: Access to Basic Services in Bolivia.” Discussion Paper 2002/34. United Nations University/WIDER, July 2001. http://www.wider.unu.edu/publications/dps/dp2001-34.pdf Barwell, Ian. “Transport & The Village: Findings from African Village-Level Travel & Transport Surveys & Related Studies.” World Bank Discussion Paper 344. Washington, DC: World Bank, 1996. Becker, Stan & Black, Robert E. “A Model of Child Morbidity, Mortality, and Public Health Interventions.” Population and Development Review 22 no.3 (September, 1996): 431-456. Becker, Stan & Black, Robert E. “A Model of the Effect of Health Interventions on Child Mortality: Example of Interventions for Diarrhoeal Diseases.” in Boerma, Tris; Gray, Ronald & Rashad, Hoda. Evaluation of the Impact of Health Interventions. Liege, Belgium: International Union for the Scientific Study of Population, 1995. pp. 157-188. Bhargava, Alok; Bundy, Donald A.P.; Jukes, Matthew; and Sachs, Jeffrey D. “Modeling the Effects of Health Status and the Educational Infrastructure on the Cognitive Development of Tanzanian School Children.” CMH Working Paper WG1-2. Cambridge, MA: Harvard University Center for International Development, March 2001 http://www2.cid.harvard.edu/cidcmh/wg1_paper2.pdf Bhatia, Ramesh & Falkenmark, Malin. “Water Resource Policies and the Urban Poor: Innovative Approaches and Policy Imperatives.” Water and Sanitation Current Series. Washington, DC: World Bank, 1993. Blackden, Mark & Bhanu, Chitra. “Gender, Growth, and Poverty Reduction in Sub-Saharan Africa SPA Status Report” World Bank Technical Paper 428. Washington, DC: World Bank, March 1999. Bosch, Christopher; Hommann, Kristen; Rubio, Gloria M.; Sadoff, Claudia; Travers, Lee. “PRSP Toolkits – Water, Sanitation & Poverty – Technical Notes.” Washington, DC:
115

World Bank, April 2001. http://www.worldbank.org/poverty/strategies/chapters/water/wattn509.pdf Bosch, Christopher; Hommann, Kristen; Rubio, Gloria M.; Sadoff, Claudia; Travers, Lee. “PRSP Toolkits – Water, Sanitation & Poverty – Technical Notes.” April, 2001. http://www.worldbank.org/poverty/strategies/chapters/water/wattn509.pdf Calvo, Christina Malmberg. “Case Study on the Role of Women in Rural Transport: Access of Women to Domestic Facilities.” SSATP Working Paper No. 11. Washington, DC: World Bank 1994. http://www.worldbank.org/afr/ssatp/SSATPWP11.pdf Carter, Brandon. “Water Pollution.” Cities and Health 1. September, 1998. Cochrane, Susan H. & Guilkey, David K. “The Effects of Fertility Intentions and Access to Services on Contraceptive Use in Tunisia.” Economic Development and Cultural Change 43 no. 4 (July, 1995): 779-799. Corral, Leonardo. “Rural Non-farm Incomes in Nicaragua.” World Development 29 no. 3 (2001): 427-442. Collignon, Bernard & Vezina, Marc. “Independent Water and Santiation Providers in African Cities.” Washington, DC: Water and Sanitation Program, April, 2000. Davis, Jennifer; Kang, Alice; Vincent, Jeffrey; Whittington, Dale. “The Value of Improved Water Supply to Microenterprises in sub-Saharan Africa.” Consulting Assistance on Economic Reform II (CAER II) Discussion Paper 49. Cambridge: Harvard University Center for International Development, October 1999 http://www.cid.harvard.edu/caer2/htm/content/papers/paper49/paper49.pdf De Soto, Hermine; Gordon, Peter; Gedeshi, Ilir; Sinoimeri, Zamira. “A Qualitative Assessment of Poverty in 10 Areas of Albania.” Washington, DC: World Bank, 2001. DeVanzo, Julie & Habicht, Jean-Pierre. “Infant Mortality Decline in Malaysia, 1946-1975. The Roles of Changes in Variables and Structures of Relationships.” Demography 23.2 (May, 1986): 143-160. Doumani, Fadi M. & Listorti, James A. “Environmental Health : Bridging the Gaps.” World Bank Discussion Paper 422. Washington, DC: World Bank, May, 2001. Esrey, S.A; Potash, J.B.; Roberts, L.; Shiff, C. “Effects of Improved Water Supply and Sanitation on Ascariasis, Diarrhea, Dracunculiasis, Hookworm Infection, Schistosomiasis and Trachoma.” Bulletin of the World Health Organization 89 no. 5 (1991): 609-621.
116

Franceys, Richard. “Private Sector Participation In The Water And Sanitation Sector.” DFID Occasional Paper 3. London: Department for International Development, July 1997. http://www.dfid.gov.uk/Pubs/files/iudd_water3.pdf Gelband, H. & Stansfield, S. “The Evidence Base for Interventions to Reduce Under Five Mortality in Low and Middle-income Countries.” CMH Working Paper WGH5:9 Geneva: World Health Organization,. July 2001. http://www.cmhealth.org/docs/wg5_paper9.pdf Hammerslough, Charles & Trussel, James. “A Hazards Model Analysis of Covariates of Infant and Child Mortality in Sri Lanka.” Demography 20.1 (February, 1983): 1-26. Hogrewe, William; Joyce, Steven D.; Perez, Eduardo. “The Unique Challenges of Improving Peri-Urban Sanitation.” WASH Technical Report 86. Washington, DC: USAID, July 1993. http://www.dec.org/pdf_docs/pnabp615.pdf Horton, Susan. “Child Nutrition and Family Size in the Philippines.” Journal of Development Economics 23 (1986): 161-176. Ilahi, Nadeem. “Children’s Work and Schooling: Does Gender Matter? Evidence from the Peru LSMS Panel Data.” Policy Research Working Paper 2745. December, 2001. Jalon, Jyotsna & Ravallion, Martin. “Does Piped Water Reduce Diarrhea for Children in Rural India?” Working Paper 2664. August, 2001. http://econ.worldbank.org/files/2383_wps2664.pdf Jha, Prabhat & Vaz, Lara. “Note on the Health Impact of Water and Sanitation Services.” CMH Working Paper Series WG5:23. Geneva: World Health Organization, June 2001. http://www.cmhealth.org/docs/wg5_paper23.pdf Koppen, Barbara van and Mahmud, Simeen. “Women and Water-Pumps in Bangladesh: The Impact of Participation in Irrigation Groups on Women's Status.” in Abstracts on Woman, Water and Sanitation 8.1 (1998) http://www.irc.nl/products/publications/ajw/v8n01.html Lavy, Victor; Strauss, John; Thomas, Duncan & de Vreyer, Phillipe. “Quality of health care, survival and health outcomes in Ghana.” Journal of Health Economics 15 (1996): 333-357. Ling, Jack C.S. & Reader-Wilstein, Cynthia. “Water – A vital wellspring for human development.” Amsterdam, Netherlands: International Water and Sanitation Center, 1993. http://www.irc.nl/themes/communication/vital.html
117

Makule, Diane. “Water and Sanitation: Gender Perspective.” 23rd WEDC Conference, Durban, South Africa, 1997. http://www.lboro.ac.uk/departments/cv/wedc/papers/23/grouph/lakule.pdf McCarthy, F. Desmond & Wolf, Holger. “Comparative Life Expectancy in Africa.” Policy Research Working Paper 2668. Washington, DC: World Bank, 2001. Mehta, Sumi & Smith, Kirk R. “Estimating the Global Burden of Disease from Indoor Air Pollution.” Methodology for assessment of environmental burden of disease: Report on the ISEE session on environmental burden of disease. Buffalo: ISEE, 22 August 2000. http://www.who.int/environmental_information/Disburden/wsh00-7/Methodan6-5.htm Merrick, Thomas. “The Effect of Piped Water on Early Childhood Mortality in Urban Brazil, 1970-1976.” Demography 22.1 (February, 1985): 1-24. Murray, Christopher J.L. & Lopez, Alan D. “Quantifying the burden of disease and injury attributable to ten major risk factors.” In Murray, Christopher J.L. & Lopez, Alan D. eds. The Global Burden of Disease. Cambridge, MA: Harvard School of Public Health on behalf of the World Health Organization and the World Bank. Nunan, Fiona & Satterwaithe, David. “The Urban Environment.” Urban Governance, Partnership and Poverty Theme Paper 6. London: University of Birmingham & International Institute for Environment and Development, March, 1999. Rosen, Sydney & Vincent, Jeffrey R. “Household Water Resources and Rural Productivity in sub-Saharan Africa: A Review of the Evidence.” Harvard Institute for International Development, July, 1999. http://www2.cid.harvard.edu/cidneudc/RosenVincent.PDF Rosensweig, Mark & Wolpin, Kenneth. “Government Interventions and Household Behavior in a Developing Country.” Journal of Development Economics 10 (1982): 209-225 Sadoff, Claudia. “The Price of Dirty Water: Pollution Costs in the Sebou Basin.” Environmental Economics Paper Series No. 38. Washington, DC: World Bank, June 1996. Sahn, David E. & Alderman, Harold. “On the Determinants of Nutrition: The Importance of Age-Specific Effects.” World Development 25 no. 4 (1997): 577-588. Skoufias, Emmanuel. “Determinants of Child Health During the Economic Transition in Romania.” World Development 26 no. 11 (1998): 2045-2056. Shi, Anquing. “How Access to Urban Potable Water and Sewerage Connections Affects Child Mortality.” Working Paper 1028. Washington, DC: World Bank, 1993.
118

Shirley, Mary M.; Xu, Colin & Zuluaga, Ana Maria. “Reforming Urban Water Supplies: The Case of Chile.” Working Paper 2294. http://econ.worldbank.org/docs/1045.pdf Thomas, D. & Strauss, J. “Prices, infrastructure, household characteristics and child health.” Journal of Development Economics 39 (1992): 301-331. Thompson, John; Porras, Ina T.; Wood, Elisabeth; Tumwine, James K, Mujwahuzi, Munguti Katui-Katua & Johnstone, Nick. “Waiting at the tap: changes in urban water use in East Africa over three decades.: Environment and Urbanization 12.2 (October 2000): 37-52. Tynan, Nicola. “Private Participation in Infrastructure and the Poor: Water & Sanitation.” Infrastructure for Development: Private Solutions and the Poor. June, 2000. http://www.ppiaf.org/conference/sector3-paper2.pdf UNICEF. “Sanitation for All – Promoting Dignity and Human Rights.” New York: UNICEF, January 2001 http://www.unicef.org/sanitation United Nations. “Third United Nations Conference on the Least Developed Countries, LDCIII Infrastructure Development Session.” Brussels, May 19, 2001. http://wbln0018.worldbank.org/infrastructure/infrastructure.nsf/a66f26f4ba334e2c852569b400565dda/07f698cd9e37844f85256aa300761866/$FILE/infra%20UNCTAD%2004-05-01.doc USAID. “Food and Agriculture in Bangladesh: A Success Story.” http://www.usaid.gov/bd/files/food_success.pdf USAID. “Preventing Child Diarrhoeal Disease: Options for Action.” Washington, DC: USAID, June, 1999. Vanderschueren, Franz; Wegelin, Emiel & Wekwete, Kadmiel. “Policy Programme Options for Urban Poverty Reduction.” Urban Management Programme Policy Paper 20. Washington, DC: World Bank, September 1996. Wang, Limin. “Health Outcomes in Poor Countries and Policy Implications: Empirical Findings from Demographic and Health Surveys.” Unpublished. Wolfe, Barbara L. & Behrman, Jere R. “Determinants of Child Morality, Health, and Nutrition in a Developing Country.” Journal of Development Economics 11 (1982): 163-193. World Bank. “Azerbaijan: Baku Water Supply Project.” Social Assessment Series no. 17. Washington, DC: World Bank, 1995.
119

World Bank. “Azerbaijan Water Supply and Sanitation Sector Review and Strategy.” Report No. 20711. Washington, DC: World Bank, 2000. World Bank. “Core Intervention 2: Provision of Safe Water and Sanitation.” School Health at a Glance. Washington, DC: World Bank, undated. http://wbln0018.worldbank.org/hdnet/hddocs.nsf/c840b59b6982d2498525670c004def60/489122cbc270b63185256a4e00697986?OpenDocument World Bank. “Honduras Poverty Assessment 2000.” Report 20531-HO. Washington, DC: World Bank, June 2001
World Bank. “India - Comparative Review of Rural Water Systems Experience: The Rajasthan Water Supply and Sewerage Project, and the Rural Water Supply and Environmental Sanitation Projects for Maharashtra and Karnataka.” OED Report 18114. June, 1998.
World Bank. “Public Expenditures for Poverty Alleviation in Northeast Brazil.” Report 22425-BR. Washington, DC: World Bank, June 2001. World Bank. “Rural Water Projects: Lessons from OED Evaluations.” OED Report 21096. Washington, DC: World Bank, August 2000. World Bank. “Sri Lanka Impact Evaluation Report: Community Water Supply and Sanitation Report.” OED Report No. 18113. Washington, DC: World Bank, June 1998. World Bank. “World Development Report 2000/2001: Attacking Poverty.” London: Oxford University Press, 2001. World Bank.. “World Development Report 1994.” London: Oxford University Press, 1994. Zerah, Marie-Helene. Water: Unreliable Supply in Delhi. New Delhi: Monhar for Centre de Sciences Humaines, 2000.
120