infrastructure: investments, reforms and the new...
TRANSCRIPT


Infrastructure: Investments,
Reforms and the new
Concessions Program
Wagner Cardoso Executive Secretary of Infrastructure
National Confederation of Industry
Brasília, June 16th, 2015
2

INFRASTRUCTURE
AND
COMPETITIVENESS
PIL 2012
GROWTH OF INFRASTRUCTURE
SERVICES DEMAND
1 2 3 4
THE NEW AGRIBUSINESS OUTLETS
5
Summary
PIL 2015
PIL = Logistic Investment Program
3
China Chile India Brazil
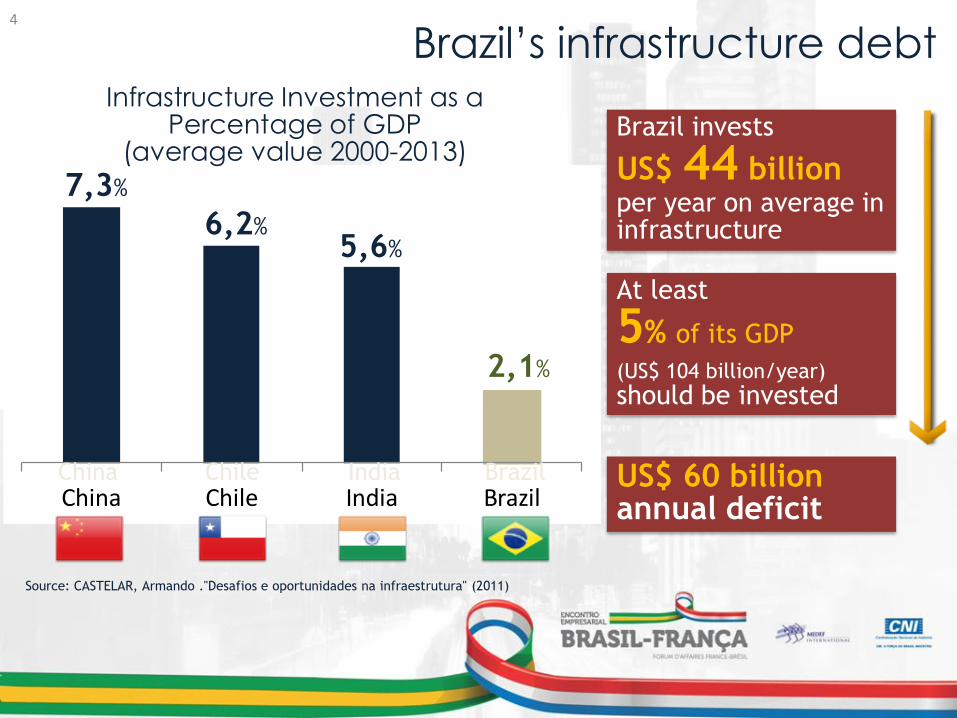
Brazil’s infrastructure debt Infrastructure Investment as a
Percentage of GDP (average value 2000-2013)
7,3%
6,2% 5,6%
China Chile India Brazil
Source: CASTELAR, Armando ."Desafios e oportunidades na infraestrutura" (2011)
2,1%
Brazil invests
US$ 44 billion per year on average in infrastructure
At least
5% of its GDP
(US$ 104 billion/year)
should be invested
US$ 60 billion annual deficit
4
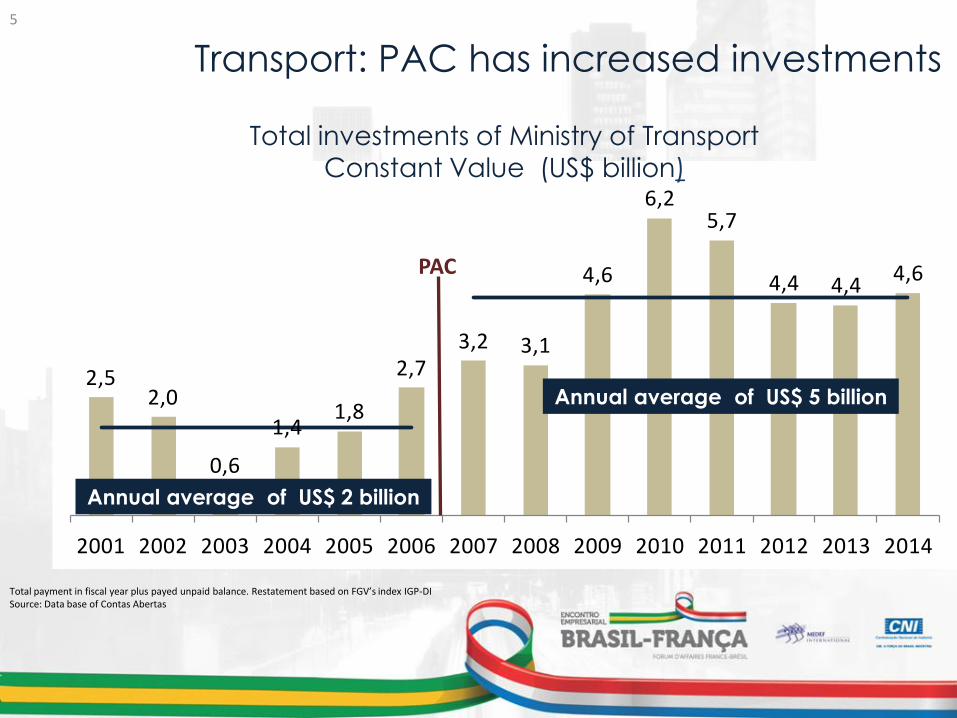
2,52,0
0,6
1,41,8
2,73,2 3,1
4,6
6,25,7
4,4 4,44,6
2001 2002 2003 2004 2005 2006 2007 2008 2009 2010 2011 2012 2013 2014
Transport: PAC has increased investments
Total investments of Ministry of Transport
Constant Value (US$ billion)
Total payment in fiscal year plus payed unpaid balance. Restatement based on FGV’s index IGP-DI Source: Data base of Contas Abertas
Annual average of US$ 2 billion
Annual average of US$ 5 billion
PAC
5

Growth in demand for services has made
the problem worse
Despite important advances with PAC, the infrastructure
services expansion rate has been lower than the growth of
demand
6
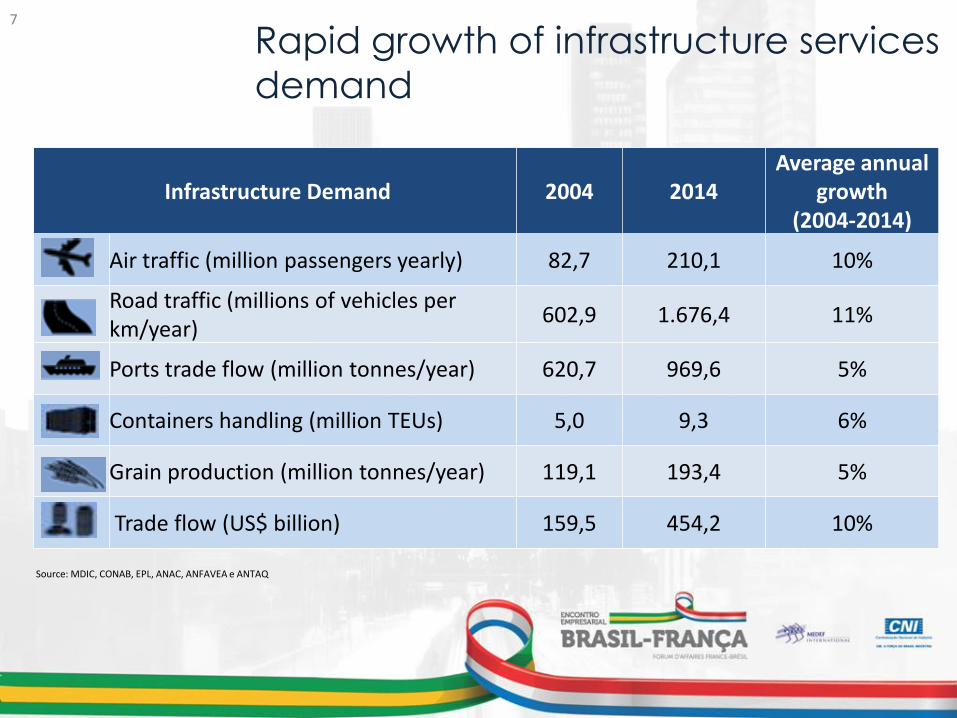
Rapid growth of infrastructure services
demand
Infrastructure Demand 2004 2014 Average annual
growth (2004-2014)
Air traffic (million passengers yearly) 82,7 210,1 10%
Road traffic (millions of vehicles per km/year)
602,9 1.676,4 11%
Ports trade flow (million tonnes/year) 620,7 969,6 5%
Containers handling (million TEUs) 5,0 9,3 6%
Grain production (million tonnes/year) 119,1 193,4 5%
Trade flow (US$ billion) 159,5 454,2 10%
Source: MDIC, CONAB, EPL, ANAC, ANFAVEA e ANTAQ
7

Air traffic: 10% per year increase
82,7 96,1 102,2
110,6 113,3 128,1
155,4
179,9 191,6 197,0
210,1
2004 2005 2006 2007 2008 2009 2010 2011 2012 2013 2014
Source: Infraero and private administrations.
Air traffic demand growth (million passengers yearly)
8
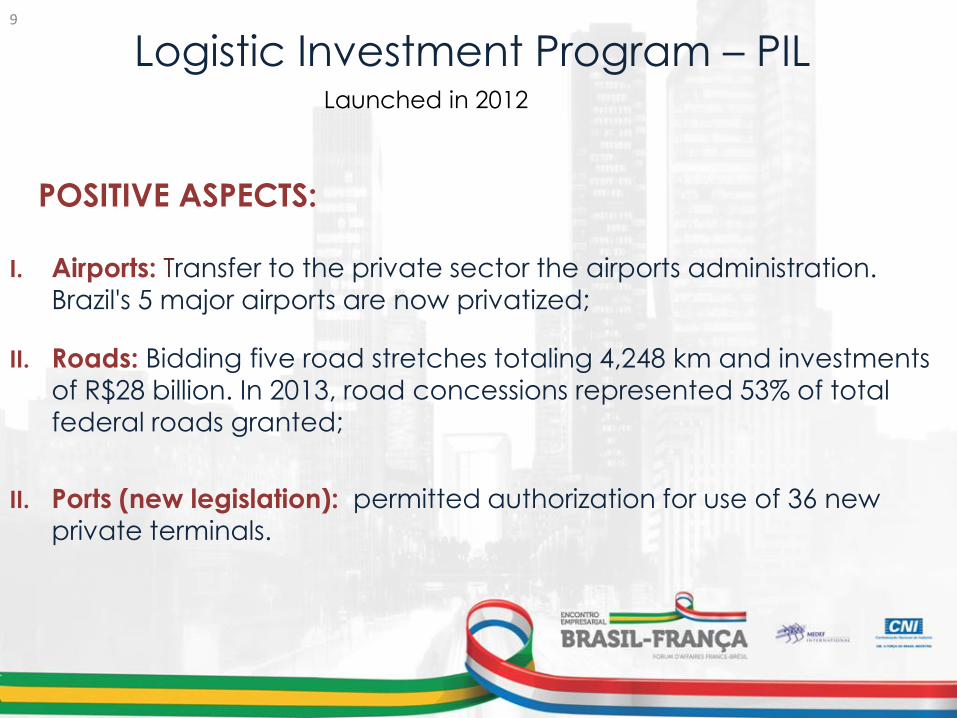
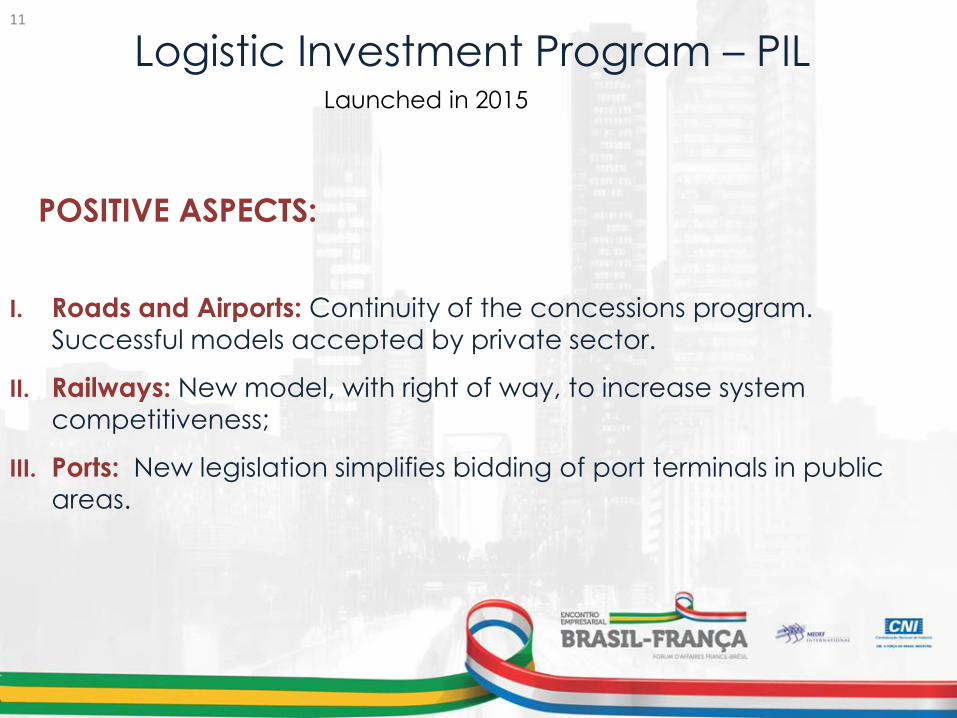
Logistic Investment Program – PIL
POSITIVE ASPECTS:
Launched in 2012
I. Airports: Transfer to the private sector the airports administration.
Brazil's 5 major airports are now privatized;
II. Roads: Bidding five road stretches totaling 4,248 km and investments
of R$28 billion. In 2013, road concessions represented 53% of total
federal roads granted;
II. Ports (new legislation): permitted authorization for use of 36 new
private terminals.
9

NEGATIVE ASPECTS:
I. Railways: the proposed exploration model was not accepted by private sector and the technical studies, including those related to
geology, were not complete;
II. Port terminals in public areas: After remaining almost two years in
evaluation by Government Control Departments, the bidding was
finally approved in may 2015.
Logistic Investment Program – PIL Launched in 2012
10
POSITIVE ASPECTS:
I. Roads and Airports: Continuity of the concessions program.
Successful models accepted by private sector.
II. Railways: New model, with right of way, to increase system competitiveness;
III. Ports: New legislation simplifies bidding of port terminals in public
areas.
Logistic Investment Program – PIL Launched in 2015
11
MAIN WORRY:
I. Railways: the success of the new model and the total railway system
integration depend upon negotiations involving right of way with previous concessionaires.
Logistic Investment Program – PIL Launched in 2015
12
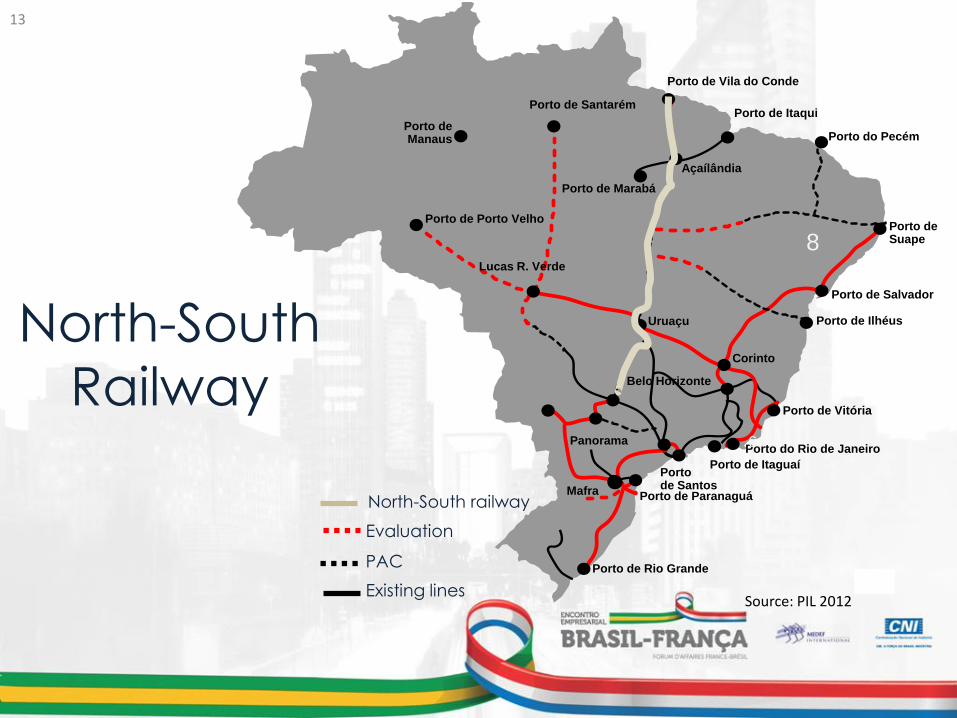
North-South
Railway
Porto de Itaqui
Porto do Pecém
Porto de Suape
Porto de Salvador
Porto de Vitória
Porto do Rio de Janeiro
Porto de Itaguaí Porto de Santos
Porto de Paranaguá
Porto de Rio Grande
Porto de Manaus
Porto de Santarém
Porto de Porto Velho
Porto de Marabá
Lucas R. Verde
Uruaçu Porto de Ilhéus
Belo Horizonte
Panorama
Açaílândia
Porto de Vila do Conde
Mafra
6
Corinto
8
Evaluation
PAC
Existing lines
Source: PIL 2012
North-South railway
13

BR-163: A new cargo route Crème de la Crème: Sinop – Miritituba (976 km)
ItaquiItacoatiara
Santana
Transnordestina
Santarém
BR-163
Carajás
Portos da Região Norte
Ferrovia
Norte-Sul
Miritituba
Macapá
Vila do Conde / Outeiro
SINOP
14

The new agribusiness outlets
Source: CNA e Secex. (Estimated values - illustrative map)
Production
69,9 milion tons
= 42,1%
Production
96,1 miilion tons
= 57,9%
2014
Soybeans and corn production> 5 thousand tons
Itacoatiara 2,7 milion tons
(3,3%)
Porto Velho*
(ITACOATIARA + SANTARÉM) 4,5 milion tons
(5,5%)
Santarém
Sistema Belém/Guajará
São Luís/Itaqui
Salvador/Cotegipe 2,9 milion tons
(3,6%)
3,7 milion tons
(4,6%)
Vitória 6,2 milhion tons
(7,7%)
24,9 milion tons (30,8%)
Rio Grande 12,2 milion tons (15,1%)
São Fco do Sul 7,1 milion tons (8,8%)
1,8 milion tons
(2,2%)
Paranaguá 17,6 milion tons(21,8%)
Santos
Exportação (2014) Santana
Zero
Brazilian Production
166,0 milion tons
Consumption
66,2 milion tons
Exports
68,5 milhões/t
= 84,8%
Surplus (N, NE e CO)
64,8 milhões/t
Surplus
3,7 milion tons
Consumption
19,0 milion tons
Exports
12,3 milion tons
= 15,2%
Surplus
64,8 million tons
1,2 milion tons
(1,5%)
Imbituba 0,5 milion tons (0,6%)
15
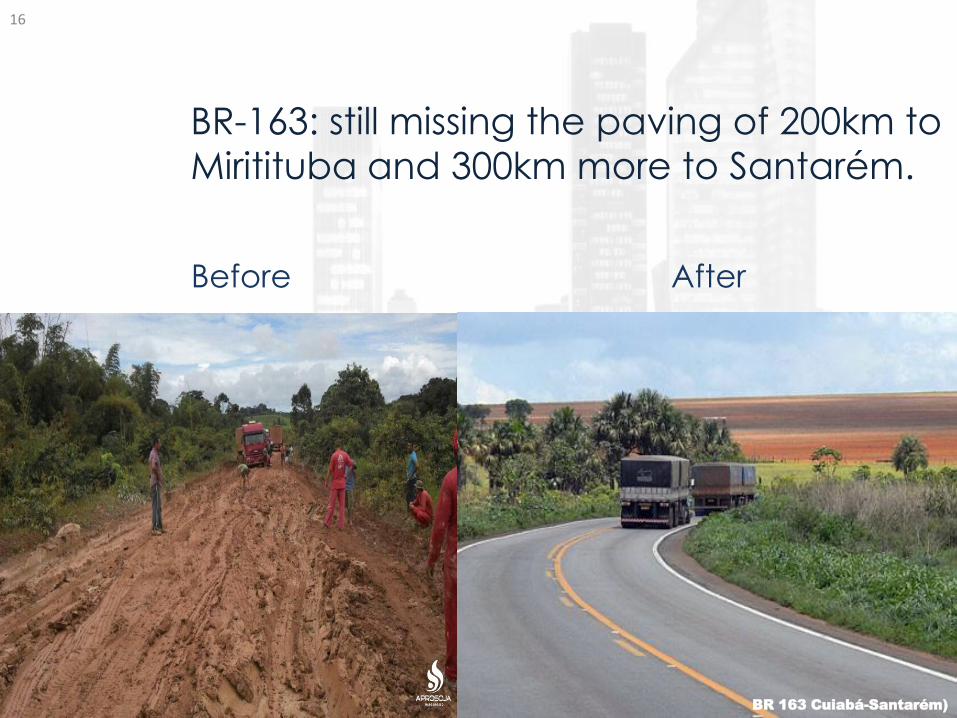
BR-163: still missing the paving of 200km to
Miritituba and 300km more to Santarém.
Before After
BR 163 Cuiabá-Santarém)
16
PIL 2015: Increasing private sector infrastructure
participation in the administration is the right
path
WHAT IS LEFT TO BE DONE ?
1. Privatization of public port administration (as set out in the actual
legislation);
2. Reduction of port bureaucracy;
3. Reduction of delays in the environmental licensing processes. The long
period for obtaining environmental licensing affects all infrastructure
sectors.
17
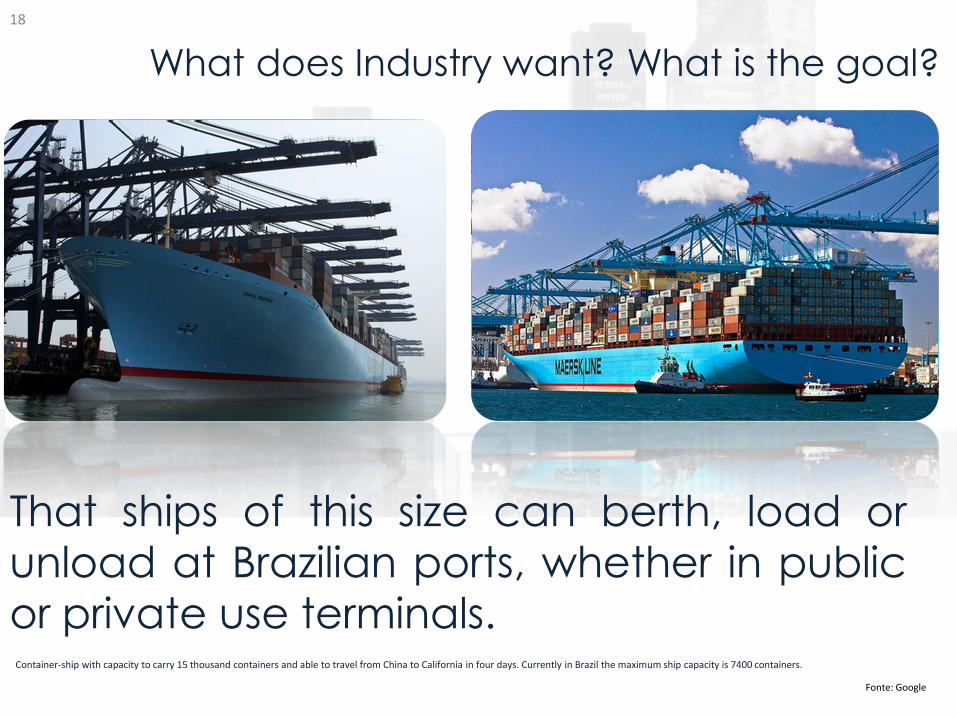
That ships of this size can berth, load or
unload at Brazilian ports, whether in public or private use terminals.
Container-ship with capacity to carry 15 thousand containers and able to travel from China to California in four days. Currently in Brazil the maximum ship capacity is 7400 containers.
Fonte: Google
What does Industry want? What is the goal?
18
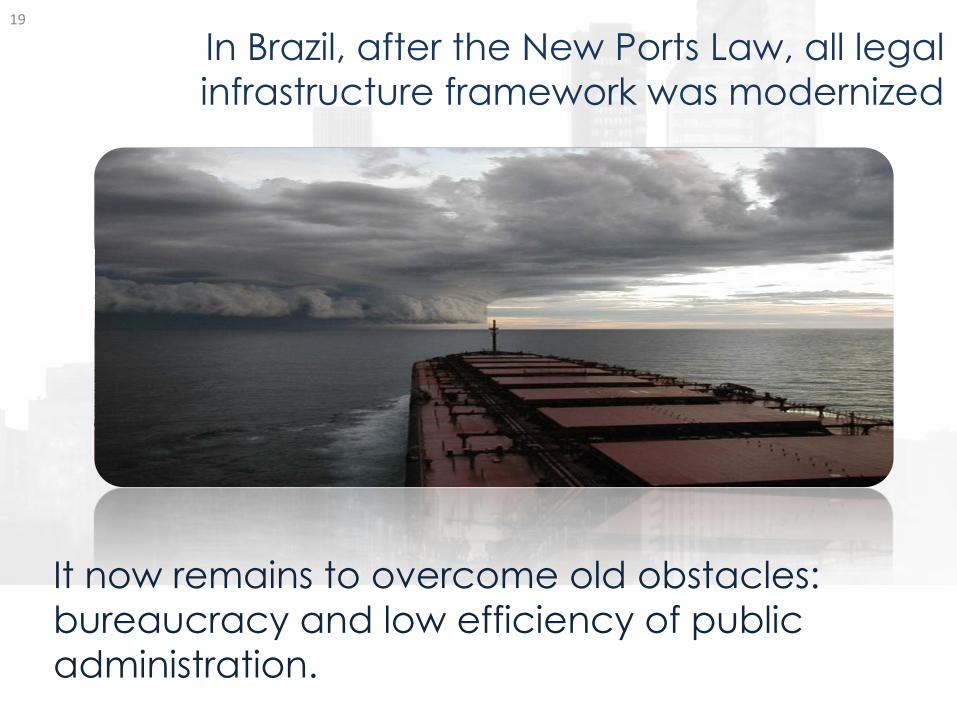
In Brazil, after the New Ports Law, all legal
infrastructure framework was modernized
It now remains to overcome old obstacles:
bureaucracy and low efficiency of public
administration.
19
Infrastructure: Investments,
Reforms and the new
Concessions Program
Wagner Cardoso Executive Secretary of Infrastructure
National Confederation of Industry
Brasília, June 16th, 2015
20