infrastructure investment. 1.market size 2. challenges 3. proposals 4. innovation index
TRANSCRIPT
CMIC Presentation to the North American Construction Federation
Conference
Oaxaca, OaxacaMexico
August 17-20, 2011
Infrastructure Investment

1.Market Size
2. Challenges
3. Proposals
4. Innovation
Index

0
20
40
60
80
100
120
140
160
180
2005 2006 2007 2008 2009 2010
Source: National Institute of Statistics, Geography and Information (INEGI).
Public investment
Private investment
112.9
Billion dollars(participation percentage)
131.3143.2
160.0
126.5142.1
69.5%
71.1%
69.5%65.7%
59.8% 59.9%
30.5% 28.9% 30.5%34.3% 40.2% 40.1%
Construction Investment 2000-2010 (Public-Private)
3

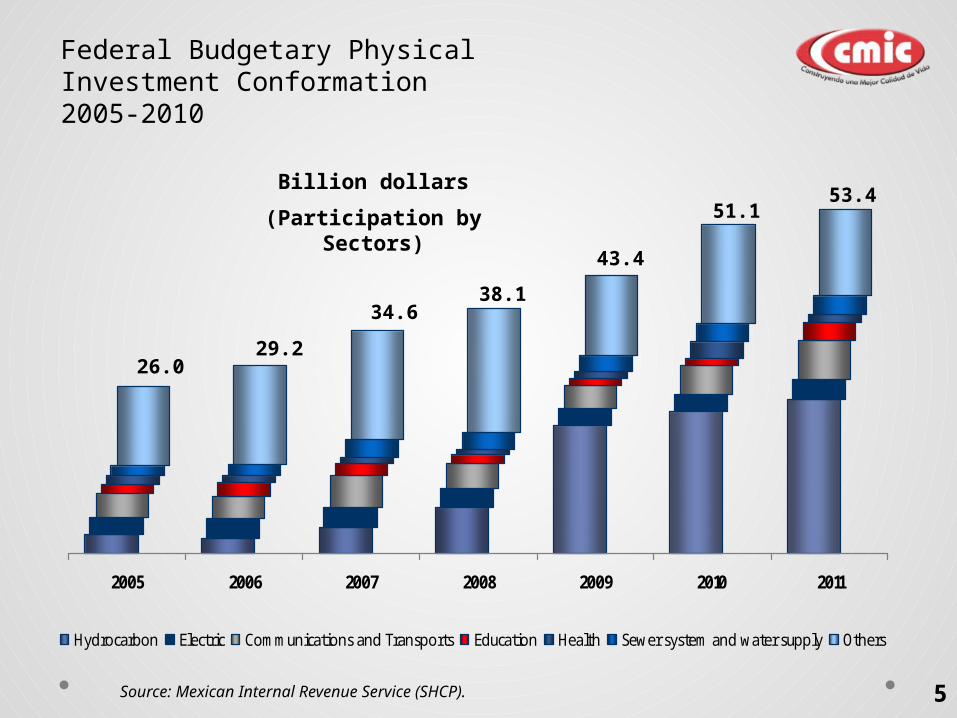
26.029.2
34.638.1
43.4
51.153.4
0
10
20
30
40
50
60
2005 2006 2007 2008 2009 2010 2011Billion dollars
Billion dollars
Infrastructure impulse: investment doubled in six years
Source: Mexican Internal Revenue Service (SHCP).
4
Federal Budgetary Physical Investments 2005-2011
2005 2006 2007 2008 2009 2010 2011
Hydrocarbon Electric Communications and Transports Education Health Sewer system and water supply Others
Billion dollars
(Participation by Sectors)
5
Federal Budgetary Physical Investment Conformation 2005-2010
Source: Mexican Internal Revenue Service (SHCP).
26.029.2
34.638.1
43.4
51.153.4

Progress in the Implementation of Public Resources for May 2011
Percentage advance (%)
Sector
Investment budget
2011
Billions of dollars
TOTAL 53.4
Energy 26.7
SENER
0.0
PEMEX 23.7
CFE 2.9
Communications and
Transportation 6.1
Education 2.8
Health 1.3
Water and Environment 2.8
Tourism 0.1
Others 13.7
57.9
38.8
28.8
27.3
24.6
24.3
20.2
17.7
16.4
13.310.1
9.5
8.5
6.6
0.0
0.0
IMSS
SECTUR
ISSSTE
CFE
SEMA…
PEMEX
SS
SCT
CAPUFE
CONA…
SEP
SSP
ASA
FONAT…
TELEC…
SENER
The average advance in May was of 17.7%
Bids granted / counter amended budget
Public Resources Allocated to Projectsof Infrastructure Investment for 2011
Federal Budgetary Physical Investment Conformation
6
Percentage advance (%)
Source: Mexican Internal Revenue Service (SHCP).
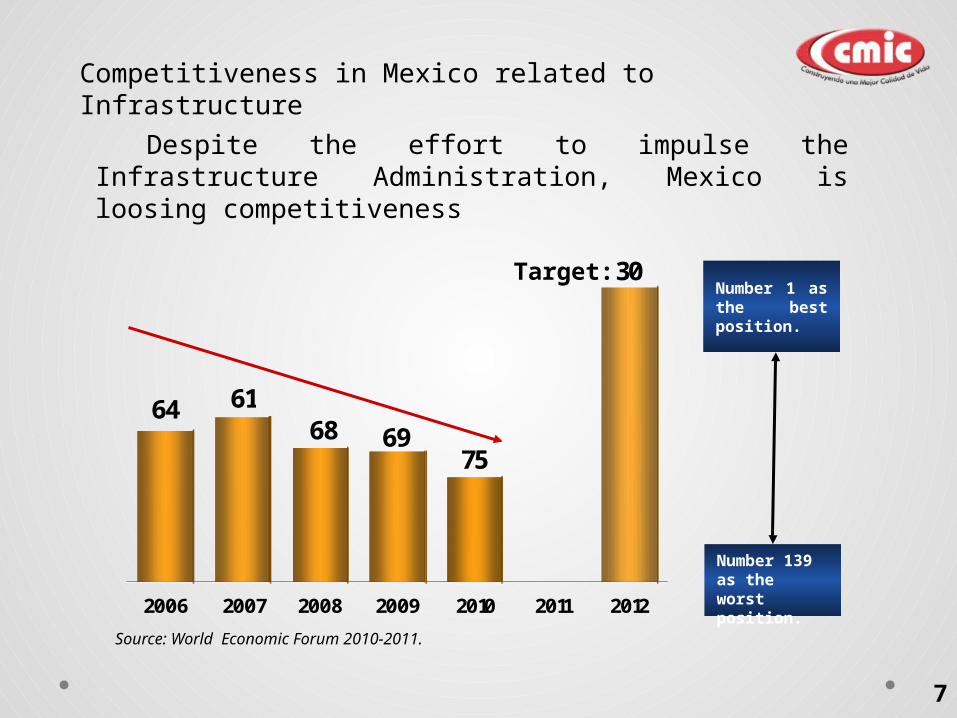
64 6168 69
75
30
2006 2007 2008 2009 2010 2011 2012
Number 1 as the best position.
Number 139 as the worst position.
Despite the effort to impulse the Infrastructure Administration, Mexico is loosing competitiveness
Competitiveness in Mexico related to Infrastructure
7
Source: World Economic Forum 2010-2011.
Target:
8
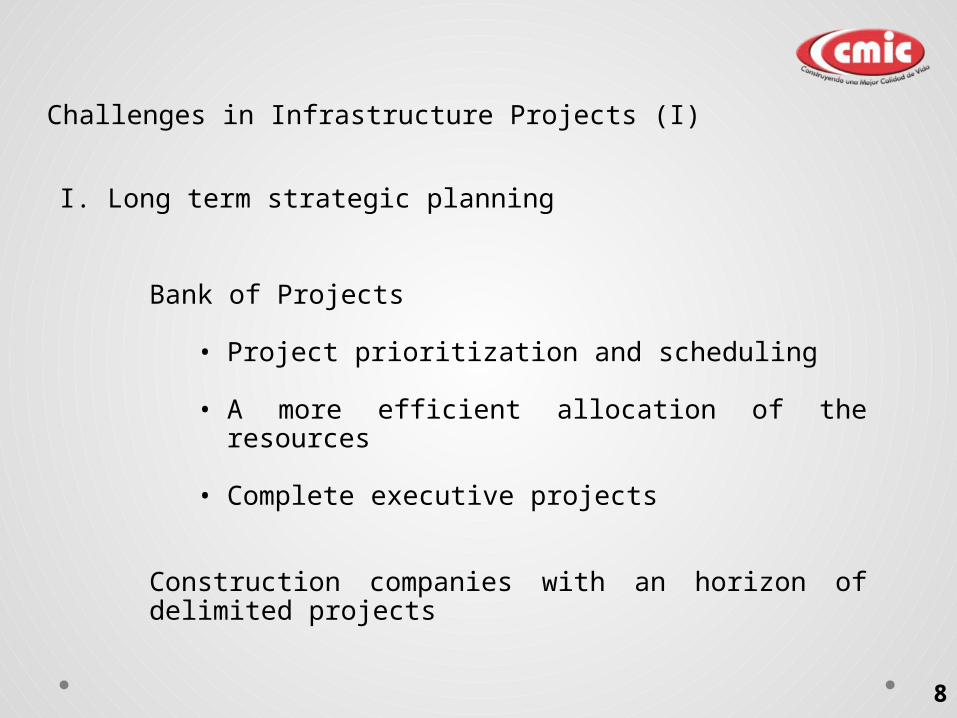
Challenges in Infrastructure Projects (I)
Bank of Projects
• Project prioritization and scheduling
• A more efficient allocation of the resources
• Complete executive projects
Construction companies with an horizon of delimited projects
I. Long term strategic planning

9
Challenges in Infrastructure Projects (II)
II. More efficient operation
• Coordination amongst governmental offices and responsible entities.
• Reduce procedures and requirements.
• Investment developer regulations (PPPs).

10
Challenges in Infrastructure Projects (III)
III. Easier access to competitive financing
• Worldwide competitive interest rates
• Reduction of requirements
• Reasonable guarantees
• Emphasize the project, not only the constructor
11
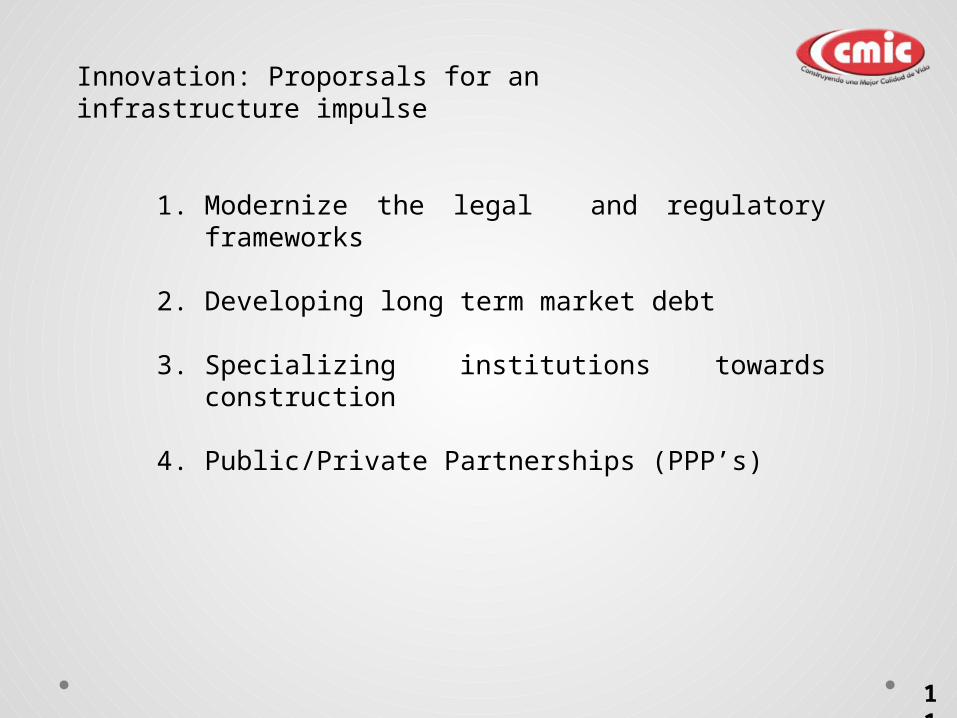
Innovation: Proporsals for an infrastructure impulse
1. Modernize the legal and regulatory frameworks
2. Developing long term market debt
3. Specializing institutions towards construction
4. Public/Private Partnerships (PPP’s)

The Americas Position …
CMIC Presentation to the North American Construction
Federation Conference
Oaxaca, OaxacaMexico
August 17-20, 2011
Insfraestructure Situation

14
Competitiveness in infrastructure
1 = Best position139= Worst position
1 = Best position139= Worst position
Source: Economics and Financing Management with World Economic Forum information.
*
2006 2007 2008 2009 2010
12
6 7 8
15
2006 2007 2008 2009 2010
13
86
79
United States: competitiveness decreased from 12 to 15United States: competitiveness decreased from 12 to 15
Canada: competitiveness increased from 13 to 9Canada: competitiveness increased from 13 to 9
1= Best position139= Worst position
1= Best position139= Worst position

Baluarte Bridge Durango-Mazatlán Highway
• The longest braced bridge in America (in construction).
• Located in the borderline of Durango and Sinaloa
• Length 3,688 ft, height over the hill 1,293 ft.
3. Technologic Innovation in Infrastructure
15
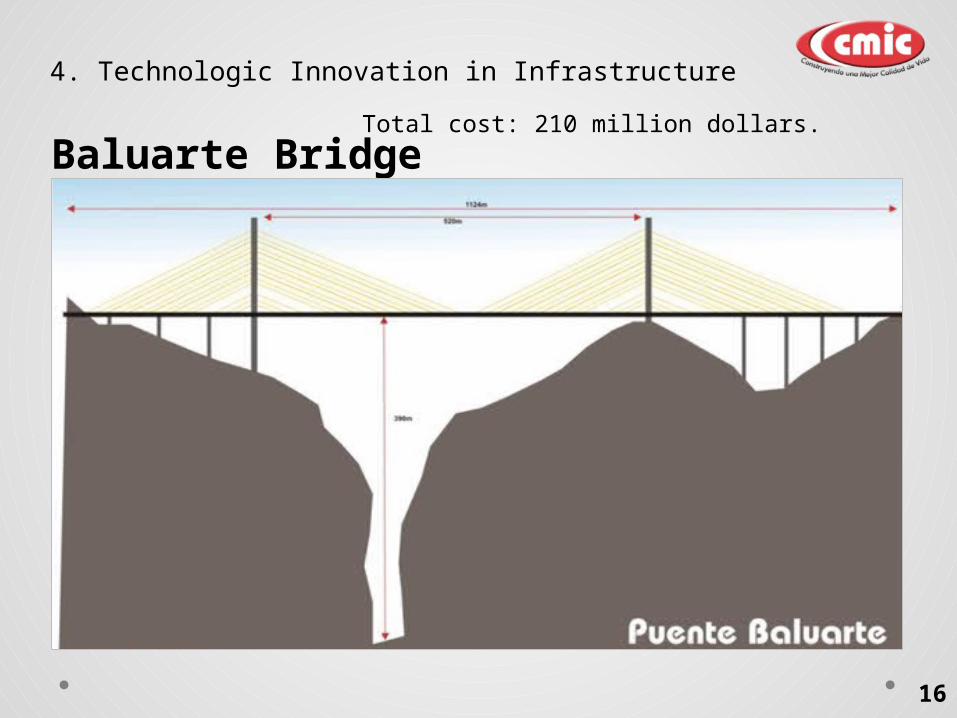
Baluarte Bridge
4. Technologic Innovation in Infrastructure
16
Total cost: 210 million dollars.
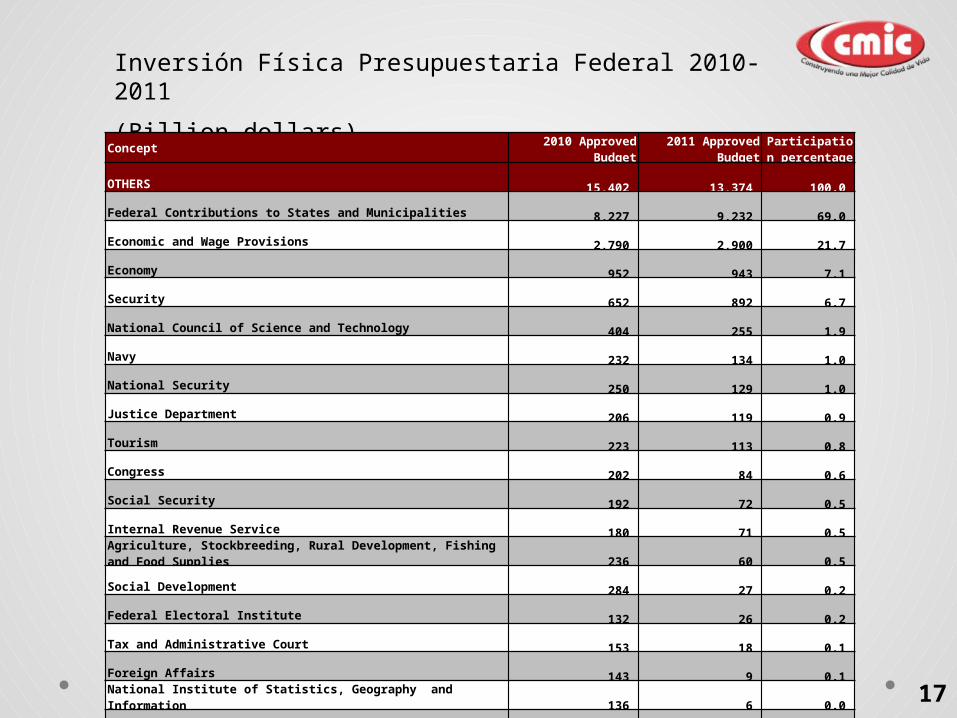
Inversión Física Presupuestaria Federal 2010-2011
(Billion dollars)
Source: Mexican Internal Revenue Service (SHCP).
Concept 2010 Approved Budget
2011 Approved Budget
Participation percentage
OTHERS 15,402 13,374
100.0
Federal Contributions to States and Municipalities 8,227 9,232
69.0
Economic and Wage Provisions 2,790 2,900
21.7
Economy 952 943
7.1
Security 652 892
6.7
National Council of Science and Technology 404 255
1.9
Navy 232 134
1.0
National Security 250 129
1.0
Justice Department 206 119
0.9
Tourism 223 113
0.8
Congress 202 84
0.6
Social Security 192 72
0.5
Internal Revenue Service 180 71
0.5 Agriculture, Stockbreeding, Rural Development, Fishing and Food Supplies 236 60
0.5
Social Development 284 27
0.2
Federal Electoral Institute 132 26
0.2
Tax and Administrative Court 153 18
0.1
Foreign Affairs 143 9
0.1 National Institute of Statistics, Geography and Information 136 6
0.0
Executive 134 6
0.0
Internal Affairs 144 4
0.0
National Commission of Human Rights 133 4
0.0
Federal Attorney 148 3
0.0
Public Services 132 3
0.0
Agrarian Court 132 2
0.0
Executive’s Law Counsel 132 0
0.0
Agrarian Reform 134 -
-
Social Security Contributions 157 -
-
Social Security Contributions of Civil Servants 131 -
- Education and Health -1,572 -1,739 -13.0
17