infrastructure, incentives and institutions...infrastructure, incentives and institutions nava...
TRANSCRIPT

NBER WORKING PAPER SERIES
INFRASTRUCTURE, INCENTIVES AND INSTITUTIONS
Nava AshrafEdward L. Glaeser
Giacomo A.M. Ponzetto
Working Paper 21910http://www.nber.org/papers/w21910
NATIONAL BUREAU OF ECONOMIC RESEARCH1050 Massachusetts Avenue
Cambridge, MA 02138January 2016
The authors are extremely grateful for research support from the International Growth Centre. Glaeseracknowledges financial support from the Taubman Center for State and Local Government and theRappaport Institute for Greater Boston. Ponzetto acknowledges financial support from the SpanishMinistry of Economy and Competitiveness (RYC-2013-13838), the Government of Catalonia (2014-SGR-830)and the Barcelona GSE. Edgar Escobar and Jitka Hiscox provided excellent research support. Thispaper was written for the 2016 American Economics Association Papers and Proceedings. The viewsexpressed herein are those of the authors and do not necessarily reflect the views of the National Bureauof Economic Research.
At least one co-author has disclosed a financial relationship of potential relevance for this research.Further information is available online at http://www.nber.org/papers/w21910.ack
NBER working papers are circulated for discussion and comment purposes. They have not been peer-reviewed or been subject to the review by the NBER Board of Directors that accompanies officialNBER publications.
© 2016 by Nava Ashraf, Edward L. Glaeser, and Giacomo A.M. Ponzetto. All rights reserved. Shortsections of text, not to exceed two paragraphs, may be quoted without explicit permission providedthat full credit, including © notice, is given to the source.
Infrastructure, Incentives and InstitutionsNava Ashraf, Edward L. Glaeser, and Giacomo A.M. PonzettoNBER Working Paper No. 21910January 2016JEL No. H41,I18,N91,O18,O21,R53
ABSTRACT
Cities generate negative, as well as positive, externalities; addressing those externalities requires bothinfrastructure and institutions. Providing clean water and removing refuse requires water and sewer pipes,but the urban poor are often unwilling to pay for the costs of that piping. Standard welfare economicsteaches us that either subsidies or Pigouvian fines can solve that problem, but both solution are problematicwhen institutions are weak. Subsidies lead to waste and corruption; fines lead to extortion of the innocent.Zambia has attempted to solve its problem with subsidies alone, but the subsidies have been too smallto solve the “last-mile problem” and so most poor households remain unconnected to the water andsewer system. In nineteenth-century New York, subsidies also proved insufficient and were largelyreplaced by a penalty-based system. We present a model that illustrates the complementarity betweeninfrastructure and institutions and provides conditions for whether fines, subsidies or a combinationof both are the optimal response. One point of the model is that the optimal fine is often not a draconianpenalty, but a mild charge that is small enough to avoid extortion.
Nava AshrafHarvard Business SchoolBaker Library 443Soldiers FieldBoston, MA 02163and [email protected]
Edward L. GlaeserDepartment of Economics315A Littauer CenterHarvard UniversityCambridge, MA 02138and [email protected]
Giacomo A.M. PonzettoCREI, Universitat Pompeu Fabraand Barcelona GSEC/ Ramon Trias Fargas, 25-2708005 [email protected]
2
I. Introduction
The cities of the West were once places of death. Nearly eleven thousand died in London’s cholera epidemic of 1854;1 1,137 died in New York’s cholera epidemic of 1866 (Condran 1995, 29-35). Today, life expectancies in New York are three years longer than in the rest of the country. Density generates negative, as well as positive, externalities. In the popular mind, the transition from urban illness to health is linked to great infrastructure achievements, like New York’s Croton Aqueduct or Haussmann’s Parisian Sewers. This received lesson of engineering triumphalism has led towards an infrastructure-intensive approach towards health in developing-world cities, including the Millennium Challenge Corporation’s 350 million USD investment in water infrastructure in the city of Lusaka. Yet, engineering alone did not bring health to the cities of the West. New York’s 1866 cholera epidemic occurred twenty-five years after Croton brought clean water to the city from upstate New York. Poorer New Yorkers didn’t care that clean water was flowing. They weren’t willing to pay the connection fees that would have brought piped water directly to their homes. They weren’t even willing to walk to the free hydrants that distributed water to poorer areas. They opted for the nearer, dirtier water that could be tapped from shallow wells. Engineering alone is similarly unlikely to eliminate the downsides of density in the developing world today. The core problem with health-related infrastructure in the developing world is that the average cost of this infrastructure exceeds private willingness to pay. If the infrastructure generates significant health externalities, then standard economic reasoning suggests the need for either Pigouvian penalties or subsidies. But the ability to impose penalties fairly and effectively depends on institutional strength. The ability to run a subsidized sewer system without massive waste and corruption also requires executive competence. The efficacy of new infrastructure therefore depends significantly on institutional strength, in either the judicial or the executive branch of government. In the second part of this paper, we present a simple model where a service is provided either by a cheap unhealthy individual technology or an expensive, sanitary collective technology. The choice between individual and collective technologies is present in water (shallow wells vs. piped water), sewage (pit latrines vs. a sewage system), and many other public services. We focus on the case in which the individual service is privately, but not socially optimal, because of the negative externalities associated with contagious water-borne diseases like cholera. Adoption can be encouraged either with fines imposed on non-adopters or with subsidies for adoption or both, but weak institutions make either approach costly. We assume that subsidies generate waste and corruption that decrease with institutional strength in the executive branch of government. We assume that fines lead to bribery and extortion that decrease with institutional strength in the judicial branch of government. The choice between fines or subsidies therefore depends on the relative weakness of the courts and police versus the executive branch of government.
1 Cholera and the Thames. 2016. “1853–1854.” Accessed January 11, 2016. http://www.choleraandthethames.co.uk.

3
When the executive branch is strong and the courts are weak, then subsidized water and sewers are optimal. When the judicial branch is strong and the executive branch is weak, then robust fines reduce social costs. When both branches are reasonably weak, then a combination of fines and subsidies is optimal. When both branches are extremely weak, then there is no option but to give up on infrastructure altogether and live with the terrible consequences for health and mortality. One major theme of the model is that Becker’s (1968) emphasis on large fines (to avoid detection costs) may be incorrect in a world of weak institutions. As Friedman (1999) emphasized, overly large penalties invite bribery and extortion. In our model, the optimal fine is often just small enough to avoid extortion of the innocent. When that fine cannot induce adoption of the clean technology on its own, then it is necessary to supplement it with subsidies. A second theme is that property rights make it easier to create social obligations. A standard problem with ill-defined property rights is that individuals lack the incentives to improve their property. A secondary problem, which appears in our model, is that it is harder to have effective sanctions if inspectors can’t learn who actually has legal responsibility for a residence. In Western history, property ownership has long combined rights and obligations, so perhaps it is unsurprising that weak property rights make it harder to address negative externalities. In Section III, we turn to the history of clean water and mortality in nineteenth-century New York City. New York built its engineering marvel the Croton Aqueduct in 1842, but mortality didn’t start dropping until twenty-five years after the waters began to flow. The Croton system included subsidized water, but the city was unwilling to spend enough to ensure that poorer New Yorkers stopped using their shallow wells. Moreover, the city did little to eliminate the terrible build-up of sewage in poorer areas. The post-1866 solution included a combination of penalties and institutional reform. After 1866, the Metropolitan Health Board was established, which was independent of city government. State law required that the board include a number of health professionals. Health inspectors enforced rules that required connections to the water and sewage system, and gradually the city became healthier. In Section IV, we turn to modern Zambia, which has also suffered from regular, repeated cholera outbreaks. Just like New York prior to 1866, Zambia has primarily attempted to subsidize its way to clean water. Typically, water pipes are provided in poorer areas. There has been significant subsidy of primary water and sewage infrastructure, often paid for by international entities. Yet, Lusaka has experienced a terrible “last-mile problem,” just like New York prior to 1866. Poorer Zambians choose not to pay for the connection to the water and sewage system. The government is unwilling to provide the subsidies needed to ensure universal connection to the system. Engineering is not enough. If Lusaka’s infrastructure is going to be fully effective, its citizens need to be either bribed or nudged to connect to the system. This will require more effective institutions, either to ensure that a subsidy-based system is not wildly wasteful or that a fine-based system does not lead to wholesale abuse. Quite possibly, the optimal system for the short run will involve a mixture of very mild sanctions and significant subsidy.

4
II. A Simple Model
We now present a simplified version of the lengthier infrastructure and institutions model in Ashraf, Glaeser and Ponzetto (2016). This model examines the decision to switch from a cheaper, less expensive technology to a safer, more expensive technology. The switch is publicly beneficial, but not privately optimal without either a Pigouvian penalty or subsidy. Institutional weaknesses challenge the implementation of either sanctions or subsidies. We are particularly focused on the adoption of better water and sewage technologies, but the structure of the model applies to almost any externality-creating action, such as open street defecation. Like many public services, water and sewage can be provided either individually or collectively, and this is true in both the wealthy and the poor worlds. Some American suburbanites drink water from their own wells and deposit sewage in their own septic tanks, while others drink water piped in from a common reservoir and send their sewage to far-flung treatment plants. Water and sewage are not the only public services with both a collective and an individual option. In Chicago, individuals can drive or take mass transit. In Rio de Janeiro, the poor are housed either in self-constructed slums or in large public housing projects. In Johannesburg, poor parents choose between a large public school system and small, extremely low-cost, private alternatives. In the case of water, sewage and driving, there can be significant negative externalities associated with using the individual rather than the collective technology. The two technologies create two types of costs: the physical costs of infrastructure adoption and the health costs of disease. Individuals attempt to minimize the sum of these costs. We assume that the physical adoption cost of the collective technology per user is c+k/N, where N reflects the number of users of the technology. There is a fixed cost k that is shared across the N users and a marginal cost c for each addition user. We assume that the technology is priced at average rather than marginal cost for our benchmark no-subsidy, no-penalty case. The adoption cost of the alternative technology is normalized to zero. Health costs come only from the individual technology, which can directly infect users. Those direct infections can spread across the community, generating a negative externality that also afflicts the users of the collective technology. We assume that the negative externalities connected to the individual technology increase with density, both because the probability of initial infection increases and because the rate of transmission across individuals is higher in dense areas. Wells and septic tanks are perfectly safe technologies when homes are surrounded by several acres. When one hundred households live on a single acre, waste can easily pollute drinking water with potentially horrendous health consequences.
The collective technology generates health costs of ( )DawHC
, on the user, where w is the wage, a reflects the share of people adopting the collective technology and D reflects the density level. The health costs are proportional to the value of time, and while Ashraf, Glaeser and Ponzetto (2016) explicitly model income inequality, here we assume that individuals are homogeneous. The variable D also equals the area-wide population since we normalize the land area to one. The health costs of the individual technology equal ( )DawH
I, , which is always greater than
( )DawHC
, .

5
We normalize ( )DHC
,1 to zero, so there is no disease when there is complete adoption of the collective technology. We assume that health costs are falling with a and rising (weakly) with D. Ashraf, Glaeser and Ponzetto (2016) derive these health costs from a Susceptible-Infected-Recovered (SIR) model (Kermack and McKendrick 1927). This structure implies that
( ) ( )[ ] 0,, >∂−∂ aDaHDaHCI
. When a is low, secondary infection afflicts users of both technologies, but when a is high the health costs primarily reflect direct infection, which occurs only with the individual technology.
We let B denote ( ) DkcDwHI
−−,0 , which represents the per capita benefits of total adoption of the collective technology relative to total non-adoption. We assume that density and health costs are high enough that this benefit is positive. We also let G denote ( )DwHDkc
I,1−+ , which is
the gap between average cost and private benefit at the point of full adoption. If G ≤ 0, then a no-subsidy equilibrium exists with full adoption. If the collective technology is supplied by a utility that charges average costs, then it is always possible to be trapped into a non-use equilibrium, since the average cost for the first user is essentially infinite. We assume that the government can coordinate so that if a better equilibrium exists, it will occur. We also restrict our attention to cases where G > 0, which means that some government intervention beyond coordination is needed to ensure adoption. Our interest is not in the externality from adoption, but rather in the difficulties that occur when weak governments try to correct externalities. For example, the simplest means of ensuring adoption is to use taxes to subsidize adoption. The minimum effective subsidy equals G. But we add the assumption that subsidies are not costless, either because the tax system is distortionary, or because subsidies weaken the incentive to cost-minimize by the infrastructure builder, or because a subsidized system will be corrupt, or because allowing subsidies in one area, like water, means opening the floodgates for subsidies in other areas that are socially wasteful. To capture these costs we assume that the social cost of subsidies equals 1+δ times the subsidy amount.
Hence, full adoption with subsidies dominates no adoption and only if BGδ > . Routine calculations then prove the following result.
Proposition 1. There exists a level of government corruption (δ) denoted NS
δ ~ at which social losses from non-adoption are equal to social losses from subsidized adoption. If δ is greater than
NSδ ~ , then the losses are higher from subsidized adoption and if δ is less than
NSδ ~ , then the social losses are higher from non-adoption. The value of
NSδ ~ is increasing in
w and D and decreasing in k and c.
Proposition 1 tells us that subsidized infrastructure is desirable only when the level of waste and corruption created by the subsidies is limited. The proposition also suggests that subsidized infrastructure becomes more desirable when wages and density are high and when the costs of infrastructure are low.
II.A. Subsidies vs. Penalties
Most recent discussion of clean water in developing-world cities has focused on subsidies, but that wasn’t largely the path to healthier cities in the West. As we discuss in the next section, New

6
York City became healthier partly by imposing penalties on non-adoption. To consider the tradeoff between subsidies and penalties, we now introduce a second public technology: fining individuals who use the individual technology. We assume two potential costs of this penalty technology. First, there is an administrative cost of g per household. Second, if individuals pay bribes to inspectors, there is a social cost of z times the bribe level. The social cost of bribery reflects the possibility that the welfare function does not fully internalize the benefits received by corrupt policemen and that their wages do not fall perfectly with bribes received. The technology of inspection involves a probability µ that a property will actually be inspected, and a probability φ that the owner can be identified. This second parameter is meant to capture the obvious difficulties in enforcing penalties against slum dwellers whose property rights are poorly defined. If the owner is not identified, he cannot be fined.2 Historically, property ownership has conferred both rights and obligations, and cities without property ownership will face extra challenges in reducing externalities. If the owner is found, then the inspector can accuse him of violating the regulations. If no accusation is made, then nothing happens. If an accusation is made, then the accused must pay F if he is convicted and nothing if he is not convicted. We assume that courts commit symmetric type-I and type-II errors that are summarized by a parameter A > 1 that captures the institutional strength of the judiciary. With identical probability 1/(1+A) the court wrongly convicts the innocent and wrongly acquits the guilty. The inspector receives a small benefit of bF for each accusation that leads to a conviction and pays a cost of i for each accusation that leads to acquittal. We also consider i to be a second indicator of institutional strength. The inspector may solicit a bribe to drop the charge with a take-it-or-leave-it offer, and if the accusation threat is credible then the bribe demand will be met as long as it is not greater than the expected cost of going to court. An accusation threat is credible if and only if the expected value of going to court to the inspector is strictly positive. The threat of false accusations is credible only if bF > Ai, and hence Ai/b is the maximum fine that avoids false accusations and the extortion of the innocent. Since social costs are piecewise linear in the size of the fine with a break at Ai/b, the optimal fine to induce full adoption can be either the minimum of zero, or Ai/b, or a fine level that is high enough to ensure adoption with no subsidies, which can lie above Ai/b if A is too low. We use the notation biµφ=Π , where Π is a summary measure of policing capacity.
We characterize the optimal strategy as a function of A (judicial quality) and δ (an inverse measure of executive quality). We rely on three distinct values of A:
( )[ ] ( )BBgGgGgGA ΠΠ++= 24 , ( )gBzGA −+= 1 , and ( )[ ] ( )ΠΠ++= 24*GGGA . Imposing
a fine of Ai/b and subsidies can be optimal only if A is greater than A . Pure fines are better than non-adoption if and only if A is greater than A . A fine of Ai/b or less can insure adoption without subsidies if and only if A is greater than *A . Our parameter assumptions, which follow, imply that *1 AAA <<< .
2 This point echoes Glaeser and Shleifer’s (2001) emphasis on observability in designing the appropriate response to a negative externality.

7
We rely on four cutoffs for δ: GBδNS
=~ , ( ) ( )( ) ( )[ ]2~ 11 AAGAgBAδ
NFΠ−++−= ,
( ) ( ) ( )[ ]( ){ }111 2~ −Π−++= AAAGAzGAδ
EF and ( ) ( ) ( ){ }GgAAgAδ
FS,1max 2
~ Π+= . Pure subsidies dominate non-adoption if and only if δ is less than
NSδ ~ . A fine that doesn’t generate extortion of
the innocent plus subsidies (as needed) dominate pure subsidies if and only if δ is greater than ( )Aδ
FS~ , which reaches its minimum of g/G if and only if *AA ≥ . Pure fines dominate fines plus subsidies if and only if δ is greater than ( )Aδ
EF ~ . Non-adoption dominates fines plus subsidies if and only if δ is greater than ( )Aδ
NF ~ .
While we consider the full range of cases in Ashraf, Glaeser and Ponzetto (2016), here we choose a particularly illustrative range of parameter values to showcase our main results. Specifically, we assume that Π>G2 , ( )[ ]Π++Π−Π+>>Π 4222 GGGGzgBgG and
3 24311 GGgz Π−Π+≥ . Then the following result holds.
Proposition 2. The optimal policy as a function of legal and executive quality is the following.
1. No adoption if AA < and NS
δδ ~> , or if AAA << and ( )AδδNF ~> .
2. Subsidies alone if AA < and NS
δδ ~< , or if AA > and ( )AδδFS~< .
3. Fines alone with equilibrium extortion of the innocent if *AAA << and ( )AδδEF ~> .
4. Fines that do not generate extortion plus subsidies if AAA << and ( ) ( )AδδAδ
NFFS ~~ << , or if *AAA << and ( ) ( )AδδAδEFFS ~~ << . Fines that do not
generate extortion without subsidies if *AA > and ( ) GgAδδFS
/~ => .
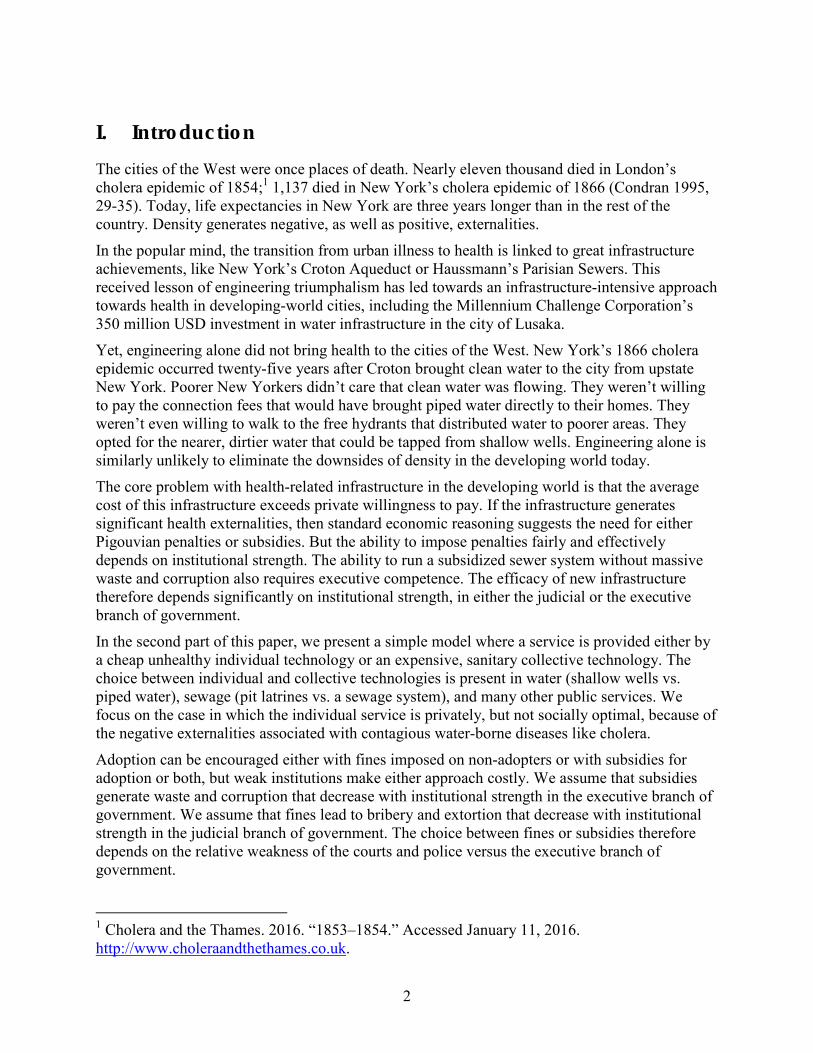
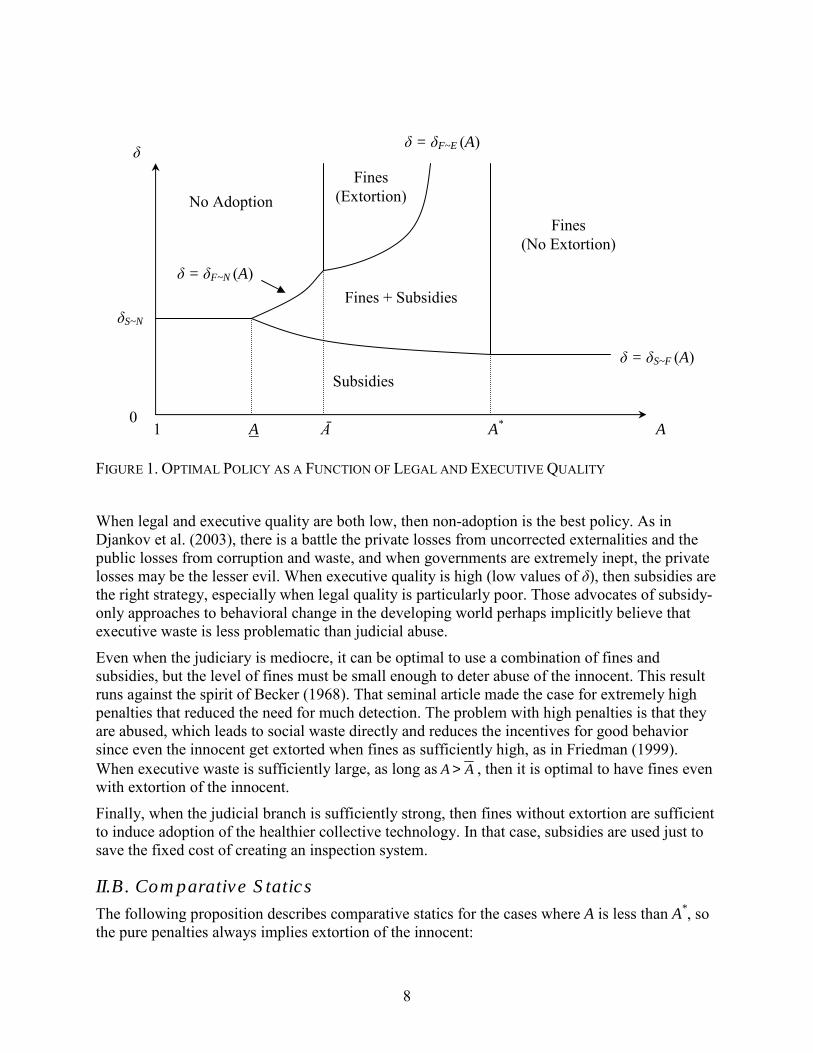
These results are summarized in Figure 1.
8
FIGURE 1. OPTIMAL POLICY AS A FUNCTION OF LEGAL AND EXECUTIVE QUALITY When legal and executive quality are both low, then non-adoption is the best policy. As in Djankov et al. (2003), there is a battle the private losses from uncorrected externalities and the public losses from corruption and waste, and when governments are extremely inept, the private losses may be the lesser evil. When executive quality is high (low values of δ), then subsidies are the right strategy, especially when legal quality is particularly poor. Those advocates of subsidy-only approaches to behavioral change in the developing world perhaps implicitly believe that executive waste is less problematic than judicial abuse. Even when the judiciary is mediocre, it can be optimal to use a combination of fines and subsidies, but the level of fines must be small enough to deter abuse of the innocent. This result runs against the spirit of Becker (1968). That seminal article made the case for extremely high penalties that reduced the need for much detection. The problem with high penalties is that they are abused, which leads to social waste directly and reduces the incentives for good behavior since even the innocent get extorted when fines as sufficiently high, as in Friedman (1999). When executive waste is sufficiently large, as long as AA > , then it is optimal to have fines even with extortion of the innocent. Finally, when the judicial branch is sufficiently strong, then fines without extortion are sufficient to induce adoption of the healthier collective technology. In that case, subsidies are used just to save the fixed cost of creating an inspection system.
II.B. Comparative Statics
The following proposition describes comparative statics for the cases where A is less than A*, so the pure penalties always implies extortion of the innocent:
A
δ
1 A*
δ = δS~F (A)
δS~N
Ā 0
δ = δF~E (A)
δ = δF~N (A)
Fines (No Extortion)
Subsidies
No Adoption
Fines + Subsidies
Fines (Extortion)
A

9
Proposition 3. Suppose that judicial effectiveness is limited (A < A*). 1. As the social costs of corruption decline (z falls), then a pure penalty regime becomes
more appealing (∂δF∼E/∂z > ∂δS∼F/∂z = 0 and ∂Ā/∂z > ∂δS∼N/∂z = ∂δF∼N/∂z = 0).
2. As policing capacity (Π) increases, then the combination of subsidies and small penalties becomes more appealing (∂δF∼E/∂Π > 0 > ∂δS∼F/∂Π and ∂δF∼N/∂Π > ∂δS∼N/∂Π = ∂Ā/∂Π = 0).
3. As the fixed cost of inspections (g) increases, then penalties become less appealing, both relative to pure subsidies (∂δS∼F/∂g > ∂δF∼E/∂g = 0) and relative to non-adoption (∂Ā/∂g > ∂δS∼N/∂g = 0 > ∂δF∼N/∂g).
4. Increases in the cost of the collective technology and decreases in income and density cause the benefits of the collective technology to fall (∂B/∂k < 0, ∂B/∂c < 0, ∂B/∂w > 0 and ∂B/∂D > 0), cause the subsidy required to support adoption to rise (∂G/∂k > 0, ∂G/∂c
> 0, ∂G/∂w < 0 and ∂G/∂D < 0) and make non-adoption more appealing (∂δF∼N/∂B > ∂δS∼N/∂B > 0 > ∂Ā/∂B and ∂Ā/∂G > 0 > max{∂δS∼N/∂G, ∂δF∼N/∂G}).
5. If full adoption is nonetheless optimal, supporting it with extortion-inducing penalties alone becomes more appealing as the collective technology becomes more expensive or if income or density falls (∂δF∼E/∂G < 0 and ∂δS∼E/∂G < 0).
The first three comparative statics suggest what the graph already suggests, and the results are more general than the parameter assumptions we make here: the appeal of penalty regimes depends on the quality of the judicial system. When courts are worse, penalties are less appealing. If weak property rights make it difficult to find property owners, then penalties have less appeal. If inspections are more expensive then penalties are less appealing. The second two sets of comparative statics tell us that non-adoption becomes more appealing as incomes or density levels decrease. Penalties then also become more appealing, assuming that non-adoption isn’t optimal, because the subsidies needed to ensure adoption increase. We can also characterize the second-best scenario of unlimited judicial effectiveness.
Proposition 4. It becomes easier to ensure adoption with penalties and no extortion when policing capacity is higher (∂A*/∂Π < 0), when the collective technology is cheaper, or when income or density is higher (∂A*/∂G > 0). When judicial effectiveness is no constraint (A ≥
A*), subsidies become more appealing when inspections are costlier (∂δS∼F/∂g > 0), when the
collective technology is cheaper, and when income or density is higher (∂δS∼F/∂G < 0).
Good judges and courts make it possible to ensure full adoption without extortion. In that case, fines are never imposed in equilibrium, so the only cost of the judicial approach is the fixed cost of inspections and this is weighed against the waste due to the subsidy. Factors that make the needed subsidy smaller, like higher incomes and density levels or lower technological costs, make the penalty approach less appealing. This model emphasizes the strong complementarity between infrastructure and institutions. When institutions are weak, infrastructure costs can go far beyond the technological costs. If adoption is ensured only through subsidies, then the country must face the full waste involved in

10
a regime of subsidies. If adoption is ensured through penalties, then society must face the costs of corruption and extortion of the innocent. Capable judicial institutions make it possible to enforce good behavior with a simple penalty regime that is unused in equilibrium, which makes the case for infrastructure much stronger.
II.C. Two Extensions: Migration and Inequality
In the longer version of this model, we introduce migration and inequality. With income heterogeneity, the rich may well adopt while the poor do not. From the perspective of the rich, therefore, added adoption by the poor carries both a positive health externality and the possibility of sharing the fixed costs of the infrastructure. If the rich pay most of the taxes, then they typically prefer to induce the poor to adopt with penalties rather than subsidies. The poor may even be worse off with penalties than with non-adoption, but they will certainly be worse off with penalties than with subsidies if the rich pay for the subsidies. Adding migration strengthens the case for subsidies relative to penalties. With full adoption, there are no health externalities associated with density. More migrants, however, help share the fixed costs of the collective technology. Hence, on the margin it is more desirable to subsidize migrants than to deter them. Naturally, the subsidy required to ensure full adoption may be too large relative to the desirable subsidy to encourage migration. These results are fragile. For example, if there were still health costs from density even with full adoption, then it could be desirable to deter migration, which points to penalties rather than subsidies. If there are other externalities from congestion, then penalties look better than subsidies as well.
III. Disease and Infrastructure in Nineteenth-Century New York
Cholera once killed thousands across the world. Some estimate that hundreds of thousands of Indians died in the first cholera pandemic almost two centuries ago. Twenty thousand perished in Paris during the second pandemic during the 1830s. Chicago lost one-twentieth of its population in 1854 during the third cholera pandemic.3 Today, there are essentially no cholera deaths in the wealthy world. The elimination of cholera from western cities is a public health triumph, but the disease remains deadly in poorer parts of the world. According to World Health Organization statistics, there were 1,130 cholera deaths in Somalia in 2011. That country experienced even larger death totals in 2007, 1994, 1986 and 1985. Zimbabwe lost over 5,000 lives during the 2008-2009 cholera outbreak. In this section, we ask whether the fight against cholera in New York City during the nineteenth century holds lessons for the developing world today. Over 4,400 New Yorkers died of cholera in 1832 and 1834 during that second pandemic. During the third pandemic, 5,071 New Yorkers died in 1849 and 2,501 died in 1854 (Condran 1995, 29-35). Another 1,137 perished during the Fourth Pandemic in 1866, but that was the last great outbreak of water-borne disease in New
3 Rosenberg (1962) is the classic treatment of the American experience with cholera.

11
York (New York Department of Health 1917). Gotham’s subsequent plagues, including diphtheria, influenza and AIDS, were either air-borne or sexually transmitted.4 The reduction of water-borne contagious disease helped transform America’s cities from places where lives were unusually short to places where today life expectancies exceed those in rural America. How did New York City essentially eliminate water-borne death from its streets? Typically, the explanation emphasizes an engineering triumph: the Croton Aqueduct. For example, the official description of Koeppel’s (2000) fine book on the building of the Croton Aqueduct notes that a city of “filth, epidemics, and fires,” was “changed only when an outside water source was finally secured in 1842.”5 Even more stridently, in 1924, the director of the Museum of the City of New York wrote that “the year 1842 marked what was perhaps the greatest forward stride in the city’s history—the general introduction of running water” (Brown 1924, 83). That great forward stride may have been missed by the over 7,500 New Yorkers who died of Cholera in the decade after 1842 (Condran 1995). Indeed, the timeline of New York City mortality statistics shows no sharp break in 1842 and no visible trend change after that date. Death rates were high for another quarter century after the engineering marvel brought clean water 41 miles from upstate. Why didn’t the Croton Aqueduct visibly reduce mortality during the first quarter century after it opened? New York City had its own version of the last-mile problem that afflicts most developing countries today. Water was available, but in-house piping and sewers were expensive. The free, clean water that Croton supplied was often distant. Consequently, poorer families continued to use shallow wells and to pour their waste and excrement into wood-lined privies that infected those wells. The landmark 1865 Report of the Council of Hygiene and Public Health of the Citizens’
Association of New York contains written reports on each ward two decades after the Croton Aqueduct opened. In poorer wards, “the use of water from wells into which the putrid soakage of filth had percolated, are clearly proven to be the causes of the diarrheal diseases of that district;” “in some of these houses the Croton-water and waste-pipes have been introduced, but in most of them the Croton-water is introduced only to the court-yard, or area;” and “where the Croton hydrants are too far away, and the ground is marshy, the water is obtained from holes dug a little below the surface” (Citizens’ Association of New York 1865, cviii, 25, 300). Stephen Smith, a prime mover behind the report, would later recount an 1865 outbreak of diarrheal disease that could be linked to a nearby well which was inspected and found to be poisoned by organized matter leaked by a nearby privy or sewer (Smith 1911). Croton water was available but households often continued to use the deadly shallow wells, because of a combination of convenience and cost. The cost of connecting to Croton was $10 per household plus an annual water fee. The annual fee was not metered but was tied roughly towards predicted use. Consequently, there was always a problem of water wastage. Poorer households were provided free water by hydrants, but those hydrants only spread throughout the city gradually. By 1860, there were only 2,307 hydrants in New York, which 4 The source of New York’s polio epidemic of 1916 is still hotly debated, but it does not seem to have been water-borne. 5 Princeton University Press. 2015. “Water for Gotham.” December 28. http://press.princeton.edu/titles/6782.html.

12
came to about one for every ten acres. The 1865 Citizen’s Association Report indicates that even twenty years after the aqueduct opened, poorer households would often prefer the convenience of a nearby well to the inconvenience of traveling to get cleaner water. Ignorance surely also reduced the demand for Croton water. In 1865, the medical consensus linking disease and impure well water was just beginning to coalesce. John Snow’s famous “Ghost Map” linked a cholera outbreak with a well during the third cholera pandemic of 1854. His epidemiological opponent William Farr only conceded the point in 1866. We doubt that Snow’s hypothesis had made intellectual inroads into New York City tenements by the early 1860s. The wells were such a problem because New York’s sewage problem was so severe. The 1865 Citizen’s Association Report is replete with discussions of “accumulating” and “exposed” sewage made up of “putrefying organic materials” and “street-filth.” Again, the Croton Aqueduct system was meant to reduce the problem by providing sewers, but coverage was limited. There were only 107 miles of sewers in the city by 1860. Moreover, the Aqueduct charged for connecting to the sewer system, which meant that shanty-dwellers and tenement owners would continue to prefer privies for decades to come. New York was not blind to the downsides of being a city of filth. Just as the model suggests, reformers advocated for both fines and subsidies, and often the same person supported a combination of both. Moreover, as the model also suggests, reformers were often keen on institutional reform that would improve the quality of inspections and service delivery. John Griscom and Stephen Smith were two particularly ardent and important supporters of N.Y.C. public health improvements. Griscom had been health inspector of New York City in 1842, when he issued a path-breaking report on the city’s poor sanitary conditions that was expanded and published, with the support of Peter Cooper, in 1845. Griscom’s (1845) initial report supported subsidized (free) Croton water, which as we have seen was a significant part of the early system. Griscom also demanded an urban “health police” who would monitor sanitary conditions. If a tenement owner failed to fix unsanitary conditions, Griscom recommended that he should be fined $50 plus the cost of the public fixing the problem directly. Griscom’s report was ardently in favor of professionalizing the health inspectors and making them independent of the politicians who ran the city, and of the police who served the politicians. Stephen Smith actually realized Griscom’s dream by spearheading the campaign that established the Metropolitan Board of Health in 1866. The cholera outbreak that began in 1865—the first outbreak that occurred after medical professionals agreed on the water-borne nature of the disease—helped Smith make his case. The Board’s enforcement powers were tied to Tenement Acts, passed in 1867, 1879 and 1901, which imposed on property owners requirements relating to water provision, sewerage and ventilation. The Board had independent power to issue rules, such as its 1869 ban on pigs and goats in city streets. Legal requirements and penalties were more politically palatable because they were imposed on presumably wealthier property owners, not on the poorer tenants themselves. Naturally, standard economic logic suggests that tenants would ultimately pay the costs that were nominally paid by landlords, but such equilibrium effects are not always obvious to voters. Penalties applied to land owners provided a possible solution in New York because it was a city of renters and typically well-defined property rights. This solution is less likely to be available in the cities of the developing world, where property rights are poorly defined.
13
New York’s reforms were not merely about rules, fines and subsidies, but also about institutional change. The Health Board drew its power not from the city government, which was dominated by Tammany Hall, but from the Republican State Legislature, which meant effective political independence and power. The board also had designated seats for scientists and doctors, which may have strengthened its independence and acumen. Ultimately, the combination of infrastructure, institutions and incentives proved effective. By the 1920s, New York had become essentially as healthy as the nation as a whole because of the decline in contagious disease. Cutler and Miller (2005) find the clean water played a significant role in the decline urban mortality in 19th century America. We cannot directly apportion credit for New York’s declining mortality to any particular change, but there are several broad lessons that come out of the New York history. The most basic lesson is that infrastructure is necessary but not sufficient. The Croton Aqueduct did not eliminate cholera or other contagious diseases on its own. The infrastructure needed to be combined with incentives that changed behavior. Individuals needed incentives to switch to clean water and to start using sewers. The second point is that New York moved from subsidies (free hydrants) to fines. This move reflected a realization that subsidies were insufficient, at least at the scale that New York City was prepared to provide. Perhaps if the city had piped in water everywhere and provided free sewers then health problems could have been solved without fines, but the cost of the Aqueduct was a burden on city finances even given its more limited approach. Moreover, free water and sewers would have made the problem of water wastage, which was significant in the nineteenth century, even more severe. Free water would have also encouraged even more people to come to New York City. The third point is that the adoption of a fine system was accompanied by a move for institutional improvements. The Tweed Ring was in power when the Metropolitan Board of Health was put into place. Few would have had faith in a Tweed-run health operation, so the Board’s political independence was necessary. The Board was explicitly professional rather than political. Finally, both the Board and the Croton Aqueduct had a common institutional structure that would become a mainstay of nineteenth-century reformers: independent but public. Earlier attempts at clean water provision in New York City had tried private provision with the Manhattan Water Company and it was widely seen as a failure. Public, but independent, entities were seen as a model that could avoid both the pitfalls of profit-maximizers, who would put profits ahead of public health, and political machines, who would appoint political hacks who expected to work harder on political campaigns than on sanitation. Yet this model also has limitations, as parastatal enterprises in sub-Saharan Africa today are more often accused of corruption than competence.
IV. Disease and Infrastructure in Twenty-First–Century Zambia
Across sub-Saharan Africa over multiple decades, rapid urbanization and significantly increased population density generate both the promise of economic development and the threat of increased disease. With over 40% of the population living in urban areas, Zambia is one of the

14
most urbanized countries in sub-Saharan Africa. Its capital city of Lusaka has a population of over 1.8 million, and it is projected to grow to five million residents by 2035. Zambia has also been one of the world’s fastest growing economies over the past decade, with an average real GDP growth rate of 6.4% per annum. Despite this, however, Zambia continues to experience regular outbreaks of water-borne diseases in urban areas—the last cholera outbreak in Lusaka occurred as recently as 2013. Not only do such crises bring significant health problems, but the often dilapidated state of the system’s core infrastructure also forces Lusaka’s residents and businesses to waste substantial time resolving water supply shortages and delays, resulting in further lost productivity (Ashraf et al. 2016). Major piping infrastructure was built in Lusaka in the 1960s and 1970s, but the system’s core infrastructure assets are often outdated and broken. A baseline study in 2005 focused on the peri-urban areas. Approximately 70 percent of Lusaka residents have access to treated water supply, and only approximately 65 percent have access to waterborne sanitation (either through a connection to the network or with septic tanks). The study found that out of the approximately three million people surveyed, “four out of five people were found to live in areas close to utility networks, yet the majority were not being served by the utilities” (Blume et al. 2015, 25). This statistic suggests that while water and sanitation services are available, people don’t connect. This result echoes the Citizen’s Association Report on New York in 1865. This challenge of connecting households has been described as an example of the last-mile problem. The last-mile problem was first delineated in telecommunications, but it is relevant in any field where people, goods and services are moved across a network; the last mile is part of the network that serves individual consumers and where economies of scale have diminished (Rodrigue et al. 2013, 111). It is also effectively the costliest part of the network and if it is owned by one entity, the entity has a natural monopoly over the network. In US telecommunications, this natural monopoly has forced the Federal Communications Commission to step in and create regulation requiring that the existing owners of the last mile of the network make it available for lease to other companies so that other companies can enter the market.6 Without overcoming the last mile of infrastructure connection, the benefits of the overall investment cannot be realized. In water and sanitation, the last-mile problem is typically associated with the cost of connecting homes to the water or sewer network. In nineteenth-century New York, the last-mile problem was caused by the high costs of household connections. For those who could not pay to connect, obtaining dirty water from ubiquitous shallow wells was far more convenient than obtaining free water from more distant hydrants. As is evident from the 1866 New York cholera death toll, the last-mile problem in water and sanitation is particularly poignant. If users do not connect to the water and sanitary infrastructure, the investment in the infrastructure does not yield the expected benefits and people die.
IV.A. History
Provision of water services in Lusaka has been complicated by the manner in which the city was urbanized. Until 1948, the legal framework did not view the African population as permanent residents of the city. This changed with the African Housing Ordinance of 1948 which allowed 6 Federal Communications Commission. 2015. “Telecommunications Act of 1996.” Updated May 14. https://transition.fcc.gov/telecom.html.
15
the African population to settle permanently on the outskirts of the city. The Private Locations Ordinance relaxed the existing building code so that the African population could build homes using cheaper methods. In urban neighborhoods, water services were communal and plot owners constructed latrines on their plots. These rule changes did not alleviate the housing shortage and people continued to settle in areas which were not designated for settlement. In 1957, it was estimated that as much as 44% of the total Lusaka population lived in illegal settlements, which were not included in the provision of water and sanitation services. By the time of independence in 1964, the new government had a major housing crisis on its hands (Mulenga 2003). In 1974, to pre-empt the looming public health crisis, the government passed the Improvement Area Act, which legalized the illegal settlements and made provisions for their gradual upgrading, including the provision of public services. However, this effort was thwarted by the economic crisis that began in 1975 with the drop of global prices of copper. Copper represented 95% of Zambian exports at the time (Fardi 1995). The economy spiraled into an economic downturn, the resulting cuts in government spending adversely impacted the water and sanitation sector, which had been until then almost exclusively financed with grants from the Government of Zambia (World Bank 1983, 9). After this point, there was an effort to wean the water and sewage service sector from government support. Just as in the nineteenth-century New York, economic realities forced a move away from subsidized services. Beginning in the 1970s, the water and sanitation interventions focused on rehabilitating the physical infrastructure. As in the case of New York, there was an understanding that institutional reform needed to accompany infrastructure investment. Unlike New York, international partners supported investment in both infrastructure and institutions, and dictated how and when tariffs were introduced. In the years 1975-1983, the World Bank had provided Zambia with $20 million for the Lusaka Squatter Upgrading and Sites and Services Project to expand the water and sewage infrastructure into the peri-urban areas and to improve the institutional capacity of the Lusaka Urban District Council (World Bank 1983, 9). The scope of the project included an expansion of the water and sewer network and upgrading of approximately 26,000 households (with access to communal taps). Another 1,000 plots were developed to contain homes with the possibility of private connections to water and sewer. However, while plot owners applied for their water connections, no connections had been made for sewer services at the time of the completion report (World Bank 1983, 12). This suggests that a project that cost about $53 million in 2015 dollars had little effect on sanitary conditions, because of the last-mile problem. The project also run into issues related to institutional capacity. Issuing property titles took a long time. Despite the fact that the water services were actively sought, the utility had mostly failed to collect water service fees. In the years 1982-1983, the collected fees represented only 10% of actual operational costs (World Bank 1992, 6). While our model suggested an active choice between subsidy and fee-for-service, the Zambian example suggests that sometimes subsidized, free services may be the only possible option. Charging fees was a new endeavor both for the provider and the customers, who were used to receiving these services at a subsidized rate, which was traditionally related to the income of the customer rather than actual costs of service provision (World Bank 1983, 9; World Bank 1992, 2). Until the Sites and Services project, the Lusaka District Urban Council, which was

16
responsible for water and sanitation services provision, was financed by grants from the Government of Zambia. The utility was unable to streamline the collection process and users often (unsurprisingly) preferred not to pay (World Bank 1992, 21-22). The subsequent projects funded by international partners focused on infrastructure rehabilitation, network expansion and institutional capacity building. In the Rural Water Supply Project (1983-1992), along with building physical infrastructure, the project focused on improving revenue accounting and collection through the technical training of accountants (World Bank 1992, 7). However, this component of the project failed; the Government of Zambia failed to provide the accounting personnel to be trained. These projects highlight how weak institutions bedevil attempts to provide decent infrastructure for water and sanitation. There was a general lack of clarity about the responsibilities of various government agencies in the water and sanitation sector. When copper prices fell, government funds dried up. There was also a lack of a strong legislative framework. Together, these institutional weaknesses prevented the water sector from advancing (Nyambe and Feilberg 2009, 130). Despite the interventions, the combination of a weakening economy, increasingly overcrowded peri-urban areas and poor water and sanitation had proven to be a fertile ground for cholera. While a smaller cholera outbreak was recorded in 1977, Zambia experienced a major outbreak followed between the years 1990 and 1993, with 13,154 cases reported in 1991 and 11,657 cases reported in 1992 (Nyambe and Feilberg 2009, 64).7 These outbreaks gave water and sanitation improvements a sense of urgency, which resulted in the Water and Sanitation Act of 1997. This act provided for a separate regulatory body, the National Water Supply and Sanitation Council (NWASCO), commercialization of the water and sanitation service delivery and the Devolution Trust Fund, which focused on the technical and financial support of solutions to the last-mile problem in the peri-urban areas (Nyambe and Feilberg 2009, 135). The objective of the reform was to foster financial sustainability of the utilities. However, various forms of subsidies remain. In communities where community water kiosks were installed, the community sets the water price (Nyambe and Feilberg 2009, 104). As of 2009, international partners provided 70 percent of the budget for the commercial utilities (Nyambe and Feilberg 2009, 127). However, these reforms did not eliminate the health dangers that still imperil Lusaka. Another major outbreak followed 10 years later, recording 2,529 cases and 128 deaths due to cholera. Water-related health problems seem likely to continue. In 2012, there were 22,000 sewer connections in Lusaka serving a population of more than 1.8 million. This has led to a major investment in 2012 by the U.S. government, through the Millennium Challenge Corporation, of $354,757,640 to create the Lusaka Water Sewage Sanitation Delivery project. 80% of this grant is to go towards infrastructure activity; the remaining 20% is distributed as 8% for institutional strengthening, 11% for program administration and audit, and 2% for monitoring and evaluation.
7 The contemporary history of cholera outbreaks in Lusaka is summarized by the World Health Organization’s (2011) “Cholera Country Profile: Zambia” (last updated February 3. http://www.who.int/cholera/countries/en/).
17
IV.B. Outlook
Given the experience of both Lusaka’s history in the twentieth century and New York’s experience in the nineteenth century, the proportion of attention and resources (including political resources) to spend on institutional development versus infrastructure appears quite important in determining whether the infrastructure investment will have its intended benefit. In the case of Lusaka, this is not an easy challenge. The Lusaka Water and Sanitation Company estimates the cost of connection at 960 USD, in an area where the average monthly income is approximately 440 USD. The last-mile problem remains in Lusaka, and it seems likely to continue unless the city finds a mean of using either sanctions or subsidies to close the gap between willingness and ability to pay and service cost. One force that may further reduce the willingness to invest in water and sewer connections is that current occupants do not actually own the property and will not reap the long-run benefits of their investment. The New York City history suggested that penalizing landlords can be more politically acceptable than penalizing tenants, but ill-defined property rights in Lusaka can make it difficult to know who has de facto control over a piece of land. As the model suggested, one major benefit of clear property rights is that this makes it possible to enforce social obligations. Interestingly, however, there is qualitative evidence from settlement projects in Lusaka that when building new concrete block homes on existing sites, families “chose the house design which allows two families to stay with shared services, making it possible for them to sub-let and recoup the additional expenditure through higher rents” (World Bank 1983, 13). This suggests that there is an underlying valuation of these services which can be recouped at least partially though market rents. Institutional reform, on the other hand, can take several paths. New York City history suggested three possible routes: an independent management team (the Metropolitan Health Board) accountable to a higher level of government, an independent monitoring system (health police) and professionalization of both groups. The value of independence is closely related to the “forbearance” problem highlighted by Holland (2016), in which local politicians choose not to enforce the law because they seek support from poorer supporters. In the Zambian context, this effect both increases the value of independence from local control and decreases the chance that independence will be politically possible. Just as in the case of nineteenth-century New York, it seems unlikely that local Zambian leaders will be willing to impose penalties on their neighbors. But unlike in nineteenth-century New York, local Zambian politicians seem empowered enough to block the loss to their power base that will come from a politically independent regulatory body. NWASCO was created in 1997 as an independent regulator to implement policy, with the Water Supply and Sanitation Act, which also devolved water supply and sanitation service provision to the Local Authorities and commercialized service provision. Soon after its establishment, NWASCO concentrated on developing the necessary tools to be used for regulation. Key staff realized that without such instruments, regulation would be ineffective. The tools fall into seven categories: licensing requirements, performance guidelines, information collection/analysis, subsidies, special service supervision (for problem-cases), benchmarking, and standard setting. The fundamental challenge is often described in NWASCO documents as one of “national funding for utilities whose tariffs are 30 percent below operating and maintenance expenses” (Mbilima 2008).

18
In addition to providing overall regulatory control, NWASCO engages part-time inspectors from across the country to monitor the water supply and sanitation service provision in their areas. Before being assigned responsibilities, they undergo intensive induction and training. Part time inspectors are thought to be effective in monitoring service provision because they are a part of the communities serviced by the monitored utility companies. The resulting data reports become the foundation for identifying baselines and determining performance trends. In order to promote public participation in the oversight process, “Water Watch Groups” were established, comprising 6 to 9 volunteer customers from a particular service area. These groups operate within the delegated powers and receive minimal financial support from NWASCO for transport and communication expenses. In principle, NWASCO functions as this independent oversight body, although learning from New York’s experience it presumably might benefit both from being accountable primarily to the national government but also by containing health professionals. The international donor community could be quite helpful in funding the education of this professional staff. In principle, international partners could also provide members of this “health board” who were observers, but not voting members, whose purpose was improving the health of urban settlements. The New York City notion of a separate “health police” may also have value in a Zambian context. The Lusaka police are already overburdened and they may lack both the incentives and the abilities to properly assess unhealthy living conditions. An independent inspection service might solve both problems. While Zambia has created part-time, community based inspectors hired by NWASCO as well as volunteer, community based “water watch groups”, the orientation of all of these actors is towards making sure that water and sewage services are provided without interruption from the government. They are not oriented towards ensuring the habitations meet health standards. Instead, the idea of a “health police force” is focused on the community itself, facilitating the understanding that each individual’s actions has significant spillovers on their neighbors. Individual economic decisions can have massive health consequences that affect the entire community, which puts the responsibility not only on the government to provide uninterrupted service but also on community members themselves to do all they can to connect to (and help each other connect to) the main—not only for themselves but for the health of their community. Although this is understood in the abstract, the institutions that are currently in place emphasize the role of the service providers. While it is certainly important to have sufficient auditing and oversight on service providers, designing institutions that underscore the nature of externalities within the community and each individual family’s role in the health of the community could significant improve health outcomes.
V. Conclusion
Health-related infrastructure, like water pipes and sewers, generates positive externalities. Consequently, even if the public benefit from that infrastructure exceeds its physical costs, those costs may still exceed private willingness to pay. The economist’s ancient answers to this problem—Pigouvian taxes or subsidies—become difficult to implement when institutions are weak. Hence, there is a fundamental complementarity between infrastructure and institutions that is central to improving quality of life in the developing world.

19
The model in this paper suggested that there are four possible responses to weak institutions and infrastructure needs. The optimal response depends on the relative strength of legal and executive institutions. If executive institutions are strong, then subsidized provision is optimal. A strong executive branch can run a subsidized water and sewage program without too much waste. But when executive institutions are weak, it becomes more natural to rely on fines that are imposed by the judicial branch of government. If judicial strength is high, then a pure fines system may be appropriate that charges people who don’t pay for connecting to the water and sewer system. This was the approach used by nineteenth-century New York, perhaps because its courts were more effective than Tammany-Hall–controlled City Hall. Notably, New York policed health crimes with independent inspectors, not with ordinary urban police. When both judicial and executive institutions are weak, then a mixed system becomes optimal. Fines are optimally low enough to avoid extortion of the innocent. Subsidies provide the remaining push to induce adoption of the healthier technology. If both types of institutions are extremely weak, non-adoption may be the only feasible response in the short run. In the long run, presumably the goal is to strengthen institutions to the point where adoption becomes reasonable. Zambia today has significant institutional capacity constraints. Their water system has relied primarily on subsidies, but the subsidies have been too small to solve the last-mile problem. This situation closely mirrors New York City prior to 1866. We suspect that inducing more widespread adoption of clean water will involve both greater subsidies and a sensible strategy for nudging non-adopters, which might include mild fines enforced by health inspectors, not city police. More generally, the water problem is a problem of both infrastructure and institutions. Well-defined property rights can make it much easier to enforce rules about sewers and water adoption. Density creates both positive and negative externalities and the downsides of density often expose the weaknesses of the public sector.
References
Ashraf, Nava, Edward L. Glaeser, Bryce Millet Steinberg, and Abraham Holland. 2016. “Water, Health and Wealth.” Unpublished. Ashraf, Nava, Edward L. Glaeser, and Giacomo A. M. Ponzetto. 2016. “Death in the City: Infrastructure vs. Incentives.” Unpublished. Becker, Gary S. 1968. “Crime and Punishment: An Economic Approach.” Journal of Political
Economy 76 (2): 169–217. Blume, Steffen, Daniel Nordmann, Dirk Schäfer, and Roland Werchota. 2015. Closing the Last
Mile for Millions: Sharing the Experience on Scaling up Access to Safe Drinking Water and
Adequate Sanitation to the Urban Poor. Eschborn: Deutsche Gesellschaft für Internationale Zusammenarbeit (GIZ). Brown, Henry Collins. 1924. Fifth Avenue Old and New, 1824–1924. New York, NY: Fifth Avenue Association.

20
Citizens’ Association of New York, Council of Hygiene and Public Health. 1865. Report of the
Council of Hygiene and Public Health of the Citizens’ Association of New York upon the
Sanitary Condition of the City. New York, NY: Appleton. Condran, Gretchen A. 1995. “Changing Patterns of Epidemic Disease in New York City.” In Hives of Sickness: Public Health and Epidemics in New York City, edited by David Rosner, 27–41. New Brunswick, NJ: Rutgers University Press. Cutler, David M. and Grant Miller. 2005. “The Role of Public Health Improvements in Health Advances: The Twentieth-Century United States.” Demography 42 (1): 1–22. Djankov, Simeon, Edward L. Glaeser, Rafael La Porta, Florencio Lopez-de-Silanes and Andrei Shleifer. 2003. “The New Comparative Economics.” Journal of Comparative Economics 31 (4): 595–619. Fardi, Mohsen A. 1995. “Zambia: Reform and Reversal.” In Restructuring Economies in
Distress: Policy Reform and the World Bank, edited by Vinod Thomas, Ajay Chhibber, Mansoor Dailami, and Jaume de Melo, 332–52. New York, NY: Oxford University Press. Friedman, David. 1999. “Why Not Hang Them All: The Virtues of Inefficient Punishment.” Journal of Political Economy 107 (S6): S259–69. Glaeser, Edward L., and Andrei Shleifer. 2001. “A Reason for Quantity Regulation” American
Economic Review 91 (2): 431–35. Griscom, John H. 1845. The Sanitary Condition of the Laboring Population of New York: With
Suggestions for Its Improvement. New York, NY: Harper. Holland, Alisha. 2016. “Forbearance” American Political Science Review, forthcoming. Kermack, William O., and Anderson G. McKendrick. 1927. “A Contribution to the Mathematical Theory of Epidemics.” Proceedings of the Royal Society A 115 (772): 700–21. Koeppel, Gerard T. 2000. Water for Gotham: A History. Princeton, NJ: Princeton University Press. Mbilima, Chola K. 2008. “Water Supply and Sanitation in Zambia: Reform and Regulation.” Proceedings of the Institution of Civil Engineers – Municipal Engineer 161 (4): 255–61 Mulenga, Chileshe L. 2003. “Lusaka, Zambia.” Case study for the United Nations Global Report
on Human Settlements 2003: The Challenge of Slums. Lusaka: Institute of Economic and Social Research, University of Zambia. http://www.ucl.ac.uk/dpu-projects/Global_Report/cities/lusaka.htm. New York Department of Health. 1917. A Monograph on the Epidemic of Poliomyelitis
(Infantile Paralysis) in New York City in 1916, Based on the Official Reports of the Bureaus of
the Department of Health. New York, NY: Brown. Nyambe, Imasiku A., and Feilberg, Miriam. 2009. “Zambia - National Water Resources Report for WWDR3.” Prepared as a contribution to the United Nations World Water Development
Report 3: Water in a Changing World. Lusaka: Ministry of Energy and Water Development of the Republic of Zambia. http://webworld.unesco.org/water/wwap/wwdr/wwdr3/case_studies/#Zambia.

21
Rodrigue, Jean-Paul, Claude Comtois, and Brian Slack. 2013. The Geography of Transport
Systems, third edition. New York, NY: Routledge. Rosenberg, Charles. 1962. The Cholera Years: The United States in 1832, 1849 and 1866. Chicago, IL: University of Chicago Press. Smith, Stephen. 1911. The City That Was. New York, NY: Allaben. World Bank. 1983. Zambia - Lusaka Squatter Upgrading and Site and Services Project. Washington, DC: World Bank. http://documents.worldbank.org/curated/en/1983/06/725233/zambia-lusaka-squatter-upgrading-site-services-project. World Bank. 1992. Zambia - Rural Water Supply Project. Washington, DC: World Bank. http://documents.worldbank.org/curated/en/1992/06/737093/zambia-rural-water-supply-project.

A Appendix
A.1. Proof of Proposition 1
The losses from non-adoption are greater than the losses from non adoption if and only if
δ < δS∼N =B
G=wHI (0, D)− c− k/Dc+ k/D − wHI (1, D)
> 0. (A1)
Since ∂B/∂w = HI (0, D) > 0 > ∂G/∂w = −HI (1, D), ∂B/∂c = −1 < 0 < ∂G/∂c = 1,∂B/∂k = −1/D < 0 < ∂G/∂k = 1/D and
∂B
∂D= w
∂HI
∂D(0, D) +
k
D2> 0 >
∂G
∂D= − k
D2− w∂HI
∂(1, D) , (A2)
a fortiori ∂δS∼N/∂w > 0, ∂δS∼N/∂c < 0, ∂δS∼N/∂k < 0 and ∂δS∼N/∂D > 0.
A.2. Proof of Proposition 2
The maximum fine consistent with no extortion of the innocent is Ai/b, which makes theexpected cost of using the individual technology wHI (1, D) + ΠA2/ (1 + A). Hence, fulladoption can be achieved with neither subsidies nor equilibrium extortion if and only G >ΠA2/ (1 + A). We assume that 2G > Π, so that this condition is satisfied if and only if
A ≥ A∗ =G+
√G (G+ 4Π)
2Π> 1. (A3)
For all A ≥ A∗, there is no reason to use subsidies and penalties simultaneously. Subsidiesare the better instrument if
δ < δS∼F (A) =g
Gfor all A ≥ A∗. (A4)
and penalties otherwise. Adoption is optimal in both cases because we assume that B > g.If instead A < A∗, then full adoption requires either some subsidies or some equilibriumextortion.Subsidies alone are better than fines that do not generate extortion plus subsidies if and
only if B − δG > B − g − δ [G− ΠA2/ (1 + A)], namely if and only if
δ < δS∼F (A) =g
Π
1 + A
A2for A < A∗, (A5)
which makes δS∼F (A) a continuous function with a convex kink at A∗.Alternatively, full adoption can be achieved through a fine of no less than G (1 + A) /[µφ
(A− 1)] > Ai/b, which induces equilibrium extortion of the innocent. Fines alone withequilibrium extortion are better than fines that do not generate extortion plus subsidies ifand only if B − g − zG/ (A− 1) > B − g − δ [G− ΠA2/ (1 + A)], namely if and only if
δ > δF∼E (A) =zG (1 + A)
[G (1 + A)− ΠA2] (A− 1). (A6)
22

We assume that δS∼F (A) ≤ δF∼E (A) for all A ∈ [1, A∗], namely that
z
g≥ 1
G+
1
Π− min
A∈[1,A∗]
{A
G+
1
ΠA2
}=
1
G+
1
Π− 3
3√
4ΠG2. (A7)
Recall that no adoption is better than subsidies alone if and only if δ > δS∼N = B/G.No adoption is better than fines that do not generate extortion plus subsidies if and only if
δ > δF∼N (A) =B − g
G− ΠA2/ (1 + A). (A8)
No adoption is better than fines alone with equilibrium extortion if and only if
A < A = 1 +zG
B − g . (A9)
We assume that A < A∗, namely that
B > g +2zΠG
G− 2Π +√G (G+ 4Π)
. (A10)
We also assume that δS∼F (1) > δS∼N , namely that
B < 2gG
Π. (A11)
Then it is undesirable to use fines when courts are completely unable to distinguish guiltfrom innocence (A = 1). Fines can be optimal (for some values of δ) only if A is large enoughthat δS∼F (A) < δS∼N < δF∼N (A), i.e., A2/ (1 + A) > gG/ (ΠB), and thus if and only if
A > A =gG+
√gG (gG+ 4ΠB)
2ΠB∈(1, A
). (A12)
Our parameter restrictions imply that forA ∈ (1, A) the thresholds are ranked δF∼N (A) <δS∼N < δS∼F (A) < δF∼E (A), so the optimal policy is subsidies alone for δ < δS∼N and noadoption for δ > δS∼N . For A ∈
(A, A
)the thresholds are ranked δS∼F (A) < δS∼N <
δF∼N (A) < δF∼E (A), so the optimal policy is subsidies alone for δ < δS∼F (A), fines thatdo not generate extortion plus subsidies for δS∼F (A) < δ < δF∼N (A) and no adoption forδ > δF∼N (A). For A ∈
(A, A∗
)the thresholds are ranked δS∼F (A) < δS∼N < δF∼E (A) <
δF∼N (A), so the optimal policy is subsidies alone for δ < δS∼F (A), fines that do not gen-erate extortion plus subsidies for δS∼F (A) < δ < δF∼E (A) and fines alone with equilibriumextortion if δ > δF∼E (A).
A.3. Proof of Proposition 3
The proof of Proposition 1 provided comparative statics for B, G and δS∼N , all three ofwhich are independent of z, Π and g.As the social costs of corruption increase, ∂ ln δF∼E/∂ ln z = 1 and ∂A/∂z = G/ (B − g) >
0, while ∂δS∼F/∂z = ∂δF∼N/∂z = 0.
23

As policing capacity increases, if A < A∗ then ∂ ln δS∼F/∂ ln Π = −1, ∂δF∼E/∂Π =[G− ΠA2/ (1 + A)]
−2zGA2/ (A2 − 1) > 0 and ∂δF∼N/∂Π = [G− ΠA2/ (1 + A)]
−2(B − g)
A2/ (1 + A) > 0, while ∂A/∂Π = 0.As the fixed cost of inspections increases, ∂ ln δS∼F/∂ ln g = 1, ∂δF∼N/∂g = [ΠA2/ (1 + A)
−G]−1 < 0 for A < A∗, and ∂A/∂g = zG (B − g)−2 > 0; while ∂δF∼E/∂g = 0.As the benefits of the collective technology increase or the subsidy required to sup-
port adoption decrease, if A < A∗ then ∂δS∼F/∂B = 0 = ∂δS∼F/∂G, ∂δF∼E/∂B = 0 >∂δF∼E/∂G = − [G− ΠA2/ (1 + A)]
−2ΠzA2/ (A2 − 1), ∂δF∼N/∂B = [G− ΠA2/ (1 + A)]
−1>
∂δS∼N/∂B = G−1 > 0 > ∂δF∼N/∂G = − [G− ΠA2/ (1 + A)]−2
(B − g) and ∂A/∂B =−zG (B − g)−2 < 0 < ∂A/∂G = z/ (B − g). Comparative statics with respect to w, c, kand D follow unambiguously from the proof of Proposition 1.
A.4. Proof of Proposition 4
By the implicit-function theorem, ∂A∗/∂Π = −G (1 + A∗)2 / [Π2A∗ (2 + A∗)] < 0 and ∂A∗/∂G= (1 + A∗)2 / [ΠA∗ (2 + A∗)] > 0. If A ≥ A∗ then ∂ ln δS∼F/∂ ln g = 1 and ∂ ln δS∼F/∂ lnG =−1.
24