infrared spectroscopy - chemistry.uoc.gr
TRANSCRIPT

1
Infrared Spectroscopy
Κώστας Δημάδης
Τομέας Ανόργανης Χημείας
Τμήμα Χημείας
Πανεπιστήμιο Κρήτης
2
What is infrared spectroscopy?
Modes of vibration
Instrumentation
Sources
Detectors
Dispersive IR spectrometer (scanning Instruments)
Fourier transform-Infrared spectrometer (FT-IR)
FT-IR Advantages?
IR Applications
Objectives

low high Frequency (n)
Energy
X-RAY ULTRAVIOLET INFRARED MICRO-
WAVE RADIO FREQUENCY
Ultraviolet Visible Vibrational
Infrared (Mid-IR)
Nuclear
magnetic
resonance
200 nm 400 nm 800 nm
2.5 mm 15 mm 1 m 5 m
short long Wavelength (l)
high low
THE ELECTROMAGNETIC SPECTRUM
BLUE RED
0.78-1000 mM

4
Infrared radiation Infrared radiation lies between the visible and microwave portions of the
electromagnetic spectrum .
Infrared waves have wavelengths longer than visible and shorter than
microwaves, and have frequencies which are lower than visible and higher than
microwaves.
The Infrared region is divided into: near, mid and far-infrared.
Near-infrared refers to the part of the infrared spectrum that is closest to
visible light and far-infrared refers to the part that is closer to the
microwave region.
Mid-infrared is the region between these two. For chemical analysis, we are
interested in mid IR region (2.5 mm-15 mm).
41 10)(
1
mcm
(cm)
1)(cm 1
λν
Thus in terms of wavenumber, the Mid IR extends from 4000 cm-1 to 650 cm-1
Usually, Many chemists refer to the radiation in the Mid IR in terms of wavenumber )(n

5
Radiation in the Mid IR region will cause stretching and bending vibrations of the
bonds in most covalent molecules.
Symmetric stretching
Asymmetric stretching
1- Stretching Vibrations
Modes of Vibration
2- Bending vibrations
A- In-plane bending
Scissoring Rocking
twisting wagging
b- Out-of-plane bending
BendingSymAsym nnn

6
• The vibrations described previously are called fundamental absorptions.
(arise from ground state to the first excited state). Usually the spectrum is
complicated because of the presence of weaker overtones.
Overtones
ν
• Overtones results from excitation from ground state to the 2nd and 3rd excited states and correspond to integral multiples of the frequency of the fundamental band. Overtones occur at 2 , 3 etc. An absorption in the IR at = 500 cm-1 may have an accompanying peak of lower intensity at
= 1000 cm-1 .
ν
ν
ν

IR active species
7
Molecular species with small energy differences between various vibrational and rotational states ( most organic species). Only bonds which have significant dipole moments will absorb infrared radiation.
Bonds which do not absorb infrared include
• Symmetrically substituted alkenes and alkynes.
C C RR
R
R R
R
• Symmetric diatomic molecules.
H2 , Cl2 , O2 , N2
• Ionic salts NaCl, KBr absorb only in the far IR region ( < 700 cm-1) so are suitable as sample holders for most Mid-IR measurements.

8
Infrared Spectrum
IR radiation is passed through a sample. Some of the infrared radiation is absorbed ,
the rest is transmitted. The resulting spectrum represents the molecular absorption
and transmission, creating a molecular fingerprint of the sample. No two unique
molecular structures produce the same infrared spectrum. This makes infrared
spectroscopy useful for several types of analysis.
C=O 1715 cm-1 C-H < 3000 cm-1

Detection Electronics and Computer
Infrared Source
Determines Frequencies of Infrared Absorbed and plots them on a chart
Sample
Simplified Infrared Spectrophotometer NaCl plates
Absorption “peaks”
Infrared Spectrum
frequency
% Transmittance
(decreasing)
focusing mirror
Instrumentation
10
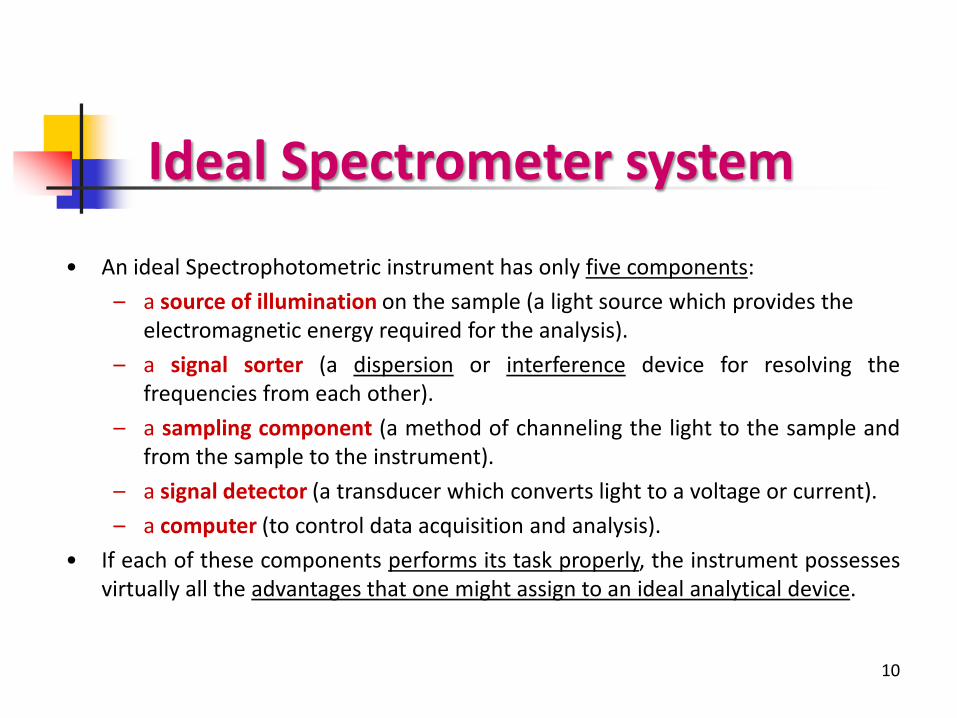
• An ideal Spectrophotometric instrument has only five components:
– a source of illumination on the sample (a light source which provides the electromagnetic energy required for the analysis).
– a signal sorter (a dispersion or interference device for resolving the frequencies from each other).
– a sampling component (a method of channeling the light to the sample and from the sample to the instrument).
– a signal detector (a transducer which converts light to a voltage or current).
– a computer (to control data acquisition and analysis).
• If each of these components performs its task properly, the instrument possesses virtually all the advantages that one might assign to an ideal analytical device.
Ideal Spectrometer system

IR spectrophotometer
11
1. Radiation source
Infrared radiation can be produced by electrically heating
a source, often a Nernst filament or a Globar to 1000-1800 C.
a. Nernst filament is fabricated from oxides of zirconium,
thorium and cerium.
b. The Globar is a small rod of silicon carbide.

IR spectrophotometer (contd.)
12
2. Detector
a. Thermal Detectors : measures IR energy by means of its thermal effect,
the heating effect of IR radiation produces an electrical signal that can be
measured, thermal noise is always a problem.
b. Pyroelectric detectors : pyroelectric substances are sandwiched between
two electrodes, when IR radiation reaches the detector , temperature
changes producing current that is proportional to the rate of change of
temperature, they exhibit fast responses so suitable for FT-IR.

13
• Types
– Scanning Instruments
• Dispersion Spectrometers (older technique)
– Multiplex Instruments
• Fourier Transform Infrared (FT-IR) Spectrometers (Modern technique)
• Nearly all IR spectrometers, nowadays, are of the FT type.
Infrared Instrumentation History and development

14
Dispersive IR spectrometers
Infrared Dispersion Scanning Instrumentation
• Scanning instrument uses a frequency separation device (grating) to resolve
the IR radiation into individual frequencies.
• An exit slit isolates a specific frequency for passage to the detector.
• The IR spectrum is obtained by moving (scanning) the grating over a given
wavenumber region after passing through the sample.
IR source sample
detector
dispersive grating
mirror
monochromator
exit slit
15
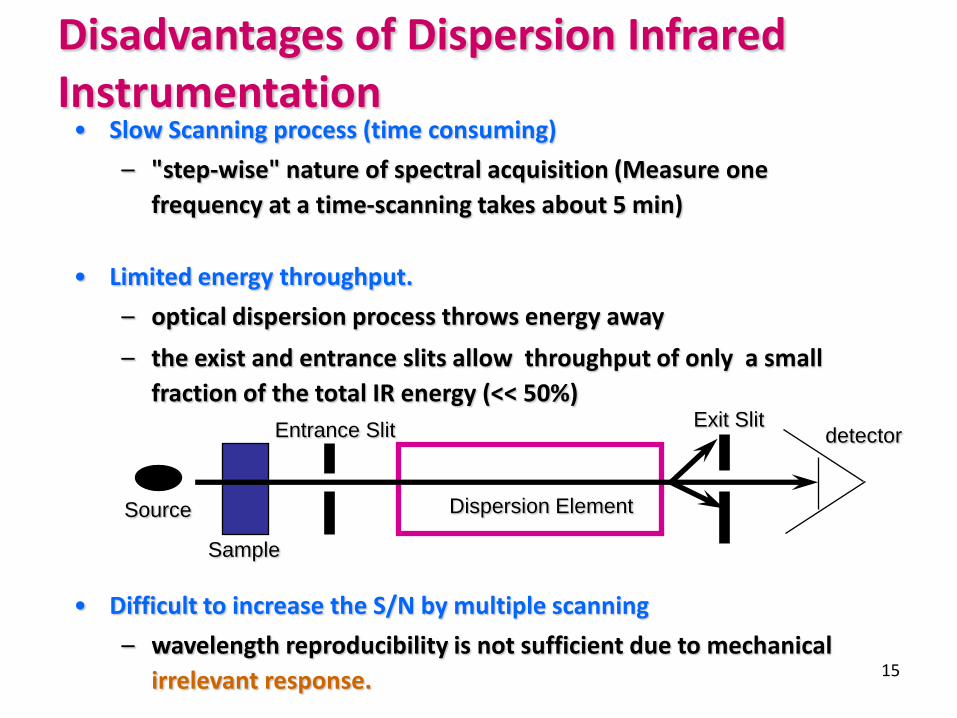
• Slow Scanning process (time consuming)
– "step-wise" nature of spectral acquisition (Measure one
frequency at a time-scanning takes about 5 min)
• Limited energy throughput.
– optical dispersion process throws energy away
– the exist and entrance slits allow throughput of only a small
fraction of the total IR energy (<< 50%)
• Difficult to increase the S/N by multiple scanning
– wavelength reproducibility is not sufficient due to mechanical
irrelevant response.
Dispersion Element
Entrance Slit Exit Slit
detector
Sample
Source
Disadvantages of Dispersion Infrared Instrumentation

16
Noise is random, it may be positive or negative.
– If “n” spectra are added S/N increases in proportion of
n
Noise
Mea
sure sig
na
l heig
ht
• All measurements, especially those we carry out with instruments, generate Noise.
• Detectors of all sorts generate electrical noise # of scans S/N ratio
This means that to improve S/N by a factor of 2, you have to add and average 4
spectra (scans). Improvement of S/N by factor of 10 needs averaging 100 spectra.
17
Fourier Transform Infrared (FT-IR) spectrometry was developed in
order to overcome the limitations encountered with dispersive
instruments mainly the slow scanning process.
Fourier Transform IR
A solution was developed which employed a very simple
optical device called an interferometer. The interferometer
produces a unique type of signal which has all of the infrared
frequencies “encoded” into it. The signal can be measured very
quickly, usually on the order of one second or so.

18
FTIR systems
1. Mechanical operation
• Encode (modulate) the spectral information using a Michelson Interferometer.
2. Mathematical operation
• Computer processing of encoded information to produces the spectrum (Decoding).
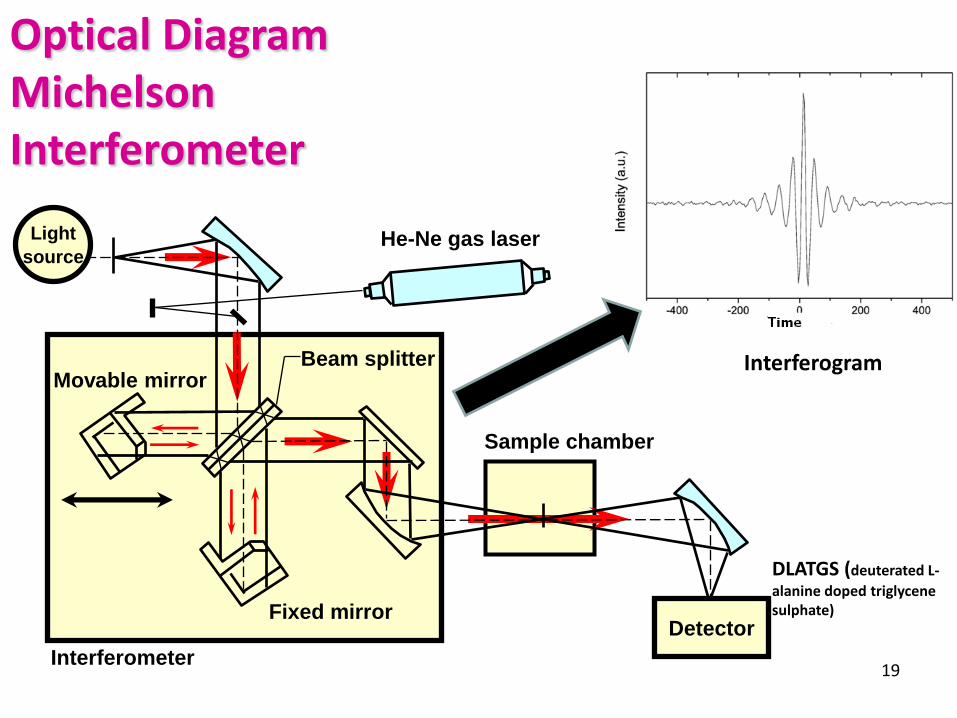
Optical Diagram Michelson Interferometer
19 Interferometer
He-Ne gas laser
Fixed mirror
Movable mirror
Sample chamber
Light
source
Detector
DLATGS (deuterated L-
alanine doped triglycene sulphate)
Beam splitter Interferogram

Interference is a superimposing of waves
Note that the time domain signal, even after modulation, contains the same
information as in the frequency domain.
Relationship between light source spectrum and the interferogram
(signal output from interferometer)
(a) Monochromatic
light
(b) Dichroic light
(c) Continuous
spectrum light
Light source spectrum Signal output from interference wave
Time t
Time t
Time t I(t)
I
F(u)
Wavenumber
Wavenumber
Wavenumber
S I
Time domain Frequency domain
u1 u2
20
21
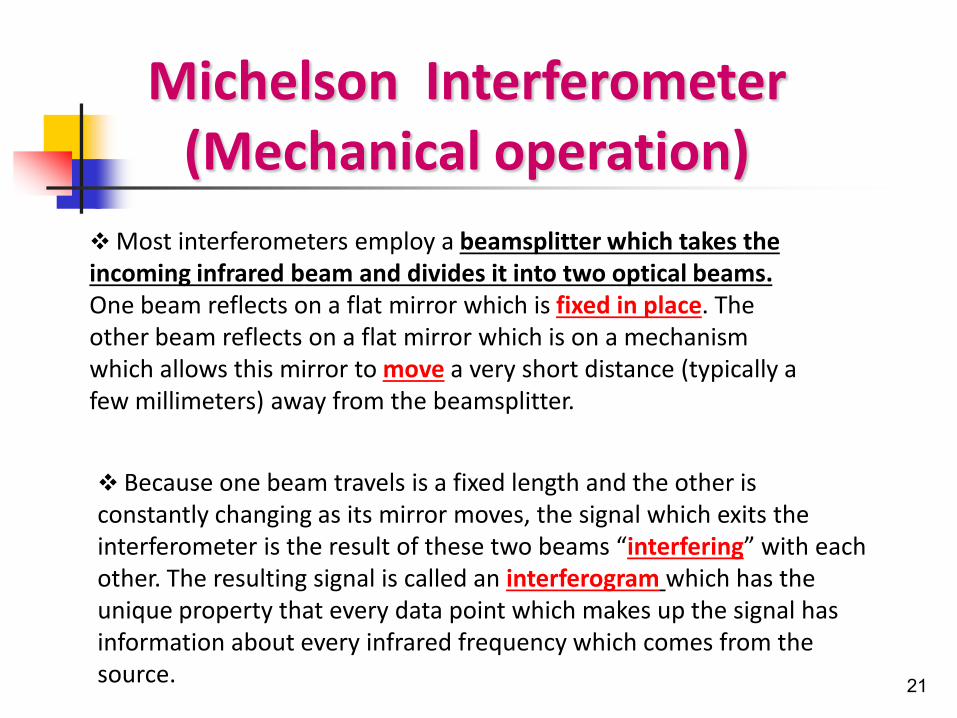
Most interferometers employ a beamsplitter which takes the incoming infrared beam and divides it into two optical beams. One beam reflects on a flat mirror which is fixed in place. The other beam reflects on a flat mirror which is on a mechanism which allows this mirror to move a very short distance (typically a few millimeters) away from the beamsplitter.
Michelson Interferometer (Mechanical operation)
Because one beam travels is a fixed length and the other is constantly changing as its mirror moves, the signal which exits the interferometer is the result of these two beams “interfering” with each other. The resulting signal is called an interferogram which has the unique property that every data point which makes up the signal has information about every infrared frequency which comes from the source.

22
Fourier transform (Mathematical Operation)
Because the analyst requires a frequency spectrum (a plot of the
intensity at each individual frequency) in order to make an
identification, the measured Interferogram signal can not be
interpreted directly. A means of “decoding” the individual
frequencies is required. This can be accomplished via a well-
known mathematical technique called the Fourier
transformation. This transformation is performed by the
computer which then presents the user with the desired spectral
information for analysis.

23
Time axis Time domain
decoding
by FFT
Wavenumber Frequency domain
FT-IR summary
24
Background Spectrum
A background spectrum (with no sample in the beam) must be collected for
all IR measurements . This can be compared to the measurement with the
sample in the beam to determine the “percent transmittance.” A single
background measurement can be used for many sample measurements
because this spectrum is characteristic of the instrument itself and its
environment .
The strong background absorption from water and carbon dioxide in the
atmosphere can be reduced by purging the optical bench with an inert gas
or with dry carbon dioxide – scrubbed air .
25
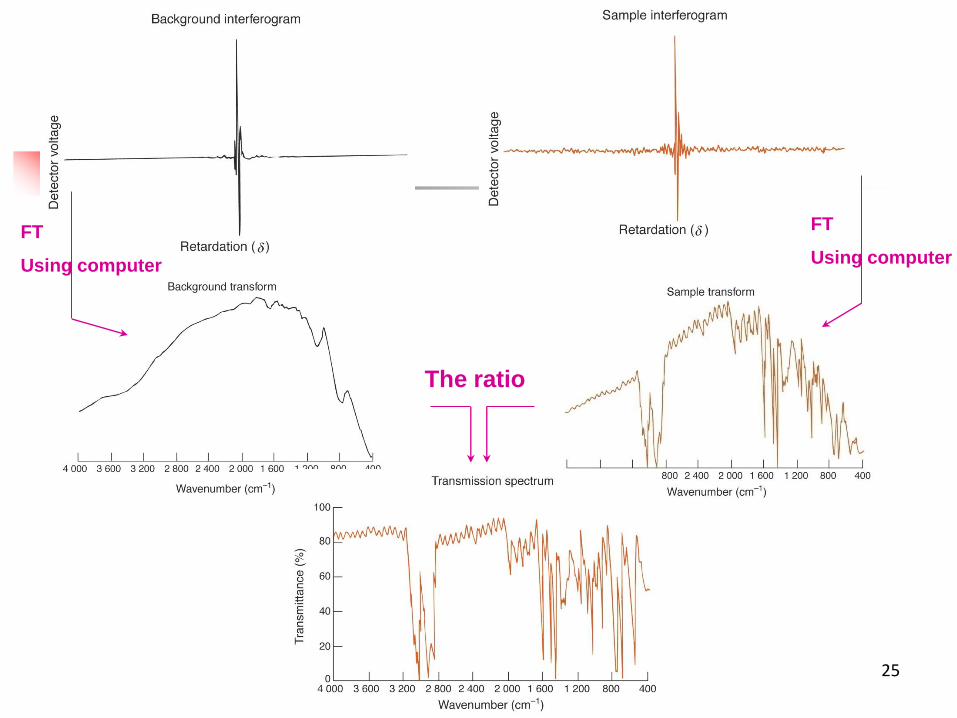
FT
Using computer
The ratio
FT
Using computer

26
Schematic illustration of FTIR system

1- Fellgett's (multiplex) Advantage Fast : All frequencies of the source reach the detector simultaneously (all of
the energy is on the detector all of the time), instead of analyzing a sequence of small wavebands available from the monochromator in dispersing IR instruments.
Get data for the entire spectrum in one second or less.
Improve signal to noise ratio (S/N ratio):
Fast scans enable recording and averaging many scans.
27
FT-IR Advantages

2- Connes Advantage (Frequency accuracy advantage) • Why is there a laser in FT-instruments?
Interferogram is not recoded continuously, but sampled at discrete intervals to give different data points. The closer the spacing between data points, the greater the wavenumber range of the spectrum.
Monochromatic visible He-Ne laser beam is passed along with the polychromatic IR light to provide a single wavelength interferogram that oscillates much more quickly than anything in the IR (shorter wavelength).
28
FT-IR Advantages (Contd.)
IR Interferogram
Output of a Laser interferometer
Optical path difference
Data points IR data points might be taken at
every zero point of the laser
interferogram.
The laser is used as an internal clock to
trigger data points acquisition events.

• FTIR instruments employ a He-Ne laser as an internal wavelength calibration standard. These instruments are self-calibrating and never need to be calibrated by the user. • The precise reproduction of wavenumber positions from one spectrum to the next will increase the resolution of the spectrum, and make it easy to differentiate between adjacent peaks too close to each other (high resolving power). • Frequency accuracy makes signal averaging highly precise and thus adds further improvement in S/N ratio.
Connes Advantage (Contd.)
29

30
3- Jacquinot (throughput) Advantage
• Few optical elements and no slits (greater throughput of
radiation)
– The detector receives up to 50% of the energy of original
light source (much larger than the dispersion spectrometer)
– This will enhance the sensitivity of measurement and
causes further improvement in the S/N ratio.
FT-IR Advantages (cont. )

FT-IR Advantages (cont. )
4- No stray light
• Because the FT experiment modulates the source radiation and
then detects only modulated radiation, there is essentially no stray
light problems as there are with scanning instruments.
• Any stray light that reaches the detector is not incorporated into
the spectrum since it is unmodulated. Thus there is no possibility
of errors occurring during measurement (accurate quantitative
analysis). 31

32
• Speed Because all of the frequencies are measured simultaneously. • Sensitivity is dramatically improved with FT-IR ; detectors are much more sensitive, the optical throughput is much higher, higher signal to noise ratio. • Mechanical Simplicity The moving mirror in the interferometer is the only continuously moving part in the instrument. Thus, there is very little possibility of mechanical breakdown. • Internally Calibrated These instruments employ a He-Ne laser as an internal wavelength calibration standard .These instruments are self-calibrating and never need to be calibrated by the user.
Summary of FT-IR Advantages

33
Analytical information obtained using IR techniques
I) Qualitative a) Structural Elucidation through interpretation of functional
group region ( 4000- 1300 cm-1), fingerprint region ( 1300- 910 cm-1), aromatic region ( 910- 650 cm-1).
b) Compound Identification to find a reference IR spectrum that matches that of the unknown compound.
c) IR mostly used for rapid qualitative but not quantitative analysis.

34
The intensity of an absorption band is linearly proportional to the concentration of analyte of interest at a certain frequency. Quantification parameters include peak height , peak area ; integration of band area should be done carefully to ensure maximum accuracy, near IR region is better suited for quantitation.
II ) Quantitative A = a b c
35
Applications of Infrared Analysis
Analysis of petroleum hydrocarbons , oil and grease
content ( detection of Freons).
Determination of air contaminants.
Determination of protein, starch, oil , lipids and
cellulose in agricultural products .
Far- Infrared region is particularly useful for
inorganic studies ( crystals and semiconducting
materials ).

36
General Applications of Infrared Analysis
Pharmaceutical research.
Forensic investigations.
Polymer analysis.
Lubricant formulation and fuel additives.
Foods research.
Quality assurance and control.
Environmental and water quality analysis methods.
Biochemical and biomedical research.
Coatings and surfactants.

37
A Functional Group Chart
O-H str
NH str
COO-H
=C-H str
Csp3-H
C-H
-(C=O)-H
CN
CC
C=O
-C=N
-C=C
phenyl
C-O
C-N
F C-X
4000 3600 3200 2800 2400 2000 1600 1200 800 grou
p
I Br Cl
38
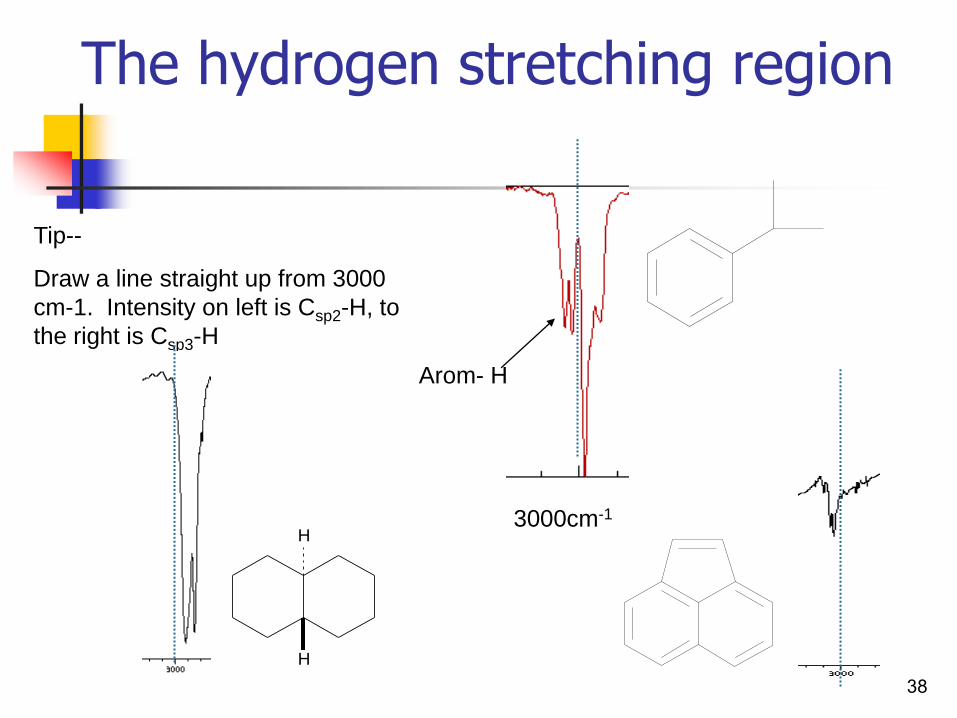
The hydrogen stretching region
3000cm-1
Tip--
Draw a line straight up from 3000
cm-1. Intensity on left is Csp2-H, to
the right is Csp3-H
Arom- H
H
H
39
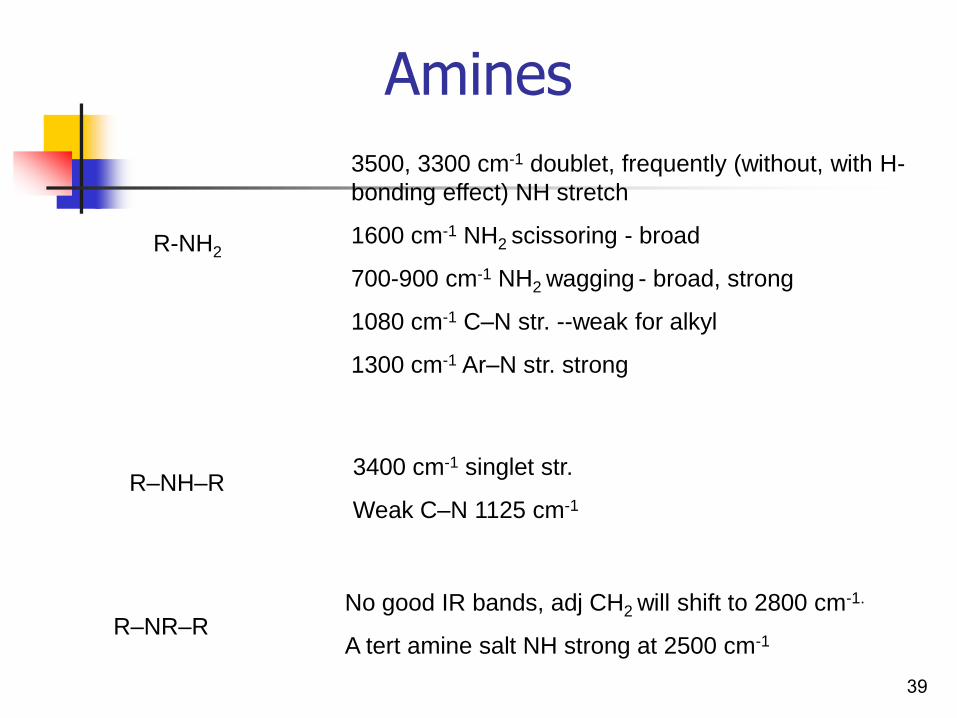
Amines
3500, 3300 cm-1 doublet, frequently (without, with H-
bonding effect) NH stretch
1600 cm-1 NH2 scissoring - broad
700-900 cm-1 NH2 wagging - broad, strong
1080 cm-1 C–N str. --weak for alkyl
1300 cm-1 Ar–N str. strong
R-NH2
R–NH–R 3400 cm-1 singlet str.
Weak C–N 1125 cm-1
R–NR–R No good IR bands, adj CH2 will shift to 2800 cm-1.
A tert amine salt NH strong at 2500 cm-1
40
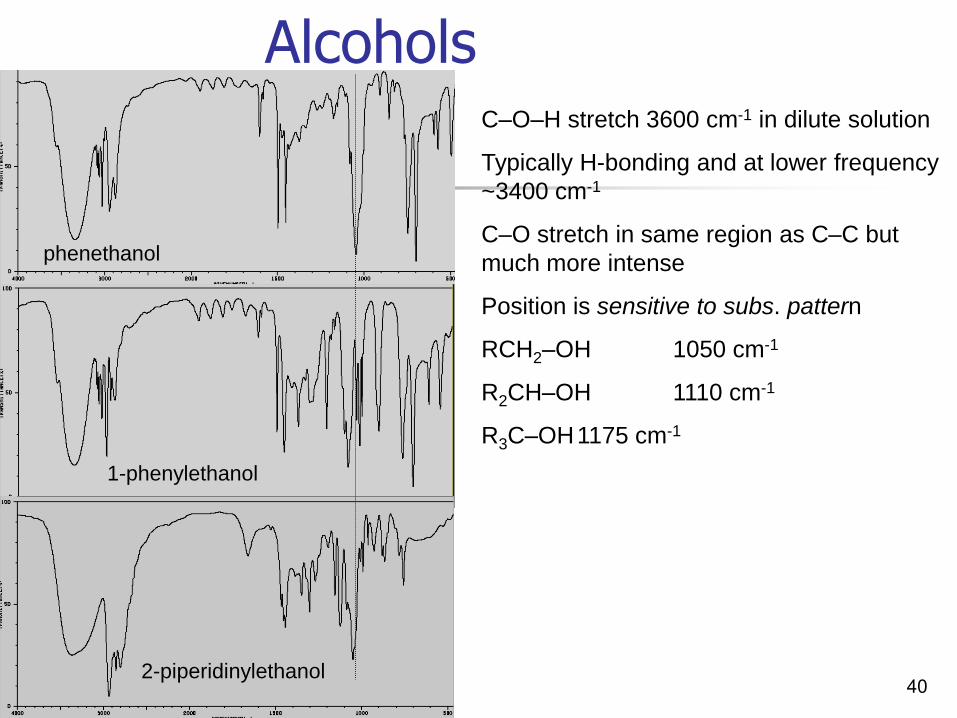
Alcohols C–O–H stretch 3600 cm-1 in dilute solution
Typically H-bonding and at lower frequency
~3400 cm-1
C–O stretch in same region as C–C but
much more intense
Position is sensitive to subs. pattern
RCH2–OH 1050 cm-1
R2CH–OH 1110 cm-1
R3C–OH 1175 cm-1
phenethanol
1-phenylethanol
2-piperidinylethanol

41
The Carbonyl Stretch
Carbonyl stretch changes its
position for variation in specific
structure
THIS BAND IS ALWAYS
STRONG!!!
Good rules to remember…
C=O conjugated to double bond goes lower in frequency
With electronegative substituent (O, Cl) goes to higher
frequency
C=O in strained ring, goes to higher frequency
C=O…(H hydrogen bonds lower the frequency)

42
Ketones--sensitive to strain
O O
O
1715 cm-1 1780 cm-1 1750 cm-1
Ca. 30 cm-1 higher for every C atom removed
-diketones, str-str for open chain, IR inactive; in ring, 1720,1740
-haloketones--can see second band from rotamer populations (1720, 1745)

43
Carboxylic Acids
Phenylbutyric acid
Cyclohexanecarboxylic acid Hept-3-enoic acid
Also C—O 1280 cm-1, often a
doublet
O—H o.o.p bend br 920 cm-1
Salts have1600,1350 cm-1
broad!
1715 cm-1
br OH stretch
Good example of
the broadening
from H-bonding

44
amides
phenylacetamide N-benzylbenzamide
phenylacetanilide L--aspartyl-L-
phenylalanine 1-methyl
ester
NH str 3300 cm-1
C=O 1650 cm-1
NH bend 1640
cm-1
Moves to 1550 for
R-C(=O)-NHR’

45
Textbook: Principles of Instrumental Analysis, Skoog, Holler, Nieman Recommended further reading: “Principles of instrumental analysis, 5th ed. by Skoog, Holler, Nieman” Chapter 16 , 17. Extra resources are available on the intranet. Relevant web sites http://www.chemguide.co.uk/analysismenu.html Self assessment http://www.wiziq.com/tutorial/91202-QUIZ-Infrared-spectroscopy
Resources and references