informs transactions on education - university of …guptavis/papers/softwaretools.pdf · princeton...
TRANSCRIPT

This article was downloaded by: [45.48.250.70] On: 20 September 2016, At: 22:27Publisher: Institute for Operations Research and the Management Sciences (INFORMS)INFORMS is located in Maryland, USA
INFORMS Transactions on Education
Publication details, including instructions for authors and subscription information:http://pubsonline.informs.org
A Course on Advanced Software Tools for OperationsResearch and AnalyticsIain Dunning, Vishal Gupta, Angela King, Jerry Kung, Miles Lubin, John Silberholz
To cite this article:Iain Dunning, Vishal Gupta, Angela King, Jerry Kung, Miles Lubin, John Silberholz (2015) A Course on Advanced SoftwareTools for Operations Research and Analytics. INFORMS Transactions on Education 15(2):169-179. http://dx.doi.org/10.1287/ited.2014.0131
Full terms and conditions of use: http://pubsonline.informs.org/page/terms-and-conditions
This article may be used only for the purposes of research, teaching, and/or private study. Commercial useor systematic downloading (by robots or other automatic processes) is prohibited without explicit Publisherapproval, unless otherwise noted. For more information, contact [email protected].
The Publisher does not warrant or guarantee the article’s accuracy, completeness, merchantability, fitnessfor a particular purpose, or non-infringement. Descriptions of, or references to, products or publications, orinclusion of an advertisement in this article, neither constitutes nor implies a guarantee, endorsement, orsupport of claims made of that product, publication, or service.
Copyright © 2015, INFORMS
Please scroll down for article—it is on subsequent pages
INFORMS is the largest professional society in the world for professionals in the fields of operations research, managementscience, and analytics.For more information on INFORMS, its publications, membership, or meetings visit http://www.informs.org

I N F O R M STransactions on Education
Vol. 15, No. 2, January 2015, pp. 169–179ISSN 1532-0545 (online)
http://dx.doi.org/10.1287/ited.2014.0131© 2015 INFORMS
A Course on Advanced Software Tools forOperations Research and Analytics
Iain Dunning, Vishal Gupta, Angela King, Jerry Kung, Miles Lubin, John SilberholzOperations Research Center, Massachusetts Institute of Technology, Cambridge, Massachusetts 02139,
{[email protected], [email protected], [email protected], [email protected], [email protected], [email protected]}
It is increasingly important for researchers and practitioners to be familiar with methods and software toolsfor analyzing large data sets, formulating and solving large-scale mathematical optimization models, and
sharing solutions using interactive media. Unfortunately, advanced software tools are seldom included in cur-ricula of graduate-level operations research (OR) and analytics programs. We describe a course consisting ofeight three-hour modules intended to introduce master’s and Ph.D. students to advanced software tools forOR and analytics: machine learning in R, data wrangling, visualization, big data, algebraic modeling withJuMP, high-performance and distributed computing, Internet and databases, and advanced mixed integer linearprogramming (MILP) techniques. For each module, we outline content, provide course materials, summarizestudent feedback, and share lessons learned from two iterations of the course. Student feedback was very posi-tive, and all students reported that the course equipped them with software skills useful for their own research.We believe our course materials could serve as a template for the development of effective OR and analyticssoftware tools courses and discuss how they could be adapted to other educational settings.
Keywords : active learning; teaching analytics; teaching optimization; teaching statistics; teaching withtechnology; visualization
History : Received: May 2014; accepted: August 2014.
1. IntroductionAdvanced software tools are a critical part of mod-ern operations research (OR) and analytics practice.Often, “data wrangling” and visualization with a sta-tistical package like R (R Core Team 2014) or Python’spandas package (McKinney 2012) are some of thefirst steps taken when handling the large, complexdata sets that are encountered in real-world applica-tions. State-of-the-art optimization solvers like CPLEX(IBM 2013) or Gurobi (Gurobi Optimization 2014) areoften needed to efficiently solve mathematical pro-grams. Parallel and distributed computation using acluster of computers is sometimes the only way tofeasibly complete a large-scale analysis. Finally, con-veying insights to make an impact with a nontechni-cal collaborator frequently requires representing solu-tions with interactive media or distributing them overthe Internet. The end-to-end workflow of modern ORand analytics practice requires fluency with a spec-trum of software tools.
Although some OR programs have begun inte-grating computational elements into their curricula(Alpers and Trotter 2009), few formally introduce stu-dents to a broad range of software tools. For exam-ple, we reviewed the course descriptions for eight
top OR programs1 for coursework pertaining to solv-ing large-scale linear optimization problems. Large-scale linear optimization is one of the cornerstonesof OR practice and a clear opportunity for teach-ing advanced software tools. Thirteen courses men-tion techniques for solving large-scale linear optimiza-tion problems in their course description. However,of the nine courses with publicly available syllabi,only five (56%) covered using software tools for opti-mization, and of the four courses with publicly avail-able homework assignments, only one (25%) requiredstudents to implement computational techniques forlarge-scale linear optimization.
On the other hand, some of these tools are cov-ered by courses offered by other departments out-
1 Industrial and Systems Engineering at the Georgia Institute ofTechnology; Operations Research and Industrial Engineering at Cor-nell University; Industrial Engineering and Operations Researchat Columbia University; Industrial Engineering at the Univer-sity of California, Berkeley; Decisions, Operations and TechnologyManagement at the University of California, Los Angeles; Man-agement Science and Engineering at Stanford University; Opera-tions Research and Financial Engineering at Princeton University;and Industrial and Operations Engineering at the University ofMichigan.
169
Dow
nloa
ded
from
info
rms.
org
by [
45.4
8.25
0.70
] on
20
Sept
embe
r 20
16, a
t 22:
27 .
For
pers
onal
use
onl
y, a
ll ri
ghts
res
erve
d.

Dunning et al.: Advanced Software Tools for OR and Analytics170 INFORMS Transactions on Education 15(2), pp. 169–179, © 2015 INFORMS
side of OR programs. For instance, many computerscience programs offer courses on visualization,2 andnumerical computation programs offer courses ondistributed and parallel computation.3 Individually,however, these courses fail to fully cover the spectrumof tools required in OR and analytics practice. More-over, these computer science and numerical computa-tion courses typically focus on theoretical issues andimplementation challenges as seen through the lensof those fields, whereas often OR and analytics prac-titioners are seeking a more applied “How do I usethis tool?” perspective. Finally, these sorts of coursesare not universally available for students; for instance,our university, the Massachusetts Institute of Technol-ogy (MIT), does not offer regular semester-long datascience or visualization courses.
To address the need for courses covering advancedsoftware tools for these topics, we developed 15.S602Software Tools for Operations Research, an MIT coursedevoted entirely to these tools and the end-to-endworkflow of OR and analytics practice. The course,a series of three-hour modules designed and taughtby graduate students, launched during the 2013 win-ter term and ran a second time during the 2014winter term. The course is targeted at doctoral andmaster’s students, though two advanced undergrad-uate students have completed the course. Participantsare expected to have already taken coursework inmachine learning and optimization, and all studentsare required to have taken a graduate-level coursein optimization in order to register. The course isdesigned as an introduction to advanced softwaretools for OR and analytics but not as an introductionto programming; participants are required to havefamiliarity with some programming language.
In this paper, we describe the curriculum andlessons learned from two iterations of this course. In§2, we describe our course design philosophy, citingrelevant educational literature that informed our deci-sions. In §3, we detail the individual course mod-ules and summarize student feedback about thesemodules. In §4, we describe lessons learned fromthe second iteration of the course. Finally, in §5 wereview overall course feedback and discuss how ourcourse materials could be adapted for use in anotherprogram. The supplemental files (course_content.zip)for this paper (available as supplemental material
2 Examples include the Georgia Institute of Technology’s CS 7450,Harvard University’s CS 171, the University of California, Berke-ley’s CS 294-10, Stanford University’s CS 448B, and IndianaUniversity’s Massive Open Online Course (MOOC) InformationVisualization.3 Examples include Cornell University’s CS 5460, the Georgia Insti-tute of Technology’s CSE 6220, Harvard University’s CS 264,Princeton University’s COS 598A, and University of Illinois atUrbana–Champaign’s ECE 408.
at http://dx.doi.org/10.1287/ited.2014.0131) includea full set of course materials from the second iterationof the course, including lecture slides, assignmentsand solutions, and heavily commented example code.
2. Design PhilosophyBefore delving into the details of the content of eachmodule, we summarize our overall design philoso-phy, drawing attention to issues many educators mayface when creating a course on state-of-the-art soft-ware tools. Our ultimate focus was on creating a prag-matic course to empower students to use software intheir own research and projects. This design philoso-phy, in turn, helped shape the structure and contentof the course.
2.1. Active Learning and a WorkshopEnvironment
Perhaps the most critical element of our design phi-losophy was to create a workshop environment thatwould promote active learning and enable studentsto be highly engaged with their own learning pro-cesses. Active learning has been defined as “instruc-tional activities involving students in doing thingsand thinking about what they are doing” (Bon-well and Eison 1991). This well-studied pedagogicalmethod has been shown to enhance deeper, moremeaningful learning (Smith et al. 2005). OR educatorshave reported success in using active learning in top-ics such as service operations management (Beharaand Davis 2010) and linear programming (Devia andWeber 2012, Kydd 2012).
To facilitate an active learning environmentthroughout our course, students were required tobring laptops to each module. Class time was a mixof lecturing to introduce the new tool, group codingexercises during which the instructor would live-codeon a projected screen, and short exercises for whichstudents would break off into small teams whilethe instructor circulated to give one-on-one feedback.By working in class, students could collaborate withpartners, providing an opportunity for students withweaker programming skills to learn from classmateswith stronger skills. Moreover, technical and syntacti-cal issues were easily addressed by the instructor inreal time, allowing students to focus on the higher-level learning objective of the exercise. Nearly all in-class exercises were accompanied by a more chal-lenging “bonus exercise,” which provided the mostadvanced students in the course with an opportunityto further hone their skills. Student feedback substan-tiated our opinion that the workshop format for thecourse was more effective than a traditional lectureformat would have been.
Dow
nloa
ded
from
info
rms.
org
by [
45.4
8.25
0.70
] on
20
Sept
embe
r 20
16, a
t 22:
27 .
For
pers
onal
use
onl
y, a
ll ri
ghts
res
erve
d.

Dunning et al.: Advanced Software Tools for OR and AnalyticsINFORMS Transactions on Education 15(2), pp. 169–179, © 2015 INFORMS 171
2.2. Balancing Modularity and IntegrationBy nature, a software tools course covering a range oftools and concepts will take on a modular design—each module will cover a specific tool or technique.Specifically, we structured our course as a series ofeight three-hour modules detailed in §3. This modu-larity provides a number of advantages:
Simplified course updates. As technology evolves,state-of-the-art tools necessarily change, and to keepup to date, course content must be updated. Indeed,between the first and second iterations of our course,one module was dropped, two were added, twowere substantially changed, and four remained simi-lar. Modular design simplifies the process of updatingsome content while leaving other content unchanged.
Facilitating repeat enrollment. Changing the modulestaught each year encourages students who previouslytook the course to reenroll or audit select modulesagain in later iterations. Of the students who attendedthe first iteration, approximately 20% attended at leastone module in the second iteration.
Simplified development with multiple instructors. Soft-ware tools courses are well suited for multiple instruc-tors. With seven instructors for eight modules, wewere able to ensure instructors were resident expertsin the material they taught, often having exten-sive industrial experience with the tools they werecovering. Modular course design limits the depen-dency between material, streamlining and simplify-ing the course development process with multipleinstructors.
Despite the advantages of modular design, thereis evidence that integrated curricula can improve
Figure 1 Connecting Modules throughout the Course
Big data
High-performancecomputing
Algebraicmodeling
with JuMP
Machinelearning in R
Datawrangling
Visualization
Project Part I:Internet anddatabases
Project Part II:Advanced MILP
techniques
Note. Course content was reinforced through small exercises that relied on material from previous modules. An arrow from module A to module B indicatesthat module B relies on material from module A.
educational outcomes (Vars 1991, Bransford et al.2000). Consequently, we employed four techniques topartially link the modules together, while retainingthe benefits of modularity. Figure 1 summarizes howmodules were interconnected; an arrow from mod-ule A to module B indicates that module B relies onmaterial from module A.
Recall through in-class exercises. In most modules, weincorporated programming exercises (described in §3)that relied on a previous module but that were simpleenough that students who had not attended the pre-vious module could seek assistance and still benefitfrom the exercise. We felt, and noticed in course feed-back, that these small exercises helped students linktogether the modules and increase retention throughknowledge recall and repetition.
Reusing programming languages. In the second iter-ation of our course, we limited instruction to the R(R Core Team 2014) and Julia (Bezanson et al. 2012)programming languages. Though this decision intro-duced dependencies to the modules where we intro-duced these two languages and limited the softwaretools we could teach, students reported the continuityin programming language to be beneficial. During ourfirst iteration of the course, we taught using five pro-gramming languages over seven modules, and stu-dents complained that this led to cognitive overload.
A single, consistent data set. We used the HubwayData Visualization data set (Hubway 2012), an open-source data set released by Hubway (Boston’s bike-sharing program) as part of a visualization challengein 2012, in all modules. It is a clean, moderate-sized
Dow
nloa
ded
from
info
rms.
org
by [
45.4
8.25
0.70
] on
20
Sept
embe
r 20
16, a
t 22:
27 .
For
pers
onal
use
onl
y, a
ll ri
ghts
res
erve
d.

Dunning et al.: Advanced Software Tools for OR and Analytics172 INFORMS Transactions on Education 15(2), pp. 169–179, © 2015 INFORMS
(550,000 trips) data set that includes geospatial, time-series, and demographic information. The continuitythat arose from using one data set throughout thecourse, including in the optimization-focused mod-ules, highlighted the various capabilities of the toolstaught and how they might be used in tandem.
Capstone project. Finally, the course culminated witha two-part capstone project. This capstone project(detailed in §§3.7–3.8) drew on tools from each mod-ule and illustrated how they can be used in concert toformulate, solve, and deliver a high-quality solutionto an OR problem. Our goal with the project was tocontextualize these tools in the problem-solving pro-cess for students.
2.3. Essential Role of FeedbackA third aspect of our design philosophy was lever-aging a cycle of continuous feedback from students—before the course began, during the course, and afterthe course.
For both iterations of the course, we performed apre-course survey to identify new techniques studentswould most like to learn and determine the list ofmodules to be taught. Additionally, in the second iter-ation, we reviewed the previous year’s feedback onwhich existing modules were most useful to students.These surveys were instrumental in choosing topicsthat were relevant to our student body and presentingthose topics at an appropriate level of difficulty.
During the course, we solicited feedback on eachindividual module. To reduce the burden on students,we used Google Forms to distribute an anonymous,online course evaluation at the end of each sessionvia hyperlink; this is a popular platform for collectingfeedback for each lecture in a course (Gehringer andCross 2010). Google provides basic, real-time analysis
Figure 2 Feedback Collected at the Conclusion of Each Module
2.71.9 1.9 1.7
2.11.6
2.2 2.4
3.9 4.3 4.33.83.7
3.24.1 4.1
2.22.8 2.9
3.72.7
3.6 3.3 3.1
3.9 4.3 4.23.64.0
3.24.1 4.1
1234
1234
1234
1234
How much did you know about this topic beforehand?
How interesting did you find this module?
How difficult did you find this module?
How useful do you think this module will be to
you in the future?
MLw/ R
DataWrangling
Visual-ization
Modelingw/ JuMP
BigData
HPC Proj.Part 1
Proj.Part 2
Note. All responses were on a 1-to-5 scale (5 being the highest), and the numbers presented here are the average across respondents.
on these surveys. We used this feedback both to iden-tify misconceptions from previous lectures that couldbe addressed with a short discussion at the begin-ning of the next module and to provide commentsto instructors, which they could use to improve theirown teaching style and techniques.
Finally, at the conclusion of the course we solicitedfeedback on the overall course structure and mod-ules, including questions on how difficult each mod-ule was, which modules were most useful to students,and what other topics they wished were covered. Wewill use this feedback next year to help redesign themodules included in the course. See §3 for excerptsof student feedback at the module level and §5 forfeedback at the course level.
3. Course ModulesOur key course objective was to provide studentswith expertise in the wide range of advanced soft-ware tools for OR and analytics. In this section, wesummarize the content of each module taught in thesecond year of the course and provide excerpts fromthe student evaluations for that module. Figure 2summarizes student feedback for each module. Thesupplemental files (course_content.zip) provide moredetailed information about the content of the mod-ules, including slides and heavily commented code.
3.1. Machine Learning in RMachine learning algorithms are used to detect pat-terns in and make predictions from data. These meth-ods form a core part of how analytics practition-ers use empirical data to build models. The goal ofthis module was to teach students how to run manycommon machine learning algorithms by using freely
Dow
nloa
ded
from
info
rms.
org
by [
45.4
8.25
0.70
] on
20
Sept
embe
r 20
16, a
t 22:
27 .
For
pers
onal
use
onl
y, a
ll ri
ghts
res
erve
d.
Dunning et al.: Advanced Software Tools for OR and AnalyticsINFORMS Transactions on Education 15(2), pp. 169–179, © 2015 INFORMS 173
available packages for the statistical computing lan-guage R (folder IntroR within course_content.zip).
We first taught students how to read a comma-separated value file into R and how to use built-infunctions to quickly extract summary statistics from adata set. We then taught them how to execute com-mon algorithms such as linear and logistic regression,classification and regression trees, random forests,clustering, and support vector machines. We empha-sized the importance of out-of-sample model evalu-ation and validation as well as how to calculate thecoefficient of determination, interpret variable signif-icance reports, generate confidence intervals, displayconfusion matrices for classification problems, andexamine properties of clusters.
Most students had previously taken a machinelearning or statistics course and therefore appreciatedthe module’s focus on software instead of detaileddescriptions of methods, with one commenting, “Ilike the fact that the class went fast and covered manycommon analytics tools without dwelling on explain-ing them.” This was generally regarded as the easiestmodule, though all students found it interesting anda large majority thought it would be useful in theirfuture.
3.2. Data WranglingData Wrangling, the second module in R, focusedon teaching students how to manipulate and reshapedata sets to facilitate analysis (folder DataWranglingwithin course_content.zip). This critical and oftenfrustrating step is usually one of the first parts of themodeling process. We chose to wait until the secondmodule in the course to address these topics, how-ever, as we wanted to first expose students to thevariety of machine learning packages in R to contex-tualize why cleaning and reshaping data is important.
In this module we showed students how to iden-tify and deal with outliers, handle missing data, andmanage date or time information within a data set.Students built upon their knowledge of built-in Rfunctions from the Machine Learning in R module
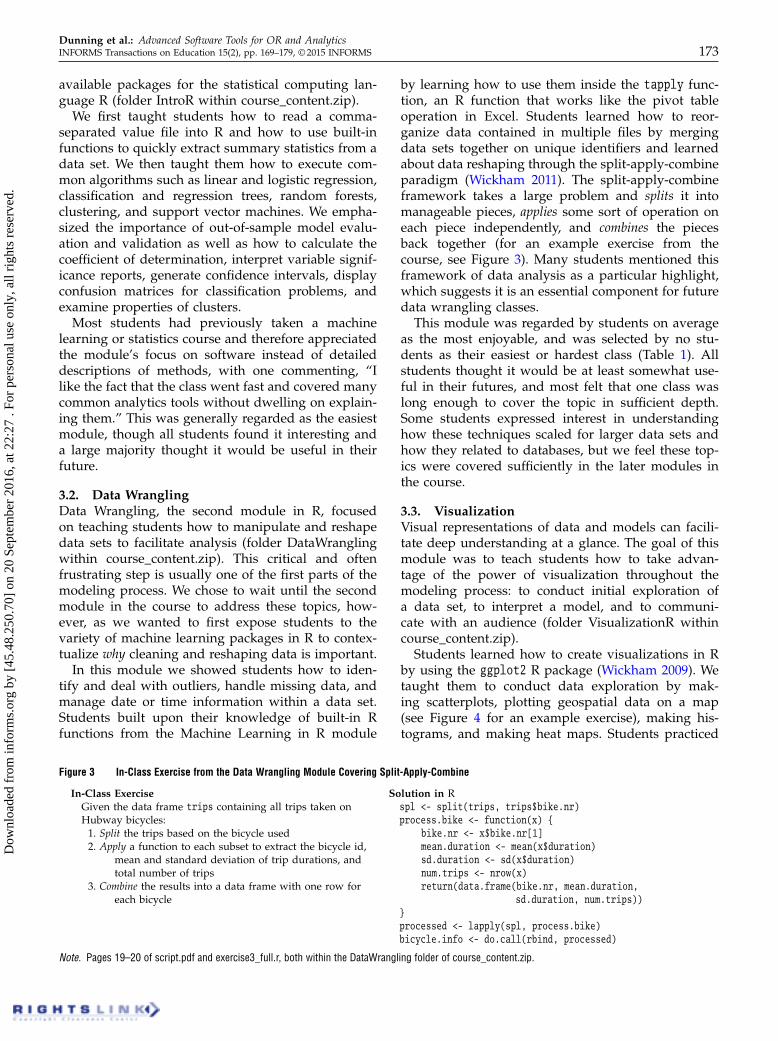
Figure 3 In-Class Exercise from the Data Wrangling Module Covering Split-Apply-Combine
In-Class ExerciseGiven the data frame trips containing all trips taken onHubway bicycles:
1. Split the trips based on the bicycle used2. Apply a function to each subset to extract the bicycle id,
mean and standard deviation of trip durations, andtotal number of trips
3. Combine the results into a data frame with one row foreach bicycle
Solution in Rspl <- split(trips, trips$bike.nr)process.bike <- function(x) {
bike.nr <- x$bike.nr[1]mean.duration <- mean(x$duration)sd.duration <- sd(x$duration)num.trips <- nrow(x)return(data.frame(bike.nr, mean.duration,
sd.duration, num.trips))}processed <- lapply(spl, process.bike)bicycle.info <- do.call(rbind, processed)
Note. Pages 19–20 of script.pdf and exercise3_full.r, both within the DataWrangling folder of course_content.zip.
by learning how to use them inside the tapply func-tion, an R function that works like the pivot tableoperation in Excel. Students learned how to reor-ganize data contained in multiple files by mergingdata sets together on unique identifiers and learnedabout data reshaping through the split-apply-combineparadigm (Wickham 2011). The split-apply-combineframework takes a large problem and splits it intomanageable pieces, applies some sort of operation oneach piece independently, and combines the piecesback together (for an example exercise from thecourse, see Figure 3). Many students mentioned thisframework of data analysis as a particular highlight,which suggests it is an essential component for futuredata wrangling classes.
This module was regarded by students on averageas the most enjoyable, and was selected by no stu-dents as their easiest or hardest class (Table 1). Allstudents thought it would be at least somewhat use-ful in their futures, and most felt that one class waslong enough to cover the topic in sufficient depth.Some students expressed interest in understandinghow these techniques scaled for larger data sets andhow they related to databases, but we feel these top-ics were covered sufficiently in the later modules inthe course.
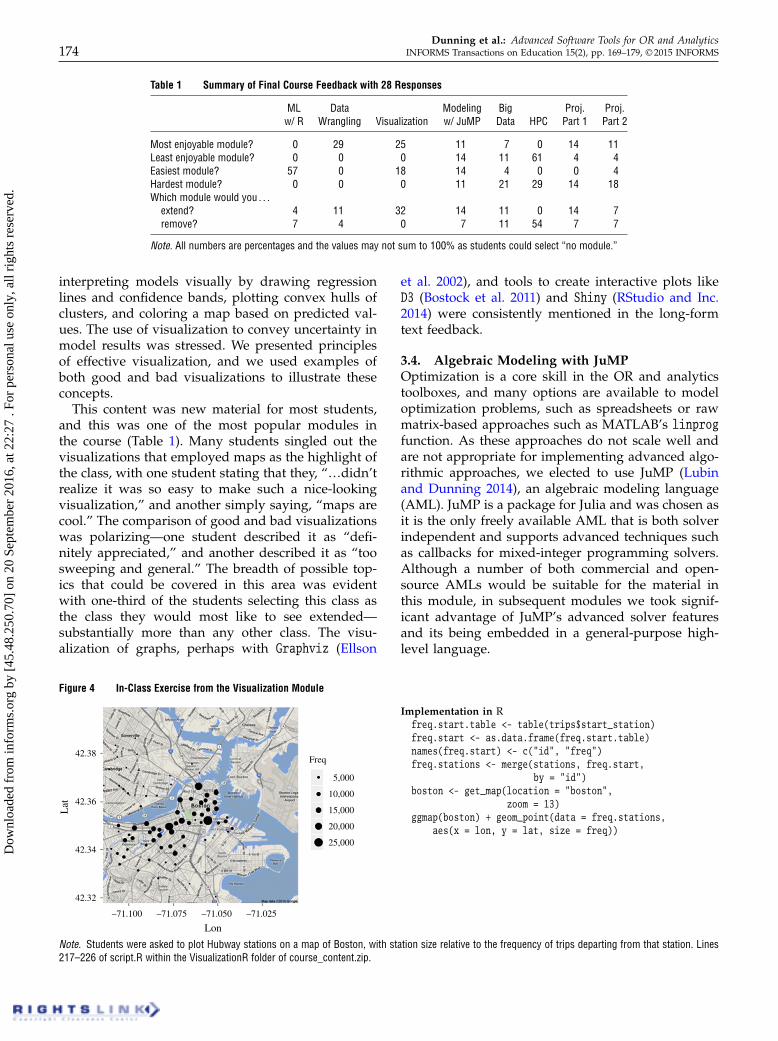
3.3. VisualizationVisual representations of data and models can facili-tate deep understanding at a glance. The goal of thismodule was to teach students how to take advan-tage of the power of visualization throughout themodeling process: to conduct initial exploration ofa data set, to interpret a model, and to communi-cate with an audience (folder VisualizationR withincourse_content.zip).
Students learned how to create visualizations in Rby using the ggplot2 R package (Wickham 2009). Wetaught them to conduct data exploration by mak-ing scatterplots, plotting geospatial data on a map(see Figure 4 for an example exercise), making his-tograms, and making heat maps. Students practiced
Dow
nloa
ded
from
info
rms.
org
by [
45.4
8.25
0.70
] on
20
Sept
embe
r 20
16, a
t 22:
27 .
For
pers
onal
use
onl
y, a
ll ri
ghts
res
erve
d.
Dunning et al.: Advanced Software Tools for OR and Analytics174 INFORMS Transactions on Education 15(2), pp. 169–179, © 2015 INFORMS
Table 1 Summary of Final Course Feedback with 28 Responses
ML Data Modeling Big Proj. Proj.w/ R Wrangling Visualization w/ JuMP Data HPC Part 1 Part 2
Most enjoyable module? 0 29 25 11 7 0 14 11Least enjoyable module? 0 0 0 14 11 61 4 4Easiest module? 57 0 18 14 4 0 0 4Hardest module? 0 0 0 11 21 29 14 18Which module would you 0 0 0
extend? 4 11 32 14 11 0 14 7remove? 7 4 0 7 11 54 7 7
Note. All numbers are percentages and the values may not sum to 100% as students could select “no module.”
interpreting models visually by drawing regressionlines and confidence bands, plotting convex hulls ofclusters, and coloring a map based on predicted val-ues. The use of visualization to convey uncertainty inmodel results was stressed. We presented principlesof effective visualization, and we used examples ofboth good and bad visualizations to illustrate theseconcepts.
This content was new material for most students,and this was one of the most popular modules inthe course (Table 1). Many students singled out thevisualizations that employed maps as the highlight ofthe class, with one student stating that they, “…didn’trealize it was so easy to make such a nice-lookingvisualization,” and another simply saying, “maps arecool.” The comparison of good and bad visualizationswas polarizing—one student described it as “defi-nitely appreciated,” and another described it as “toosweeping and general.” The breadth of possible top-ics that could be covered in this area was evidentwith one-third of the students selecting this class asthe class they would most like to see extended—substantially more than any other class. The visu-alization of graphs, perhaps with Graphviz (Ellson
Figure 4 In-Class Exercise from the Visualization Module
Implementation in Rfreq.start.table <- table(trips$start_station)freq.start <- as.data.frame(freq.start.table)names(freq.start) <- c("id", "freq")freq.stations <- merge(stations, freq.start,
by = "id")boston <- get_map(location = "boston",
zoom = 13)ggmap(boston) + geom_point(data = freq.stations,
aes(x = lon, y = lat, size = freq))
Note. Students were asked to plot Hubway stations on a map of Boston, with station size relative to the frequency of trips departing from that station. Lines217–226 of script.R within the VisualizationR folder of course_content.zip.
et al. 2002), and tools to create interactive plots likeD3 (Bostock et al. 2011) and Shiny (RStudio and Inc.2014) were consistently mentioned in the long-formtext feedback.
3.4. Algebraic Modeling with JuMPOptimization is a core skill in the OR and analyticstoolboxes, and many options are available to modeloptimization problems, such as spreadsheets or rawmatrix-based approaches such as MATLAB’s linprogfunction. As these approaches do not scale well andare not appropriate for implementing advanced algo-rithmic approaches, we elected to use JuMP (Lubinand Dunning 2014), an algebraic modeling language(AML). JuMP is a package for Julia and was chosen asit is the only freely available AML that is both solverindependent and supports advanced techniques suchas callbacks for mixed-integer programming solvers.Although a number of both commercial and open-source AMLs would be suitable for the material inthis module, in subsequent modules we took signif-icant advantage of JuMP’s advanced solver featuresand its being embedded in a general-purpose high-level language.
Dow
nloa
ded
from
info
rms.
org
by [
45.4
8.25
0.70
] on
20
Sept
embe
r 20
16, a
t 22:
27 .
For
pers
onal
use
onl
y, a
ll ri
ghts
res
erve
d.

Dunning et al.: Advanced Software Tools for OR and AnalyticsINFORMS Transactions on Education 15(2), pp. 169–179, © 2015 INFORMS 175
The module was an introduction to both Julia asa programming language and JuMP as an AML forlinear and mixed-integer programming (folder Mod-elling within course_content.zip). The class coveredbasic syntax, aimed toward students already famil-iar with languages such as MATLAB or Python. Weasked students to implement a basic facility locationmodel as an in-class exercise. As a more advancedexercise, we then asked students to enumerate thefour best solutions to the facility location problem byiteratively solving the model and adding a constraintto cut off the optimal solution each time. Focusingon the simple-to-state but sufficiently complex facil-ity location problem was motivational for many stu-dents, with one student summarizing it as, “challeng-ing, but 0 0 0 it tied the whole class together.”
Most students found this module relatively easybut expected the content of the module to be usefulin their futures. Many students found the first thirdof the module that focused on teaching the Julia lan-guage better suited to a pre-class homework assign-ment. The concept of an AML was fairly novel forsome students, as an alternative to, “0 0 0 [creating] alarge matrix and [keeping] track of the indices.”
3.5. Big DataRecent years have witnessed an increased prevalenceof huge data sets in data analytics (Lohr 2012). Thismodule was designed to highlight the differences inexploration and modeling for these large-scale prob-lems (folder BigData within course_content.zip).
We reviewed fundamentals of data storage andproposed a taxonomy to distinguish between “smalldata” (fits in memory of a personal computer),“medium data” (cannot fit into memory completely,but can be filtered or partially loaded), and what istruly “big data” (may not even fit on a single com-puter). This taxonomy was generally described asempowering, with one student saying that they had“never known how to answer the ‘how big is big’question [before].” We discussed techniques appro-priate for the medium-data case with an emphasis
Figure 5 Example of a “Big Data Algorithm” from the Big Data Module That Will Scale Well for Very Large Lists or Operate on a Stream of Data
ChallengeWrite code that samples one item from a list ofunknown size, where each item is equally likely tobe selected, and the list can only be traversed once.
SolutionTake the first item as the incumbent. For itemi = 21 0 0 0, replace the incumbent with probability1/i. If we check for n= 3 we see that item 1 isselected with probability 41 − 1
2 541 − 13 5 = 1
3 anditem 2 is selected with probability 4 1
2 541 −13 5=
13 .
Implementation in Juliafunction sample(datastream)
count_so_far = 0selected_item = nothingfor item in datastream
count_so_far += 1if rand() <= 1/count_so_far
selected_item = itemend
endreturn selected_item
end
Note. Slides 25–28 of bigdataslides.pdf and exercise3_sol.jl, both within the BigData folder of course_content.zip.
on partial file loading and R packages for operatingon data sets larger than memory capacity such asbiglm (Lumley 2013). We then moved on to stream-ing and sketching algorithms used in big-data appli-cations, such as reservoir sampling algorithms (seeFigure 5). This small section was disproportionatelypopular in the feedback, with one student stating theyhad, “never thought about sampling in that way.”Finally we introduced the concepts of the MapReduce(Dean and Ghemawat 2008) framework, a method-ology for addressing very large distributed data setsthat is similar to the split-apply-combine framework.
This module was described as one of the hardestmodules of the course, and the majority of the stu-dents knew little about the topic beforehand. A rel-atively high number of students were not confidentit would be useful to them in the future. The pre-sentation of MapReduce as a methodology was wellreceived but many found the implementation exer-cises too challenging. In contrast, the earlier exerciseson performing operations on data sets iteratively weregenerally described positively.
3.6. High-Performance and DistributedComputing
It is valuable for students to be able to transform theirtheoretical understanding of algorithms into efficient,high-performance code. Additionally, because of thewider availability of academic computing clusters andcomputing as a commodity in the “cloud,” we believeit is important for students to be aware of boththe capabilities and limitations of such systems forsolving large-scale OR and analytics problems. Thismodule focused on both aspects of high-performanceand distributed computing (folder DistribComputingwithin course_content.zip).
The first section of this module proceeded througha basic implementation of the classical gradientdescent method, introducing students to importantconsiderations in modern computing architectures,which are more often bound by slow memory accessthan by speed of computation. The BLAS (Dongarra
Dow
nloa
ded
from
info
rms.
org
by [
45.4
8.25
0.70
] on
20
Sept
embe
r 20
16, a
t 22:
27 .
For
pers
onal
use
onl
y, a
ll ri
ghts
res
erve
d.

Dunning et al.: Advanced Software Tools for OR and Analytics176 INFORMS Transactions on Education 15(2), pp. 169–179, © 2015 INFORMS
et al. 1988) and LAPACK (Anderson et al. 1999)libraries for linear algebra operations were coveredin this section, as they remain important for high-performance codes. The second section focused ondistributed and parallel computing. We presented acase study of solving a large-scale stochastic program-ming problem in parallel by using Benders’ decom-position (Benders 1962), with scenarios drawn fromhistorical data in the Hubway data set.
This was expected to be one of the more demandingmodules, and it was reported as the hardest modulein the course. The step-by-step guide to improvingthe performance of the algorithm was popular, butmany students found the distributed computing con-cepts difficult to grasp within the time frame and feltthe compromises required to teach it made it feel “toohands off” and “too high level.”
3.7. Project Part I—Internet & DatabasesThe capstone project linked together many of the dataand optimization techniques learned throughout theentire course. The goal was to create an Internet ser-vice that solves a traveling salesman problem (TSP)on demand by accessing data that are requested froma database using the architecture depicted in Fig-ure 6. It was developed over two modules: the firstaddressed the Internet and database aspects of theproject, and the second covered the advanced tech-niques required to solve the TSP (folder ProjectPart1within course_content.zip). We chose to address Inter-net services as they are a modern way to sharedata, models, and results. They eliminate the need formodel deployment on individual computers, which isoften a barrier to the implementation of OR and ana-lytics solutions in practice.
The first topic covered was an overview of howthe Internet is structured and how clients and serversinteract. Students created a simple service that wouldreturn different messages based on the input andwould solve simple arithmetic problems. The sec-ond topic was an introduction to databases, the
Figure 6 Design of the TSP Web Service That Students ImplementedDuring the Capstone Project Modules
Userrequest
Julia server
HubwaySQLite
databaseTSP solver
Userresponse
(lat1, lng1)(lat2, lng2)
Searchbox
Matchingstations
Distancematrix
Tour
Tour graphic
main data storage tool in the industry. This intro-duction included both relational and “NoSQL”-styledatabases. Students learned the basics of using SQL tointeract with a relational database, in this case SQLite.In-class exercises included joining the Hubway tripand station data sets together and filtering based ontext patterns. Finally, we combined the two topicstaught in this module to build an Internet service thatwould take all Hubway stations within user-specifiedlatitude and longitude ranges and return the pairwisedistances between them.
On average, students found the module interest-ing, and many students were surprised at how easyit was to create an Internet service. A substantial por-tion of the class was familiar with the structure ofthe Internet, especially those with computer sciencebackgrounds. Many students had prior exposure toSQL or were familiar with the concept, but feedbackindicated that in general they enjoyed the high-levelreview of the topic regardless of previous exposure.
3.8. Project Part II—Advanced MILP TechniquesThe second project module focused on complement-ing the theoretical knowledge of combinatorial opti-mization learned in other courses (folder ProjectPart2within course_content.zip). Although most studentswere familiar with the concept of branch and boundas a way to solve integer programs, we illustrated indetail the computational structure of modern mixed-integer linear programming (MILP) solvers and howusers can interact with them by using callbacks.
We first presented a simple example to introduceusing callbacks to enforce an implicit, or lazy, con-straint in a model by checking if it is violated withina user-defined callback (see Figure 7). As a more com-plex example, we asked students to constrain a deci-sion vector within a Euclidean ball. As the Euclideanball can be represented as an infinite number of lin-ear constraints, tangent approximations can be addeddynamically (lazily) to enforce the constraint. We pre-sented a standard formulation for the TSP, which hasan exponential number of subtour elimination con-straints. Students implemented this exponential fam-ily of constraints as lazy constraints. Finally, the TSPsolver was integrated into the existing Internet ser-vice created in the previous module to complete theproject.
The TSP is a classical problem in OR. Indeed,Lee and Raffensperger (2006) discussed teaching themethods to solve the TSP using AMPL scripts. Incontrast to their work, where TSPs are modeled andsolved in isolation, we used the TSP primarily as anexample of a nontrivial optimization problem that canbe integrated with databases and Web servers in arealistic, modern architectural design.
Dow
nloa
ded
from
info
rms.
org
by [
45.4
8.25
0.70
] on
20
Sept
embe
r 20
16, a
t 22:
27 .
For
pers
onal
use
onl
y, a
ll ri
ghts
res
erve
d.

Dunning et al.: Advanced Software Tools for OR and AnalyticsINFORMS Transactions on Education 15(2), pp. 169–179, © 2015 INFORMS 177
Figure 7 Example Used to Introduce Lazy Constraints to Students in JuMP
Simple Lazy IP:max x1 + 2x2
subject to: x11x2 ∈ 80119lazy: x1 + x2 ≤ 1
Implementation in JuMP:m = Model(solver=GurobiSolver())@defVar(m, x[1:2], Bin)@setObjective(m,Max, x[1] + 2x[2])function lazy(cb)
xVal = getValue(x)if xVal[1] + xVal[2] > 1 + 1e-4
@addLazyConstraint(cb, x[1] + x[2] <= 1)end
endsetLazyCallback(m, lazy)solve(m)
Notes. Slides 30–31 of projectPartII.pdf in the ProjectPart2 folder of course_content.zip. Users define a function that checks if the constraint x1 + x2 ≤ 1 isviolated by the current solution (up to a tolerance), and if so, adds this constraint to the model at runtime.
The second part of the project was regarded as oneof the harder classes, but students derived satisfac-tion from bringing all the components of the coursetogether, with one describing it as “a good capstoneclass.” Students found the concept of MILP callbacksmostly understandable, and the escalation of com-plexity allowed them to appreciate the mechanics. Themodule also served as a refresher for the content ofthe Algebraic Modeling with JuMP module, as well asgeneral programming practice. All students stronglyagreed that the final project accomplished the goal ofshowing how to combine concepts and tools into acomplete application, and 86% of the students weremotivated by the topic of the project.
4. Lessons LearnedIn addition to the specific feedback about modulesdetailed in §3, we learned several lessons during thesecond iteration of our course that will affect futureiterations.
Workshop Environment. We employed active learn-ing instead of a more traditional lecture format as wefelt it to be particularly appropriate to the teaching ofsoftware tools. One potential problem with this work-shop style is the increased demands on the instructorbecause of the higher degree of interaction betweenthe instructor and students. We found that this wasnot an issue for our class sizes (approximately 40 stu-dents), especially as there was usually an additionalinstructor present to address technical issues and tohelp students who were lagging behind the rest ofthe class. We believe that the workshop format couldscale to a larger number students if additional teach-ing assistants were used.
Distributing Course Content. The course was createdas a series of loosely coupled modules, which enabledthe independent and simultaneous development of allcontent. A consequence of this was that the coursematerials were frequently updated both before andeven after the course began. To enable the instruc-tors and students to stay in sync, we stored all course
materials online using the distributed version controlsystem (VCS) GitHub (GitHub 2014). The benefit ofusing a VCS over the Web interface of our university’scourse management software was that both instruc-tors and students could easily synchronize their com-puter’s copy of the materials with the master onlinecopy. However, we found that many students wereunfamiliar with the use of a VCS, requiring us to sup-plement our course materials with an extra tutorialon the topic. Collected feedback revealed that morethan half of the students found this tutorial helpful,and we plan to make it available at the beginning ofthe course in the future.
Adjustments to Modules Offered. In future iterationsof the course, we expect to remove the module onHigh Performance and Distributed Computing, asstudent feedback suggested that course participantsdid not have sufficient programming background tobenefit from the material. Though we plan to solicitsuggestions from students before launching the nextiteration of the course to identify potential modulesto add, student feedback suggests that a second mod-ule covering additional visualization topics would bewell received.
5. Discussion and ConclusionBoth iterations of the course were well attended—inthe second iteration 57 students were registered (38for credit, 19 as auditors), and on average 38 stu-dents attended each module. Though most registeredstudents were graduate students at the MIT Opera-tions Research Center (73.7%), others included gradu-ate students at various MIT engineering departments(7.0%), MIT undergraduates (3.5%), and visiting stu-dents and postdoctoral fellows (15.8%). A key goalof this course was to equip students with the skillsthey need to conduct research; all 28 students whoresponded to the end-of-class survey (partial sum-mary in Table 1) reported that it did so. Given thepopularity of the course and its success in equippingstudents with a range of advanced software tools for
Dow
nloa
ded
from
info
rms.
org
by [
45.4
8.25
0.70
] on
20
Sept
embe
r 20
16, a
t 22:
27 .
For
pers
onal
use
onl
y, a
ll ri
ghts
res
erve
d.

Dunning et al.: Advanced Software Tools for OR and Analytics178 INFORMS Transactions on Education 15(2), pp. 169–179, © 2015 INFORMS
OR and analytics, we believe it was effective andcould be used as a template for software tools coursesin other OR and analytics programs.
We believe that others will be able to replicate andmodify our course content. This paper’s supplementalmaterials contain the full set of course materials fromthe second iteration of our course, including slidesand heavily commented code. The modular design ofthe course, detailed in §2.2, will enable others to easilyretain some modules but adjust or replace others tomeet their needs. The modularity also makes it sim-ple to retain some software tools but to change others,an important point of flexibility as the choice of soft-ware tool is often based on an instructor’s expertise.For instance, between the first and second iterationsof our course we retained R as the statistical soft-ware package but updated all other modules to useJulia and JuMP. Instructors might choose to replaceR with another statistical software package like SAS,Stata, or Python’s pandas package (McKinney 2012),or they might choose to replace Julia and JuMP withPython-based interfaces for Gurobi (Gurobi Optimiza-tion 2014) or CPLEX (IBM 2013), for example.
The modular design of the course also creates flex-ibility in the course delivery. We delivered the coursewith one student instructor per module, but a soft-ware tools course could also be delivered by oneor two instructors with broad expertise in statisticalsoftware tools and optimization tools. One promisingmode of delivery would be as a massive open onlinecourse (MOOC). By leveraging prerecorded coursecontent, a MOOC enables course delivery with a largenumber of instructors without needing them to all beavailable to teach at the same time. A downside ofusing a MOOC to deliver the course is that the activelearning component of the course would be lost inthis format.
Because our course was offered during MIT’s Inde-pendent Activities Period, a four-week January termthat features seminar-style courses, assessment waslimited to a pre-class homework assignment for eachmodule. In these assignments, we required studentsto install the software and add-on packages neededfor the module. Students needed to validate theirinstallation by running a small snippet of code andsubmitting the output for credit. For instance, the pre-homework assignment for the visualization modulerequired students to install four R packages and toplot and submit a scatterplot, country map, and streetmap (README.md in the VisualizationR folder ofcourse_content.zip). These assignments force studentsto address installation early, avoiding time-consumingtroubleshooting during class time. A natural oppor-tunity to expand assessment in the course wouldbe assigning individual coding tasks following eachmodule that require students to apply the tools from
that module to a new data set or optimization prob-lem. The course material is also well suited for a cul-minating project, in which individuals or groups ofstudents complete projects involving machine learn-ing and optimization.
Our second iteration of the course had 24 hoursof class time, which is the ideal length for a univer-sity with a quarter system and roughly two-thirds ofa semester-long course. However, a number of soft-ware tools could be added to the course to extend itto a full semester length. For example, when askedin the final course feedback to select one module toextend, approximately one-third of students selectedvisualization, indicating demand for more content onthis topic. Other promising areas to add moduleswould be in simulation, tools for nonlinear optimiza-tion such as CVX (Grant and Boyd 2014), and spe-cialized tools for MapReduce such as Hadoop (White2009). Alternately, the course could be expanded tomake it accessible to students who have less famil-iarity with machine learning or optimization thanour participants. More emphasis could be placed ondetailed descriptions of machine learning algorithmsor on the mathematics of advanced optimization tech-niques such as column generation and lazy constraintgeneration. For participants with less programmingexperience, modules covering an introduction to pro-gramming could be added.
The need for education in OR and analytics soft-ware tools will only increase. Recently, dozens of busi-ness and engineering schools have created one-yearMaster of Science in Business Analytics or Data Sci-ence programs. These programs focus on training stu-dents to be effective OR and analytics practitioners,for which fluency in advanced software tools is essen-tial. Such programs could especially benefit from acondensed OR and analytics software tools coursebecause of their short duration and applied focus. Webelieve the materials accompanying this paper couldserve as a template for the development of effectivesoftware tools courses in these and other programs.
Supplemental MaterialSupplemental material to this paper is available athttp://dx.doi.org/10.1287/ited.2014.0131.
AcknowledgmentsWe wish to thank Ross Anderson, André Calmon, Virot Chi-raphadhanakul, Velibor Misic, and Allison O’Hair for theircontributions to this course as student instructors. We alsothank Dimitris Bertsimas for his role as faculty sponsor ofthe course. This material is based upon work supportedby the National Science Foundation Graduate Research Fel-lowship [Grant No. 1122374] (J. Kung and J. Silberholz).Any opinion, findings, and conclusions or recommenda-tions expressed in this material are ours and do not neces-sarily reflect the views of the National Science Foundation.
Dow
nloa
ded
from
info
rms.
org
by [
45.4
8.25
0.70
] on
20
Sept
embe
r 20
16, a
t 22:
27 .
For
pers
onal
use
onl
y, a
ll ri
ghts
res
erve
d.

Dunning et al.: Advanced Software Tools for OR and AnalyticsINFORMS Transactions on Education 15(2), pp. 169–179, © 2015 INFORMS 179
M. Lubin was supported by the DOE Computational Sci-ence Graduate Fellowship [Grant No. DE-FG02-97ER25308].
ReferencesAlpers A, Trotter LE (2009) Teaching computational discrete opti-
mization at the undergraduate level. INFORMS Trans. Ed.9(2):63–69.
Anderson E, Bai Z, Bischof C, Blackford S, Demmel J, Dongarra J,Du Croz J, et al. (1999) LAPACK Users’ Guide, 3rd ed. (SIAM,Philadelphia).
Behara RS, Davis MM (2010) Active learning projects in serviceoperations management. INFORMS Trans. Ed. 11(1):20–28.
Benders JF (1962) Partitioning procedures for solving mixed-variables programming problems. Numerische Mathematik4:238–252.
Bezanson J, Karpinski S, Shah VB, Edelman A (2012) Julia:A fast dynamic language for technical computing. CoRR,abs/1209.5145.
Bonwell CC, Eison JA (1991) Active learning: Creating excitementin the classroom. ASHEERIC Higher Education Report No. 1,George Washington University, Washington, DC.
Bostock M, Ogievetsky V, Heer J (2011) D3 data-driven documents.IEEE Trans. Visualization Comput. Graphics 17(12):2301–2309.
Bransford JD, Brown AL, Cocking RR, eds. (2000) Learning andtransfer. How People Learn: Brain, Mind, Experience, and School(National Academy Press, Washington, DC), 51–78.
Dean J, Ghemawat S (2008) MapReduce: Simplified data processingon large clusters. Comm. ACM 51(1):107–113.
Devia N, Weber R (2012) Active learning exercise: Newspaper pagelayout. INFORMS Trans. Ed. 12(3):153–156.
Dongarra JJ, Croz JD, Hammarling S, Hanson RJ (1988) Anextended set of FORTRAN basic linear algebra subprograms.ACM Trans. Math. Software 14(1):1–17.
Ellson J, Gansner E, Koutsofios L, North SC, Woodhull G (2002)Graphviz: Open source graph drawing tools. Graph Drawing(Springer, Berlin, Heidelberg), 483–484.
Gehringer EF, Cross WT (2010) A suite of Google services for dailycourse evaluation. 40th Frontiers Ed. Conf. (FIE) (IEEE, Piscat-away, NJ), F4C-1–F4C-2.
GitHub (2014) GitHub. http://github.com.Grant MC, Boyd SP (2014) The CVX Users’ Guide Release 2.0.
http://cvxr.com/cvx/doc/CVX.pdf.Gurobi Optimization, Inc. (2014) Gurobi optimizer reference man-
ual. http://www.gurobi.com.Hubway (2012) Hubway data visualization challenge. http://
hubwaydatachallenge.org.IBM (2013) Version 12.6: User’s Manual for CPLEX, http://pic.dhe
.ibm.com/infocenter/cosinfoc/v12r6/.Kydd CT (2012) The effectiveness of using a Web-based applet to
teach concepts of linear programming: An experiment in activelearning. INFORMS Trans. Ed. 12(2):78–88.
Lee J, Raffensperger JF (2006) Using AMPL for teaching the TSP.INFORMS Trans. Ed. 7(1):37–69.
Lohr S (2012) The age of big data. New York Times (February 11).http://www.nytimes.com/2012/02/12/sunday-review/big-datas-impact-in-the-world.html.
Lubin M, Dunning I (2014) Computing in operations research usingJulia. INFORMS J. Comput. Forthcoming.
Lumley T (2013) Biglm: Bounded memory linear and general-ized linear models, R package version 0.9-1. http://CRAN.R-project.org/package=biglm.
McKinney W (2012) Python for Data Analysis (O’Reilly Media,Sebastopol, CA).
R Core Team (2014) R: A Language and Environment for StatisticalComputing. R Foundation for Statistical Computing, Vienna,Austria. http://www.R-project.org/.
RStudio, Inc (2014) Shiny: Web Application Framework for R,R package version 0.9.1. http://CRAN.R-project.org/package=shiny.
Smith KA, Sheppard SD, Johnson DW, Johnson RT (2005) Pedago-gies of engagement: Classroom-based practices. J. Engrg. Ed.94(1):87–101.
Vars GF (1991) Integrated curriculum in historical perspective. Edu-cational Leadership 49(2):14–15.
White T (2009) Hadoop: The Definitive Guide (O’Reilly Media,Sebastopol, CA).
Wickham H (2009) ggplot2: Elegant Graphics for Data Analysis(Springer, New York).
Wickham H (2011) The split-apply-combine strategy for data anal-ysis. J. Statist. Software 40(1):1–29.
Dow
nloa
ded
from
info
rms.
org
by [
45.4
8.25
0.70
] on
20
Sept
embe
r 20
16, a
t 22:
27 .
For
pers
onal
use
onl
y, a
ll ri
ghts
res
erve
d.