information visualization - introduction - tu wien€¦ · · 2014-11-17information visualization...
TRANSCRIPT

Information Visualization -Introduction
Eduard Gröller
Institute of Computer Graphics and Algorithms
Vienna University of Technology
Eduard Gröller Vienna University of Technology
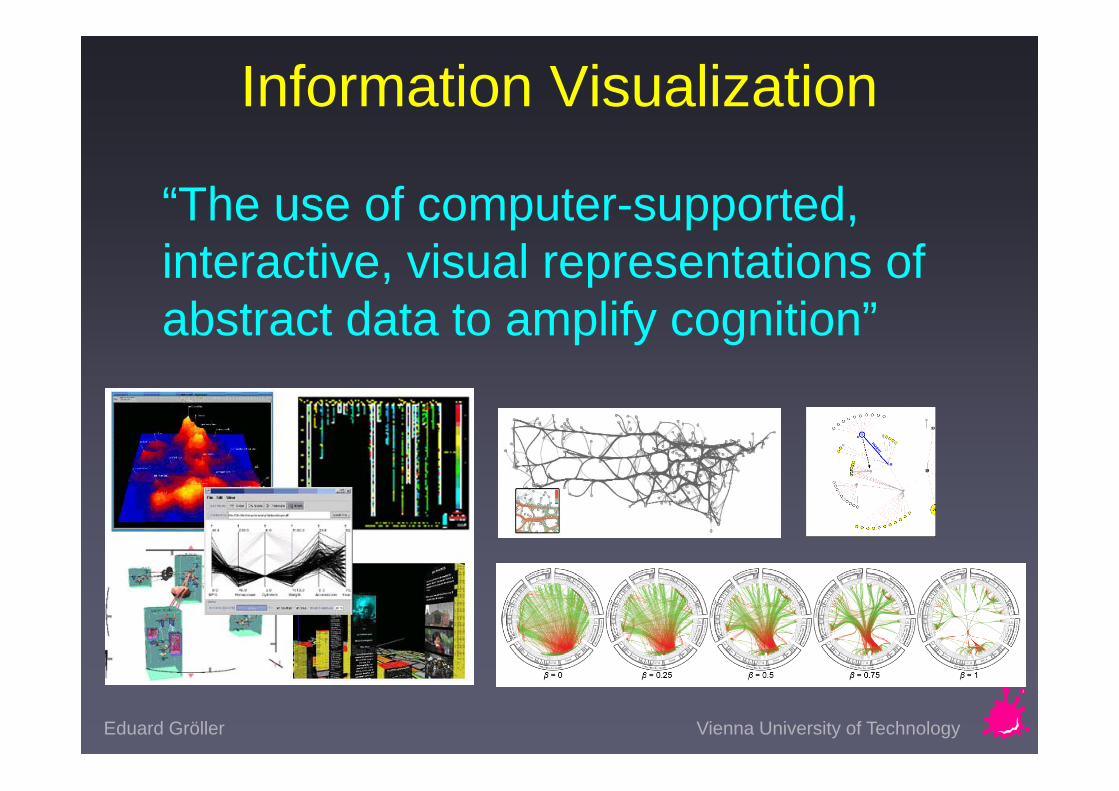
Information Visualization
“The use of computer-supported, interactive, visual representations of abstract data to amplify cognition”
Eduard Gröller Vienna University of Technology
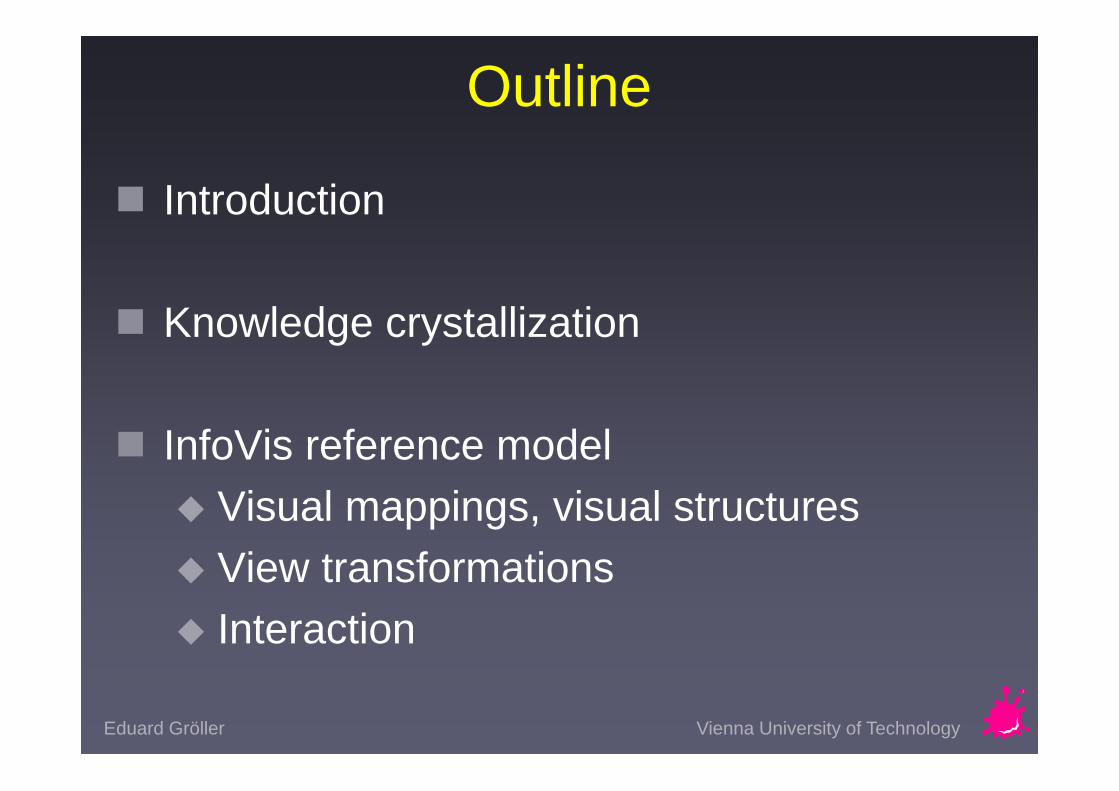
Outline
Introduction
Knowledge crystallization
InfoVis reference model Visual mappings, visual structures View transformations Interaction

Eduard Gröller Vienna University of Technology
How Many Zeros in 100 Digits of PI?
3.1 4 1 5 9 2 6 5 3 5 8 9 7 9 3 2 3 8 4 6 2 6 4 3 3 8 3 2 7 9 5 0 2 8 8 4 1 9 7 1 6 9 3 9 9 3 7 5 1 0 5 8 2 0 9 7 4 9 4 4 5 9 2 3 0 7 8 1 6 4 0 6 2 8 6 2 0 8 9 9 8 6 2 8 0 3 4 8 2 5 3 4 2 1 1 7 0 6 7 9 8 2 1 4
Courtesy of Jock Mackinlay

Eduard Gröller Vienna University of Technology
How Many Yellow Objects?
3.1 4 1 5 9 2 6 5 3 5 8 9 7 9 3 2 3 8 4 6 2 6 4 3 3 8 3 2 7 9 5 0 2 8 8 4 1 9 7 1 6 9 3 9 9 3 7 5 1 0 5 8 2 0 9 7 4 9 4 4 5 9 2 3 0 7 8 1 6 4 0 6 2 8 6 2 0 8 9 9 8 6 2 8 0 3 4 8 2 5 3 4 2 1 1 7 0 6 7 9 8 2 1 4
Courtesy of Jock Mackinlay

Eduard Gröller Vienna University of Technology
Strategy: Use External World
34x 72
0
20
40
60
80
100
120
Mental Paper & Pencil
Tim
e to
Mul
tiply
(sec
)
6823802448
2
1
Courtesy of Jock Mackinlay

Eduard Gröller Vienna University of Technology
Nomograph visual devices for specialized computations easy to do „what if“-calculations
Eduard Gröller Vienna University of Technology
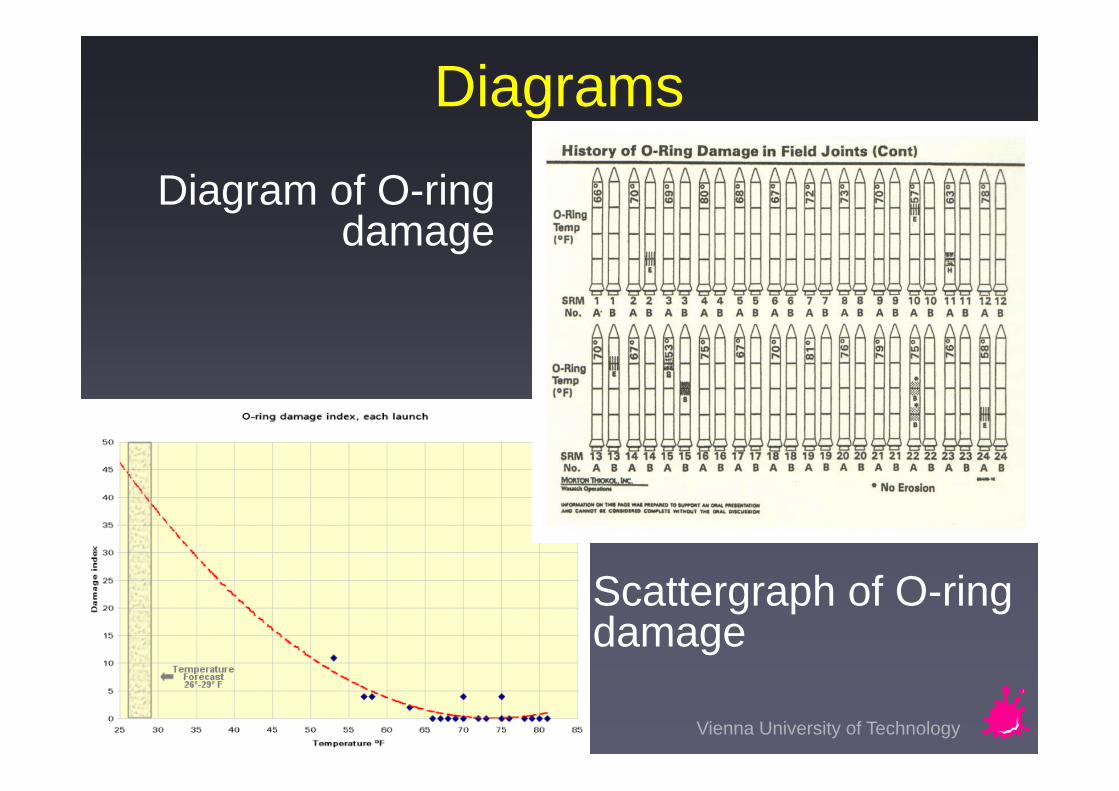
Diagrams
Scattergraph of O-ring damage
Diagram of O-ring damage

Eduard Gröller Vienna University of Technology
Information Visualization (InfoVis)
External Cognitionuse external world to accomplish cognition
Information Design
Visualization
design external representations to amplify cognition
computer-based, interactive
Scientific Visualization Information Visualizationtypically physical data abstract, nonphysical data
Courtesy of Jock Mackinlay

Eduard Gröller Vienna University of Technology
Knowledge Crystallization
OverviewZoomFilterDetailsBrowseSearch query
ReorderClusterClassAveragePromoteDetect patternAbstract
CreateDelete
ManipulateRead fact
Read patternRead compare
ExtractCompose
Present
task
foragefor data
search forvisual structure
instantiatedvisual structure
developinsight
create,decide,or act
Courtesy of Jock Mackinlay
Eduard Gröller Vienna University of Technology
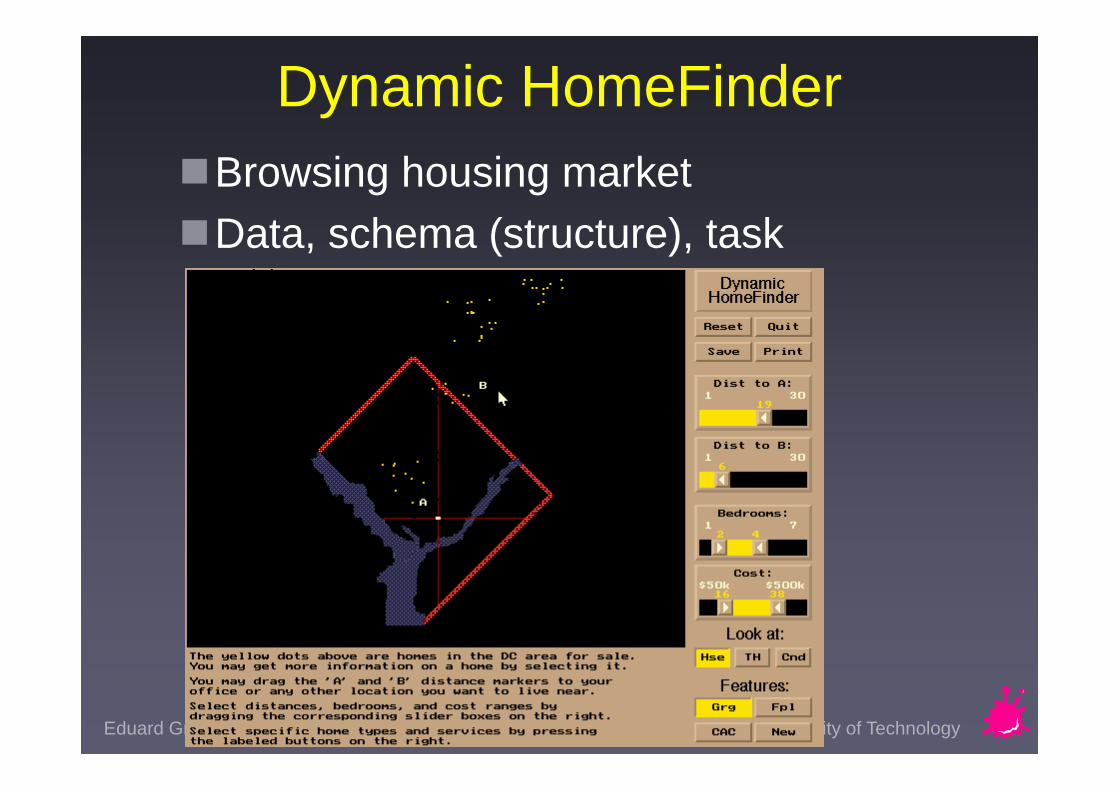
Dynamic HomeFinderBrowsing housing marketData, schema (structure), task

Eduard Gröller Vienna University of Technology
Table Lens ToolTable
visualization tool Instantiate
schemaManipulate
cases, variables

Eduard Gröller Vienna University of Technology
Knowledge Crystallization: Cost Structure
Walking Driving
Information visualization: Improve cost structure of information work
Representation = data structure + operations + constraints
Different cost relative to some task

Eduard Gröller Vienna University of Technology
InfoVis Reference Model
Raw Data: idiosyncratic formats Data Tables: relations(cases by variables)+metadata Visual Structures: spatial substrates + marks + graphical properties Views: graphical parameters (position, scaling, clipping, zooming,...)

Eduard Gröller Vienna University of Technology
Data

Eduard Gröller Vienna University of Technology
Raw Data
Other unitsSentenceParagraphSectionChapterCharactersPictures
Documents
Meta-dataDocument D1 D2 D3 …
Length 4 3 6 …
Author John Sally Lars …
Date 16/8 11/4 24/7 …… … … … …
billion
bolivar
bookboronbottom
brothbase
bay
bible
Words
aardvark
apply
Aarhus
arrowanode
anonymous
answer
are
area
aboutabsent
Word VectorsDocument D1 D2 D3 …
aardvark 1 0 0 …
Aarhus 0 1 0 …
about 1 0 1 …… … … … …
Meaning
Jock Mackinlay’s Slide

Eduard Gröller Vienna University of Technology
Raw Data Issues Errors Variable formats Missing data Variable types Table Structure
Document D1 A D3 …
Length 4 3.5 6 …
Author John Lars …
Date 16/8 Fall 24/7 …
… … … … …
Document D1 D2 D3 …
TUWIEN 1 0 0 …
UNIWIEN 0 1 0 …
about 1 0 1 …… … … … …
TUWIEN D1,...
UNIWIEN D2,…
about D1, D3, …
… …
VS
Courtesy of Jock Mackinlay

Eduard Gröller Vienna University of Technology
Data Transformations
Process of converting Raw Data into Data Tables.
Used to build and improve Data Tables

Eduard Gröller Vienna University of Technology
Data Tables Data Tables:
Cases/Items Variables
Nominal Quantitative Ordinal
Values Metadata
Anna
17
ID-11111
Hans
46
ID-22222
Peter
15
ID-33333
Name Anna Hans Peter
Age 17 46 15
ID 11111 22222 33333
NQO
Eduard Gröller Vienna University of Technology
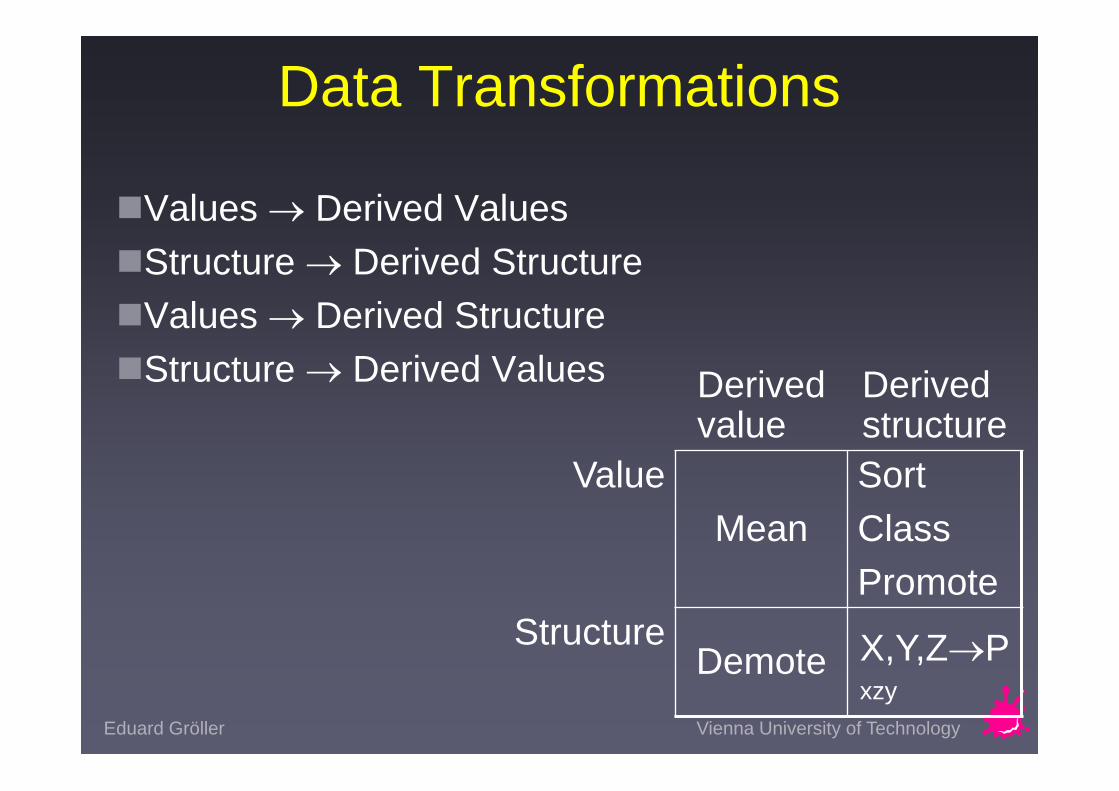
Data Transformations
Values Derived ValuesStructure Derived StructureValues Derived StructureStructure Derived Values Derived
valueDerived structure
ValueMean
SortClassPromote
StructureDemote X,Y,ZP
xzy
Eduard Gröller Vienna University of Technology
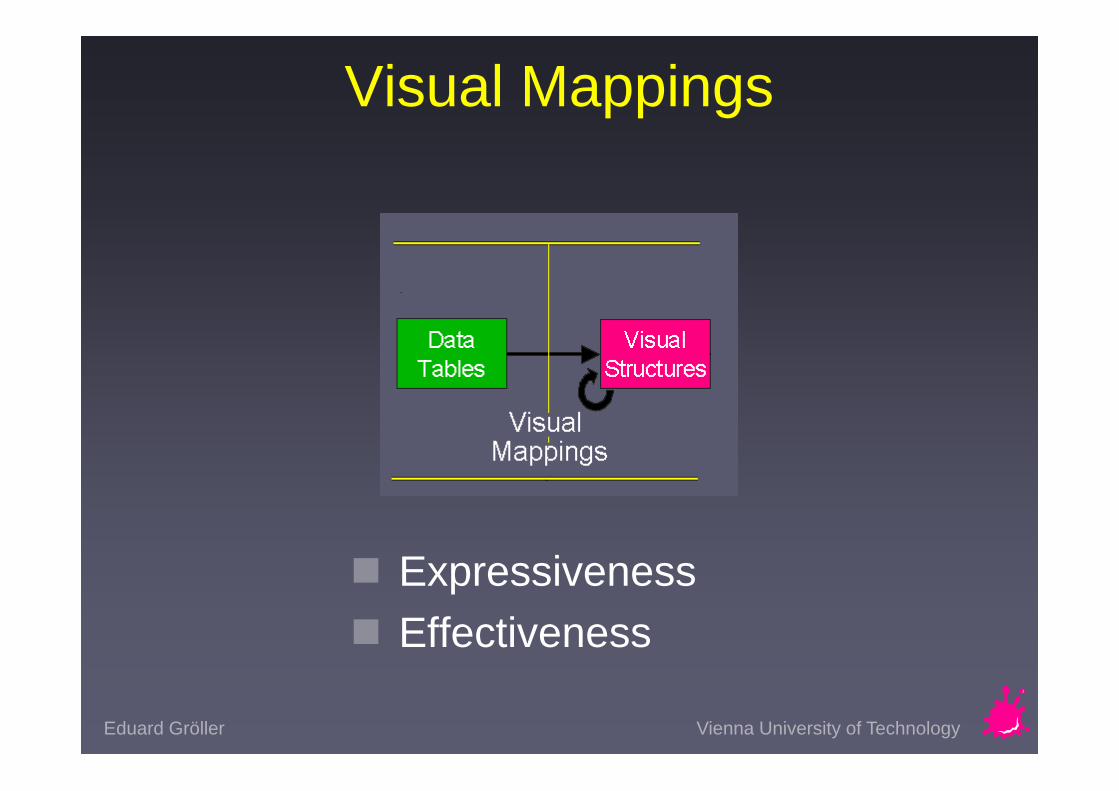
Visual Mappings
Expressiveness Effectiveness
Eduard Gröller Vienna University of Technology
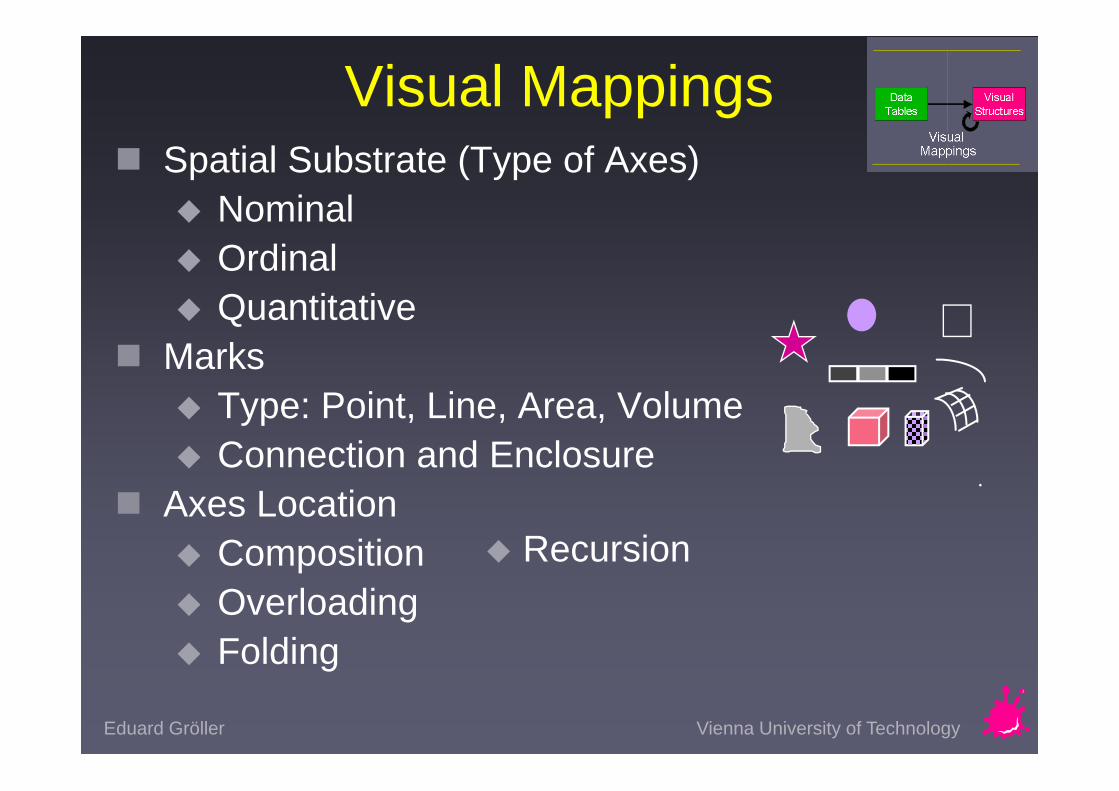
Visual Mappings Spatial Substrate (Type of Axes)
Nominal Ordinal Quantitative
Marks Type: Point, Line, Area, Volume Connection and Enclosure
Axes Location Composition Overloading Folding
Recursion
Eduard Gröller Vienna University of Technology
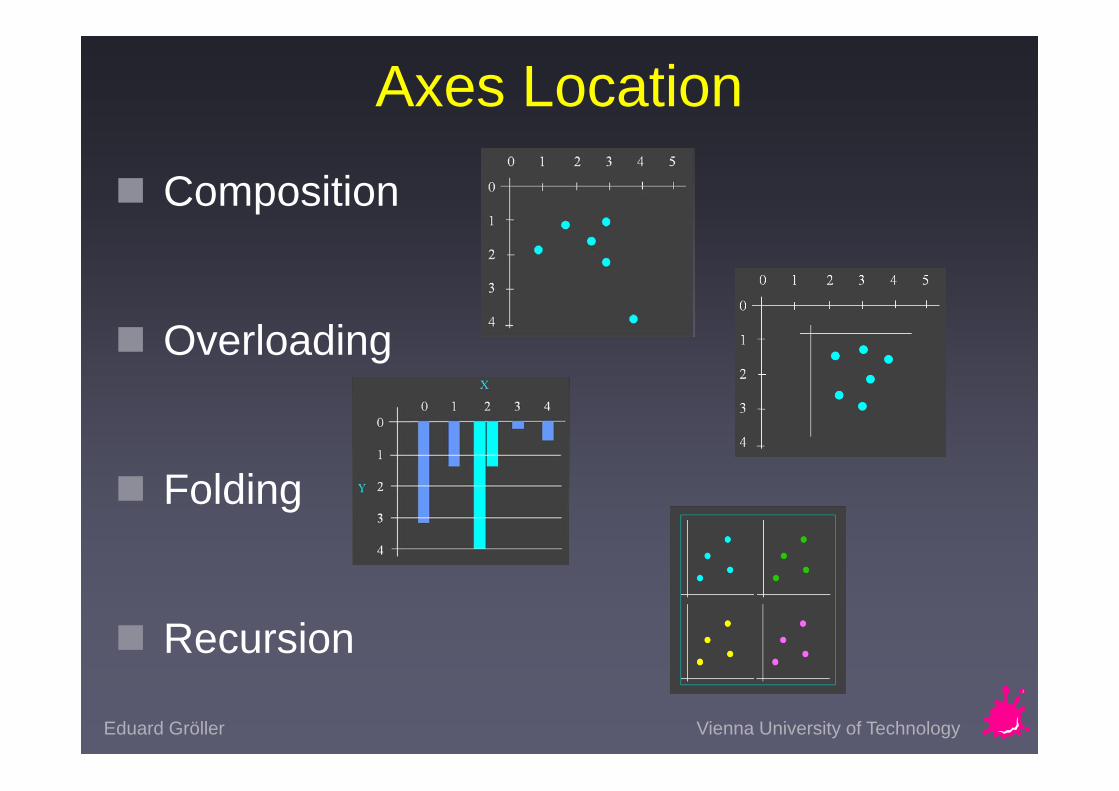
Axes Location
Composition
Overloading
Folding
Recursion
Eduard Gröller Vienna University of Technology
Visual Structures
Classification by use of space: 1D, 2D, 3D
Refers to visualizations that encode information by positioning marks on orthogonal axes
Multivariable >3D Data Tables have so many variables that orthogonal
Visual Structures are not sufficient Multiple Axes, Complex Axes
Trees Networks
Eduard Gröller Vienna University of Technology
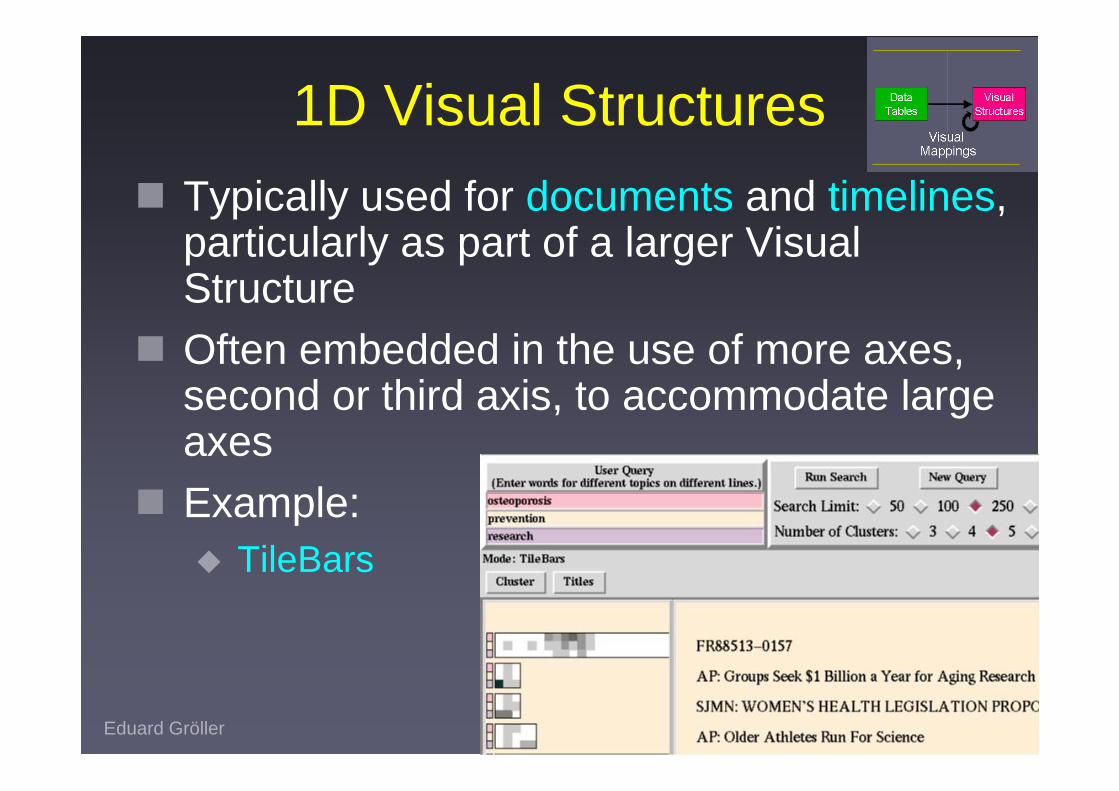
1D Visual Structures Typically used for documents and timelines,
particularly as part of a larger Visual Structure
Often embedded in the use of more axes, second or third axis, to accommodate large axes
Example: TileBars
Eduard Gröller Vienna University of Technology
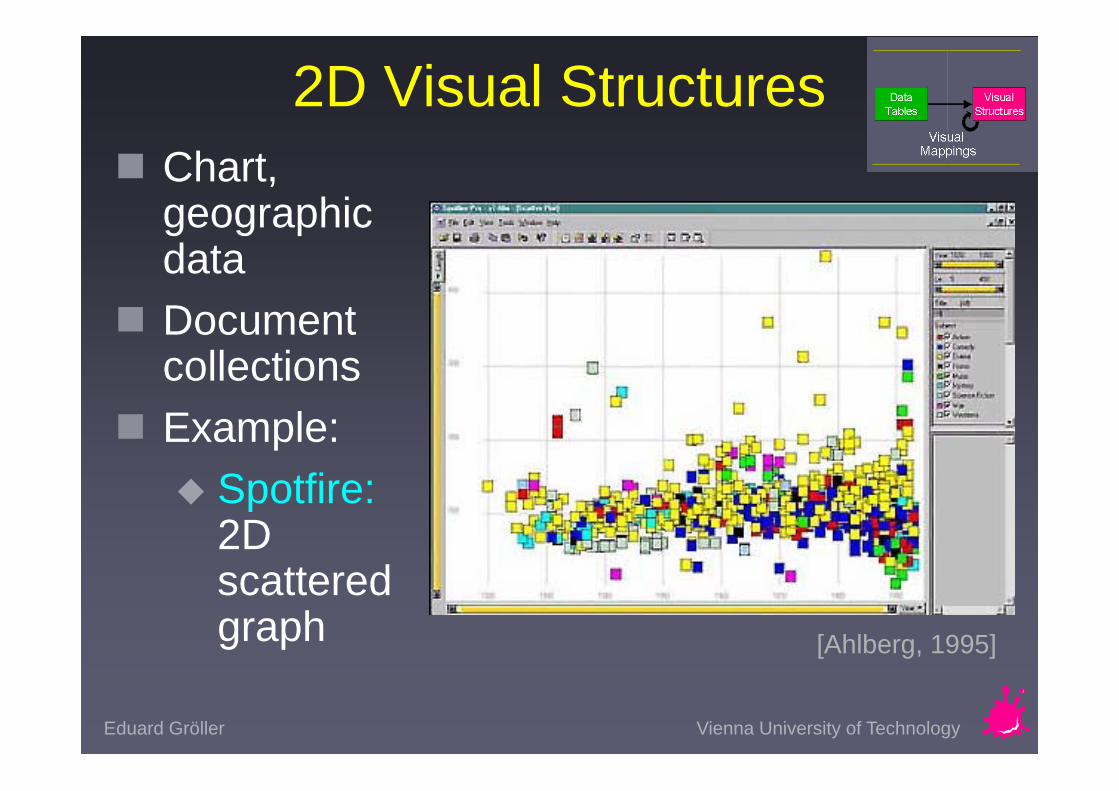
2D Visual Structures Chart,
geographic data
Document collections
Example: Spotfire:
2D scattered graph [Ahlberg, 1995]
Eduard Gröller Vienna University of Technology
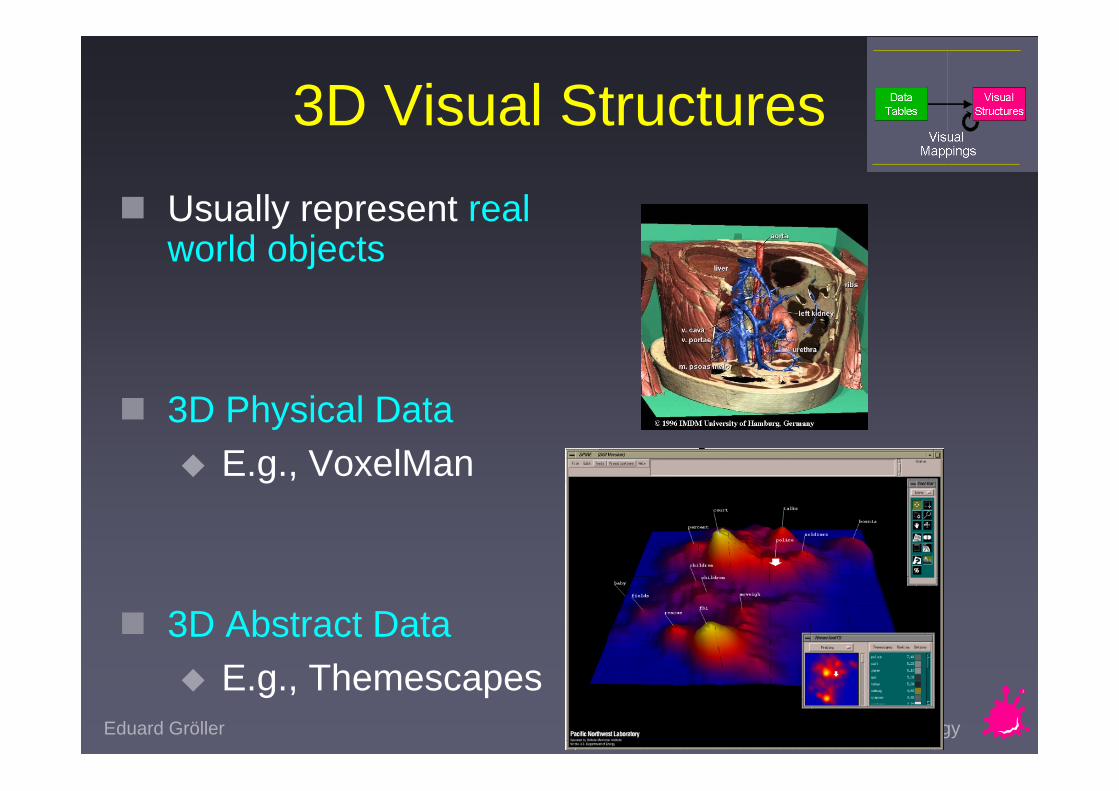
3D Visual Structures Usually represent real
world objects
3D Physical Data E.g., VoxelMan
3D Abstract Data E.g., Themescapes

Eduard Gröller Vienna University of Technology
Multivariable >3D Data Tables have so many variables
that orthogonal Visual Structures are not sufficient.
Example:Parallel Coordinates

Eduard Gröller Vienna University of Technology
Parallel Coordinates Parallel 2D axes. Add/Remove data
Establish Patterns Examine
interactions. Useful for recognizing
patterns between the axes
Skilled user

Eduard Gröller Vienna University of Technology
Parallel Coordinates
Encode variables along a horizontal rowVertical line specifies single variableBlue line specifies a case
[Inselberg]
Eduard Gröller Vienna University of Technology
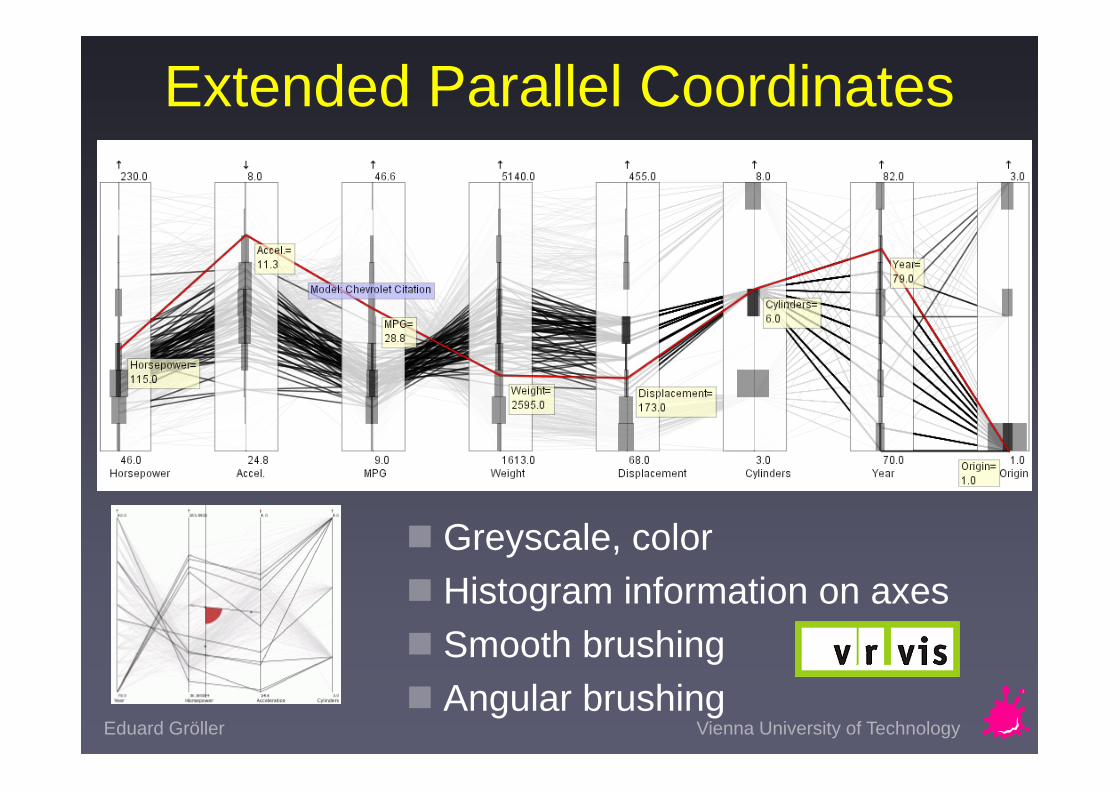
Extended Parallel Coordinates
Greyscale, color Histogram information on axes Smooth brushing Angular brushing
Eduard Gröller Vienna University of Technology
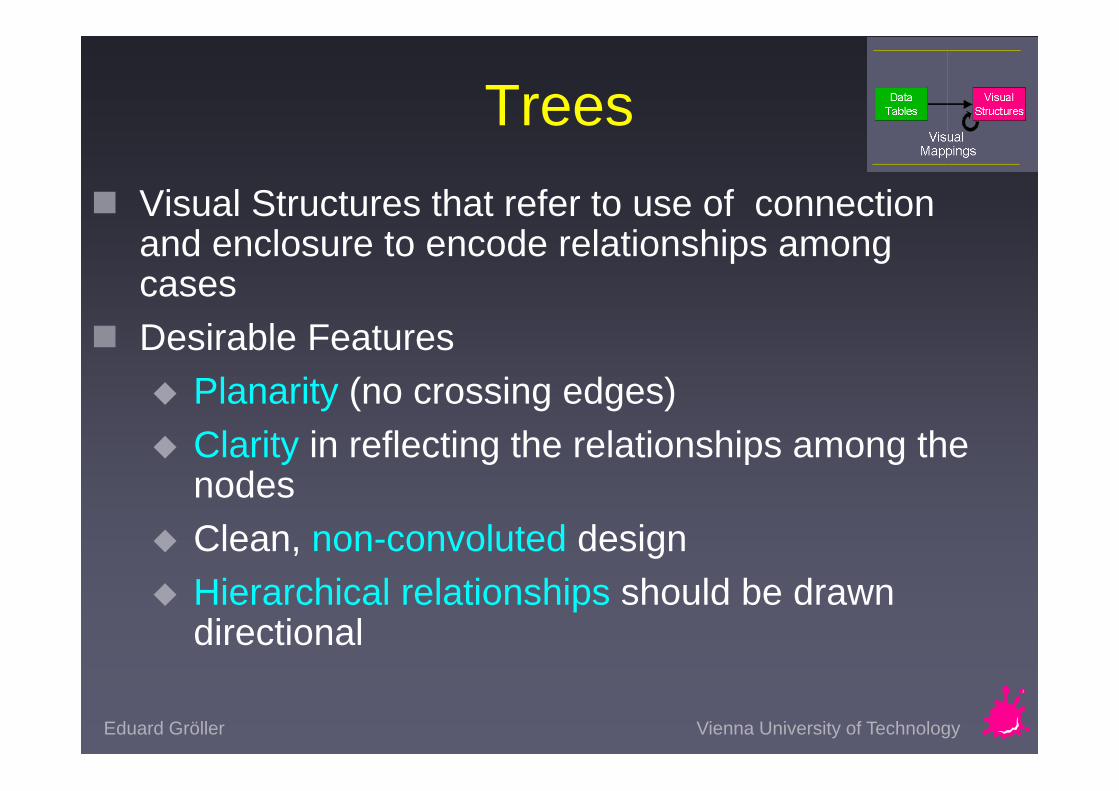
Trees Visual Structures that refer to use of connection
and enclosure to encode relationships among cases
Desirable Features Planarity (no crossing edges) Clarity in reflecting the relationships among the
nodes Clean, non-convoluted design Hierarchical relationships should be drawn
directional

Eduard Gröller Vienna University of Technology
Trees

Eduard Gröller Vienna University of Technology
Tree MapsOutline Tree diagram
Venn diagram
Nested treemap Treemap
[Johnson, Shneiderman, 1991]

Eduard Gröller Vienna University of Technology
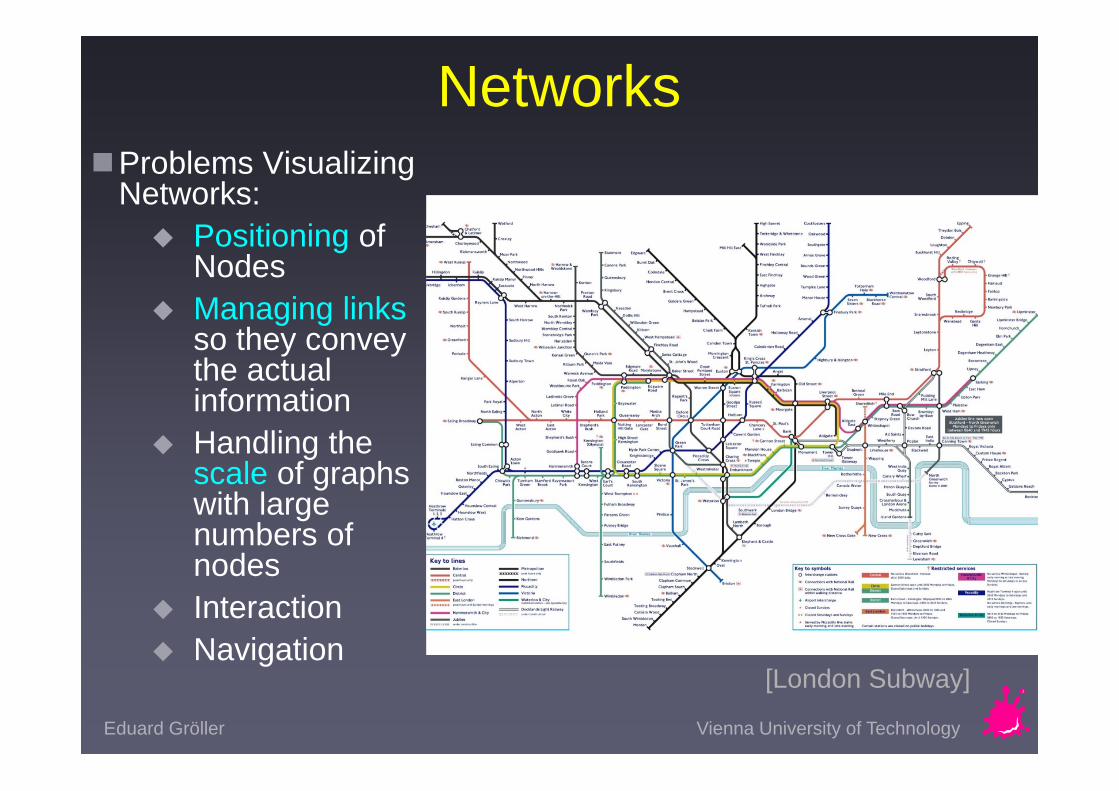
NetworksUsed to describe
Communication Networks, Telephone Systems, InternetNodes
Unstructured Nominal Ordinal Quantity
Links Directed Undirected
[Branigan et al, 2001]
Eduard Gröller Vienna University of Technology
NetworksProblems Visualizing
Networks: Positioning of
Nodes Managing links
so they convey the actual information
Handling the scale of graphs with large numbers of nodes
Interaction Navigation
[London Subway]
Eduard Gröller Vienna University of Technology
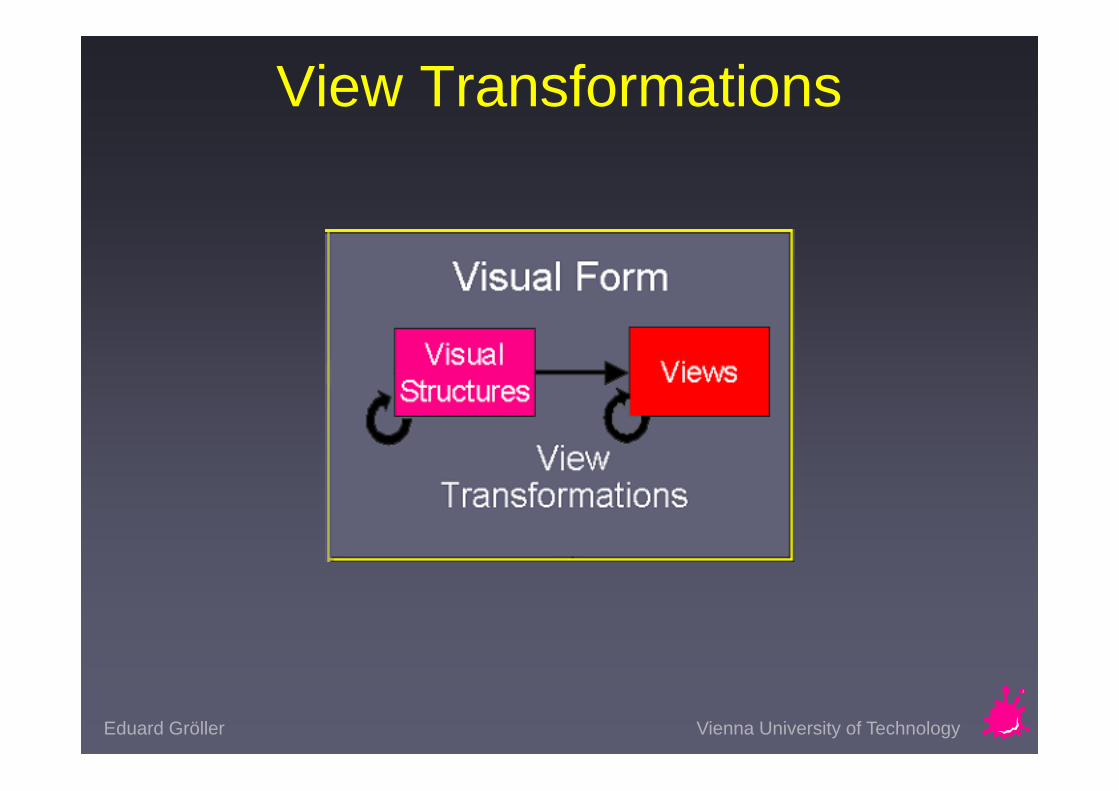
View Transformations

Eduard Gröller Vienna University of Technology
View Transformations Problems:
Scale Region of Interest How to specify focus?
Find new focus Stay oriented
Ability to interactively modify and augment visual structures, turning static presentations into visualizations
Overview + Detail
Zooming
Focus + Context

Eduard Gröller Vienna University of Technology
Overview + Detail
Provide both overview and detail displays Two ways to combine:
Time - Alternate between overview and detail sequentially
Space - Use different portions of the screen
Eduard Gröller Vienna University of Technology
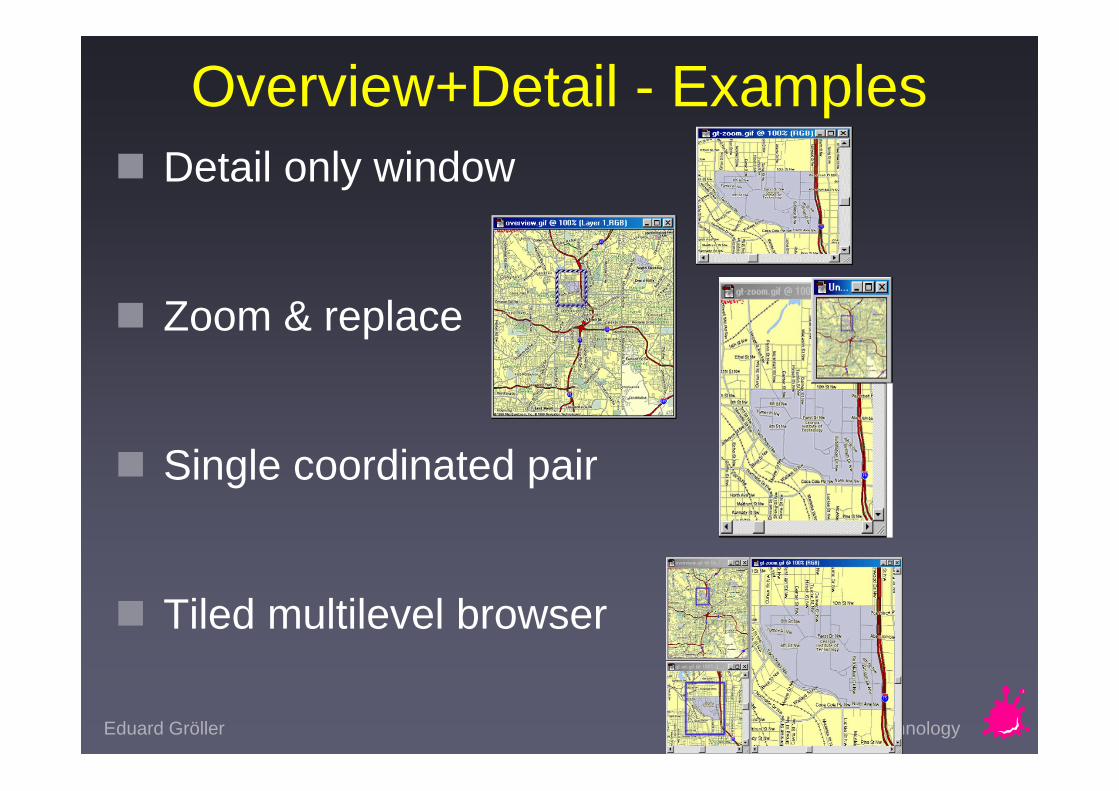
Overview+Detail - Examples Detail only window
Zoom & replace
Single coordinated pair
Tiled multilevel browser

Eduard Gröller Vienna University of Technology
Overview+Detail - Examples
Free zoom and multiple overlap
Bifocal magnified
Fish-eye view (Focus+Context)

Eduard Gröller Vienna University of Technology
Focus + Context
Overview Content Detail Content Dynamical Integration
Rationale Zooming hides the context Two separate displays split attention Human vision has both fovea and retina
Courtesy of Jock Mackinlay
Eduard Gröller Vienna University of Technology
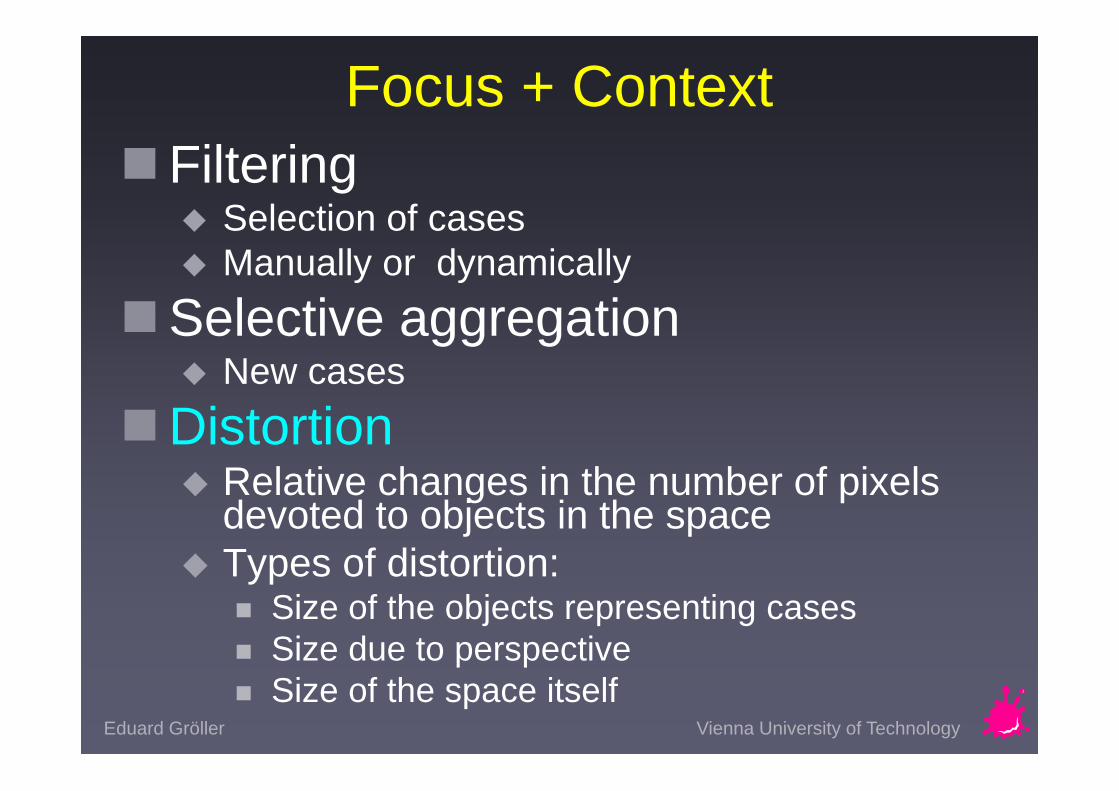
Focus + ContextFiltering
Selection of cases Manually or dynamically
Selective aggregation New cases
Distortion Relative changes in the number of pixels
devoted to objects in the space Types of distortion:
Size of the objects representing cases Size due to perspective Size of the space itself

Eduard Gröller Vienna University of Technology
Focus + Context - Examples
Hyperbolic tree
Perspective Wall
Document Lens

Eduard Gröller Vienna University of Technology
Visual Transfer Function
Functions that distort visualizations by stretching or compressing them, giving the portion of visualization attended to more visual detail
DOI - Degree Of Interest Function

Eduard Gröller Vienna University of Technology
Interaction
Details-on-DemandDynamic QueriesBrushing

Eduard Gröller Vienna University of Technology
Details-on-Demand Expands a set of small objects to reveal more
of their variables
Allows more variables to be mapped to the visualization
Location: Favoriten Strasse 9
Rooms: 20
Conference Room: Yes
Availability: Occupied
Location: Michaelerstrasse 1
Rooms: 5
Conference Room: Yes
Availability: Under Construction
Looking for new office HQs???

Eduard Gröller Vienna University of Technology

Eduard Gröller Vienna University of Technology
Dynamic Queries
FilmFinder : Visual means of specifying conjunctions

Eduard Gröller Vienna University of Technology
Brushing Used with multiple visualizations of the same
objects Highlighting one case from the Data Table selects
the same case in other views Linking and Brushing
[Doleisch et al.]
Eduard Gröller Vienna University of Technology
Further Readings The Information Visualization community platform
http://www.infovis-wiki.net/index.php/Main_Page Card, S., Mackinlay, J., Shneiderman B., Readings in
Information Visualization, Morgan Kaufmann, 1999. Shneiderman, B., The eyes have it: A task by data
type taxonomy for information visualizations, Proc. IEEE Visual Languages 1996, 336-343.
Ware, C., Information Visualization - Perception for Design, second edition 2004, Morgan Kaufmann
Tufte, E., The Visual Disply of Quantitative Information, second edition, 2001, Graphics Press
North, C., http://infovis.cs.vt.edu/cs5764/readings.html

Eduard Gröller 52
Interesting LinksGoogle Public Data Explorer
http://www.google.com/publicdata/home
Hans Rosling – Gapminderhttp://www.ted.com/speakers/hans_rosling.html
IBM – Many Eyeshttp://many-eyes.com/
Visual Complexityhttp://www.visualcomplexity.com/
Further Links - External Linkshttp://www.cg.tuwien.ac.at/courses/InfoVis/index.html