information technology inhibitors and information quality
TRANSCRIPT
E-ISSN 2281-4612 ISSN 2281-3993
Academic Journal of Interdisciplinary Studies
Vol 7 No 3 November 2018
125
.
Research Article© 2018 Alma Sheko and Alma Braimllari (Spaho).
This is an open access article licensed under the Creative CommonsAttribution-NonCommercial-NoDerivs License
(http://creativecommons.org/licenses/by-nc-nd/3.0/).
Information Technology Inhibitors and Information Quality in Supply Chain Management: A PLS-SEM Analysis
Ph.D.(c), Alma Sheko
Faculty of Technical Sciences,
University of Vlora, Albania
Prof. Assoc.Dr., Alma Braimllari (Spaho)
Faculty of Economy, University of Tirana, Albania
Doi: 10.2478/ajis-2018-0064 Abstract
The development of information technology has simplified the exchange of information between different parts of the supply chain. Information quality plays an important role in enhancing supply chain performance. The aim of this research was to explore the relationships between SCM-IT inhibitors, IT enablers, information sharing, and information quality in supply chain management. Data for 183 business units operating in Vlore, Albania during 2017 were analyzed. Direct and mediating or indirect effects were also analyzed. The data were analyzed using partial least squares structural equation modeling (PLS-SEM), an advanced statistical technique with the help of Smart-PLS version 3.2.7. PLS algorithm was used to determine the factor loadings and path coefficients in the theoretical model. The study has concluded that SCM-IT inhibitors have a negative and significant effect on information quality; the mediation effect of information sharing was significant, the mediation effect of IT enablers was significant; however, the multiple mediation effects of IT enablers and information sharing was not significant. These findings are useful for top management and IT specialists of the business units, and also for information technology services and products providers.
Keywords: Information technology enablers, SCM-IT inhibitors, Information sharing, mediation analysis, Albania
1. Introduction Supply chain management (SCM) includes the management of product, financial flow, and information from the source of supplies to the manufacture and assembly of the product right to the delivering of the final product to the consumer. It also includes the management of after sales service and the product returns (Lee, 2000). The objectives of SCM are to increase productivity, reduce inventory and cycle time but its ultimate goal is to increase customer satisfaction, market share, and profits for the entire supply chain in the long run (Wisner & Tan, 2005). The significant importance of managing service sectors, as the main driving force of the structures of today’s economies, has enabled the use of a new concept in SCM, Service Supply Chain (SSC). Baltacioglu et al. (2007) has determined service supply chain as the network of service providers, suppliers, and consumers and other supporting units that perform the functions of the transaction of resources required to produce services; the transformation of these resources into supporting and core services; and the delivery of these services to customers. According to Ellram et al. (2004), service supply chain management should mainly focus on the management of information,
E-ISSN 2281-4612 ISSN 2281-3993
Academic Journal of Interdisciplinary Studies
Vol 7 No 3 November 2018
126
processes, capacity, service performances and funds across the supply chain from the upper stream supplier to the downstream customer.
Information Technology (IT) and its use in enterprises and across the supply chain has become an important factor of competitive advantage for many corporations (Nair et al., 2009). Recent progresses in both information and technology have enabled many industry practices of acquiring, sharing, and using information (Fu & Zhu, 2010). Effective information flows within and across organizations are essential to managing supply chains, and such SCM operations cannot be possible without Information Systems management (Tatoglu et al., 2015). The aim of this study was to explore the direct and indirect relationships between information sharing, information quality, IT enablers, and SCM-IT inhibitors using PLS-SEM approach. 2. Literature Review 2.1 Information Sharing and Information Quality in SCM The most important issues of the coordination among enterprises are information sharing and information quality. Information can have dual functions; it benefits the supply chain entities and it can contribute to the improvement in organizational performance and competitive advantage (Lee & Whang, 2000). Information exchange has been viewed from different perspectives including technological, organizational, sociological and politic context (Yang & Pardo, 2011). The following types of information are of relevance: inventory level, sales data, sales forecast, order status, production and delivery schedules, production and transportation capacity, performance metrics such as: quality data, lead times, queuing delays, and service performance, etc. (Lee & Whang, 2000; Moharana et al., 2013). According to Moharana et al., 2013, there are barriers that prevent companies from sharing such information, mainly based on the existing belief that information represents power and sharing it results in loss of power and threaten the sharer’s position in the supply chain. Depending on the need of the organization, information related to market, product, design, process, production, pricing, planning, inventory, logistic, demand forecasting, order, promotion strategies, customer demand, production schedule, distribution operation, technological knowhow, manufacturing methods and sales forecast can be shared with the supply chain partners (Omar et al., 2010). Li et al. (2005) emphasize the importance of information sharing to SCM practice. Baihaqi and Sohal (2013) suggests that information sharing is fundamental but insufficient by itself to bring about significant performance improvements; rather than relying on the shared information received from partners or asking partners to share information, companies need to focus on establishing good relationships with their partners and hence having trust in each other that good quality information is shared in a timely manner.
Information quality is a vital component for organizational success in companies (Li et al., 2006; Miller et al., 2005). According to Forslund and Jonsson (2007), the quality of information shall include these attributes: accuracy, timeliness, suitability, and reliability of shared information. Access to relevant information would enable firms to reduce uncertainty and improve planning which in turn improves their profitability (Omar et al., 2010). Quality of information would help firms to improve information exchange among supply chain partners (Baihaqi & Sohal, 2013). Inadequate information exchange and poor quality of information seem to have an impact on the effectiveness and efficiency of the supply chain performance (Omar et al., 2010). According to Auramo et al. (2005), the use of e-business solutions improves information quality.
Li et al. (2005) developed a measurement instrument for SCM practices. Their measurement instrument contains six estimated dimensions, which encompasses strategic supplier partnership, information sharing, customer relationship, information quality, postponement and internal lean practices. SCM practices are defined as a set of activities aimed at improving the performance of the supply chain (Li et al., 2005; Qrunfleh et al., 2010). In this study, Information sharing and information quality are considered as SCM practices, as suggested by Li et al. (2005), Li & Lin (2006) and Qrunfleh et al. (2010).
E-ISSN 2281-4612 ISSN 2281-3993
Academic Journal of Interdisciplinary Studies
Vol 7 No 3 November 2018
127
2.2 IT enablers and SCM-IT inhibitors Effective utilization of IT tools can enhance visibility in the supply chain of which blind spot with regard to supply chain requirement could be eliminated. Many researchers consider IT a great enabler for information sharing and information quality in SCM (Li &Lin, 2006; Omar et al., 2010). IT enablers are defined as the information technology used to facilitate information sharing and information quality in SCM (Li & Lin, 2006). IT enables coordination across organizational boundaries to achieve a new level of efficiency and productivity and open new up possibilities for increasing value through better communication and information sharing. The adoption of different IT tools facilitates information sharing and quality in SCM. Electronic Data Interchange (EDI) is defined as computer to computer exchange of structured data for automatic processing. EDI is used by supply chain partners to exchange essential information necessary for the effective running of their businesses (Omar et al, 2010). Electronic Fund Transfer (EFT) is a very useful IT enabler. EFT permits the electronic transfer of money or funds across the supply chain without the exchange of paper money. Hence, this facilitates the rapid transfer of goods and supplies between the buyer and seller (Ramayah et al., 2008). The Internet enables the integration of supply chains with lower cost, the availability of rich content, and support for linking supply chain partners who are located at long distances from each other. The Internet provides direct connectivity to anyone over a local area network (LAN) or Internet Service. The Internet provides many services: e-mail, website, file transfer, social media, e-commerce etc. Other existing information technology tools and applications in supply chain management are Bar coding and Scanners, Enterprise Resource Planning Systems, Warehouse Management Systems, Transportation Management Systems, Inventory Management Systems, Radio Frequency Identification (RFID), etc.
A special consideration is given to exploring the SCM and IT related inhibiting factors. SCM-IT inhibitors consist of factors that prevent the achievement of the operational performance through SCM practices and IT (Bayraktar et al., 2009). Bayraktar et al. (2009) found negative and strong direct relationship between SCM-IT inhibitors and SCM practices, and IT practices of business units in Turkey. Ketikidis et al. (2008) found that, among the types of problems facing sample companies in the South-East Europe region when using IT related to SCM and Logistics; integration with supplier’s systems comes first followed by shortages of skills, integration with existing and customer’s systems. 3. Research Methodology This study analyses business units operating in Vlore City, Albania with 2 or more employees. According to the General Directorate of Taxation in Vlora, during 2017 have operated 2000 business units with at least 2 employees. In total, 300 questionnaires were randomly distributed to top managers, executives and IT specialists of targeted companies during the year 2017. Only 183 questionnaires were returned and were used for the data analysis, representing a response rate of 61% and approximately 9% of the target population. The questionnaire included questions about: company profile (experience, sector, industry, number of employees), items to measure the level of information sharing and information quality between supply chain partners, SCM-IT inhibitors and IT enablers in SCM.
Items to measure information sharing and information quality were adapted from Li and Lin (2006) and measured on a 1–5 Likert scale from “Strongly Disagree” to “Strongly Agree”. Respondents were asked about the frequency of problems they encountered from using SCM practices and IT in their business unit. The items for SCM-IT inhibitors were adopted from (Tatoglu et al., 2015) and measured based on a 1–5 Likert scale from ‘not at all’ to ‘very frequently’. The items for IT enablers were adapted from Li and Lin (2006) and measured on a 1–5 Likert scale from “not at all” to “to a great extent”. 3.1 Theoretical framework The proposed research model for this study is supposed to have four latent constructs: SCM-IT
E-ISSN 2281-4612 ISSN 2281-3993
Academic Journal of Interdisciplinary Studies
Vol 7 No 3 November 2018
128
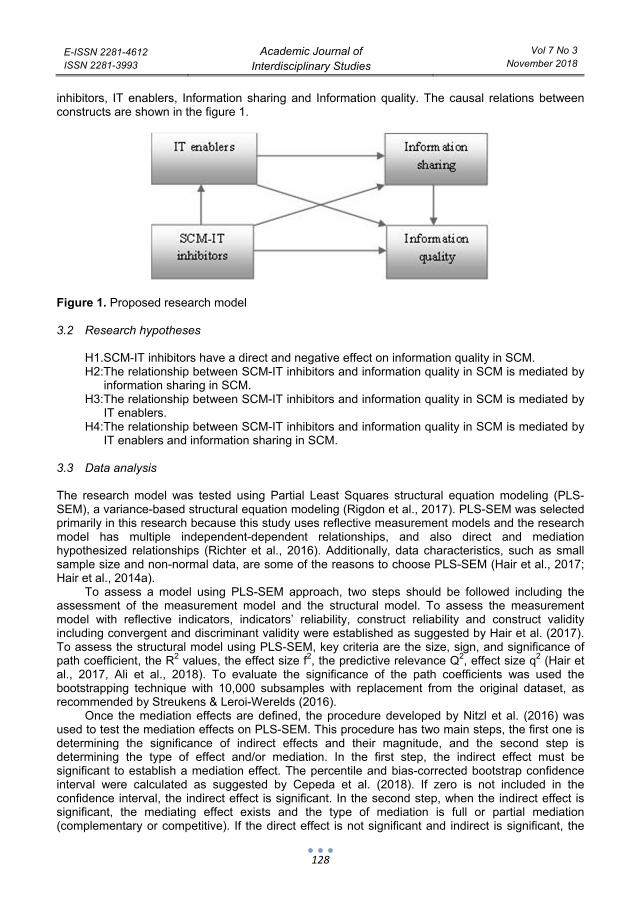
inhibitors, IT enablers, Information sharing and Information quality. The causal relations between constructs are shown in the figure 1.
Figure 1. Proposed research model 3.2 Research hypotheses
H1.SCM-IT inhibitors have a direct and negative effect on information quality in SCM. H2:The relationship between SCM-IT inhibitors and information quality in SCM is mediated by
information sharing in SCM. H3:The relationship between SCM-IT inhibitors and information quality in SCM is mediated by
IT enablers. H4:The relationship between SCM-IT inhibitors and information quality in SCM is mediated by
IT enablers and information sharing in SCM. 3.3 Data analysis The research model was tested using Partial Least Squares structural equation modeling (PLS-SEM), a variance-based structural equation modeling (Rigdon et al., 2017). PLS-SEM was selected primarily in this research because this study uses reflective measurement models and the research model has multiple independent-dependent relationships, and also direct and mediation hypothesized relationships (Richter et al., 2016). Additionally, data characteristics, such as small sample size and non-normal data, are some of the reasons to choose PLS-SEM (Hair et al., 2017; Hair et al., 2014a).
To assess a model using PLS-SEM approach, two steps should be followed including the assessment of the measurement model and the structural model. To assess the measurement model with reflective indicators, indicators’ reliability, construct reliability and construct validity including convergent and discriminant validity were established as suggested by Hair et al. (2017). To assess the structural model using PLS-SEM, key criteria are the size, sign, and significance of path coefficient, the R2 values, the effect size f2, the predictive relevance Q2, effect size q2 (Hair et al., 2017, Ali et al., 2018). To evaluate the significance of the path coefficients was used the bootstrapping technique with 10,000 subsamples with replacement from the original dataset, as recommended by Streukens & Leroi-Werelds (2016).
Once the mediation effects are defined, the procedure developed by Nitzl et al. (2016) was used to test the mediation effects on PLS-SEM. This procedure has two main steps, the first one is determining the significance of indirect effects and their magnitude, and the second step is determining the type of effect and/or mediation. In the first step, the indirect effect must be significant to establish a mediation effect. The percentile and bias-corrected bootstrap confidence interval were calculated as suggested by Cepeda et al. (2018). If zero is not included in the confidence interval, the indirect effect is significant. In the second step, when the indirect effect is significant, the mediating effect exists and the type of mediation is full or partial mediation (complementary or competitive). If the direct effect is not significant and indirect is significant, the
E-ISSN 2281-4612 ISSN 2281-3993
Academic Journal of Interdisciplinary Studies
Vol 7 No 3 November 2018
129
mediation is full mediation, so only the indirect effect via the mediator exists. In a complementary partial mediation, both direct and indirect effects are significant and point in the same direction (positive or negative), whereas in a competitive partial mediation, both effects point in a different direction. Mediation analysis can be extended to evaluate the statistical difference between two specific indirect effects (Lau & Cheung, 2012; Chin et al., 2013: Rodrigez-Entrena et al., 2018, Cepeda et al., 2018). Also, multiple mediation, in which two or more mediators are connected to each other, is a frequently encountered case. Castro and Roldan (2013) provide research on how to test such multiple relationships in a PLS path model.
STATA 15 and SmartPLS 3.2.7 packages were used to analyze the quantitative data obtained from the survey questionnaire. STATA was applied to perform descriptive statistics such as frequencies, percentages, mean values, standard deviations, skewness and kurtosis, and exploratory factor analysis. SmartPLS version 3.2.7 statistical software (Ringle et al. 2015) was used to explore statistical relationships between the measurement items of each construct and among the constructs.
All measurement items and their descriptive statistics are shown in Table 1, in Appendix. The results of exploratory factor analysis are shown in table 2, in Appendix. 4. Results and Discussion 4.1 Sample characteristics The results indicated that about 83% of the business units in the sample were retailers, 58% of them were local business units and 28% were national business units. About 29% of them have less than 5 years of experience, 28% have 10-14 years of experience and 21% have 5-9 years of experience. Related to the number of employees, 43% of the business units have 2 to 5 employees, 33% have 6 to 10 employees, and 14% have more than 16 employees. About 46.45% of the business units are in the hospitality-tourism industry; 71% in the service sector, 15 in the trading sector and 10% in the production sector. Most of the respondents were directors/managers of the business units (72.52 %) and IT specialist (7.59%). 4.2 Results of PLS-SEM analysis 4.2.1 Measurement Model Confirmatory factor analysis (CFA) is carried out to validate the measurement model by evaluating the relationships between the constructs and their respective measurement items. An initial CFA was conducted and based on the results one item of SCM-IT inhibitors (INH 2) was deleted due to low indicator loadings (0.589), in order to increase the construct’s reliability and validity. For the rest of the measurement items, the CFA was carried out again.
To test the reliability of each construct, Cronbach’s alpha (α) coefficients and Composite reliability (CR) values were calculated. For Likert-type scales with 5 levels, Cronbach’s alpha underestimates reliability; consequently, its use is not recommended (Gadermann et al., 2012). Composite reliability (CR) provides a more appropriate measure of internal consistency reliability compared to traditionally Cronbach’s alpha coefficients (Hair et al., 2017). Cronbach’s alpha values for the constructs range from 0.715 to 0.948, indicating good reliability. Composite reliabilities range from 0.837 to 0.959 higher than the 0.70 threshold level of acceptability. The results of table 1 show a generally high degree of internal consistency among the constructs.
To assess convergent validity, three criteria were used: the size of indicator loadings, average variance extracted (AVE) and the significance of the indicator loadings. Standardized items loadings ranged from 0.699 to 0.951, exceeding the recommended value of 0.70. For each construct, the AVE values ranged from 0.632 to 0.799, higher than the minimum acceptable value of 0.50, establishing that more than 50% of the construct’s variance is due to its measurement items. Table 1 presents the values of indicators loadings, composite reliability, Cronbach’s alpha, and AVE. The significance of the indicators loadings was determined through the bootstrapping
E-ISSN 2281-4612 ISSN 2281-3993
Academic Journal of Interdisciplinary Studies
Vol 7 No 3 November 2018
130
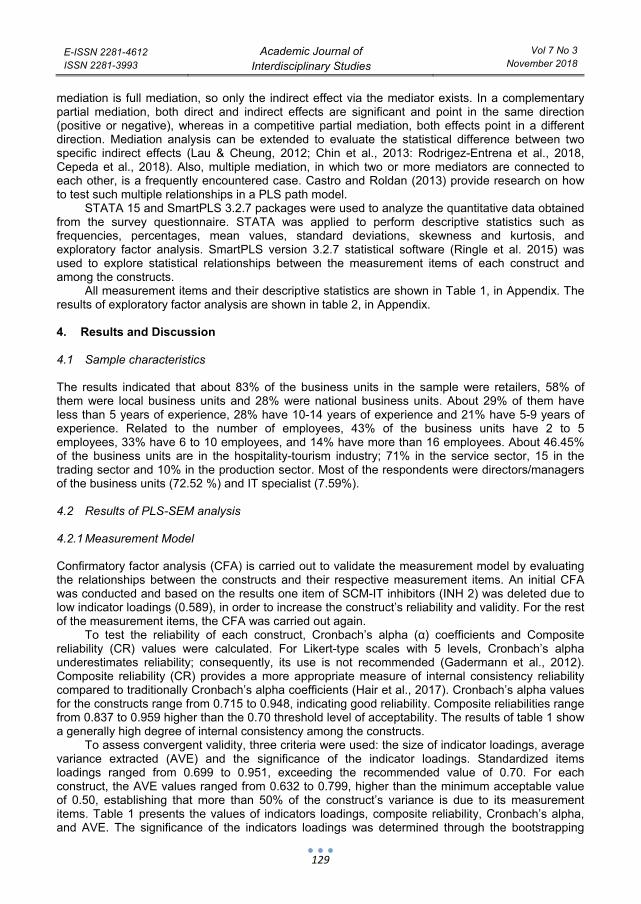
resampling procedure (10,000 subsamples of the original sample) to obtain the t-statistic values and p-values. All the indicators loadings were significant at the 5% level. Table 1. Results of reflective measurement model Constructs and items Loadings CR α AVE SCM-IT inhibitors (INH) 0.959 0.948 0.799 INH 1. Resistance to change from employees 0.777 INH 3. Skills shortages 0.905 INH 4. Insufficient vendor support 0.945 INH 5. Integration with existing information technologies 0.951 INH 6. Integration with supplier’s information technologies 0.818 INH 7. Integration with customer’s information technologies 0.950 IT enablers (EN) 0.849 0.734 0.655 EN 1. The extent of usage of EDI, Intranet, Extranet in your business unit. 0.825 EN 2. The extent of usage of EFT (Electronic Found Transfer) in your business unit. 0.892 EN 3. The extent of usage of Internet in your business unit. 0.699 Informacion Sharing (ISH) 0.837 0.715 0.632 ISH 1. We inform trading partners in advance of changing needs. 0.745 ISH 2. Our trading partners share proprietary information with us. 0.855 ISH 3. Our trading partners share business knowledge of core business processes with us. 0.781 Information quality (IQ) 0.943 0.925 0.769 IQ 1. Information exchange between our trading partners and us is timely. 0.833 IQ 2. Information exchange between our trading partners and us is accurate. 0.886 IQ 3. Information exchange between our trading partners and us is complete. 0.916 IQ 4. Information exchange between our trading partners and us is adequate. 0.858 IQ 5. Information exchange between our trading partners and us is reliable. 0.890
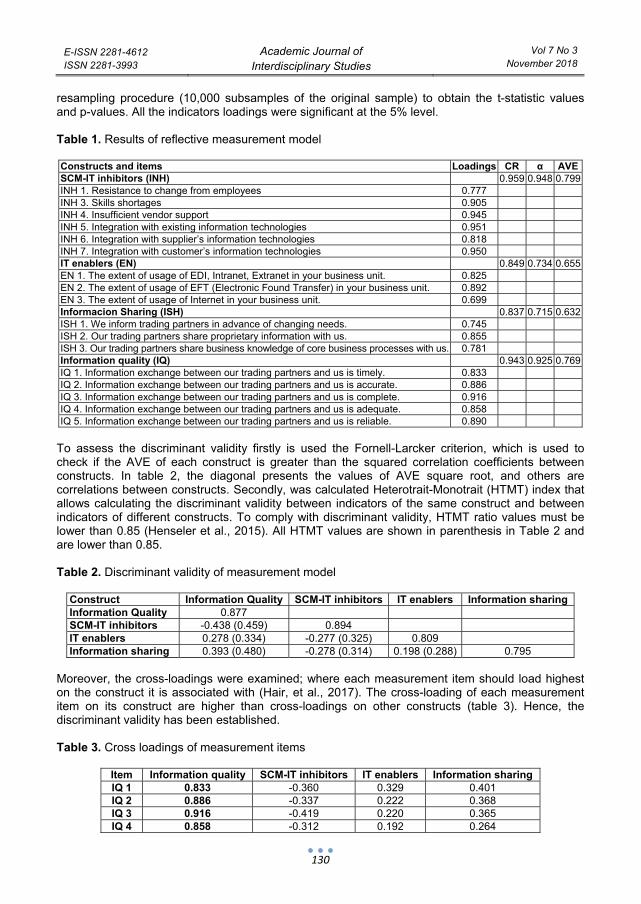
To assess the discriminant validity firstly is used the Fornell-Larcker criterion, which is used to check if the AVE of each construct is greater than the squared correlation coefficients between constructs. In table 2, the diagonal presents the values of AVE square root, and others are correlations between constructs. Secondly, was calculated Heterotrait-Monotrait (HTMT) index that allows calculating the discriminant validity between indicators of the same construct and between indicators of different constructs. To comply with discriminant validity, HTMT ratio values must be lower than 0.85 (Henseler et al., 2015). All HTMT values are shown in parenthesis in Table 2 and are lower than 0.85. Table 2. Discriminant validity of measurement model
Construct Information Quality SCM-IT inhibitors IT enablers Information sharing Information Quality 0.877 SCM-IT inhibitors -0.438 (0.459) 0.894 IT enablers 0.278 (0.334) -0.277 (0.325) 0.809 Information sharing 0.393 (0.480) -0.278 (0.314) 0.198 (0.288) 0.795
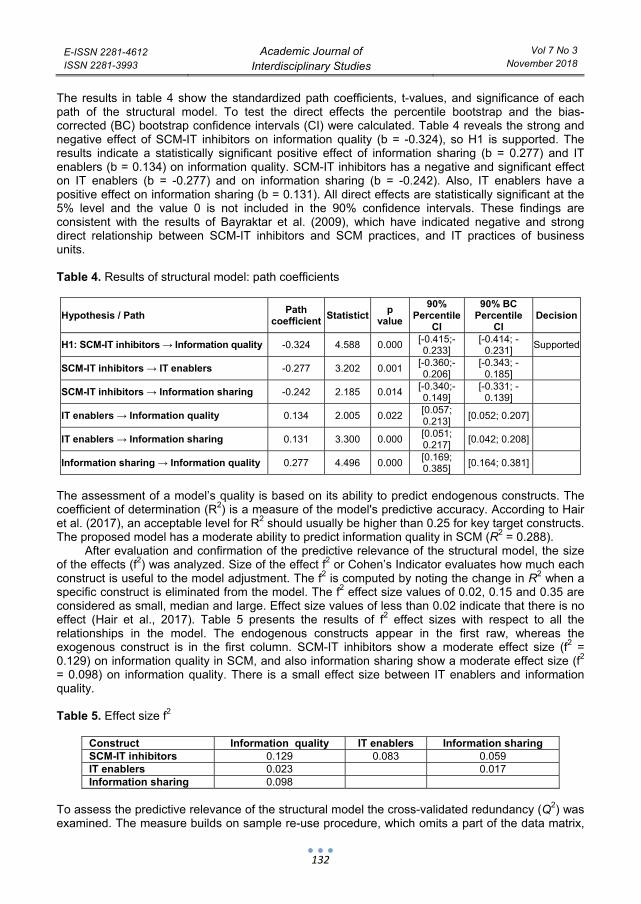
Moreover, the cross-loadings were examined; where each measurement item should load highest on the construct it is associated with (Hair, et al., 2017). The cross-loading of each measurement item on its construct are higher than cross-loadings on other constructs (table 3). Hence, the discriminant validity has been established. Table 3. Cross loadings of measurement items
Item Information quality SCM-IT inhibitors IT enablers Information sharing IQ 1 0.833 -0.360 0.329 0.401 IQ 2 0.886 -0.337 0.222 0.368 IQ 3 0.916 -0.419 0.220 0.365 IQ 4 0.858 -0.312 0.192 0.264
E-ISSN 2281-4612 ISSN 2281-3993
Academic Journal of Interdisciplinary Studies
Vol 7 No 3 November 2018
131
Item Information quality SCM-IT inhibitors IT enablers Information sharing IQ 5 0.890 -0.470 0.241 0.308
INH 1 -0.327 0.777 -0.127 -0.267 INH 3 -0.422 0.905 -0.219 -0.218 INH 4 -0.450 0.945 -0.266 -0.233 INH 5 -0.408 0.951 -0.284 -0.259 INH 6 -0.279 0.818 -0.321 -0.233 INH 7 -0.440 0.950 -0.256 -0.286 EN 1 0.212 -0.221 0.825 0.253 EN 2 0.254 -0.272 0.892 0.117 EN 3 0.210 -0.169 0.699 0.096 ISH 1 0.324 -0.091 0.001 0.745 ISH 2 0.317 -0.195 0.173 0.855 ISH 3 0.304 -0.328 0.245 0.781
Thus, it is concluded that the constructs of this study showed significant evidence of reliability and of convergent and discriminant validity. The subsequent phase is to examine the structural model to test the proposed hypotheses. 4.2.2 Structural model After the analysis of the measurement model and verifying its reliability and validity, the proposed model structural model was examined. The structural model must be tested for potential collinearity between the exogenous constructs. Collinearity between the independent constructs is not a critical issue in the structural model (Hair, et al., 2017). The VIF values are less than 1.2 for each of the exogenous constructs in the structural model.
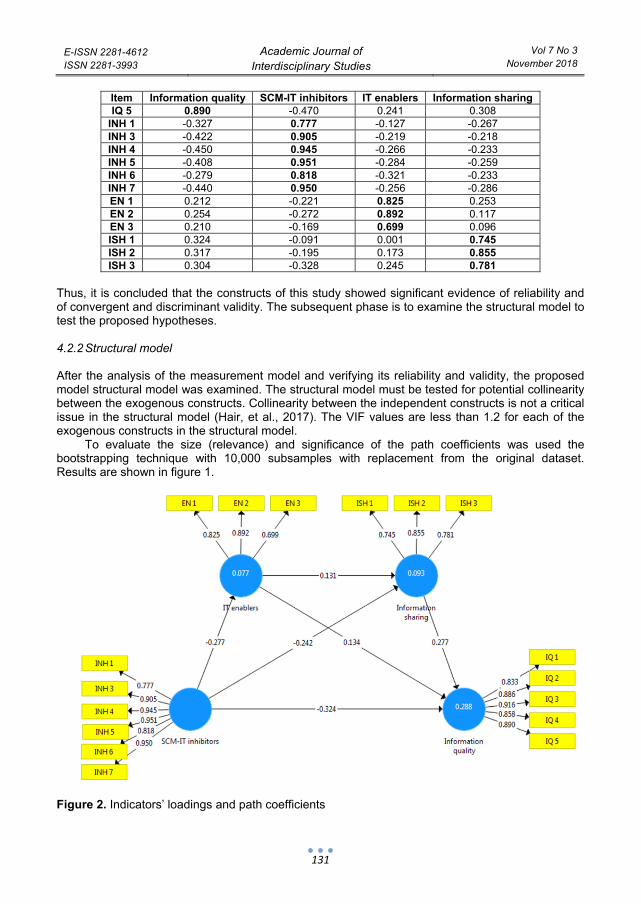
To evaluate the size (relevance) and significance of the path coefficients was used the bootstrapping technique with 10,000 subsamples with replacement from the original dataset. Results are shown in figure 1.
Figure 2. Indicators’ loadings and path coefficients
E-ISSN 2281-4612 ISSN 2281-3993
Academic Journal of Interdisciplinary Studies
Vol 7 No 3 November 2018
132
The results in table 4 show the standardized path coefficients, t-values, and significance of each path of the structural model. To test the direct effects the percentile bootstrap and the bias-corrected (BC) bootstrap confidence intervals (CI) were calculated. Table 4 reveals the strong and negative effect of SCM-IT inhibitors on information quality (b = -0.324), so H1 is supported. The results indicate a statistically significant positive effect of information sharing (b = 0.277) and IT enablers (b = 0.134) on information quality. SCM-IT inhibitors has a negative and significant effect on IT enablers (b = -0.277) and on information sharing (b = -0.242). Also, IT enablers have a positive effect on information sharing (b = 0.131). All direct effects are statistically significant at the 5% level and the value 0 is not included in the 90% confidence intervals. These findings are consistent with the results of Bayraktar et al. (2009), which have indicated negative and strong direct relationship between SCM-IT inhibitors and SCM practices, and IT practices of business units. Table 4. Results of structural model: path coefficients
Hypothesis / Path Path coefficient Statistict p
value 90%
Percentile CI
90% BC Percentile
CI Decision
H1: SCM-IT inhibitors → Information quality -0.324 4.588 0.000 [-0.415;-0.233]
[-0.414; -0.231] Supported
SCM-IT inhibitors → IT enablers -0.277 3.202 0.001 [-0.360;-0.206]
[-0.343; -0.185]
SCM-IT inhibitors → Information sharing -0.242 2.185 0.014 [-0.340;-0.149]
[-0.331; -0.139]
IT enablers → Information quality 0.134 2.005 0.022 [0.057; 0.213] [0.052; 0.207]
IT enablers → Information sharing 0.131 3.300 0.000 [0.051; 0.217] [0.042; 0.208]
Information sharing → Information quality 0.277 4.496 0.000 [0.169; 0.385] [0.164; 0.381]
The assessment of a model’s quality is based on its ability to predict endogenous constructs. The coefficient of determination (R2) is a measure of the model's predictive accuracy. According to Hair et al. (2017), an acceptable level for R2 should usually be higher than 0.25 for key target constructs. The proposed model has a moderate ability to predict information quality in SCM (R2 = 0.288).
After evaluation and confirmation of the predictive relevance of the structural model, the size of the effects (f2) was analyzed. Size of the effect f2 or Cohen’s Indicator evaluates how much each construct is useful to the model adjustment. The f2 is computed by noting the change in R2 when a specific construct is eliminated from the model. The f2 effect size values of 0.02, 0.15 and 0.35 are considered as small, median and large. Effect size values of less than 0.02 indicate that there is no effect (Hair et al., 2017). Table 5 presents the results of f2 effect sizes with respect to all the relationships in the model. The endogenous constructs appear in the first raw, whereas the exogenous construct is in the first column. SCM-IT inhibitors show a moderate effect size (f2 = 0.129) on information quality in SCM, and also information sharing show a moderate effect size (f2 = 0.098) on information quality. There is a small effect size between IT enablers and information quality. Table 5. Effect size f2
Construct Information quality IT enablers Information sharing SCM-IT inhibitors 0.129 0.083 0.059 IT enablers 0.023 0.017 Information sharing 0.098
To assess the predictive relevance of the structural model the cross-validated redundancy (Q2) was examined. The measure builds on sample re-use procedure, which omits a part of the data matrix,
E-ISSN 2281-4612 ISSN 2281-3993
Academic Journal of Interdisciplinary Studies
Vol 7 No 3 November 2018
133
estimates the model parameters and predicts the omitted part using the estimates (blindfolding procedure). The smaller the difference between predictive and original values the greater the Q2 and thus the model’s predictive accuracy. The predictive relevance (Q2) or blindfolding values larger than 0 suggest that the model has predictive relevance for a certain endogenous construct, and values of 0 or below indicate a lack of predictive relevance (Hair et al., 2017). The values of Q2 were 0.201, 0.045 and 0.043 for information quality, IT enablers and information sharing respectively, providing support for the predictive relevance of the structural model’s endogenous constructs (Sarstedt et al., 2014).
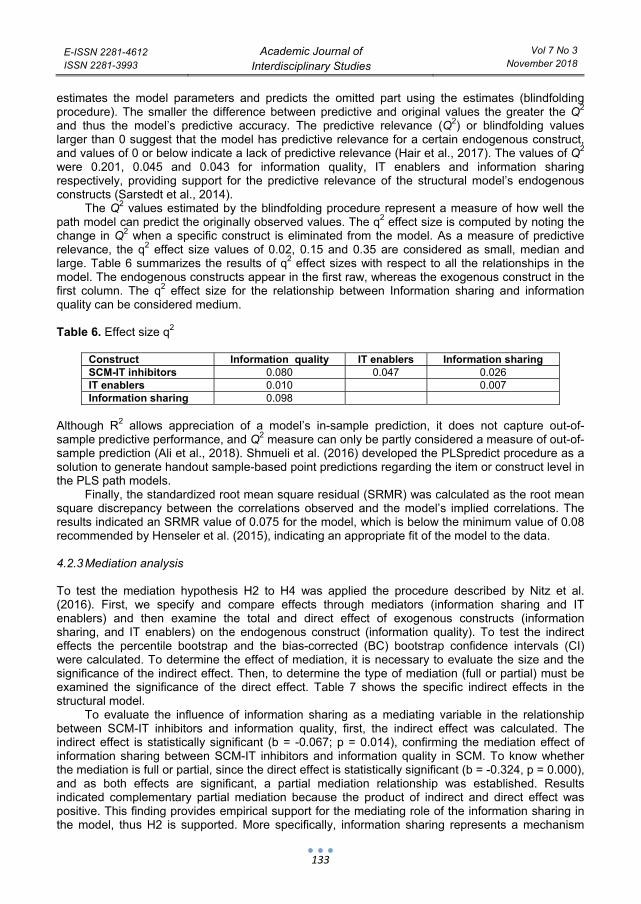
The Q2 values estimated by the blindfolding procedure represent a measure of how well the path model can predict the originally observed values. The q2 effect size is computed by noting the change in Q2 when a specific construct is eliminated from the model. As a measure of predictive relevance, the q2 effect size values of 0.02, 0.15 and 0.35 are considered as small, median and large. Table 6 summarizes the results of q2 effect sizes with respect to all the relationships in the model. The endogenous constructs appear in the first raw, whereas the exogenous construct in the first column. The q2 effect size for the relationship between Information sharing and information quality can be considered medium. Table 6. Effect size q2
Construct Information quality IT enablers Information sharing SCM-IT inhibitors 0.080 0.047 0.026 IT enablers 0.010 0.007 Information sharing 0.098
Although R2 allows appreciation of a model’s in-sample prediction, it does not capture out-of-sample predictive performance, and Q2 measure can only be partly considered a measure of out-of-sample prediction (Ali et al., 2018). Shmueli et al. (2016) developed the PLSpredict procedure as a solution to generate handout sample-based point predictions regarding the item or construct level in the PLS path models.
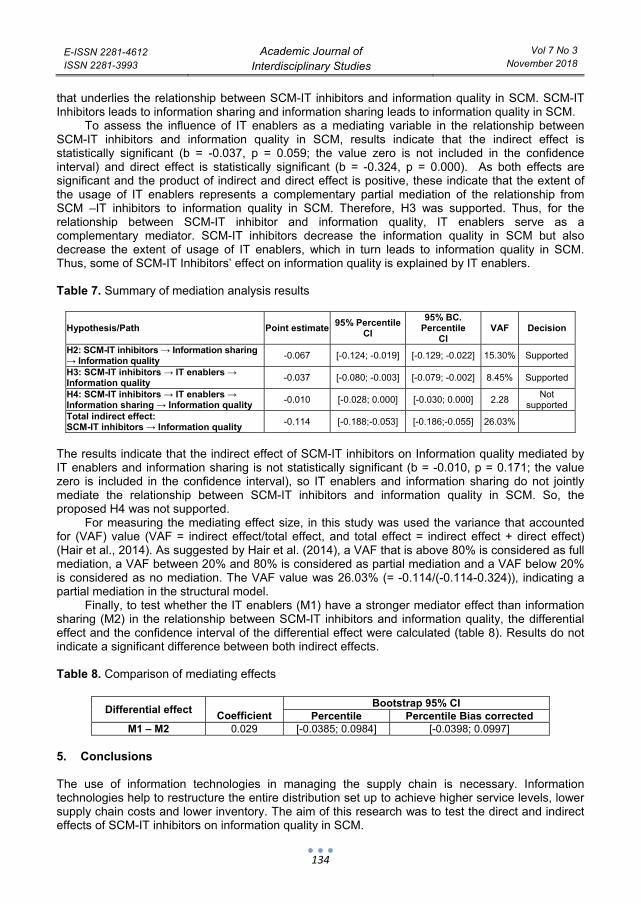
Finally, the standardized root mean square residual (SRMR) was calculated as the root mean square discrepancy between the correlations observed and the model’s implied correlations. The results indicated an SRMR value of 0.075 for the model, which is below the minimum value of 0.08 recommended by Henseler et al. (2015), indicating an appropriate fit of the model to the data. 4.2.3 Mediation analysis To test the mediation hypothesis H2 to H4 was applied the procedure described by Nitz et al. (2016). First, we specify and compare effects through mediators (information sharing and IT enablers) and then examine the total and direct effect of exogenous constructs (information sharing, and IT enablers) on the endogenous construct (information quality). To test the indirect effects the percentile bootstrap and the bias-corrected (BC) bootstrap confidence intervals (CI) were calculated. To determine the effect of mediation, it is necessary to evaluate the size and the significance of the indirect effect. Then, to determine the type of mediation (full or partial) must be examined the significance of the direct effect. Table 7 shows the specific indirect effects in the structural model.
To evaluate the influence of information sharing as a mediating variable in the relationship between SCM-IT inhibitors and information quality, first, the indirect effect was calculated. The indirect effect is statistically significant (b = -0.067; p = 0.014), confirming the mediation effect of information sharing between SCM-IT inhibitors and information quality in SCM. To know whether the mediation is full or partial, since the direct effect is statistically significant (b = -0.324, p = 0.000), and as both effects are significant, a partial mediation relationship was established. Results indicated complementary partial mediation because the product of indirect and direct effect was positive. This finding provides empirical support for the mediating role of the information sharing in the model, thus H2 is supported. More specifically, information sharing represents a mechanism
E-ISSN 2281-4612 ISSN 2281-3993
Academic Journal of Interdisciplinary Studies
Vol 7 No 3 November 2018
134
that underlies the relationship between SCM-IT inhibitors and information quality in SCM. SCM-IT Inhibitors leads to information sharing and information sharing leads to information quality in SCM.
To assess the influence of IT enablers as a mediating variable in the relationship between SCM-IT inhibitors and information quality in SCM, results indicate that the indirect effect is statistically significant (b = -0.037, p = 0.059; the value zero is not included in the confidence interval) and direct effect is statistically significant (b = -0.324, p = 0.000). As both effects are significant and the product of indirect and direct effect is positive, these indicate that the extent of the usage of IT enablers represents a complementary partial mediation of the relationship from SCM –IT inhibitors to information quality in SCM. Therefore, H3 was supported. Thus, for the relationship between SCM-IT inhibitor and information quality, IT enablers serve as a complementary mediator. SCM-IT inhibitors decrease the information quality in SCM but also decrease the extent of usage of IT enablers, which in turn leads to information quality in SCM. Thus, some of SCM-IT Inhibitors’ effect on information quality is explained by IT enablers. Table 7. Summary of mediation analysis results
Hypothesis/Path Point estimate 95% PercentileCI
95% BC. Percentile
CI VAF Decision
H2: SCM-IT inhibitors → Information sharing → Information quality -0.067 [-0.124; -0.019] [-0.129; -0.022] 15.30% Supported
H3: SCM-IT inhibitors → IT enablers → Information quality -0.037 [-0.080; -0.003] [-0.079; -0.002] 8.45% Supported
H4: SCM-IT inhibitors → IT enablers → Information sharing → Information quality -0.010 [-0.028; 0.000] [-0.030; 0.000] 2.28 Not
supported Total indirect effect: SCM-IT inhibitors → Information quality -0.114 [-0.188;-0.053] [-0.186;-0.055] 26.03%
The results indicate that the indirect effect of SCM-IT inhibitors on Information quality mediated by IT enablers and information sharing is not statistically significant (b = -0.010, p = 0.171; the value zero is included in the confidence interval), so IT enablers and information sharing do not jointly mediate the relationship between SCM-IT inhibitors and information quality in SCM. So, the proposed H4 was not supported.
For measuring the mediating effect size, in this study was used the variance that accounted for (VAF) value (VAF = indirect effect/total effect, and total effect = indirect effect + direct effect) (Hair et al., 2014). As suggested by Hair et al. (2014), a VAF that is above 80% is considered as full mediation, a VAF between 20% and 80% is considered as partial mediation and a VAF below 20% is considered as no mediation. The VAF value was 26.03% (= -0.114/(-0.114-0.324)), indicating a partial mediation in the structural model.
Finally, to test whether the IT enablers (M1) have a stronger mediator effect than information sharing (M2) in the relationship between SCM-IT inhibitors and information quality, the differential effect and the confidence interval of the differential effect were calculated (table 8). Results do not indicate a significant difference between both indirect effects. Table 8. Comparison of mediating effects
5. Conclusions The use of information technologies in managing the supply chain is necessary. Information technologies help to restructure the entire distribution set up to achieve higher service levels, lower supply chain costs and lower inventory. The aim of this research was to test the direct and indirect effects of SCM-IT inhibitors on information quality in SCM.
Differential effect Coefficient
Bootstrap 95% CI Percentile Percentile Bias corrected
M1 – M2 0.029 [-0.0385; 0.0984] [-0.0398; 0.0997]
E-ISSN 2281-4612 ISSN 2281-3993
Academic Journal of Interdisciplinary Studies
Vol 7 No 3 November 2018
135
The results of the structural model confirmed that ‘SCM-IT inhibitors’ has a direct and negative effect on information quality in SCM. So, executives and IT specialist of business units in Vlore should focus more on SCM-IT inhibitors to increase the information quality in SCM. The results of mediation analysis confirmed the mediation of information sharing in the relationship between SCM-IT inhibitors and information quality in SCM. Thus, information sharing represents a mechanism that underlies the relationship between SCM-IT inhibitors and information quality in SCM. Also, the mediation analysis indicated that ‘IT enablers’ represents a complementary partial mediation of the relationship between SCM–IT inhibitors and information sharing in SCM. SCM-IT inhibitors decrease the information quality in SCM but also decrease the extent of usage of IT enablers, which in turn leads to information quality in SCM. Thus, some of SCM-IT inhibitors’ effect on Information quality is explained by IT enablers. The results indicated a non-significant difference between both indirect effects, so IT enablers was not a stronger mediator than information sharing in the relationship between SCM-IT and information quality in SCM. The results indicate that IT enablers and information sharing do not jointly mediate the relationship between SCM-IT inhibitors and information quality in SCM.
The findings of this study provide useful information about business units in the study. The identification of the factors that statistically influence the level of information quality in the supply chain(s) can help the top management and IT specialists to improve the overall performance of their company and their supply chain(s). Also these finding are useful for information technology services and products providers.
This study has some limitations. Firstly, the study sample includes several industries. Industrial composition in the sample may indicate the presence of performance variability between industries. Secondly, other factors such as security, culture, etc., can influence the level of information quality. Thirdly, the data for the study consisted of responses from single respondents in a business unit. Finally, the factors of this study do not consider the future potential value in information quality.
In future research, a longitudinal research can be developed to consider the future potential value in information quality. The contextual factors like the type of industry, supply chain length, and type of supply chain that can influence the level of information quality can be studied in the future. References Ali, F., Rasoolimanesh, S. M., Sarstedt, M., Ringle, C. M., & Ryu, K. (2018). An assessment of the use of partial
least squares structural equation modeling (PLS-SEM) in hospitality research. International Journal of Contemporary Hospitality Management, 30(1), 514-538.
Auramo, J., Kauremaa, J., & Tanskanen, K. (2005). Benefits of IT in supply chain management: an explorative study of progressive companies. International Journal of Physical Distribution & Logistics Management, 35(2), 82-100.
Baihaqi, I., & Sohal, A. S. (2013). The impact of information sharing in supply chains on organisational performance: an empirical study. Production Planning & Control, 24(8-9), 743-758.
Baltacioglu, T., Ada, E., Kaplan, M.D., Yurt, O., & Kaplan, Y.C. (2007). A new framework for service supply chains. The Service Industries Journal, 27(2), 105-124.
Bayraktar, E., Demirbag, M., Koh, S. L., Tatoglu, E., & Zaim, H. (2009). A causal analysis of the impact of information systems and supply chain management practices on operational performance: evidence from manufacturing SMEs in Turkey. International Journal of Production Economics, 122(1), 133-149.
Castro, I., & Roldán, J. L. (2013). A mediation model between dimensions of social capital. International Business Review, 22(6), 1034-1050.
Cepeda, G., Nitzl, C., & Roldán, J. L. (2018). Mediation Analyses in Partial Least Squares Structural Equation Modeling: Guidelines and Empirical Examples. In H. Latan & R. Noonan (Eds.), Partial Least Squares Structural Equation Modeling: Basic Concepts, Methodological Issues and Applications. Heidelberg: Springer.
Chin, W. W., Kim, Y. J., & Lee, G. (2013). Testing the differential impact of structural paths in PLS analysis: A bootstrapping approach. In New perspectives in partial least squares and related methods (pp. 221-229). Springer, New York, NY.
Ellram, L. M., Tate, W. L., & Billington, C. (2004). Understanding and managing the services supply chain. Journal of Supply Chain Management, 40(3), 17-32.
Forslund, H., & Jonsson, P. (2007). The impact of forecast information quality on supply chain performance. International Journal of Operations & Production Management, 27(1), 90-107.
E-ISSN 2281-4612 ISSN 2281-3993
Academic Journal of Interdisciplinary Studies
Vol 7 No 3 November 2018
136
Fu, Q., & Zhu, K. (2010). Endogenous information acquisition in supply chain management. European Journal of Operational Research, 201(2), 454-462.
Gadermann, A. M., Guhn, M., & Zumbo, B. D. (2012). Estimating ordinal reliability for Likert-type and ordinal item response data: A conceptual, empirical, and practical guide. Practical Assessment, Research & Evaluation, 17(3), 1-13.
Hair J. F. Jr., Sarstedt, M., Hopkins, L., & Kuppelwieser, V.G. (2014a). Partial least squares structural equation modeling (PLS-SEM) An emerging tool in business research. European Business Review, 26(2), 106-121.
Hair, J. F. Jr., Hult, G.T.M., Ringle, C.M. & Sarstedt, M. (2017), A Primer on Partial Least Squares Structural Equation Modeling, (2nd ed.), Sage Publications, Thousand Oaks, CA.
Hair, J.F. Jr., Hult, G.T.M. , Ringle, C.M. & Sarstedt, M. (2014), A Primer on Partial Least Squares Structural Equation Modeling, (1st ed.) Sage Publications, Thousand Oaks, CA.
Henseler, J., Ringle, C. M., & Sarstedt, M. (2015). A new criterion for assessing discriminant validity in variance-based structural equation modeling. Journal of the Academy of Marketing Science, 43(1), 115–135. https://doi.org/10.1007/s11747-014-0403-8
Ketikidis, P. H., Koh, S. C. L., Dimitriadis, N., Gunasekaran, A., & Kehajova, M. (2008). The use of information systems for logistics and supply chain management in South East Europe: Current status and future direction. Omega, 36(4), 592-599.
Lau, R. S., & Cheung, G. W. (2012). Estimating and comparing specific mediation effects in complex latent variable models. Organizational Research Methods, 15(1), 3-16.
Lee, H. L. (2000). Creating value through supply chain integration. Supply chain management review, 4(4), 30-36. Lee, H. L., & Whang, S. (2000). Information sharing in a supply chain. International Journal of Manufacturing
Technology and Management, 1(1), 79-93. Li, S., & Lin, B. (2006). Accessing information sharing and information quality in supply chain
management. Decision support systems, 42(3), 1641-1656. Li, S., Ragu-Nathan, B., Ragu-Nathan, T. S., & Rao, S. S. (2006). The impact of supply chain management
practices on competitive advantage and organizational performance. Omega, 34(2), 107-124. Li, S., Rao, S. S., Ragu-Nathan, T.S., & Ragu-Nathan, B. (2005). Development and validation of a
measurement instrument for studying supply chain management practices. Journal of Operations Management, 23 (6), pp.618-641.
Miller, H. (2005). Information quality and market share in electronic commerce. Journal of Services Marketing, 19(2), 93-102.
Moharana, H.S., Murty, J.S., Senapati, S.K. &Khuntia, K. (2013). Importance of Information Technology for Effective Supply Chain Management. International Journal of Modern Engineering Research, 1(2), 747-751
Nair, P. R., Raju, V., & Anbuudayashankar, S. P. (2009). Overview of information technology tools for supply chain management. CSI Communications, 33(9), 20-27.
Nitzl, C., Roldan, J. L., & Cepeda, G. (2016). Mediation analysis in partial least squares path modeling: Helping researchers discuss more sophisticated models. Industrial Management & Data Systems, 116(9), 1849-1864.
Omar, R., Ramayah, T., Lo, M. C., Sang, T. Y., & Siron, R. (2010). Information sharing, information quality and usage of information technology (IT) tools in Malaysian organizations. African Journal of Business Management, 4(12), 2486–2499.
Qrunfleh, S. M. (2010). Alignment of information systems with supply chains: Impacts on supply chain performance and organizational performance (Doctoral dissertation, University of Toledo).
Ramayah, T., Sang, T. Y., Omar, R., & Dahlan, N. M. (2008). Impact of Information Technology (IT) Tools, Partner Relationship And Supply Chain Performance. Asian Academy of Management Journal, 13(2).
Richter, N. F., Sinkovics, R. R., Ringle, C. M., & Schlägel, C. (2016). A critical look at the use of SEM in international business research. International Marketing Review, 33(3), 376-404. doi: https://doi.org/10.1108/IMR-04-2014-0148
Rigdon, E. E., Sarstedt, M., & Ringle, C. M. (2017). On comparing results from CB-SEM and PLS-SEM: Five perspectives and five recommendations. Marketing ZFP, 39(3), 4-16.
Ringle, Christian M., Wende, Sven, & Becker, Jan-Michael. (2015). SmartPLS 3. Bönningstedt: SmartPLS. Retrieved from http://www.smartpls.com
Rodríguez-Entrena, M., Schuberth, F., & Gelhard, C. (2018). Assessing statistical differences between parameters estimates in Partial Least Squares path modeling. Quality & Quantity, 52(1), 57-69.
Sarstedt, M., Ringle, C. M., Henseler, J., & Hair, J. F. (2014). On the emancipation of PLS-SEM: A commentary on Rigdon (2012). Long Range Planning, 47(3), 154-160.
Shmueli, G., Ray, S., Estrada, J. M. V., & Chatla, S. B. (2016). The elephant in the room: Evaluating the predictive performance of PLS models. Journal of Business Research, 69(10), 4552–4564.
Streukens, S., & Leroi-Werelds, S. (2016). Bootstrapping and PLS-SEM: A step-by-step guide to get more out of your bootstrap results. European Management Journal, 34(6), 618-632.
E-ISSN 2281-4612 ISSN 2281-3993
Academic Journal of Interdisciplinary Studies
Vol 7 No 3 November 2018
137
Tatoglu, E., Bayraktar, E., Golgeci, I., Koh, S. L., Demirbag, M., & Zaim, S. (2015), “How do supply chain management and information systems practices influence operational performance? Evidence from emerging country SMEs”, International Journal of Logistics Research and Applications, A Leading Journal of Supply Chain Management, 19(3), 181-199.
Wisner, J. D., Leong, G. K., & Tan, K. C. (2005). Principles of Supply Chain Management. Thomson South-Western, Mason, Ohio, U.S.
Yang, T. M., & Pardo, T. A. (2011, January). How is information shared across boundaries?. In System Sciences (HICSS), 2011 44th Hawaii International Conference on (pp. 1-10). IEEE.
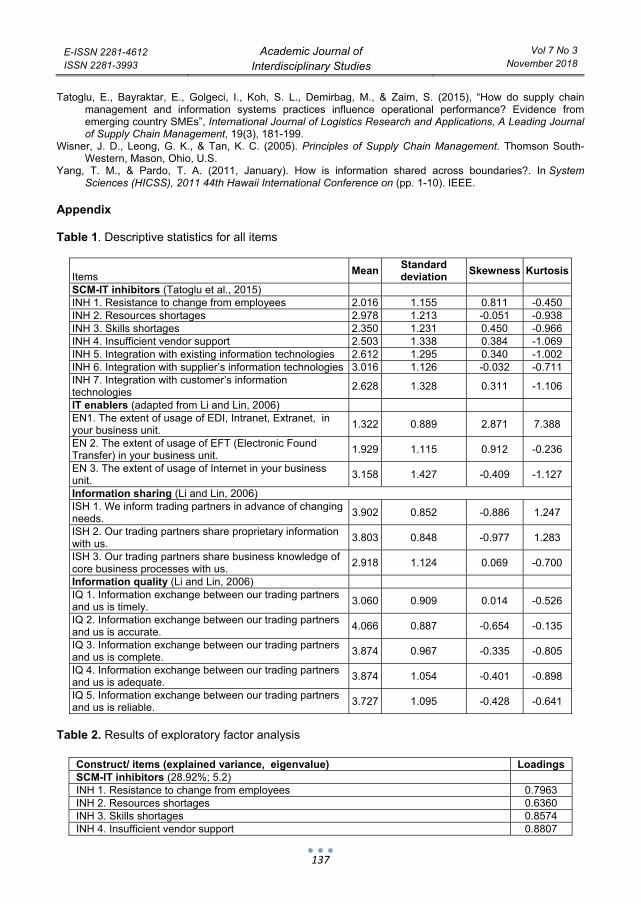
Appendix Table 1. Descriptive statistics for all items
Items Mean Standard
deviation Skewness Kurtosis
SCM-IT inhibitors (Tatoglu et al., 2015) INH 1. Resistance to change from employees 2.016 1.155 0.811 -0.450 INH 2. Resources shortages 2.978 1.213 -0.051 -0.938 INH 3. Skills shortages 2.350 1.231 0.450 -0.966 INH 4. Insufficient vendor support 2.503 1.338 0.384 -1.069 INH 5. Integration with existing information technologies 2.612 1.295 0.340 -1.002 INH 6. Integration with supplier’s information technologies 3.016 1.126 -0.032 -0.711 INH 7. Integration with customer’s information technologies 2.628 1.328 0.311 -1.106
IT enablers (adapted from Li and Lin, 2006) EN1. The extent of usage of EDI, Intranet, Extranet, in your business unit. 1.322 0.889 2.871 7.388
EN 2. The extent of usage of EFT (Electronic Found Transfer) in your business unit. 1.929 1.115 0.912 -0.236
EN 3. The extent of usage of Internet in your business unit. 3.158 1.427 -0.409 -1.127
Information sharing (Li and Lin, 2006) ISH 1. We inform trading partners in advance of changing needs. 3.902 0.852 -0.886 1.247
ISH 2. Our trading partners share proprietary information with us. 3.803 0.848 -0.977 1.283
ISH 3. Our trading partners share business knowledge of core business processes with us. 2.918 1.124 0.069 -0.700
Information quality (Li and Lin, 2006) IQ 1. Information exchange between our trading partners and us is timely. 3.060 0.909 0.014 -0.526
IQ 2. Information exchange between our trading partners and us is accurate. 4.066 0.887 -0.654 -0.135
IQ 3. Information exchange between our trading partners and us is complete. 3.874 0.967 -0.335 -0.805
IQ 4. Information exchange between our trading partners and us is adequate. 3.874 1.054 -0.401 -0.898
IQ 5. Information exchange between our trading partners and us is reliable. 3.727 1.095 -0.428 -0.641
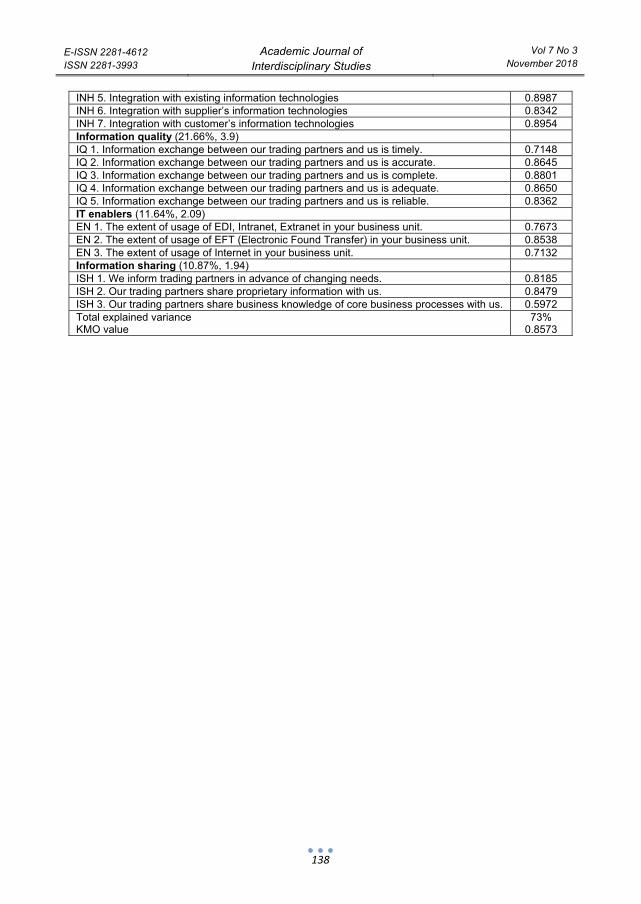
Table 2. Results of exploratory factor analysis
Construct/ items (explained variance, eigenvalue) Loadings SCM-IT inhibitors (28.92%; 5.2) INH 1. Resistance to change from employees 0.7963 INH 2. Resources shortages 0.6360 INH 3. Skills shortages 0.8574 INH 4. Insufficient vendor support 0.8807
E-ISSN 2281-4612 ISSN 2281-3993
Academic Journal of Interdisciplinary Studies
Vol 7 No 3 November 2018
138
INH 5. Integration with existing information technologies 0.8987 INH 6. Integration with supplier’s information technologies 0.8342 INH 7. Integration with customer’s information technologies 0.8954 Information quality (21.66%, 3.9) IQ 1. Information exchange between our trading partners and us is timely. 0.7148 IQ 2. Information exchange between our trading partners and us is accurate. 0.8645 IQ 3. Information exchange between our trading partners and us is complete. 0.8801 IQ 4. Information exchange between our trading partners and us is adequate. 0.8650 IQ 5. Information exchange between our trading partners and us is reliable. 0.8362 IT enablers (11.64%, 2.09) EN 1. The extent of usage of EDI, Intranet, Extranet in your business unit. 0.7673 EN 2. The extent of usage of EFT (Electronic Found Transfer) in your business unit. 0.8538 EN 3. The extent of usage of Internet in your business unit. 0.7132 Information sharing (10.87%, 1.94) ISH 1. We inform trading partners in advance of changing needs. 0.8185 ISH 2. Our trading partners share proprietary information with us. 0.8479 ISH 3. Our trading partners share business knowledge of core business processes with us. 0.5972 Total explained variance KMO value
73% 0.8573