information technology capability, organizational culture, and
TRANSCRIPT
INFORMATION TECHNOLOGY CAPABILITY, ORGANIZATIONAL
CULTURE, AND EXPORT PERFORMANCE
By
MAN ZHANG
A dissertation submitted in partial fulfillment of the requirements for the degree of
DOCTOR OF PHILOSOPHY
WASHINGTON STATE UNIVERSITY College of Business and Economics
MAY 2005
© Copyright by MAN ZHANG, 2005 All Rights Reserved
ii
To the Faculty of Washington State University:
The members of the Committee appointed to examine the dissertation of
MAN ZHANG find it satisfactory and recommend that it be accepted.
Co-Chair Co-Chair

iii
ACKNOWLEDGEMENT
This dissertation could not have been written without valuable contributions from
several individuals. First and most importantly, I would like to thank my dissertation co-
chair, Dr. Jim McCullough who not only served as my supervisor but also encouraged
and challenged me throughout my academic program. Dr. McCullough helped me
immensely by guiding me at every step of the dissertation process. He brought me into
the doctoral program and encouraged me to achieve. I was able to complete this
dissertation and my Ph.D. program thanks to his continuous support and feedback on my
progress.
I am grateful also to my second co-chair Dr. Patriya Tansuhaj who, though she
joined the committee at a late stage, has made me tremendously valuable comments and
always given me prompt advice during the dissertation process. She has taught me to
think critically and to have self-discipline. She has always been there for me, ready to
help, and she has always encouraged me to aim high and strive for excellence. I am very
thankful for her input.
I also value Dr. Craig Parks for his guidance and eagerness to assist me with my
dissertation. He always expressed confidence in my abilities for the research. His input
made the completion of the dissertation possible. I am also fortunate to have had Dr.
Suprateek Sarker join my committee. His knowledge and enthusiasm for research has
inspired me during the dissertation process. It is from him that I learned what it is to be a
real scholar and how to conduct research in an enjoyable way.
I deeply appreciate the moral support I received from Dr. Jerman Rose, who is
like a friend, mentor, and father. His smile and words of encouragement have brightened

iv
my days and helped me maintain a positive attitude throughout the program. I am truly
grateful for his kindness to me.
Special thanks also go to: Dr. Leonard Burns, professor of the Department of
Psychology, who helped me with ideas on how to analyze data; to Mary Gilles, business
librarian in the Holland Library, who helped me with data collection; to Beverly Makhani,
PR/COM manager of College of Business and Economics, who spent a tremendous
amount of time to help me edit my dissertation; and to Teresa Brewer, of the International
Business Institute, for her administrative assistance and kindness throughout my Ph.D.
program. She never forgot my birthday and her thoughtful gifts always reduced the pain
of being homesick. I am also thankful for some special friends I met during my time at
WSU, Ruby Lee, Pingsheng Tong, and I have also appreciated all of the doctoral students
at the International Business Institute--- Chiung-Hui Tseng, Kittinoot Chulikavit,
Amonrat Thoumrungroje, Supara Kapasuwan, and Hyuksoo Cho, who gave me much
needed emotional support. To all of them I extend my sincere thanks.
My deepest gratitude goes to my parents, without whom my accomplishments in
life could not have been achieved. Their unconditional love and unending support of my
personal endeavors has been a major factor in giving me the strength of mind to complete
my Ph.D. program. I will never be able to express enough gratitude to my parents. This
dissertation is dedicated to them.
My greatest thanks goes to my husband, Li Fei, who has been my friend and
supporter and sacrificed tremendously for me throughout my Ph.D. program. I thank him
for all of his love, help, and understanding, and for tolerating my limited presence in his

v
life these past four years. Our one-year-old son, Bryan, has been a tremendous source of
great joy for me. His endearing smile helped me to reach this milestone in my career.
The doctoral program has been both extremely demanding and intellectually
stimulating and would have been difficult to complete in a timely manner without this
wonderful network of individuals. Their endless support made it possible.
vi
INFORMATION TECHNOLOGY CAPABILITY, ORGANIZATIONAL
CULTURE, AND EXPORT PERFORMANCE
Abstract
By Man Zhang, Ph.D. Washington State University
May 2005 Co-chair: James McCullough Co-chair: Patriya Tansuhaj
Drawing on research in both international business and information systems, the
goal of this dissertation seeks a better understanding of the relationship between
information technology capability, organizational culture, and export performance in the
context of born global firms. To fulfill this purpose three empirical studies are presented
in this dissertation and are used to develop a theoretical model. To test the
generalizability of the proposed model, data are collected from both China and the U.S.
The first empirical study reviews the literature on IT capability and develops a
scale to measure IT capability. The results show that IT capability is a multidimensional
construct consisting of four components, namely: IT architecture, IT human resource, IT
infrastructure, and IT relationship resource. The second empirical study examines
differences in how IT capability is perceived in China and the U.S. The third empirical
study takes the resource-based view and argues that IT capability can be viewed as one of
the firm’s resources, and when leveraged well, will lead to better performance. It also
argues that international marketing orientation, international entrepreneurial orientation,
and organizational learning directly affect IT capability.
vii
The central contributions of this dissertation are: first, it identifies and thereafter
develops and validates an instrument to measure IT capability in the context of born
global firms; second, it advances the literature of culture influence on IT implementation
by investigating how Chinese business culture impacts IT capability in China; third, it
integrates literature on international business, organizational culture, and information
systems by investigating the influence of IT capability on firms’ export performance;
fourth, it contributes to the RBV by supporting the perspective that a firm’s competitive
advantage and performance are a function of complex inimitable resources that are
embedded within the organization.
viii
TABLES OF CONTENTS
ACKNOWLEDGEMENTS………………………………………………………………….. iii
ABSTRACT………………………………………………………………………………….. vi
LIST OF TABLES…………………………………………………………………………… xii
LIST OF FIGURES………………………………………………………………………….. xiv
CHAPTER
1 INTRODUCTION………………………………………………………………………. 1
Overview…………………………………………………………………………….. 1
The ‘Born Global’ concept…………………………………………………………... 1
Prevalence Of Born Global And The Role Of Information Technology…………….. 3
Culture and Information Technology……………………………………………….. 5
The Purpose, the Research Questions and the Scope of the Study………………….. 6
Organization of the Dissertation…………………………………………………….. 8
2 INFORMATION TECHNOLOGY CAPABILITY: INSTRUMENT
DEVELOPMENT AND VALIDATION IN A BORN GLOBAL CONTEXT…………
10
Introduction………………………………………………………………………….. 10
Theoretical Foundation of the Study………………………………………………… 12
An overview of IT capability……………………………………………………. 12
Research method……………………………………………………………….……. 22
Instrument design and validation………………………………………………… 23
Specification of the domain of construct……………………………………... 25
Generation of the sample of items and establishment of content validity……. 26
ix
Data collection……………………………………………………………… 29
Purification of measures and assessment of discriminant validity…………. 30
Convergent validity………………………………………………………… 32
Discussion and conclusion……………………………………………………………. 37
Academic and managerial implications……………………………………………. 37
Limitations and future research……………………………………………………. 39
Conclusion…………………………………………………………………………….. 39
3 A COMPARISON OF THE PERCEIVED IT CAPABILITY IN CHINA AND THE
U.S………………………………………………………………………………………..
41
Introduction……………………………………………………………………………. 40
Literature review……………………………………………………………………… 43
Culture influences on IT implementation………………………………….……… 43
Western information management in China……………………………….………. 46
Hypotheses…………………………………………………………………………….. 49
Research method………………………………………………………………………. 52
Research context…………………………………………………………………... 53
Sample and data collection………………………………………………………... 54
Non-response bias analysis………………………………………………………… 56
Sample characteristics…………………………………………………………….. 57
Measures…………………………………………………………………………... 60
Scale validation……………………………………………………………………. 61
Hypotheses testing…………………………………………………………………….. 62
Discussion…………………………………………………………………………….. 64
x
Contribution, limitations and future research…………………………………….…… 65
Conclusions…………………………………………………………………………… 66
4 ORGANIZATIONAL CULTURE, INFORMATION TECHNOLOGY CAPABILITY
AND PERFORMANCE OF THE BORN GLOBAL FIRM……………………………..
67
Introduction……………………………………………………………………………. 67
Introduction to the three cases………………………………………………………… 69
Resource based view of information technology…………………………………….... 74
Hypotheses……………………………………………………………………………. 77
Research context………………………………………………………………….…… 84
Research method………………………………………………………………………. 84
Sample ……………………………………………………………………………... 84
Survey design and data collection………………………………………….……… 85
Non-response bias analysis………………………………………………………… 86
Measures…………………………………………………………………………… 87
Dependent variable…………………………………………………………. 87
Independent variable………………………………………………………… 88
Control variable……………………………………………………………… 89
Measure development and validation…………………………………………….... 90
General measurement approach……………………………………………... 90
Scale assessment……………………………………………………………. 91
Results and discussion………………………………………………………………… 91
Individual structure model………………………………………………………... 91
Multigroup model…………………………………………………………………. 94
xi
Results and discussion………………………………………………………………… 96
General results of hypothesis testing……………………………………………… 97
Cross-national comparison……………………………………………………….... 97
Theoretical contributions…………………………………………………………….… 99
Managerial contributions………………………………………………………………. 101
Suggestions for future research………………………………………………………... 101
Conclusion……………………………………………………………………………... 101
5 CONCLUSION…………………………………………………………………………… 103
BIBLIOGRAPHY……………………………………………………………………………. 107
A MEASURES……………………………………………………………………………… 125
B COVER LETTER AND QUESTIONNAIRE……………………………………………. 129
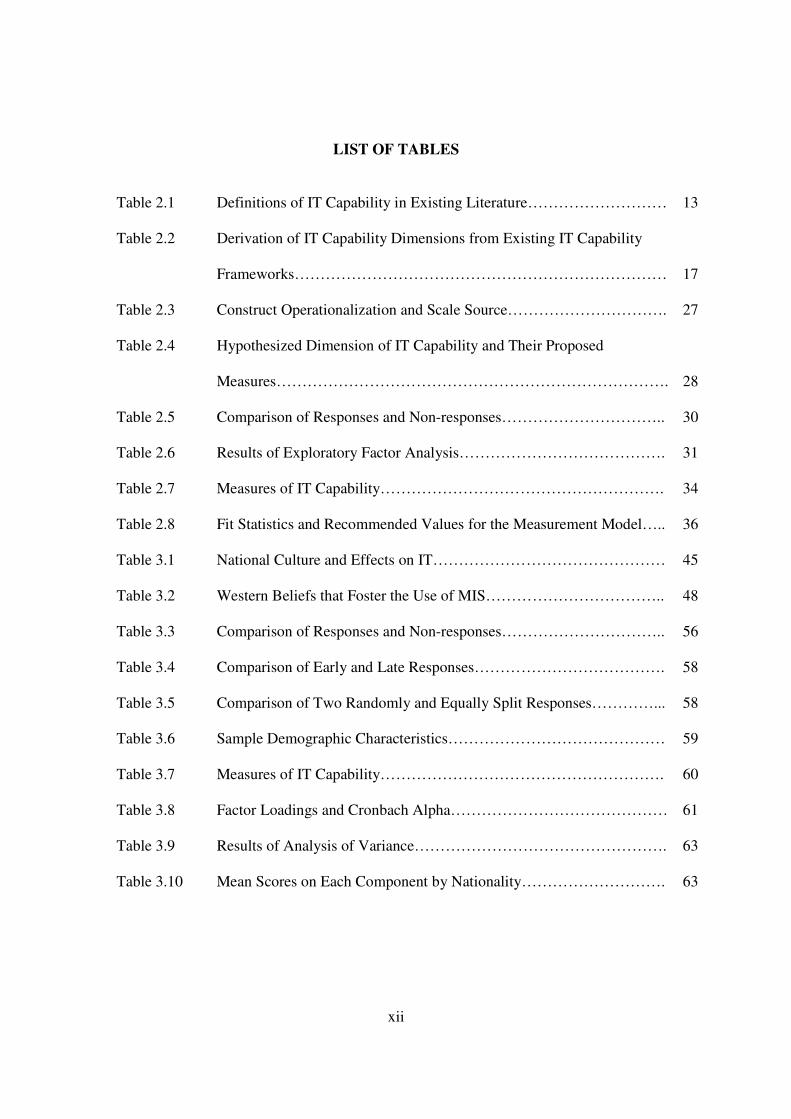
xii
LIST OF TABLES Table 2.1 Definitions of IT Capability in Existing Literature……………………… 13
Table 2.2 Derivation of IT Capability Dimensions from Existing IT Capability
Frameworks………………………………………………………………
17
Table 2.3 Construct Operationalization and Scale Source…………………………. 27
Table 2.4 Hypothesized Dimension of IT Capability and Their Proposed
Measures………………………………………………………………….
28
Table 2.5 Comparison of Responses and Non-responses………………………….. 30
Table 2.6 Results of Exploratory Factor Analysis…………………………………. 31
Table 2.7 Measures of IT Capability………………………………………………. 34
Table 2.8 Fit Statistics and Recommended Values for the Measurement Model….. 36
Table 3.1 National Culture and Effects on IT……………………………………… 45
Table 3.2 Western Beliefs that Foster the Use of MIS…………………………….. 48
Table 3.3 Comparison of Responses and Non-responses………………………….. 56
Table 3.4 Comparison of Early and Late Responses………………………………. 58
Table 3.5 Comparison of Two Randomly and Equally Split Responses…………... 58
Table 3.6 Sample Demographic Characteristics…………………………………… 59
Table 3.7 Measures of IT Capability………………………………………………. 60
Table 3.8 Factor Loadings and Cronbach Alpha…………………………………… 61
Table 3.9 Results of Analysis of Variance…………………………………………. 63
Table 3.10 Mean Scores on Each Component by Nationality………………………. 63
xiii
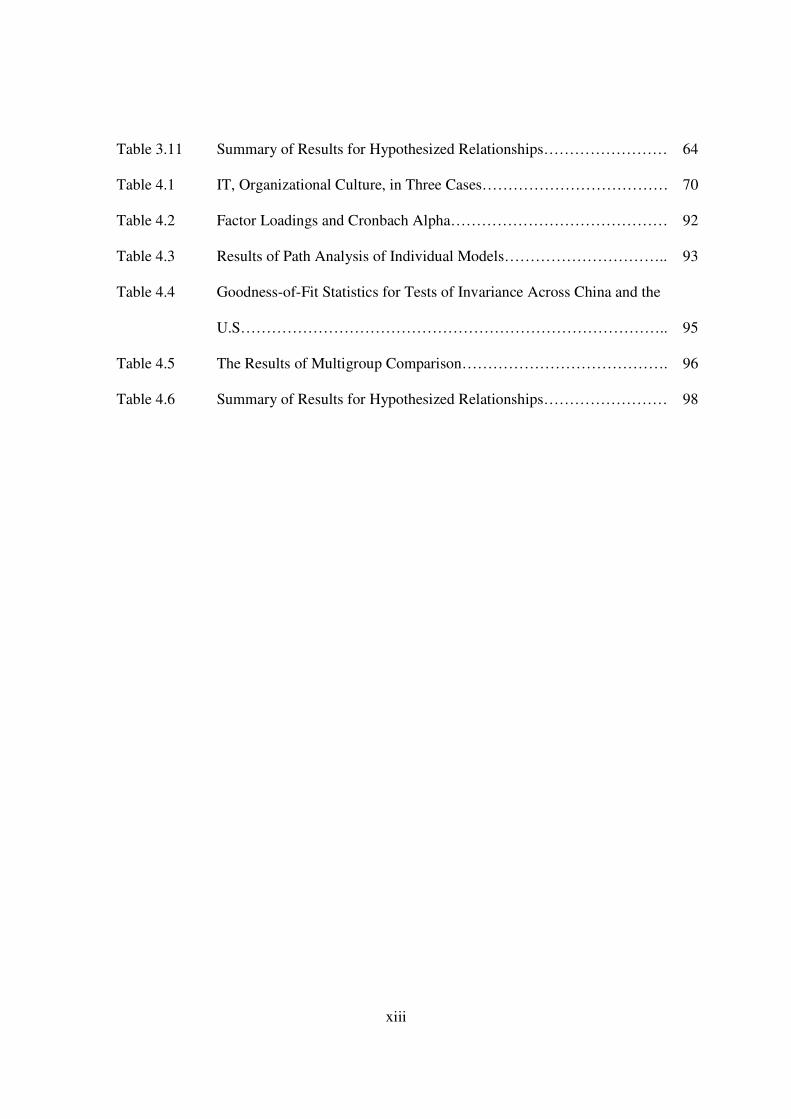
Table 3.11 Summary of Results for Hypothesized Relationships…………………… 64
Table 4.1 IT, Organizational Culture, in Three Cases……………………………… 70
Table 4.2 Factor Loadings and Cronbach Alpha…………………………………… 92
Table 4.3 Results of Path Analysis of Individual Models………………………….. 93
Table 4.4 Goodness-of-Fit Statistics for Tests of Invariance Across China and the
U.S………………………………………………………………………..
95
Table 4.5 The Results of Multigroup Comparison…………………………………. 96
Table 4.6 Summary of Results for Hypothesized Relationships…………………… 98
xiv
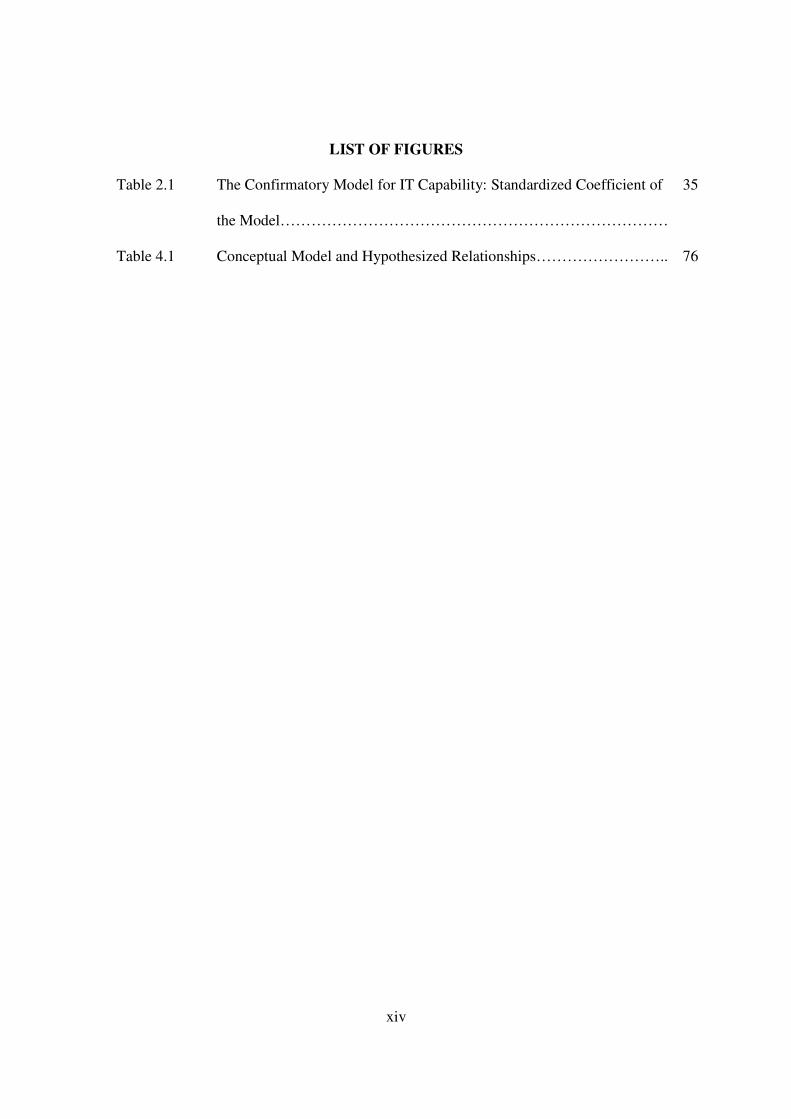
LIST OF FIGURES
Table 2.1 The Confirmatory Model for IT Capability: Standardized Coefficient of
the Model…………………………………………………………………
35
Table 4.1 Conceptual Model and Hypothesized Relationships…………………….. 76
1
CHAPTER ONE
INTRODUCTION
Overview
This dissertation investigates born global firms’ IT capability and organizational culture
in relation to export performance by means of three empirical studies. The dissertation
begins with a scale development of IT capability. The second empirical study
investigates the differences between perceived IT capability in China and the U.S. The
third one examines the relationships between organizational culture, IT capability, and
firm performance in international markets using primary data. In this introduction, the
phenomenon of born global is first described. The purpose of the study, the major
research question, and the scope of the study are then presented. Organization of the
dissertation is also provided.
The ‘Born Global’ concept
Historically, many multinational enterprises (MNEs) developed from large, mature,
domestic firms. However, recent technological innovations and the presence of increasing
numbers of people with international business experience have established new
foundations for MNEs (Oviatt and McDougall, 1994). The use of low-cost
communication technology and transportation means enables small and young firms with
limited resources to compete successfully in the international arena with older,
established firms. The Organization for Economic Co-operation and Development, in
1997, reported that perhaps 1-2% of emerging business is now international at inception
2
and that the speed with which emerging businesses internationalize is accelerating
(OECD, 1997). This phenomenon is called ‘born global’. A born global is defined in
this study as a production firm with an export percentage compared to total sale of 25%
or more, which started exporting within three years after the firm’s foundation. The
concept of ‘born global’ was coined in a survey for The Australian Manufacturing
Council by the consultants McKinsey (McKingsey and Company, 1993) and Rennie
(Rennie, 1993). The consequences of this new type of exporters are clearly stated by
Tamer Cavusgil in the first scholarly article about born global firms in 1994:
“There is emerging in Australia a new breed of exporting companies, which
contribute substantially to the nation’s export capital. The emergence of these
exporters though not unique to the Australian economy, reflects two fundamental
phenomena of the 1990s: 1) Small is beautiful 2) Gradual internationalization is
dead.”
(Cavusgil, 1994, p.18)
Based on existing literature, the born global firms are said to possess the
following characteristics (Jolly, Alahuhta, and Jeannet, 1992; Knight and Cavusgil, 1996):
• A global vision on the part of the founders early in the company’s growth;
• A high-quality innovative product that based on a fundamental redefinition in an
industry;
• A standardized product with early success in lead markets;
• Broad and rapid market access to build volume quickly;
• An early emphasis on follow-on products and breadth of competence; and,
3
• The creation of a tightly networked global organization.
In order to explain the differences and similarities between born global firms and
other types of exporters, Madsen, Rasmussen and Servais (2000) conducted an empirical
study and found that born global firms have a distinctive profile: they have a high share
of foreign sales and resemble the most internationally oriented exporters with respect to
internal capabilities and competitive platforms as well as their geographic scope. In the
same vein, McDougall, Oviatt, and Shrader (2003) found that this type of firm is
significantly different on the basis of entrepreneurial team experience, strategy, and
industry structure. They are more entrepreneurially oriented, they use more aggressive
strategies, and they operate in more channels of distribution. They compete on the basis
of differentiation and place greater emphasis on satisfying customer needs. All of these
are the foundation of their organizational culture, which is one of the most important
driving forces in their internationalization process.
Prevalence of born global and the role of information technology (IT)
Several scholars and reports have identified changes and driving forces leading to the
emergence of born global firms (e.g., Knight and Cavusgil, 1996; Madsen and Servais,
1997; Oviatt and McDougall, 1999). One common finding is the usage of information
technology (IT) (Johnson, 2004).
IT has been an integral part of the operational and competitive environment of
large organizations for many years. The continuing evolution in hardware and software
technologies has led to a spiraling decline in IT costs for all organizations, such that even
4
the smallest of business organizations can afford to purchase needed IT. And the arrival
of affordable broadband has permanently changed the small and medium sized
enterprises (SME) IT landscape. Beckett (2003) reported that some 43% of SMEs were
already hooked up to Asymmetric Digital Subscriber Line (ADSL) and 62% welcomed
the faster Internet speeds broadband can deliver. Yet, the research findings, i.e.,
problems, solutions, and benefits of using IT that relate to the larger organizations may
not necessarily apply to smaller firms such as born global firms (Riemenschneider and
Mykytyn 2000) which are characterized by small size and reliance on cutting edge
technology in the development of relatively unique products or process innovations.
Unlike traditional companies, management at born global firms does not see
foreign markets as simple adjuncts to the domestic market: they begin exporting one or
more products within a few years of their establishment and tend to export at least 25% of
total production (McKinsey & Co., 1993). What responsible for this global pattern of
SME growth lies in the dynamic interrelationships between changing consumer
preferences, changing manufacturing and information technologies, and changing
competitive conditions (Rennie, 1993).
Traditionally, it has been thought that firms need to build a strong domestic base
before venturing into overseas markets. One reason is the high fixed costs of entering a
new market at a distance, including the costs of gaining market information and of
managing agents or representatives to provide quick, effective sales and service response.
Dramatic changes have occurred in both these activities. Marketing theory argues that
people seek information from a variety of sources when faced with risk or uncertainty.
Specially, the greater the perceived risk of making a wrong decision, the greater the
5
propensity to engage in information search (Yeoh, 2000). In order to deal with these
risks, small born global firms heavily depend on information technology because it has
substantially lowered storage and retrieval costs (Rennie, 1993; Johnson 2004; Autio,
Sapienza, and Almeida, 2000). Earlier studies predicted that it would be SME
businesses that were more likely to adopt and benefit from IT because of their greater
flexibility. Yet there is still limited research about smaller firms benefiting from it
(Riquelme, 2002).
Culture and information technology (IT)
Business globalization has demanded rapid and efficient flows of information. The
worldwide spread of information technology is well documented, with diffusion from
developed to developing countries and the newly industrialized economies in Asia (Mody
and Dahlman, 1992). There is little doubt that the diffusion and acceptance of IT has
been as rapid in East Asia as anywhere in the world. Nonetheless, the United States
remains the world leader in IT. Despite this rapid diffusion and indigenous development
of IT, East Asia has not followed the U.S. in terms of sophisticated and integrated
information system development. This is because of the impact of culture (Westwood,
1995).
Culture is an important variable in two important senses. First, because the way
information is thought of, deployed, made use of, and valued varies across cultures.
Second, information systems (IS) are embedded in other social systems. People interact
6
with IS through a human interface. The form of this interaction and the meaning it holds
for people may be shaped by the culture in which it occurs. Recently,
cultural differences are often cited as a reason that IS development in a global
environment may differ from the strategies that have been found to be successful in the
U.S. (Shore, 1998; Shore & Venkatachalam, 1994). Cultural differences have
particularly proven to be a major obstacle in global IS development when Asian cultures
are involved (Burnson, 1989).
The purpose, the research questions, and the scope of the study
This dissertation seeks a better understanding of IT implementation in born global firms,
and focuses on the information technology capability (IT capability), which is defined as
the firm’s level ability to deploy IT-related resources. Extant literature shows that IT per
se would not lead to better business performance (Brynjolfsson and Hitt, 1998). The
resource-based view argues that it is the ability of using IT strategically (IT capability)
that leads to superior performance (Bharadwaj, 2000; Ross, Beath, and Goodhue, 1996).
Yet, in the existing literature, there is neither widely accepted definition nor scale of IT
capability. So, in this research, we will define IT capability and develop a scale to
measure it.
IT capability is argued to be very important to contemporary organizations
(Bharadwaj, Sambamruthy, and Zmud 1999). Yet, most of the evidence is found in the
U.S. or similar cultures (i.e., Santhanam and Hartono, 2003; Tippins and Sohi, 2003).
How people view IT capability in other cultural context especially those very different
ones such as China. There is no empirical research on it. Existing literature also shows
7
that IT capability has positive relationship with firm performance (Bharadwaj, 2000;
Santhanam and Hartono, 2003). Yet, the results are constraint with larger firms.
Whether IT capability influence born global firms’ export performance, there is no
empirical study to refer to.
Besides these, existing literature also shows that organizational culture is one of
the major factors that influence IT implementation. And born global firms have some
common organizational cultures that enable them to compete with larger firms in the
international market. But there is no existing literature regarding what the relationship
between organizational culture and IT capability is and how these two together influences
born global firms’ performance in the international markets.
Based on the above discussion, this research is designed to answer the following
research questions:
1). What are the components of IT capability?
2). Are there any differences in perceived IT capability between born global firms in
China and the U.S.?
3). Does IT capability affect firms’ export performance?
4). Does organizational culture affect IT capability?
These research questions are addressed through three empirical studies. The first
study addresses the first question by developing a multidimensional scale of IT capability.
The second study addresses the question of country differences by comparing the
perceived IT capability in two culturally different countries, namely China and the U.S.
The third study examines the effects of organizational culture on IT capability and of IT
capability on firm performance.

8
The research scope is China and the U.S. As you know, China is undergoing a
technological revolution in the late 1990s. The country will play a major role in the
computer-dominated world of the 21st century. Key to the role will be the availability of
information. For today’s IT professional in China, there is no more pressing need than
for accurate, up to date technical information (Martinsons and Martinsons, 2002). And
the U.S. is the giant in IT world and it has been leading the IT development for decades,
its experience would be very useful to Chinese business managers. A comparison
between the U.S. and China that might be of interest is the vast cultural differences
between the two countries (Hofstede, 1980).
Organization of the dissertation
This dissertation consists of three manuscripts, and it is organized as follows:
Chapter One presents the general phenomenon of interest, demonstrates the
worthiness of the study, and summarizes the topic of the study.
In Chapter Two, the first study is based around an empirical study designed to
develop a scale to measure IT capability. It undertakes a careful assessment of the
literature on the subject and identifies six models from which the final dimensions were
derived.
The second study, in Chapter Three, empirically compares the perceived IT
capability in China and the U.S. Born global firms in the manufacturing industry are
studied. Theoretical foundations and research hypotheses are first introduced and
developed. The research method is explained and results are presented and major
findings are discussed.
9
The third study, in Chapter Four, examines the proposed relationships among
organizational culture, IT capability, and performance of firms in international market in
two countries, China and the U.S. The cross-cultural research method is described, and
the results of the study and major research findings are presented and discussed.
The dissertation concludes in Chapter Five with a discussion of major findings,
theoretical contributions, managerial implications, and limitations of the studies included.
Potential avenues for future research are also presented.
10
CHAPTER TWO
INFORMATION TECHNOLOGY CAPABILITY: INSTRUMENT DEVELOPMENT AND VALIDATION IN A BORN GLOBAL CONTEXT
Introduction
Contemporary thinking on organizational capabilities has been profoundly influenced by
the resource-based view and of the firm (Barney, 1991; Eisenhardt and Schoovenhover,
1996). The proponents of this view argue that firms possess bundles of costly-to-imitate
resources that are regarded as the fundamental drivers of superior performance
(Bharadwaj, Sambamurthy, and Zmud, 1999). While firm resources are copied relatively
easily by competition, capabilities are more difficult to replicate because they are tightly
connected to the history, culture, and experience of the firm. Recent writings in the IS
literature have also turned their attention toward the role of IT capability in enabling
superior IT-based innovation and business performance. With increased emphasis on the
strategic role of IT in contemporary organizations, it is imperative to gain a deeper
understanding of the factors that govern a firm’s IT capability. Yet, there exists little
understanding as to what constitutes a firm’s IT capability and how it could be measured
(Bharadwaj 1999, 2000; Santhanam and Hartono, 2003). Given the widespread
recognition in the IT literature about the importance of IT capability (Feeny and
Willcocks, 1998 a, b), and the emergence of born global firms in numerous nations (e.g.,
Moen and Servais, 2002; Rennie, 1993), this study focuses on the development of an
instrument to measure IT capability in the born global context. For the purpose of this
study, we define born global firms as business organizations that from, or near, their early
11
founding seeks superior international business performance from the application of
resources to the sale of outputs in multiple countries.
The issue of IT capability is particularly important in the context of born global
firms. These firms expand abroad while they are still young, and they face both the
liabilities of newness and foreignness. The value-adding processes of these firms are
based on the creation and exploitation of knowledge and knowledge-intensive services
and their attention will be focused on information acquisition, accumulation, and
integration (Grant, 1996; Nahapiet and Ghoshal, 1998; Nonaka and Takeuchi, 1995).
Unlike many existing SMEs, that still do not use IT resources strategically, born
global firms have the ability to use IT resources to reduce costs, improve customer
service, create links with suppliers, and differentiate product/services and enable
innovations (Kyobe, 2004).
Extant literature also shows that most of the studies conducted on strategic
utilization of IT resources have concentrated on large-sized organizations. Little is
known about firms’ ability to use IT related resources in SMEs (Kyobe, 2004). Since
capability is often a critical driver of firm performance (Eisenhardt and Martin, 2000;
Makadok 2001; Teece, Pisano, and Shuen, 1997), it is essential for us to gain a better
understanding of this kind of ability, namely IT capability, of born global firms. Thus, the
objective of this study is to identify the dimensions of IT capability and to develop and
validate an instrument for measuring the construct.
12
Theoretical foundation of the study
An overview of IT capability
In information system (IS) literature, different researchers have conceptualized IT
capability from different perspectives. The concept of IT capability has been discussed
more frequently in practitioner-based literature than in academic journals. Researchers
examine IT capability from multiple perspectives including work design, process
transformation, power relationships, and coordination. A review of extant literature
reveals a gap in the classification of IT capability (Mulligan, 2002). There exists very
little consensus as to what constitutes a firm’s IT capability and how it is measured, and
there are still no widely accepted definitions of IT capability.
Early explanation of IT capability explored the differences between capabilities
and their utilization, identifying critical capabilities as: a lever to lower costs (Ross,
Beath, and Goodhue, 1996); a means of building customer and supplier dependency
(Bharadwaj 2000); and, an approach to discouraging new rivals and a spur to define new
products (Parsons, 1983). The second stream of research used individuals or groups as
the units of analysis, examining such issues as the impact of IT on an individual’s
potential power and influence within an organization through a survey of users of IS (Lee
and Robertson, 1989). These power-based attributes include such characteristics as
resource provision, irreparability, network centrality, expertise, and authority. Another
stream of research focusing on group research used survey data to demonstrate the impact
of IT on work group structuring (Lee and Treacy, 1989), including attributes such as
standardization, specialization, locus of decision making, and centralization of decision
control. The fourth stream of research explores the role of IT in business process
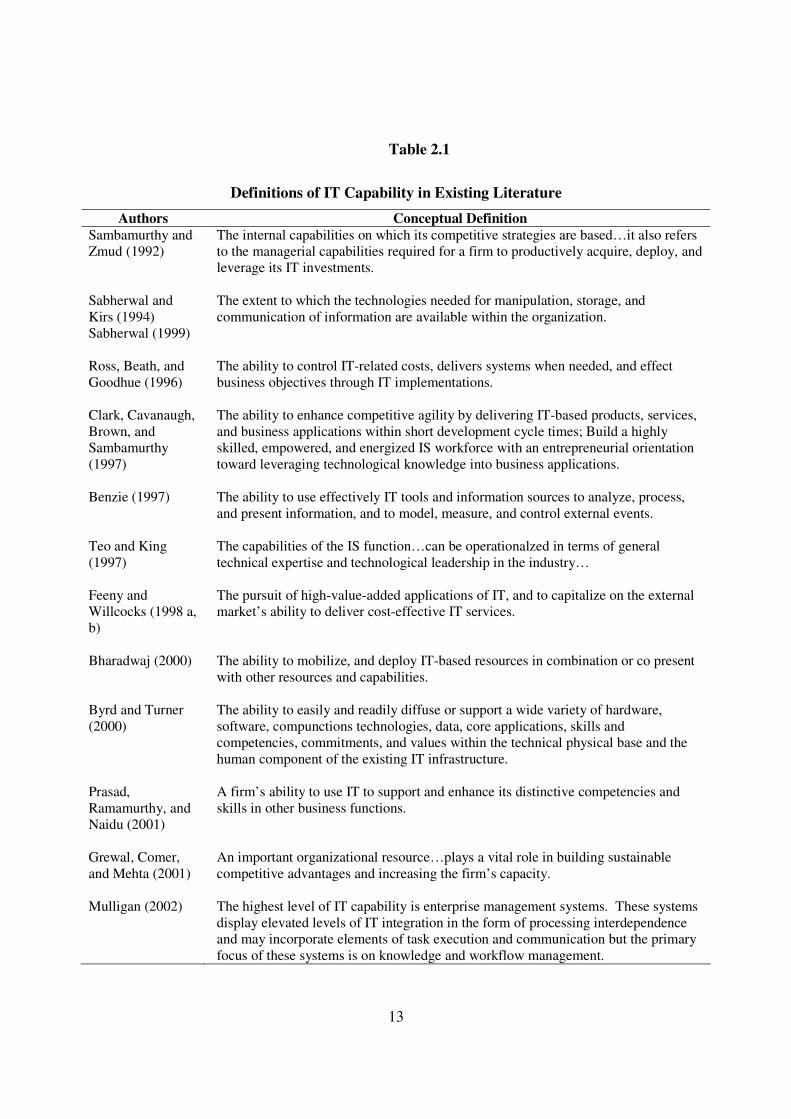
13
Table 2.1
Definitions of IT Capability in Existing Literature
Authors Conceptual Definition Sambamurthy and Zmud (1992)
The internal capabilities on which its competitive strategies are based…it also refers to the managerial capabilities required for a firm to productively acquire, deploy, and leverage its IT investments.
Sabherwal and Kirs (1994) Sabherwal (1999)
The extent to which the technologies needed for manipulation, storage, and communication of information are available within the organization.
Ross, Beath, and Goodhue (1996)
The ability to control IT-related costs, delivers systems when needed, and effect business objectives through IT implementations.
Clark, Cavanaugh, Brown, and Sambamurthy (1997)
The ability to enhance competitive agility by delivering IT-based products, services, and business applications within short development cycle times; Build a highly skilled, empowered, and energized IS workforce with an entrepreneurial orientation toward leveraging technological knowledge into business applications.
Benzie (1997) The ability to use effectively IT tools and information sources to analyze, process,
and present information, and to model, measure, and control external events. Teo and King (1997)
The capabilities of the IS function…can be operationalzed in terms of general technical expertise and technological leadership in the industry…
Feeny and Willcocks (1998 a, b)
The pursuit of high-value-added applications of IT, and to capitalize on the external market’s ability to deliver cost-effective IT services.
Bharadwaj (2000) The ability to mobilize, and deploy IT-based resources in combination or co present
with other resources and capabilities. Byrd and Turner (2000)
The ability to easily and readily diffuse or support a wide variety of hardware, software, compunctions technologies, data, core applications, skills and competencies, commitments, and values within the technical physical base and the human component of the existing IT infrastructure.
Prasad, Ramamurthy, and Naidu (2001)
A firm’s ability to use IT to support and enhance its distinctive competencies and skills in other business functions.
Grewal, Comer, and Mehta (2001)
An important organizational resource…plays a vital role in building sustainable competitive advantages and increasing the firm’s capacity.
Mulligan (2002) The highest level of IT capability is enterprise management systems. These systems
display elevated levels of IT integration in the form of processing interdependence and may incorporate elements of task execution and communication but the primary focus of these systems is on knowledge and workflow management.
14
redesign, which identifies nine basic IT capabilities, suggesting that these capabilities
drive a recursive relationship between IT and the redesign process (Davenport and Short,
1990). Table 2.1 presents definitions of IT capability in the existing literature.
According to table 2.1, IT capability has been defined in terms of its managerial
capabilities (Sambamurthy and Zmud, 1992; Ross, Beath, and Goodhue, 1996) and
technological skills (Teo and King, 1997; Sabharwal and Kirs, 1994; Sabherwal, 1999;
Byrd and Turner, 2000). In this study, we synthesize these views and arrive at the
following definition:
IT capability is a firm’s ability to acquire, deploy, and leverage its IT investment
in combination with other resources and capabilities as well as to support and enhance
its distinctive competencies and skills in other business functions in order to achieve
business objectives through IT implementations.
In this study, IT capability is viewed as a multidimensional construct. In
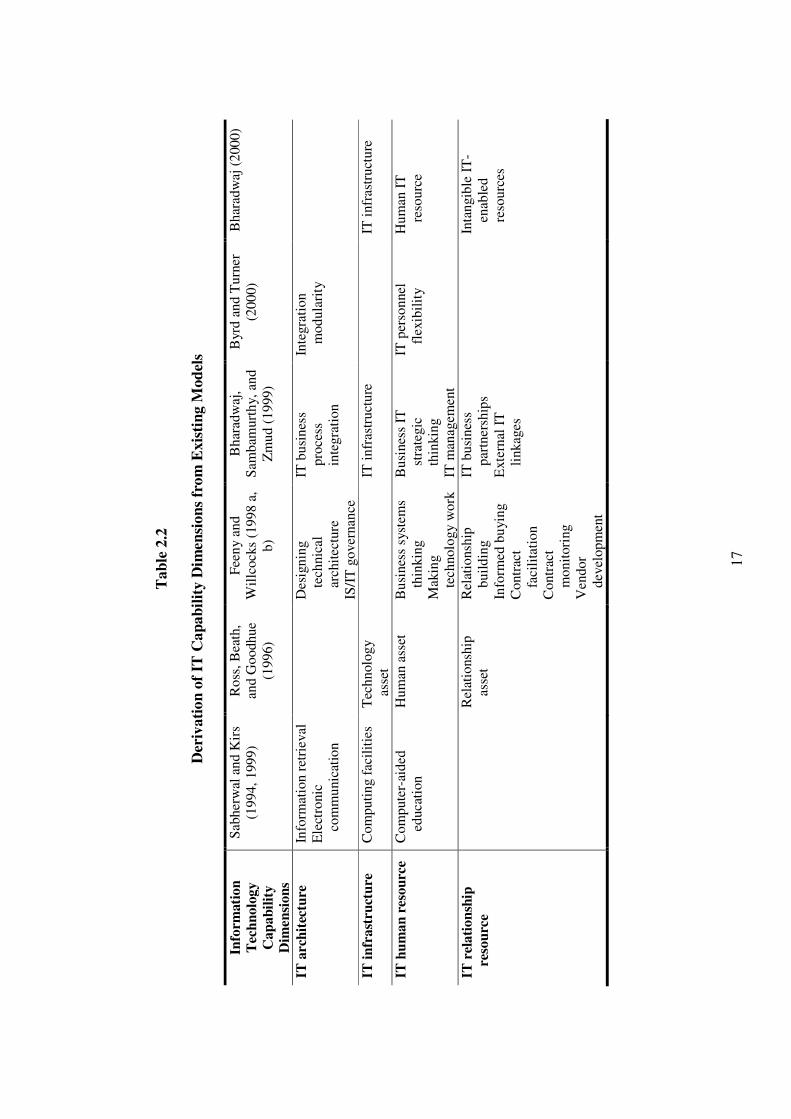
reviewing IT literature, six models were identified that have dimensions underlying the
IT capability construct. The models are shown in Table 2.2. They were proposed by
Sabherwal and Kirs (1994, 1999); Ross, Beath, and Goodhue (1996); Feeny and
Willcocks (1998 a, b); Bharadwaj et al. (1999); Byrd and Turner (2000); and Bharadwaj
(2000). The resulting dimensions taken from combining these models are (1) IT
architecture, (2) IT infrastructure, (3) Human IT resource, and (4) IT relationship
resource.
Information retrieval and electronic communication from Sabherwal and Kirs
(1994, 1999), Designing technical architecture and IS/IT governance from Feeny and
Willcocks (1998 a, b), IT business process integration from Bharadwaj et al. (1999), and
15
Integration modularity from Byrd and Turner (2000) are combined as IT architecture in
this study. Computing facilities from Sabherwal and Kirs (1994, 1999), technology asset
from Ross, Beath, and Goodhue, (1996), IT infrastructure from Bharadwaj et al. (1999),
and Bharadwaj (2000) are synthesized into our IT infrastructure. Computer-aided
education from Sabherwal and Kirs (1994, 1999), human asset from Ross, Beath, and
Goodhue, (1996), Business systems thinking and making technology work from Feeny
and Willcocks (1998a, b), Business IT strategic thinking and IT management from
Bharadwaj et al. (1999), IT personnel flexibility from Byrd and Turner (2000) and
Human IT resource from Bharadwaj (2000) are combined into our IT human resource.
Our last dimension of IT relationship resource comes from Ross, Beath, and Goodhue, ’s
(1996) relationship asset, Feeny and Willcocks’ (1998a,b) relationship building, informed
buying, contract facilitation, contract monitoring, vendor development and Bharadwaj et
al.’s (1999) IT business partnerships and external IT linkages, and Bharadwaj’s (2000)
intangible IT-enabled resources. In the next section, we will discuss each dimension in
more detail.
IT Architecture
IT architecture has been viewed as a designer with concerns for effectiveness (Fertuck,
1992). However, the search for a useful description of an information technology
architecture revealed not one, but several. There were as many different definitions as
there were studies of the topic (Gibson, 1994). Sullivan (1982) suggested that information
technology architecture emerged slowly over time as organizations committed to some
level of integration with an appropriate mix of form and context. As such, firms choose to
16
concentrate on one of the information systems components: processing, data storage,
communications, or applications. Subsequent researchers chose to structure their
approaches by targeting only one of these four components.
Mano (1982), Ein-Dor and Segev (1982), and Aken (1989) defined the
architecture in terms of computing. Spencer (1985), Inmon (1989), and Meador (1990)
focused on the data architecture. Barrett and Konsynski (1982) and Ahuja (1988) chose
communications to define the architecture. Venkatraman (1991) and Keen (1991) defined
the architecture in terms of applications. Gibson (1994) defines it as a high-level map of
the information and telecommunications technological capabilities of the firm and argued
that it is composed of four physical elements (computing compatibility, data transparency,
communications connectivity, and applications functionality), and inclusive of three
logical elements (planning, organizing, and control).
In summary, architecture defines the standardization and integration requirements
of a firm’s operating model (Ross and Westerman, 2004). It is the clarity and
organizational consensus around technology, data and process standard. As companies
mature in their architectures, they come to conceptualize their technologies and business
processes in terms of well-defined components. A firm’s enterprise architecture, by
capturing the standardization and integration requirements of the business, provides a
roadmap for introducing technology, data, and process standardization to maximize
business benefits.
1
7
Ta
ble
2.2
Der
iva
tio
n o
f IT
Ca
pa
bil
ity
Dim
ensi
on
s fr
om
Ex
isti
ng
Mod
els
Info
rmati
on
T
ech
no
log
y
Ca
pa
bil
ity
Dim
ensi
on
s
Sab
her
wal
an
d K
irs
(19
94,
199
9)
Ro
ss,
Bea
th,
and G
oo
dh
ue
(19
96)
Fee
ny
and
Wil
lcock
s (1
998 a
, b
)
Bh
arad
waj
, S
amb
amurt
hy,
an
d
Zm
ud
(1
999)
Byr
d a
nd T
urn
er
(20
00)
Bh
arad
waj
(2
00
0)
IT a
rch
itec
ture
In
form
atio
n r
etri
eval
E
lect
ronic
co
mm
unic
atio
n
D
esig
nin
g
tech
nic
al
arch
itec
ture
IS
/IT
go
ver
nan
ce
IT b
usi
nes
s p
roce
ss
inte
gra
tio
n
Inte
gra
tio
n
mo
du
lari
ty
IT i
nfr
ast
ruct
ure
C
om
puti
ng f
acil
itie
s T
ech
nolo
gy
asse
t
IT i
nfr
astr
uct
ure
IT i
nfr
astr
uct
ure
IT h
um
an
res
ou
rce
Co
mp
ute
r-ai
ded
ed
uca
tion
Hu
man
ass
et
Bu
sines
s sy
stem
s th
inkin
g
Mak
ing
tech
nolo
gy
wo
rk
Bu
sines
s IT
st
rate
gic
th
inkin
g
IT m
anag
emen
t
IT p
erso
nnel
fl
exib
ilit
y H
um
an I
T
reso
urc
e
IT r
ela
tio
nsh
ip
reso
urc
e
Rel
atio
nsh
ip
asse
t R
elat
ionsh
ip
bu
ild
ing
Info
rmed
bu
yin
g
Co
ntr
act
faci
lita
tio
n
Co
ntr
act
mo
nit
ori
ng
Ven
dor
dev
elop
men
t
IT b
usi
nes
s p
artn
ersh
ips
Exte
rnal
IT
li
nkag
es
In
tan
gib
le I
T-
enab
led
reso
urc
es
18
Well-designed enterprise architectures deliver significant benefits to a firm.
Initially, the most apparent benefit is lower IT cost due to technology standardization,
which reduces variation in skill requirements, simplifies troubleshooting, enhances
interoperability, and reduces time to market. More mature architectures provide greater
data and process standardization and start to segment standardized technology, data, and
processes into reusable components.
In this paper, we synthesized these views into the following definition. IT
architecture is a high-level map of information and technology requirements of the entire
firm, composed of network, data, and application and technology sub-architecture. It
provides a vision for how a firm will select and deploy its corporate IT resources.
IT Infrastructure
The value of IT infrastructure in today’s organizations is growing in importance (Byrd
and Turner, 2000). Many companies have placed the development of an effective IT
infrastructure among the top concerns of their overall IT management. The trade journal
InformationWeek reported that creating a strong and flexible IT infrastructure emerged as
the number one priority in IT management (InformationWeek, 1999). Accordingly, IT
infrastructure specialists Broadbent and Weill (1997) found that expenditures on IT
infrastructures accounted for an average of 58% of organizational IT budgets and have
increased at about 11% a year in recent years. An IT infrastructure provides the shared
foundation of IT capability for building business applications and is usually managed by
the information systems group. It comprises the computer and communication
technologies and the shareable technical platforms and databases (Ross, Beath, and
19
Goodhue, 1996; Weill, Broadbent, and Butler, 1996). IT infrastructure is a shared
information delivery base, the business functionality and a major business resource, and a
key source for attaining long-term competitive advantage (Keen, 1991; McKenney, 1995).
It is considerably more than just computers and the cables connecting them, i.e. IT
hardware. IT infrastructure differs from applications in its purpose as a base for future
applications rather than current business functionality, and in the way in which it must
cope with the uncertainty of future needs (Grossman and Packer, 1989).
Based on the literature review, we define IT infrastructure as the extent to which
data and applications can be shared through communication networks and accessed for
organizational use. The main purpose of IT infrastructure is to provide consistent and
quick information support throughout the organization to respond to dynamic challenges
in the markets (Bhatt 2000). To deal with these challenges, more and more businesses
will merge enterprise applications with their IT infrastructure to create a single IT
platform to lower costs and simplify management over the next two years (Mohamed,
2005).
IT Human Resources
The value of information technology (IT) to modern organizations is almost undeniable.
An IT staff that consistently solves business problems and address opportunities through
information technology is a valuable human asset.
The requisite skills of IT personnel have become important, as the value of IT has
risen in modern organizations. Along with technical skills, managerial, business, and
interpersonal skills have been increasingly cited as mandatory for these technical
20
employees (Couger et al., 1995; Lee, Trauth, and Farwell, 1995). Rresearch has
suggested that those softer skills are crucial to programmers, systems analysts, database
administrators, and other IT personnel in modern organizations (Cheney, Hale, and
Kasper, 1989; Rockart, Earl, and Ross 1996; Ross, Beath, and Goodhue, 1996). Recent
research and practitioner literature has stressed the value of a broad range of skills for IT
professionals in meeting the operational requirements of modern organizations. To add
value, IT professionals are called on to blend technical skills with a deep understanding
of the business along with cultivating interpersonal skills. Bharadwaj (2000) argues that
two kinds of skills, namely the technical skills and managerial skills, are the two critical
dimensions of Human IT resources. Technical skills include programming, systems
analysis and design, and competencies in emerging technologies; managerial skills
include abilities such as the effective management of IS functions, coordination and
interaction with user community, and project management and leadership skills (Capon
and Glazer, 1987; Copeland and McKenney, 1988). She argues that firms with strong
human IT resources are able to integrate the IT and business planning processes more
effectively; to conceive of and develop reliable and cost effective applications that
support the business needs of the firm faster than competition; to communicate and work
with business units more efficiently; and to anticipate future business needs of the firm
and innovate valuable new product features before competitors. In this study, we define
IT human resource as technical skills, business understanding and planning, and problem-
solving orientation.
21
IT Relationship Resource
By IT relationship resource, we mean the valuable relationship between the IT and
business units. In order to have effective application of IT in the firm, IT management
and business units need to share the risk and responsibility. Shared risk and
responsibility require trust and mutual respect, and an ability to communicate, coordinate
or negotiate quickly and effectively. Evidence of a strong relationship asset includes: 1)
business partner ownership of all IT projects, 2) top management leadership in
establishing IT priorities, 3) developing users’ understanding of IT’s potential, and 4) IT
sourcing capability (Ross, Beath, and Goodhue, 1996; Bharadwaj, 2000; Feeny and
Willcocks, 1998b).
Valuable IT relationship resource refers to the establishment of IT priorities. To
do so, a number of firms have established committees of senior managers to act as IT
steering committees to ensure that limited resources are invested wisely (Ross, Beath, and
Goodhue, 1996). The committees also articulate organizational strategies and specify
how IT should support them. The more IT staff people and clients worked together, the
more they communicated, coordinated, negotiated, and shared together up and down the
hierarchy, the stronger the partnership became and the more effective both were at
planning and developing new applications, and using their current information
technology (Powell and Dent-Micallef, 1997).
Relationship building is another valuable relationship resource. It involves
developing users’ understanding of IT’s potential, and boosting users’ feeling of
ownership and satisfaction. It is very important in the fostering of mutual confidence,
22
harmony of purpose, and successful communication among those focused on the business
and technical agendas (Feeny and Willcocks, 1998 b).
Sourcing capability is also evidence of good relationship resources. Firms can
either use external vendors or internal IT departments to obtain IT services and decision
makers within an organization are always faced with make-or-buy decisions for the
various types of information systems that their organizations use. In an organization that
decides to outsource most of its IT services, the informed buyer is the most important
person after the CIO (Feeny and Willcocks, 1998 a). There are three main reasons why a
firm wants to access outsourcing. They are improving IT, enhancing business
performance, and generating new revenue (DiRomualdo and Gurbaxani, 1998).
Based on the discussion above, we define IT Relationship Resource as not only
high levels of respect between the firm and its key business partners including customers,
suppliers, and other external collaborators but also excellence in communication,
coordination, and negotiation on both sides of the relationship as well as significant
shared knowledge about the capabilities of information technology and the needs of the
business.
Research method
Instrument design and validation
The purpose of this study is to develop a scale to measure IT capability. According to
the existing literature, there are three ways of obtaining the measures of a construct
(Torgerson, 1967): (1) fundamental measurement, where numbers are assigned according
to natural laws to represent the construct (e.g., the measurement of volume or length); (2)
23
derived measurement, in which a construct is measured by relating it through laws to
other constructs (e.g., density is measured by a ratio of mass to volume); and (3)
measurement by fiat, where a construct is measured by arbitrary definition. Measurement
by fiat is undertaken when there exists a common-sense concept that on a priori grounds
seems to be important but for which there are no direct measures. Most constructs in
social and behavioral sciences and in information system involve measurement by fiat
(Sethi and King, 1991). In measurement by fiat, one or more observable construct
properties are selected and their simple/weighted sum is taken as a measure of the
construct. The difficulty with this process is that construct measures may be defined in a
multitude of ways. To develop a measure that has desirable reliability and validity
properties, Churchill (1979) recommended an eight-step procedure.
In this part of the study, we followed the guidelines of Churchill (1979) and
Bagozzi et al. (1979), and took the following steps to ensure the validity and reliability of
the instruments:
1). Specification of the domain of construct (i.e., conceptualization of the
constructs and specification of their domain). The first step in operationalizing a
construct is to delineate its domain constitutively and operationally (Kerlinger, 1964). A
constitutive definition is one that defines a construct with other constructs (e.g., “weight”
may be defined as the “heaviness” of objects). An operational definition assigns meaning
to a construct by specifying the activities or operations that are necessary to measure it.
2). Generation of the sample of items and establishment of content validity. In this
step, we need to review the past literature and derive the dimensions of the construct as
well as a set of items for each dimension. In general, a construct should be measured
24
with multiple items. The use of single items has many limitations: an individual item has
only a low degree of relationship with a particular construct (Blalock, 1974; Churchill,
1979); it has considerable specificity or a type of individuality which is not correlated
with any general construct (Nunnally, 1967); it can categorize an entity into only a
relatively small number of groups; and it is often unreliable.
3). Collection of data. The third step is to collect data using one of the following
methods: laboratory experiments, field experiments, field studies, or survey research
(Kerlinger, 1964). Methods should be selected based on their strengths and weaknesses
(Jenkins, 1985).
4). Purification of measures (Calculating coefficient alpha for assessing reliability)
and assessment of discriminant validity. This step empirically examines the extent to
which there is an absence of measurement error in the items, or their reliability (Kerlinger,
1964; Nunnally, 1967). There are a number of ways of assessing reliability, such as
correlating alternative forms of the measure against each other, split-half correlations,
and test-retest. The most important is internal consistency, which requires calculating the
alpha coefficient (the square root of the estimated correlation of the measure with
errorless true scores). However, the alpha coefficient provides an unbiased estimate only
if the scale is unidimensional.
The dimensionality of the construct may be examined by using factor analysis,
either exploratory or confirmatory. Exploratory factor analysis is used to ascertain the
underlying dimensions of data (Kim and Mueller, 1978a) and confirmatory analysis is
used to test hypotheses regarding the number of dimensions. It is meaningful only when
25
there are specific expectations regarding which variable is likely to load on which factor
(Kim and Mueller, 1978b)
5). Assessment of convergent validity. The preceding steps would produce an
internally consist or internally homogenous set of items, which is a necessary, but not a
sufficient, condition for construct validity (Nunnally, 1967). Construct validity refers to
the extent to which a measurement instrument actually appraises the theoretical
constructs it purports to assess (Carmines and Zeller, 1979). One type of the construct
validity is convergent validity. It is achieved when a measure that correlates highly with
other measures designed to measure the same thing.
In the following subsections, details of each of these steps have been provided.
Specification of the domain of construct
According to the guideline, researchers should conduct a thorough literature review to
understand the definitions of the constructs of interest, and to make sure that an
exhaustive list of factors has been identified. Our literature review was performed in this
study wherein the definition of IT capability was clarified. Further, it was identified that
IT capability is multidimensional (Bharadwaj, 2000; Bharadwaj, Sambamurthy, and
Zmud, 1999; Sabherval and Kirs, 1994) and in order to build a comprehensive instrument
of IT capability, it is important to include the constructs of IT Architecture, IT Human
Resource, IT Infrastructure, and IT Relationship Resource. The operational definitions
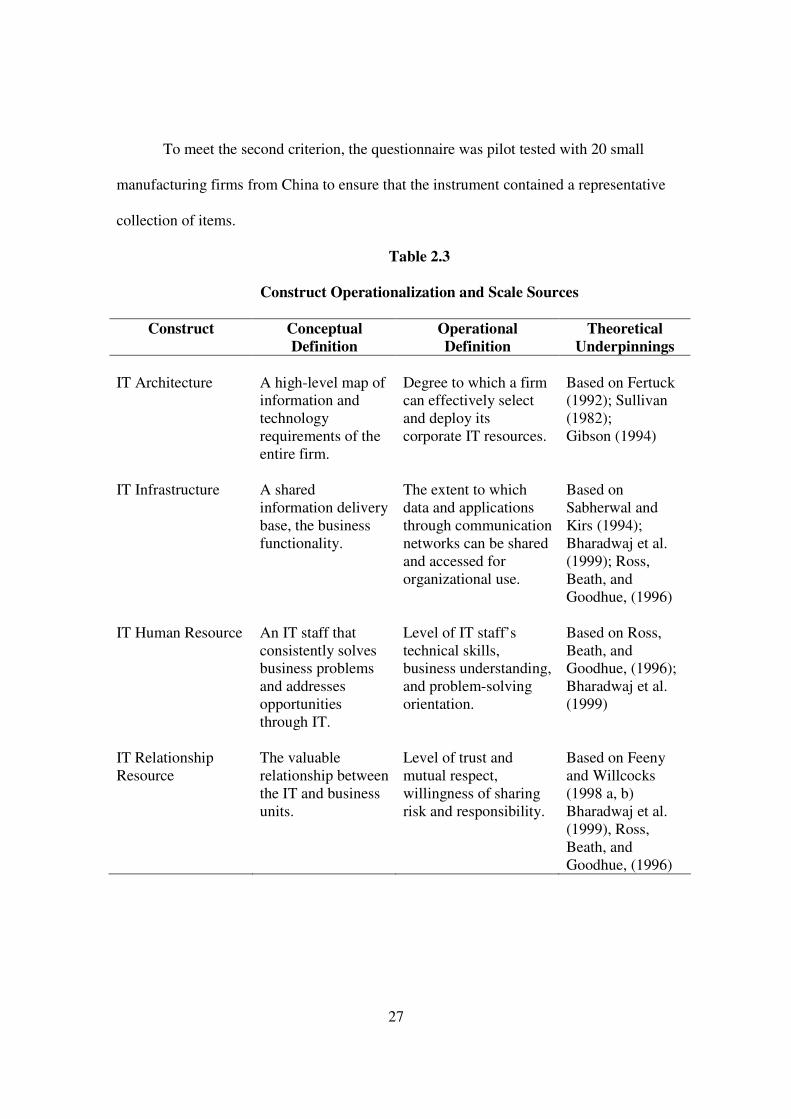
and scale sources are provided in Table 2.3.
26
Generation of the sample of items and establishment of content validity
The initial development of scale items was based on the work of Bharadwaj et al. (1999);
Ross, Beath, and Goodhue, (1996); Sabherwal and Kirs (1994); Sabherwal (1999);
Heijden (2000) and Grewal, Comer, and Mehta, (2001). Using the four dimensions from
previous discussion, a content analysis of the IT literature was employed, resulting in a
pool of items that were used in the development of the initial instrument.
Nunnally and Bernstein (1994, p.83) have suggested that one of the most
important ways in which to establish the “scientific utility of a measuring instrument” is
to establish the content validity. Content validity is not computed numerically. It is
subjectively judged by the researchers. It represents the adequacy with which a specific
domain of contents has been sampled (Nunnally, 1978). Determination of content validity,
according to Nunnally (1978), is based on two criteria. First, to determine whether an
instrument contains a representative collection of items. Second, to determine whether a
satisfactory method to test the instrument is used.
To meet the first criterion, the variables and measures used for the study were
based on extant literature. Through an extensive review of the past literature, an
elaborate list of the items was generated. All the items in the instrument were on a 7-
point Likert Scale anchored with Strongly Disagree and Strongly Agree at the two ends.
The original instrument was shown to three academicians and twenty-nine IT
professionals. Every round of the meeting and the pretest resulted in some modifications
to the scale, in terms of addition/deletion of items, rephrasing of items, and so on. The
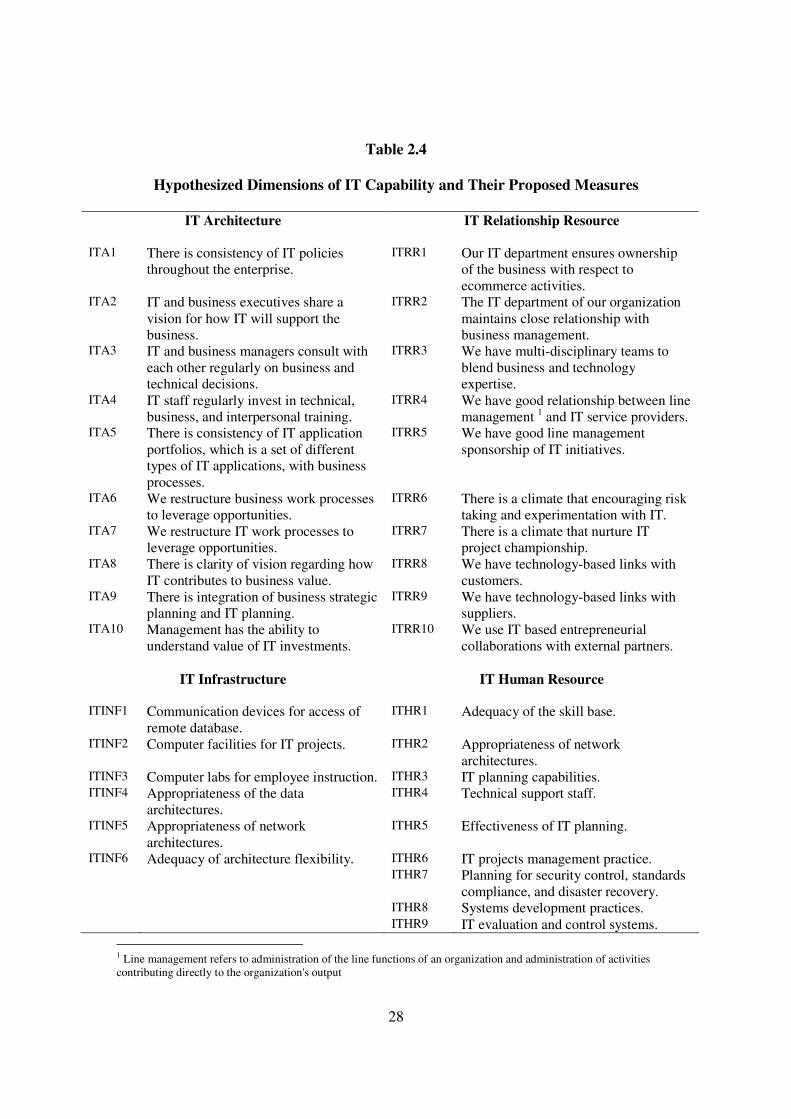
proposed model and measures are shown in Table 2.4.
27
To meet the second criterion, the questionnaire was pilot tested with 20 small
manufacturing firms from China to ensure that the instrument contained a representative
collection of items.
Table 2.3
Construct Operationalization and Scale Sources
Construct Conceptual Definition
Operational Definition
Theoretical Underpinnings
IT Architecture A high-level map of
information and technology requirements of the entire firm.
Degree to which a firm can effectively select and deploy its corporate IT resources.
Based on Fertuck (1992); Sullivan (1982); Gibson (1994)
IT Infrastructure A shared
information delivery base, the business functionality.
The extent to which data and applications through communication networks can be shared and accessed for organizational use.
Based on Sabherwal and Kirs (1994); Bharadwaj et al. (1999); Ross, Beath, and Goodhue, (1996)
IT Human Resource An IT staff that
consistently solves business problems and addresses opportunities through IT.
Level of IT staff’s technical skills, business understanding, and problem-solving orientation.
Based on Ross, Beath, and Goodhue, (1996); Bharadwaj et al. (1999)
IT Relationship Resource
The valuable relationship between the IT and business units.
Level of trust and mutual respect, willingness of sharing risk and responsibility.
Based on Feeny and Willcocks (1998 a, b) Bharadwaj et al. (1999), Ross, Beath, and Goodhue, (1996)
28
Table 2.4
Hypothesized Dimensions of IT Capability and Their Proposed Measures
IT Architecture IT Relationship Resource ITA1 There is consistency of IT policies
throughout the enterprise.
ITRR1 Our IT department ensures ownership of the business with respect to ecommerce activities.
ITA2 IT and business executives share a vision for how IT will support the business.
ITRR2 The IT department of our organization maintains close relationship with business management.
ITA3 IT and business managers consult with each other regularly on business and technical decisions.
ITRR3 We have multi-disciplinary teams to blend business and technology expertise.
ITA4 IT staff regularly invest in technical, business, and interpersonal training.
ITRR4 We have good relationship between line management 1 and IT service providers.
ITA5 There is consistency of IT application portfolios, which is a set of different types of IT applications, with business processes.
ITRR5 We have good line management sponsorship of IT initiatives.
ITA6 We restructure business work processes to leverage opportunities.
ITRR6 There is a climate that encouraging risk taking and experimentation with IT.
ITA7 We restructure IT work processes to leverage opportunities.
ITRR7 There is a climate that nurture IT project championship.
ITA8 There is clarity of vision regarding how IT contributes to business value.
ITRR8 We have technology-based links with customers.
ITA9 There is integration of business strategic planning and IT planning.
ITRR9 We have technology-based links with suppliers.
ITA10 Management has the ability to understand value of IT investments.
ITRR10 We use IT based entrepreneurial collaborations with external partners.
IT Infrastructure IT Human Resource
ITINF1 Communication devices for access of remote database.
ITHR1 Adequacy of the skill base.
ITINF2 Computer facilities for IT projects. ITHR2 Appropriateness of network architectures.
ITINF3 Computer labs for employee instruction. ITHR3 IT planning capabilities. ITINF4 Appropriateness of the data
architectures.
ITHR4 Technical support staff.
ITINF5 Appropriateness of network architectures.
ITHR5 Effectiveness of IT planning.
ITINF6 Adequacy of architecture flexibility. ITHR6 IT projects management practice. ITHR7 Planning for security control, standards
compliance, and disaster recovery. ITHR8 Systems development practices. ITHR9 IT evaluation and control systems.
1 Line management refers to administration of the line functions of an organization and administration of activities contributing directly to the organization's output
29
Data collection
The final questionnaire for measuring IT capability was administered to small and
medium-sized manufacturing firms in China. We randomly selected 240 sample firms
that meet our criteria: 1) these firms were established after 1980, and 2) they export at
least 25% of their product from or near their establishment date. A wide range of firms
and industries was selected for two reasons. First, information technology continues to
contribute significantly to greater effectiveness in a wide range of manufacturing
industries. Second, a diverse sample increases the generalizability of the results.
We introduced these firms to our study and encouraged participation. Our efforts
resulted in 180 firms agreeing to participate in the study. We assured confidentiality to
all respondents to encourage candid responses. Our data collection efforts yielded 121
completed questionnaires (i.e., those who agreed to participate and did participate in the
interviews) for a participation rate of 66.7% (121 of 180). Missing data and listwise
deletion reduced the current analytic sample to 106, for an effective participation rate of
58.9%.
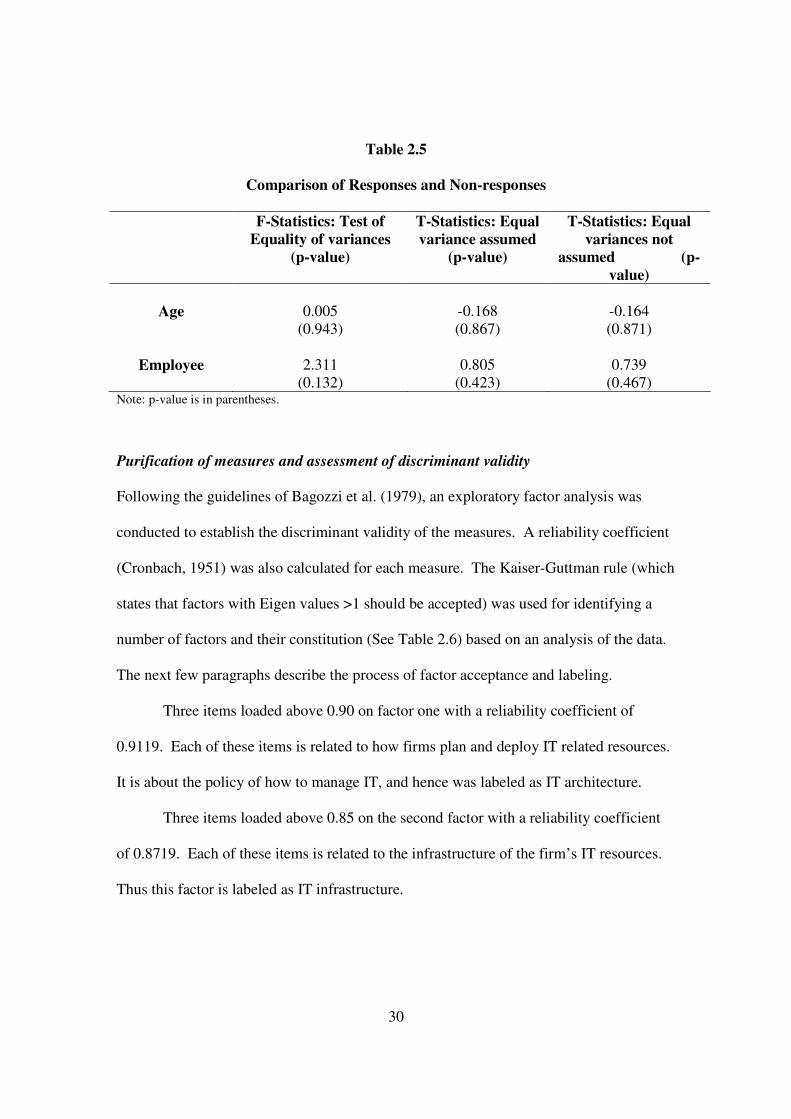
To test whether our respondents were different from non-respondents, we
obtained the demographic data, namely the age of the firm and the number of full-time
employees in the firm, from 28 non-respondents (those managers who agreed to
participate but refused participation later) to compare with those of the study participants.
We found no statistically significant differences in age of the firms and employee
numbers. Please see Table 2.5 for details.
30
Table 2.5
Comparison of Responses and Non-responses
F-Statistics: Test of Equality of variances
(p-value)
T-Statistics: Equal variance assumed
(p-value)
T-Statistics: Equal variances not
assumed (p-value)
Age 0.005
(0.943) -0.168 (0.867)
-0.164 (0.871)
Employee 2.311
(0.132) 0.805
(0.423) 0.739
(0.467) Note: p-value is in parentheses.
Purification of measures and assessment of discriminant validity
Following the guidelines of Bagozzi et al. (1979), an exploratory factor analysis was
conducted to establish the discriminant validity of the measures. A reliability coefficient
(Cronbach, 1951) was also calculated for each measure. The Kaiser-Guttman rule (which
states that factors with Eigen values >1 should be accepted) was used for identifying a
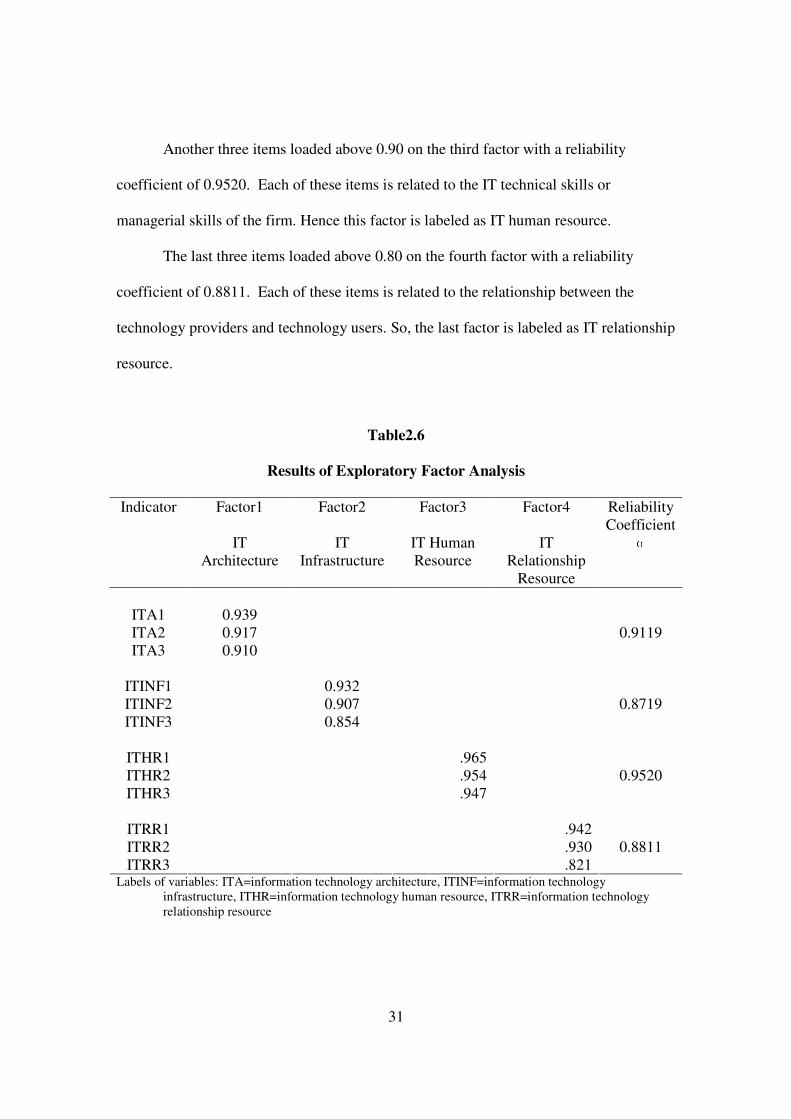
number of factors and their constitution (See Table 2.6) based on an analysis of the data.
The next few paragraphs describe the process of factor acceptance and labeling.
Three items loaded above 0.90 on factor one with a reliability coefficient of
0.9119. Each of these items is related to how firms plan and deploy IT related resources.
It is about the policy of how to manage IT, and hence was labeled as IT architecture.
Three items loaded above 0.85 on the second factor with a reliability coefficient
of 0.8719. Each of these items is related to the infrastructure of the firm’s IT resources.
Thus this factor is labeled as IT infrastructure.
31
Another three items loaded above 0.90 on the third factor with a reliability
coefficient of 0.9520. Each of these items is related to the IT technical skills or
managerial skills of the firm. Hence this factor is labeled as IT human resource.
The last three items loaded above 0.80 on the fourth factor with a reliability
coefficient of 0.8811. Each of these items is related to the relationship between the
technology providers and technology users. So, the last factor is labeled as IT relationship
resource.
Table2.6
Results of Exploratory Factor Analysis
Indicator Factor1
IT Architecture
Factor2
IT Infrastructure
Factor3
IT Human Resource
Factor4
IT Relationship
Resource
Reliability Coefficient α
ITA1 0.939 ITA2 0.917 ITA3 0.910
0.9119
ITINF1 0.932 ITINF2 0.907 ITINF3 0.854
0.8719
ITHR1 .965 ITHR2 .954 ITHR3 .947
0.9520
ITRR1 .942 ITRR2 .930 ITRR3 .821
0.8811
Labels of variables: ITA=information technology architecture, ITINF=information technology infrastructure, ITHR=information technology human resource, ITRR=information technology relationship resource
32
Overall, the exploratory factor analysis helped to establish the
multidimensionality of the construct of IT capability. Specifically, it showed that IT
capability in born global context has distinct dimensions and can be broken down to the
constructs of IT architecture, IT infrastructure, IT human resource, and IT relationship
resource, as identified in prior literature.
Convergent validity
An established method for examining convergent validity is Campbell and Fiske’s (1959)
multitrait-multimethod matrix (MTMM) (Churchill, 1979; Devellis, 1991). However,
Bagozzi et al. (1979) argue that, in recent years, confirmatory factor analysis (CFA) using
the structural equation modeling (SEM) technique, which provides researchers with a chi-
squared goodness-of-fit test for the model, is a better and more rigorous method for
assessing convergent validity of an instrument. It will also help in establishing the uni-
dimensionality of the indicators (Anderson and Gerbing, 1982).
In this study, we follow the guidelines of Anderson and Gerbing (1982) and
Bagozzi et al. (1979) to test the convergent validity of the construct. We assessed the fit
of our hypothesized model (IT capability) with a confirmatory factor analytic model
using AMOS 4.0 (Arbuckle and Wothke, 1999).
Our objective in the EFA was to help us to get a general idea about the structure
of our instrument and identify the “latent sources of variation and covariation” in our
original instrument (Jöreskog and Sörbom, 1988). On the other hand, our objective in the
CFA was to understand how well our final set of items (generated from the EFA) fit our
dataset. The focus was on the creation of the measurement model in AMOS, which
33
specified how the “latent variables or hypothesized constructs” were measured in terms
of the observed variables (Jöreskog and Sörbom, 1988). After the creation of the models,
the fit of the models was analyzed by using the maximum likelihood (ML) method that
assumes that the “observed variables have a multinormal distribution” (Jöreskog and
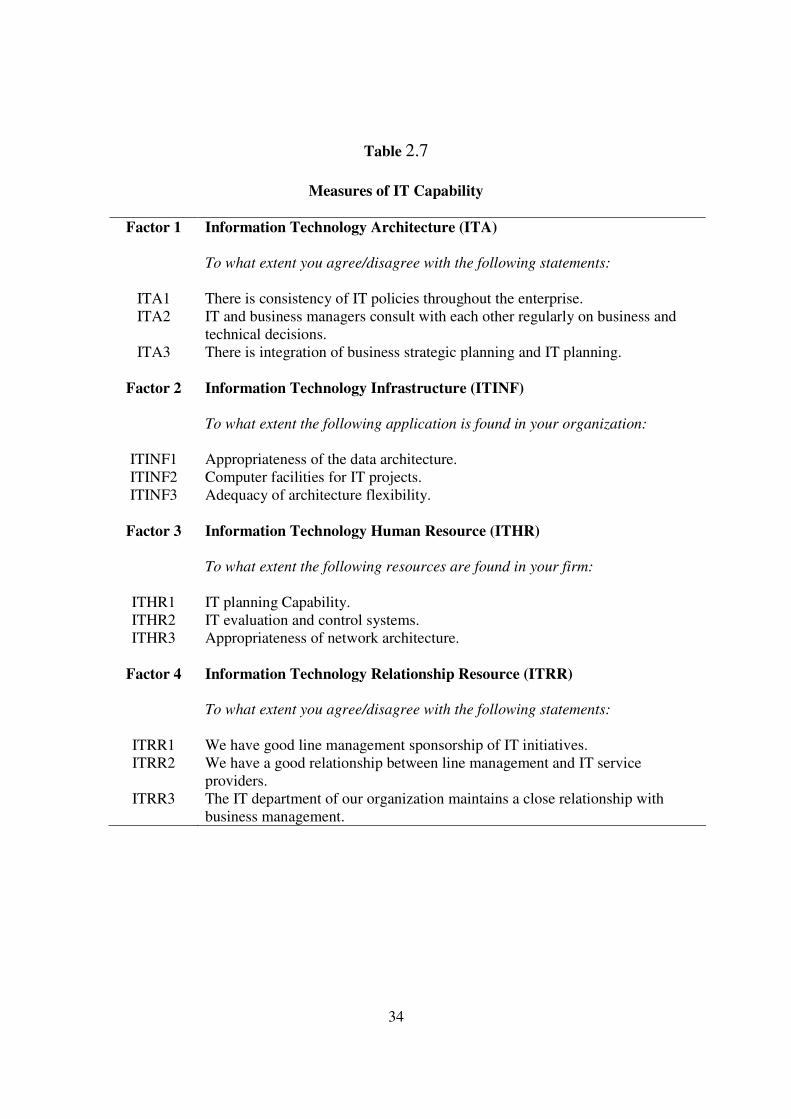
Sörbom, 1988, p21). Table 2.7 shows the measures, grouped into four dimensions that
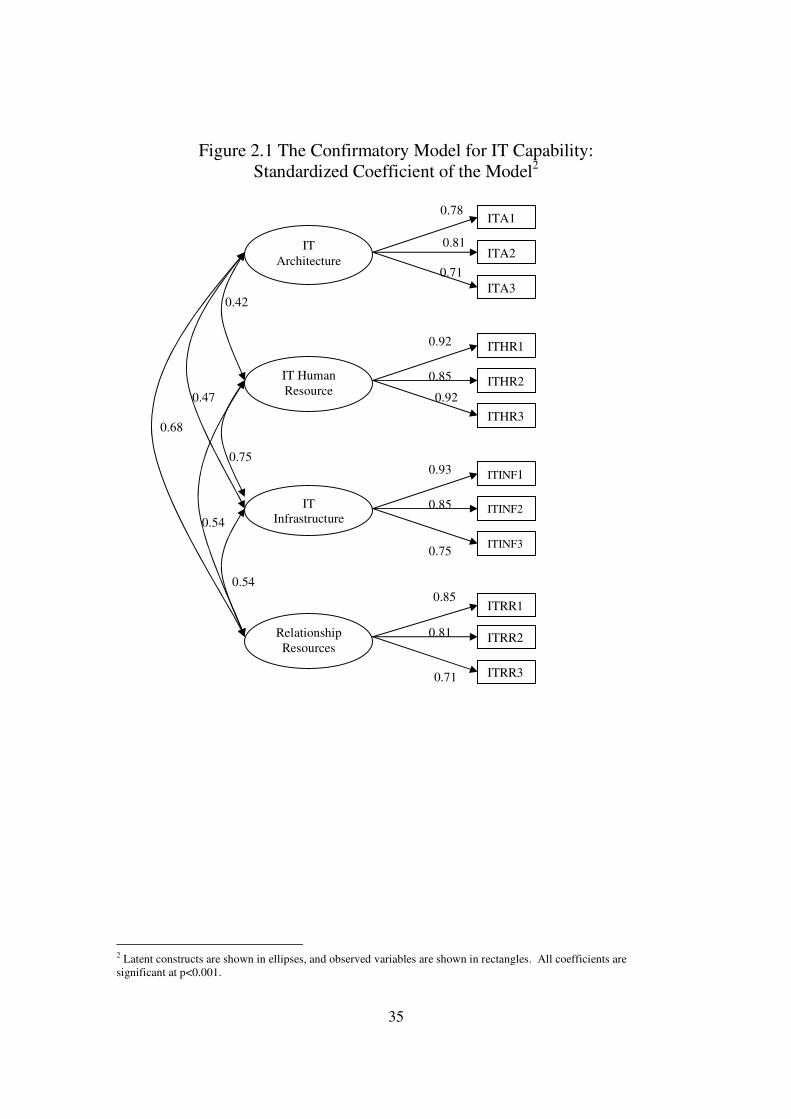
satisfied the unidimensionality and convergent validity criteria and Figure 2.1 shows the
conceptual model and standardized coefficient of the model.
34
Table 2.7
Measures of IT Capability
Factor 1 Information Technology Architecture (ITA) To what extent you agree/disagree with the following statements:
ITA1 There is consistency of IT policies throughout the enterprise. ITA2 IT and business managers consult with each other regularly on business and
technical decisions. ITA3 There is integration of business strategic planning and IT planning.
Factor 2 Information Technology Infrastructure (ITINF)
To what extent the following application is found in your organization:
ITINF1 Appropriateness of the data architecture. ITINF2 Computer facilities for IT projects. ITINF3 Adequacy of architecture flexibility.
Factor 3 Information Technology Human Resource (ITHR)
To what extent the following resources are found in your firm:
ITHR1 IT planning Capability. ITHR2 IT evaluation and control systems. ITHR3 Appropriateness of network architecture.
Factor 4 Information Technology Relationship Resource (ITRR)
To what extent you agree/disagree with the following statements:
ITRR1 We have good line management sponsorship of IT initiatives. ITRR2 We have a good relationship between line management and IT service
providers. ITRR3 The IT department of our organization maintains a close relationship with
business management.
35
Figure 2.1 The Confirmatory Model for IT Capability: Standardized Coefficient of the Model2
0.81
0.71
0.42
0.47 0.92
0.68
0.75
0.54
0.54 0.85
0.71
2 Latent constructs are shown in ellipses, and observed variables are shown in rectangles. All coefficients are significant at p<0.001.
0.93
0.78
0.85
0.75
0.81
0.85
IT
Architecture
IT Human
Resource
IT Infrastructure
Relationship
Resources
ITA1
ITA2
ITA3
ITHR1
ITHR2
ITHR3
ITINF1
ITINF2
ITINF3
ITRR1
ITRR2
ITRR3
0.92
36
All the path coefficients for the model have high t-values, and significant at the level of
0.01. In addition to the ML estimates, an important way in which the fit of a model can
be assessed in SEM is by using the overall fit criteria such as the normed fit index (NFI),
the comparative fit index (CFI), the Tucker Lewis index (or non-normed fit index, NNFI),
and the root mean square error of approximation (FMSEA) (Jöreskog and Sörbom, 1988).
To do so, we use AMOS 4.0 (Arbuckle and Wothke, 1999). The results are reported in
Table 2.8.
Table 2. 8
Fit Statistics and Recommended Values for the Measurement Model
Fit statistics Recommended values (Hair et al. 1998)
Value
χ
2 (df) Non significant 64.6 (48)
χ
2 / df Between 1 to 2 or 3 1.35
Normed fit index (NFI) >0.90 0.98 Tucker Lewis index (or non-normed fit index, NNFI)
>0.90 0.99
Comparative fit index (CFI) >0.90 0.99 Root-mean-square error of approximation (RMSEA)
<0.08 0.06
Results in Table 2.8 show that all the criteria are satisfied. According to Hair et al.
(1998), the chi-square should be non significant and its ratio to degree of freedom should
be not more than 3. The results in our study shows that the chi-square is non significant
at p<0.06 and its ratio to degree of freedom is 1.35, which falls in between 1 to 2 or 3.
Besides this, the recommended RMSEA value is less than 0.8, and our result of the
37
RMSEA is 0.06, which is very good. All the other fit indices are above 0.90. The
Normed fit index (NFI) is 0.98, the Tucker Lewis index (NNFI) is 0.99, and the
Comparative fit index (CFI) is 0.99. In all, the study scales were found to be reliable and
valid.
Discussion and Implications
This paper reports on the development and validation of a measure of IT capability. The
IT capability scale was found to demonstrate reliability, unidimensionality, and validity.
Despite the increasing research attention paid to the concept of IT capability, to date there
has been no comprehensive operational measure of IT capability. To our best knowledge,
this study is among the first to provide a comprehensive, psychometrically sound, and
operationally valid measure of a firm’s IT capability.
Academic and managerial implications
The present study makes both academic and practical contributions, and suggests several
applications for the research. Our academic contribution is to offer a significant advance
to the current literature of IT capability. First, we explore the nature of IT capability and
then develop a conceptual model of IT capability with four components, namely: IT
architecture, IT human resource, IT infrastructure, and IT relationship resource. Though
some of the ideas expressed in this conceptual model may be familiar to researchers, its
value is in integrating these various notions to provide a more comprehensive picture of
IT capability. Second, it provides empirical evidence on the testable scale that is both
reliable and valid. This gives a new theoretical insight into how IT capability is
38
generated. Our conceptualization and empirical findings are encouraging. We have
provided a useful foundation on which can be built further theoretical and empirical
research in the field of information technology.
For business practitioners, the proposed scale could be used as a diagnostic tool to
identify areas where specific improvements are needed, and to pinpoint aspects of the
firm’s IT capability that require work. For the results of an exercise to be meaningful,
some benchmarks or norms should be used as a basis for comparison. In addition to
aiding in the monitoring process, the four components in the IT capability model can also
serve training needs by helping human resource managers develop appropriate training
programs that can help in developing IT capability. Furthermore, top management can
use this framework to develop synergy that is essential to the firm’s IT capability
between IT department and business unit.
In summary, IT capability is not so much a specific set of sophisticated
technological functions as it is an enterprise-wide capability to leverage technology to
differentiate from competition (Henderson and Venkatraman, 1993). To be able to do so,
a firm is required to have a clear understanding of the critical components of IT
capability and their role in supporting and shaping business strategy. This study
represents a step toward a better understanding of the IT capability construct and its
dimensions. It also offers managers a comprehensive inventory of IT-related sources
and activities, which can be used to identify areas of strength as well as areas in need of
improvement.
39
Limitations and future research
While we believe that this is a significant contribution, there are some limitations of the
study and need future study to improve it. As mentioned earlier, the data were collected
from China. Although it can be said that the samples represent a large number of
businesses, it would be useful to obtain a broader and wider sampling frame from other
countries. Since IT usage and information disclosure are influenced by cultures, it would
be useful to test whether the existing model can be generalized to other countries. Future
research needs to investigate whether the scale is cross-culturally valid.
Even though we argue that IT capability is important and developed a scale to
measure it, we need to test whether IT capability really leads to better business
performance in our future study.
Previous studies have suggested that culture, both national and organizational,
may influence the application of IT; future studies should examine how people from
different cultures perceive IT capability and how organizational culture influences the
development of IT capability.
One more area of future research is the way in which capabilities are created and
developed. Capabilities are argued to arise dynamically. Qualitative research could
investigate how the capabilities of IT departments are formed and strengthened.
Conclusion
In this paper, we have advanced our knowledge of IT capability in the context of born
global firms. In doing so, we addressed the question of what is capability and what are
its components. Our empirical results show that there are four dimensions of IT
40
capability, namely IT architecture, IT human resource, IT infrastructure, and IT
relationship resource. It is hoped that this study will prompt further research on IT
implementation in born global firms.
41
CHAPTER THREE
A COMPARISON OF THE PERCEIVED IT CAPABILITY IN CHINA AND THE U.S.
Introduction
IT capability has become more important in contemporary organizations with the
increased emphasis on the strategic role of IT (Bharadwaj, Sambamurthy, and Zmud,
1999). The continuing evolution in hardware and software technologies has brought
about a spiraling decline in costs for all organizations, such that even the smallest of
business organizations can afford to purchase needed IT (Riemenschneider and Mykytyn,
2000). While Beckett (2003) found that 71% of American SMEs were confident in their
IT strategies, Kyobe (2004) found that many SME managers in some other countries are
still ignorant about their business environment. They do not use IT resources to create
links with suppliers, neither do they use them to differentiate products/services nor to
enable innovations. Unfortunately, the causes of these differences are not well
documented.
Existing information system literature shows that most of the hardware and
software in information technology is based on designs that originated in North America.
Much is from a very narrow corridor of California in the U.S. known as the “Silicon
Valley.” This technology has been readily accepted in countries that have a Western
culture similar to that of the U.S. Information systems that are used to run businesses
worldwide are mainly from this culture and impose a Western way of doing business.
While the Western developers of these systems are usually unaware of this inherent
cultural bias, it has been noticed by users of IT in other cultures (Evers & Day, 1997).
42
The development of information systems is expanding to more locations through
out the world. They are developed in countries with different business and cultural
environments. Culture is therefore an important variable in the development process and
may introduce its own set of problems. Thus, the purpose of this study is to examine the
differences of perceived IT capability in different cultures.
To fulfill the purpose of this study, we will focus on the U.S. and China for two
major reasons. First, there is a close alliance between the two countries (Adler, Brahm,
and Graham, 1992). For instance, there are currently a number of economical ties
between the two nations, with both countries having subsidiaries and actively marketing
goods and services in the other country. In addition, there are a large number of joint
ventures and mergers taking place between companies in the U.S. and China (Calantone
and Zhao, 2001). Many educational exchange programs also exist between the two
countries. As a result, many scholars in China have been educated in the U.S. during the
past few decades. Due to the numerous ties between the two countries, it might be
reasonable to understand how people view of IT capability in these two countries.
A second reason why a comparison between the U.S. and China might be of
interest is the vast cultural differences between the two countries (Hofstede, 1980).
Cultural differences are often cited as a reason that IS development in a global
environment may differ from the strategic use of IT that have been found to be successful
in the U.S. (Shore, 1998; Shore and Venkatachalam, 1994). Cultural differences have
particularly proven to be a major obstacle in global IS development when Asian offices
are involved (Burnson, 1989). Thus, it is possible that culture differences could
contribute to differences in the perceived IT capability of firms.
43
Literature review
Culture influence on IT implementation
National culture distinguishes the members of one group or category of people from
another (Hofstede, 1980). Since each culture has unique values to guide human behavior,
national culture strongly affects management practices including policy making (Earley,
1993; Garfield and Watson, 1997). It has also been demonstrated that the management of
information technology is influenced by national culture (Abdul-Gader, 1997). Straub
(1994) found that uncertainty avoidance is the major reason that caused the significant
difference of the perception of usefulness and actual uses of emails and Faxes among
Japanese and American knowledge workers. In the same vein, Png, Tan, and Wee (2001)
found that uncertainty avoidance is negatively associated with IT infrastructure adoption
at the corporate level. Besides these studies, Watson, Ho and Raman (1994) found that
power distance has an effect on a GSS on equality of participation and consensus. Tan,
Watson, and Wei, (1998) found that computer mediated communication is useful for
alleviating majority influence in an individualistic but not a collectivistic culture. Along
the same line, Hasan and Ditsa (1998) argue that IT empowers individuals in collective
cultures. See more details in Table 3.1.
Even though many dimensions of culture have been studied in cross-cultural
research, the most widely cited is individualism/collectivism (Tan, Watson, and Wei,
1998). An individualistic culture is one where ties between people are loose so that they
base their self-understanding on their own actions, which are usually taken independently
of what others think (Earley, 1994). A collectivistic culture is one where people are
integrated into strong cohesive groups so that they base their self-understanding on the
44
reactions of others around them (Earley, 1994). This cultural attribute has been identified
as being particularly different between Anglo-American and Chinese-based cultures. For
example, Hofstede (1984), Harris and Moran (1987), and Triandis et al., (1988) have
isolated the self-interest motive as being central to Anglo-American management theory
and practice. On the other hand, the subjugation of self to group interests has been noted
as a key characteristic of Chinese-based societies (e.g., Bond and Leung, 1984; Redding
and Wong, 1986). Studies quantifying the degree of individualism/collectivism across
countries, using an instrument first developed by Hofstede (1980) or variants thereof,
have consistently supported this directional difference between Anglo-American and
Chinese-based cultures (e.g., Chow, Shields, and Chan, 1991; Harrison 1992, 1993;
O’Connor 1995). Along the same vein, Ralston et al. (1992, 1993) have pointed to the
relative emphasis on group vs. individual interests as being a primary and enduring
difference between Eastern and Western cultures. While the PRC was not in Hofstede’s
(1980) original sample, data from proximate countries (e.g., Taiwan), along with other
research on Chinese culture (e.g., Earley 1994; Triandis, 1995; Kachelmeier and Shehata,
1997), strongly suggest that the Chinese culture lies toward the collectivist end of the
continuum. Thus, we argue that China is a good representative of collective culture and
the U.S. is a good representative of individualistic culture and the influence of cultural
difference on the IT capability relationship in China and the U.S. can also reflect the
situation of IT implementation in collectivistic-oriented, Eastern countries and
individualistic-oriented Western countries.
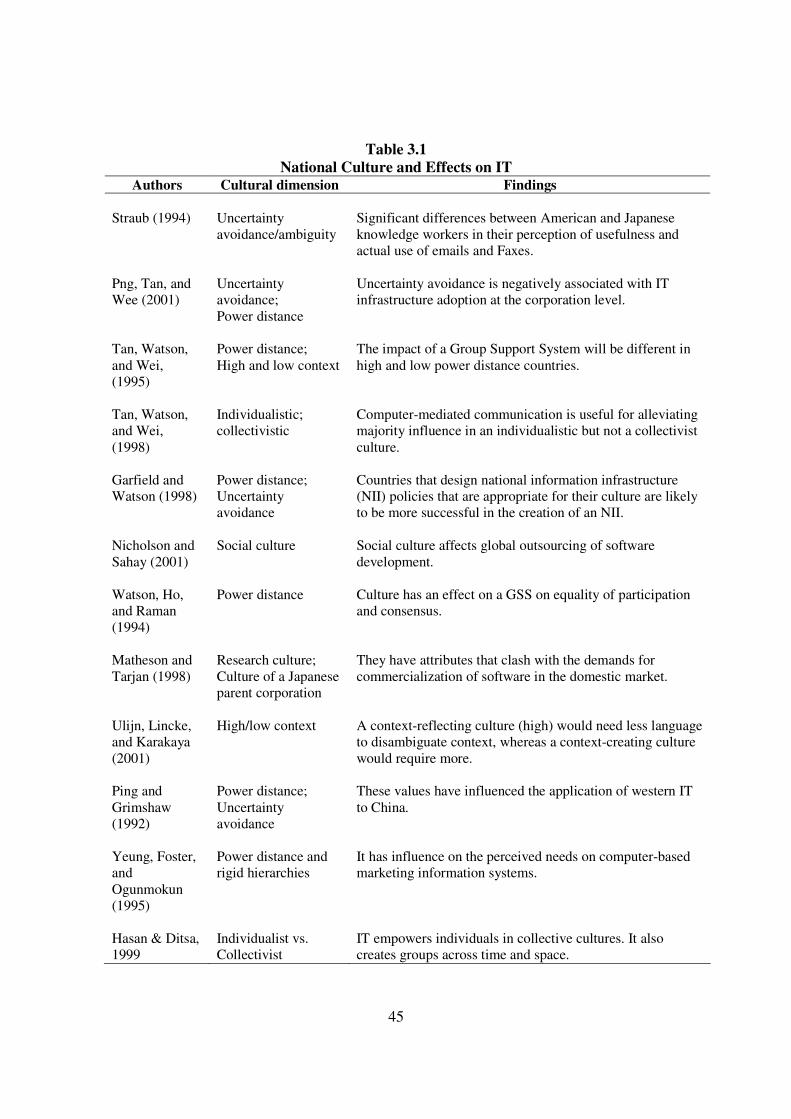
45
Table 3.1 National Culture and Effects on IT
Authors Cultural dimension Findings
Straub (1994) Uncertainty avoidance/ambiguity
Significant differences between American and Japanese knowledge workers in their perception of usefulness and actual use of emails and Faxes.
Png, Tan, and Wee (2001)
Uncertainty avoidance; Power distance
Uncertainty avoidance is negatively associated with IT infrastructure adoption at the corporation level.
Tan, Watson, and Wei, (1995)
Power distance; High and low context
The impact of a Group Support System will be different in high and low power distance countries.
Tan, Watson, and Wei, (1998)
Individualistic; collectivistic
Computer-mediated communication is useful for alleviating majority influence in an individualistic but not a collectivist culture.
Garfield and Watson (1998)
Power distance; Uncertainty avoidance
Countries that design national information infrastructure (NII) policies that are appropriate for their culture are likely to be more successful in the creation of an NII.
Nicholson and Sahay (2001)
Social culture Social culture affects global outsourcing of software development.
Watson, Ho, and Raman (1994)
Power distance Culture has an effect on a GSS on equality of participation and consensus.
Matheson and Tarjan (1998)
Research culture; Culture of a Japanese parent corporation
They have attributes that clash with the demands for commercialization of software in the domestic market.
Ulijn, Lincke, and Karakaya (2001)
High/low context A context-reflecting culture (high) would need less language to disambiguate context, whereas a context-creating culture would require more.
Ping and Grimshaw (1992)
Power distance; Uncertainty avoidance
These values have influenced the application of western IT to China.
Yeung, Foster, and Ogunmokun (1995)
Power distance and rigid hierarchies
It has influence on the perceived needs on computer-based marketing information systems.
Hasan & Ditsa, 1999
Individualist vs. Collectivist
IT empowers individuals in collective cultures. It also creates groups across time and space.
46
Western information management in China
Cross-cultural differences pose an emerging challenge to the global information
management community. There is a growing amount of evidence to indicate that
profound differences in societal and organizational cultures limit the applicability of
many management theories and practices (Ein-Dor, et al., 1993; Westwood, 1995).
Management technologies developed for one context often cannot be readily transferred
to another. Management of information systems is not immune to this phenomenon
(Martinsons and Westwood, 1997). Thus, the capability that is related to strategic use of
IT in western culture might not be perceived the same way in China.
Walsham (2000) argues that there are some Chinese culture attributes that might
explain the phenomenon. The first is the importance of personal relationships in Chinese
business culture. Chinese societies are based on networks of relationships. The needs of
one’s group, including one’s family, supersede individual aspirations and their fulfillment.
Private meetings rather than written memos or reports are the primary means of
communication. The amount of information subordinates receive from their boss reflects
the degree to which they are trusted (Martinsons and Westwood, 1997). This emphasis
on informal face-to-face communication, and not on written information, implies a
limited role for explicit IS, at least when addressing important or sensitive issues.
The second attribute is the fact that Chinese firms have more centralized
structures than their American counterparts. Key decisions are made mostly by the
proprietor, and if not by him, then often by a relative. This is especially true in smaller
47
firms. This practice also reduces the need to exchange information between Chinese
managers and thus calls into question the role of an IS in decision-making.
The third attribute is that information is seen as a major instrument of personal
power, and is fundamentally a personal asset rather than an organizational resource.
Martinsons and Westwood pointed out that power is maintained by carefully controlling
key information. Most management information is for top managers only, and remains in
a soft form in the mind of the manager. Key details, ideas, and knowledge are selectively
passed on to chosen individuals. Besides these, Chinese messages are comparatively terse
in words, but rich in meaning. Subtle cues are used to enrich the explicit content. Thus
for Chinese, little value is seen in codifying business information into a standardized
form, especially if its context would be lost.
The fourth attribute is that Chinese managers’ decision-making is not only
personal and centralized, but also related to the view of knowledge as the subtle
accumulation of experience absorbed over many years. Thus, high value is placed on
intuition by the powerful and experienced leader rather than in a Western-style ‘rational’
analysis based on openly available data and criteria.
Finally, a fifth attribute is that Chinese philosophy emphasizes the need to accept
the environment as a ‘given’ at any particular point in time, and the need to seek harmony
with it. Thus, rather than trying to project and control the future, the tendency is focus on
responding to present contingencies. Even though the trend towards globalization will
undeniably blur the boundaries and distinctions between societal cultures, the
management systems of the Chinese are likely to reflect their deeply-rooted values for
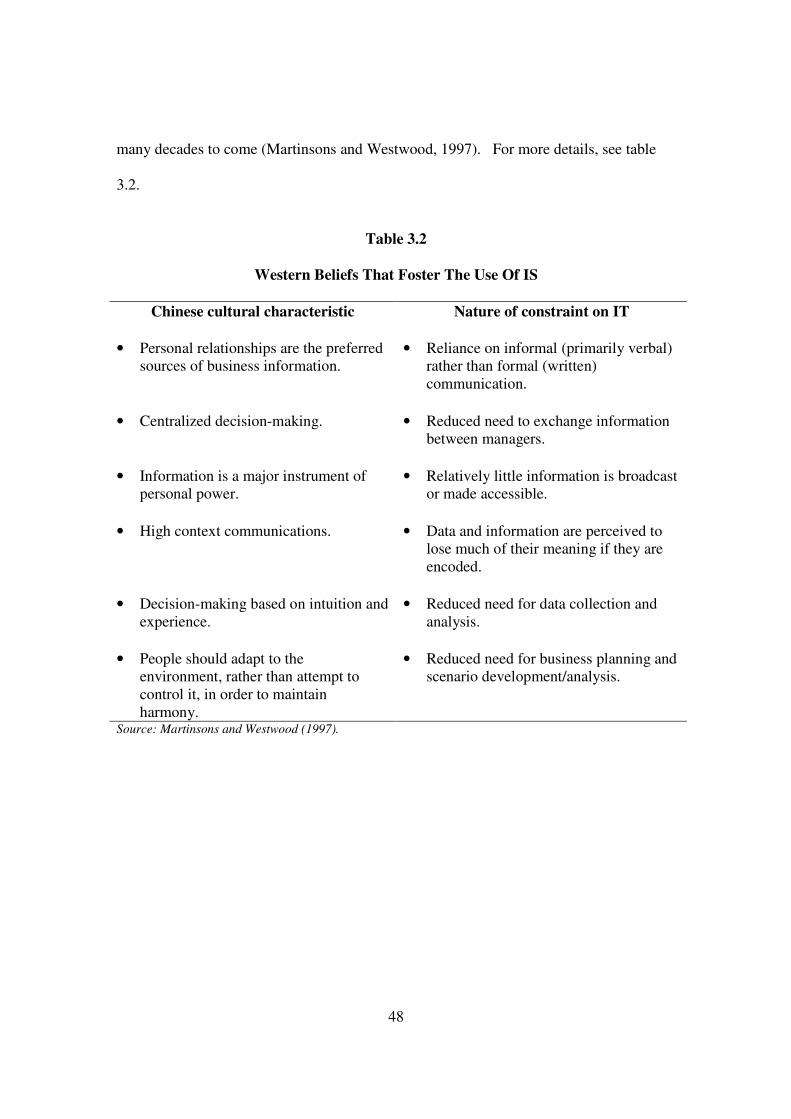
48
many decades to come (Martinsons and Westwood, 1997). For more details, see table
3.2.
Table 3.2
Western Beliefs That Foster The Use Of IS
Chinese cultural characteristic Nature of constraint on IT
• Personal relationships are the preferred sources of business information.
• Reliance on informal (primarily verbal) rather than formal (written) communication.
• Centralized decision-making. • Reduced need to exchange information between managers.
• Information is a major instrument of personal power.
• Relatively little information is broadcast or made accessible.
• High context communications. • Data and information are perceived to lose much of their meaning if they are encoded.
• Decision-making based on intuition and experience.
• Reduced need for data collection and analysis.
• People should adapt to the environment, rather than attempt to control it, in order to maintain harmony.
• Reduced need for business planning and scenario development/analysis.
Source: Martinsons and Westwood (1997).
49
Hypotheses
IT capability is defined as a firm’s ability to acquire, deploy, and leverage its IT
investment in combination with other resources and capabilities as well as to support and
enhance their distinctive competencies and skills in other business functions in order to
achieve business objectives through IT implementations. In reviewing the IT literature,
six models were identified that have dimensions underlying the IT capability construct.
The models are shown in Table 2.2. They were proposed by Sabherwal and Kirs (1994,
1999); Ross, Beath, and Goodhue (1996); Feeny and Willcocks (1998 a, b); Bharadwaj et
al. (1999); Byrd and Turner (2000); and Bharadwaj (2000). We empirically confirmed
that it is a multidimensional construct. The resulting dimensions taken from combining
these models are (1) IT architecture, (2) IT infrastructure, (3) IT human resource, (4) IT
relationship resource. Based on the discussion in the preceding section, we develop our
hypotheses in the next paragraphs.
IT Architecture
IT architecture is a high level map of information and technology requirements of the
entire firm and it is the clarity and organizational consensus around technology, data, and
process standards. It provides a vision for how a firm will select and deploy its corporate
IT resources. Although IT architecture is considered extremely important in the U.S.
(Vizard, 2000), it is different in China. In Chinese business, and especially smaller firms
such as born global firms, the release of information that promotes conformity and
50
reinforces the existing relationship networks is encouraged. Conversely, messages that
advocate radical change or undermine social stability tend to be suppressed (Martinsons,
1996). The Chinese are comfortable with limited access to information, because it is not
perceived to be a public commodity. Moreover, their management systems do little to
promote the release of timely or accurate information. This is especially true in born
global firms. Most of the born global firms are SMEs and most of the SMEs in China are
family businesses. These Chinese entrepreneurs typically keep information within an in-
group, rather than disclosing it for public scrutiny or use (Redding, 1990; Wong 1985).
Moreover, the storage, retrieval and transmission of electronic data could also expose
their organizations to mischief or sabotage by computer hackers or cyberspace terrorists.
Even though many Western firms implement open or distributed IT architectures, many
Chinese executives continue to seek well-secured and centralized database management
systems. Thus, we can see that the IT architecture in Chinese born global firms is pretty
much fixed to the use of top management. Thus, we can argue that:
H1: U.S. firms have a higher level of IT architecture than Chinese firms.
IT Human Resource
IT human resource is considered a valuable human asset that consistently solves business
problems and addresses business opportunities through information technology. It is
related to IT technical skills, IT managerial skills, business understanding and planning,
and problem-solving orientation. Even though these skills are important, they didn’t gain
enough attention in the Chinese firms. As discussed earlier, Chinese SMEs see little
value in codified information, especially if its context would be lost (Walsham, 2000).
51
Decision-making is not only personal and centralized, but also related to the view of
knowledge as the subtle accumulation of experience absorbed over many years. Thus
high value is placed on intuition by the powerful and experienced leader rather than in a
Western-style ‘rational’ analysis based on openly available data and criteria (Ping and
Grimshaw, 1992; Martinsons and Martinsons, 1996). Thus, we can argue that:
H2: U.S. firms have a higher level of IT Human Resource than Chinese firms.
IT Infrastructure
By IT infrastructure, we mean the shared resource that data and applications access
through communication networks for organizational use. The main purpose of IT
infrastructure is to provide consistent and quick information support throughout the
organization to respond to dynamic challenges in the markets (Bhatt 2000). Even though
in China, SMEs are heavy IT spenders, most of the IT expenditures go to the physical IT
infrastructure (Chinanet, 2004). Most of the Chinese SMEs have not built integrated
infrastructure for the better use of information (Krone, Garrett, and Chen, 1992). As
mentioned earlier, information is seen as a major instrument of personal power, and is
fundamentally a personal asset rather than an organizational resource. And power is
maintained by carefully controlling key information. Most management information is
for top managers only, and remains in a soft form in the mind of the manager. Key
details, ideas, and knowledge are selectively passed on to chosen individuals. The
concept of building a shared platform for information does not make any sense in
Chinese business cultural context. Thus, we can argue that:
H3: U.S. firms have a higher level of IT Infrastructure than Chinese firms.
52
IT Relationship Resource
IT relationship resources means the valuable relationship between the IT and business
units. In order to have the effective application of IT in the firm, management of IT and
business units need to share the risk and responsibility (Ross, Beath, and Goodhue, 1996;
Bharadwaj, 2000). Shared risk and responsibility require trust and mutual respect, and an
ability to communicate, coordinate, or negotiate quickly and effectively. Relationships
play a very important role in Chinese firms. The top manager is the central node for
external communications. Guanxi connections, or personal relationships, are the
preferred informational networks for the Chinese. Even in the age of the Internet, they
remain a common substitute for more formal, impersonal, and abstract sources (Redding,
1990; Seagrave, 1995). Information on new products, new technologies, and new market
possibilities is often accumulated by socializing with friends and acquaintances (Redding,
1990). Thus, trust and mutual respect play very important roles in long-term relationship
building in the Chinese business context. Chinese businessmen put high value on
business relationships. Yet, in the U.S., the gap in communication and understanding
between business leaders and IT experts is well documented (Potts, 2004; Hoffman, 2003;
Wilson, 1997). In order to solve the problems, a growing number of IT directors have
appointed IT account or relationship managers to work with business units. These staffs
are usually drawn from within IT and improve alignment and collaboration between
business leaders and the IT department (Potts, 2004). Yet, as time goes by, having
people acting as a “bridge” between the business and IT units can lead to uncomfortable
issues about what the true added value is and also a possible conflict of loyalties. Does

53
the IT account managers represent the interests of the customer (the business) or the
supplier (IT), or the middle ground? (Potts, 2004; Hoffman, 2003). Thus, we argue that:
H4: Chinese firms have a higher level of IT Relationship Resource than U.S.
firms.
Research method
Research context
We chose born global firms for our sample because of the following reasons: 1) they are
small exporters 2) they are an emerging phenomenon and heavily use IT during their
internationalization process (Johnson, 2004; Yeoh, 2000). In order to test our hypotheses
on the influence of culture, we selected China and the U.S. as the research settings.
These countries provide rich research contexts due to differences in terms of their
different cultural influences on IT implementations.
As known, China is undergoing a dramatic technological change in the late 1990s.
The country will play the major role in the computer-dominated world of the 21st century.
Key to the role will be the availability of information. For today’s IT professional in
China, there is no more pressing need than for accurate, up-to-date technical information
(Martinsons and Martinsons, 2002). The U.S. is the Giant in IT world, and has been
leading IT development for decades. Its experience would be very useful to Chinese
business managers. A comparison between the U.S. and China might be of interest
because of vast cultural differences between the two countries (Hofstede, 1980).
Moreover, cultural differences are often cited as a reason that IT development in a global
environment may differ from the strategies that have been found to be successful in the
54
U.S. (Shore, 1998; Shore & Venkatachalam, 1994). Cultural differences have
particularly proven to be a major obstacle in global IS development when Asian cultures
are involved (Burnson, 1989; Liu, Marchewks, and Ku, 2004). Thus, it is possible that
cultural differences could contribute to differences in the perceived importance of IT
capability.
Sample and data collection
To test the hypotheses, survey data were collected in both China and the U.S. The survey
instrument was developed in several stages following generally recognized procedures
(e.g. Fowler, 1988; Gerbing and Anderson, 1988; Joreskog et al., 2000; Nunnally, 1978;
Churchill, 1979). In this study, IT capability is viewed as a multidimensional construct.
The literature was searched to obtain information on the key constructs and scales
appropriate for measuring them. Seven-point Likert scales were used to minimize
executive response time and effort (Fowler, 1988).
Our sample consists of data from small and medium-sized manufacturing firms
established after 1980 that exported at least 25% of their product from near the date of
their establishment. We identified these companies from the Directory of United States
Exporters and CorpTech Directory of Technology Companies in the U.S. A wide range
of firms and industries was selected for two reasons. First, information systems continue
to contribute significantly to greater effectiveness in a wide range of manufacturing
industries. Second, a diverse sample increases the generalizability of the results.
Appropriate key respondents were identified based on two criteria: a) possession of
55
sufficient knowledge, and b) adequate level of involvement with regard to the issues
under investigation.
Companies were surveyed in the U.S. and China. Due to their different business
and cultural environments, this study adopted mail survey in the U.S. and a survey that
was personally distributed in China.
After the revision based on the pretest, the questionnaire was mailed to 682
companies in the U.S. with a cover letter explaining the importance of the study and
requesting the help of the respondent (See Appendix A). A self-addressed, prepaid
envelope was included. We offered the chance to win a gift certificate; three
participating companies were picked in a lottery as winners. The first wave resulted in
143 invalid addresses. Following a three-wave mailing, 51 usable surveys were returned
reflecting a response rate of about 9.5%.
In China, the same questionnaire was translated and given to Chinese businesses.
Back-translation was used in order to increase the accuracy and similarity of the items
and to test for the meanings of the Chinese words obtain an accurate translation. The
Chinese sample for the study consists of the same type of firms. We randomly selected
the sample firms that meet our criteria. We contacted the top management of 240 firms
to introduce the study and ask for participation. A total of of 180 agreed to participate in
the study. We assured confidentiality to all respondents to encourage candid responses.
Our data collection efforts yielded 121 completed questionnaires (i.e., those who agreed
to participate and did participate in the interviews) for a participation rate of 66.7%.
Missing data and listwise deletion reduced the current analytic sample to 106, for an
effective participation rate of 58.9%.
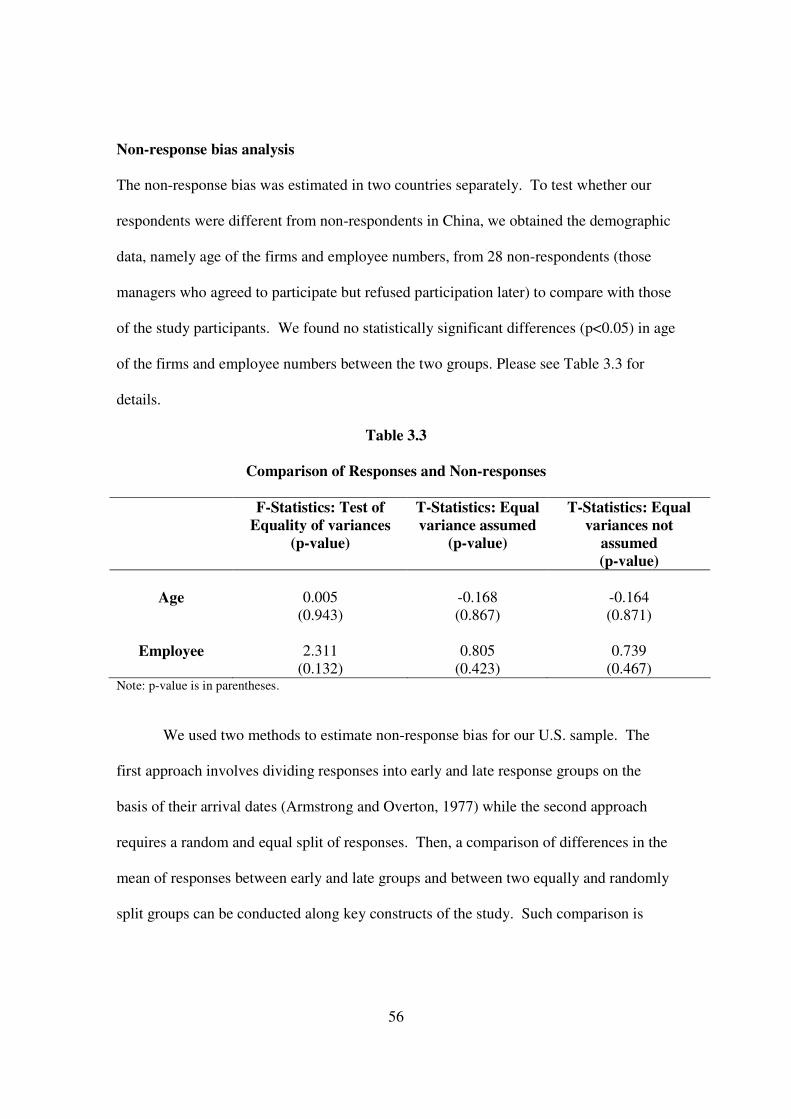
56
Non-response bias analysis
The non-response bias was estimated in two countries separately. To test whether our
respondents were different from non-respondents in China, we obtained the demographic
data, namely age of the firms and employee numbers, from 28 non-respondents (those
managers who agreed to participate but refused participation later) to compare with those
of the study participants. We found no statistically significant differences (p<0.05) in age
of the firms and employee numbers between the two groups. Please see Table 3.3 for
details.
Table 3.3
Comparison of Responses and Non-responses
F-Statistics: Test of Equality of variances
(p-value)
T-Statistics: Equal variance assumed
(p-value)
T-Statistics: Equal variances not
assumed (p-value)
Age 0.005
(0.943) -0.168 (0.867)
-0.164 (0.871)
Employee 2.311
(0.132) 0.805
(0.423) 0.739
(0.467) Note: p-value is in parentheses.
We used two methods to estimate non-response bias for our U.S. sample. The
first approach involves dividing responses into early and late response groups on the
basis of their arrival dates (Armstrong and Overton, 1977) while the second approach
requires a random and equal split of responses. Then, a comparison of differences in the
mean of responses between early and late groups and between two equally and randomly
split groups can be conducted along key constructs of the study. Such comparison is

57
considered a valid test of non-response bias as documented and practiced by volume of
studies (e.g., Li and Calantone, 1998; Wu, Mahajan, and Balasubramanian, 2004).
The U.S. questionnaires were initially divided into two groups based on their
arrival dates. The first group of responses, the early response group, consisted of
questionnaires received during the first four weeks of the survey period. Questionnaires
received afterwards were considered late responses. The early response group included
26 firms or 50.9 % of total valid replied mails. The remaining 25 firms were grouped as
late responses, and this accounted for 49.1% of the total responses.
These questionnaires were also categorized randomly into two groups. Following
this approach, two data groups with an equal number of responses (i.e., 25) were
generated. The means of the major constructs in this study were compared in both
groupings, and no significant differences were found (see table 3.3 and 3.4). This
suggests that non-response bias is not a concern.
Sample characteristics
On average, Chinese born global firms are larger than the U.S. ones. And both Chinese
and U.S. born global firms invest heavily in IT, but, on average, U.S. firms invest more
money on IT. As for sale revenue, Chinese born global firms receive higher sale revenue.
Most of the respondents from China have shorter working experience than those of the
U.S. ones. Table 3.4 presents descriptive statistics for the test subjects’ work experience
and their current situations.
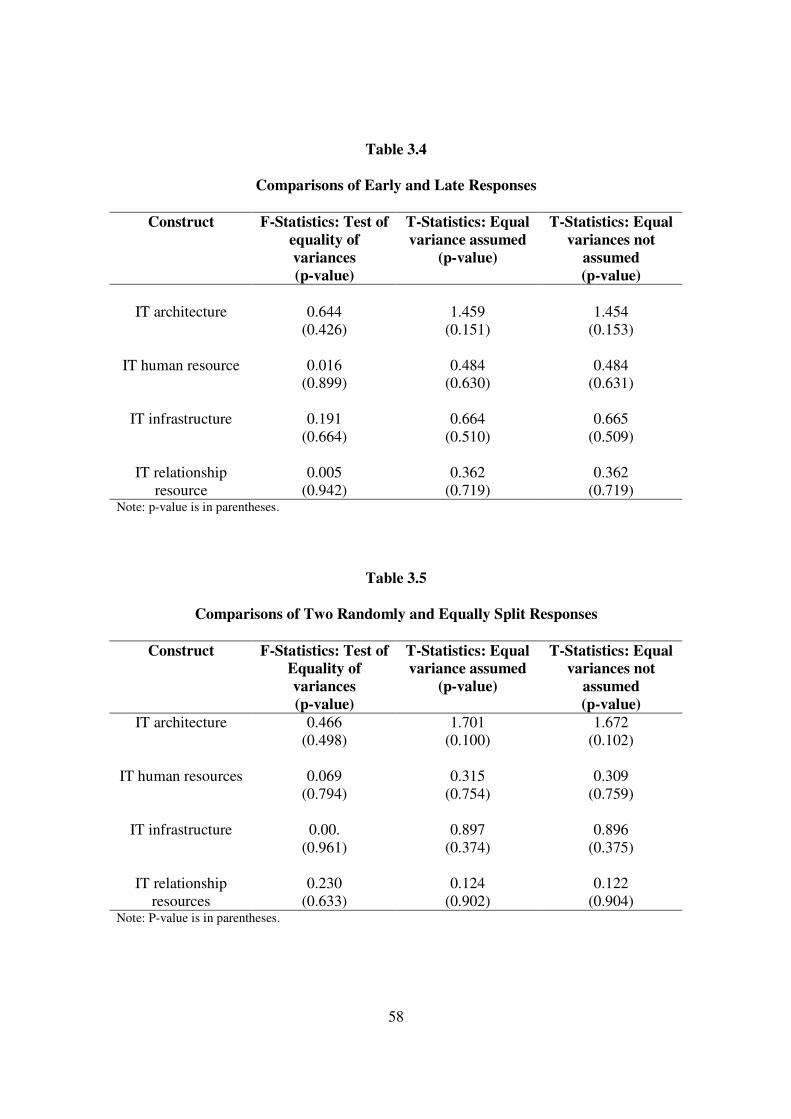
58
Table 3.4
Comparisons of Early and Late Responses
Construct F-Statistics: Test of equality of variances (p-value)
T-Statistics: Equal variance assumed
(p-value)
T-Statistics: Equal variances not
assumed (p-value)
IT architecture 0.644
(0.426) 1.459
(0.151) 1.454
(0.153)
IT human resource 0.016 (0.899)
0.484 (0.630)
0.484 (0.631)
IT infrastructure 0.191
(0.664) 0.664
(0.510) 0.665
(0.509)
IT relationship resource
0.005 (0.942)
0.362 (0.719)
0.362 (0.719)
Note: p-value is in parentheses.
Table 3.5
Comparisons of Two Randomly and Equally Split Responses
Construct F-Statistics: Test of Equality of variances (p-value)
T-Statistics: Equal variance assumed
(p-value)
T-Statistics: Equal variances not
assumed (p-value)
IT architecture 0.466 (0.498)
1.701 (0.100)
1.672 (0.102)
IT human resources 0.069
(0.794) 0.315
(0.754) 0.309
(0.759)
IT infrastructure 0.00. (0.961)
0.897 (0.374)
0.896 (0.375)
IT relationship
resources 0.230
(0.633) 0.124
(0.902) 0.122
(0.904) Note: P-value is in parentheses.
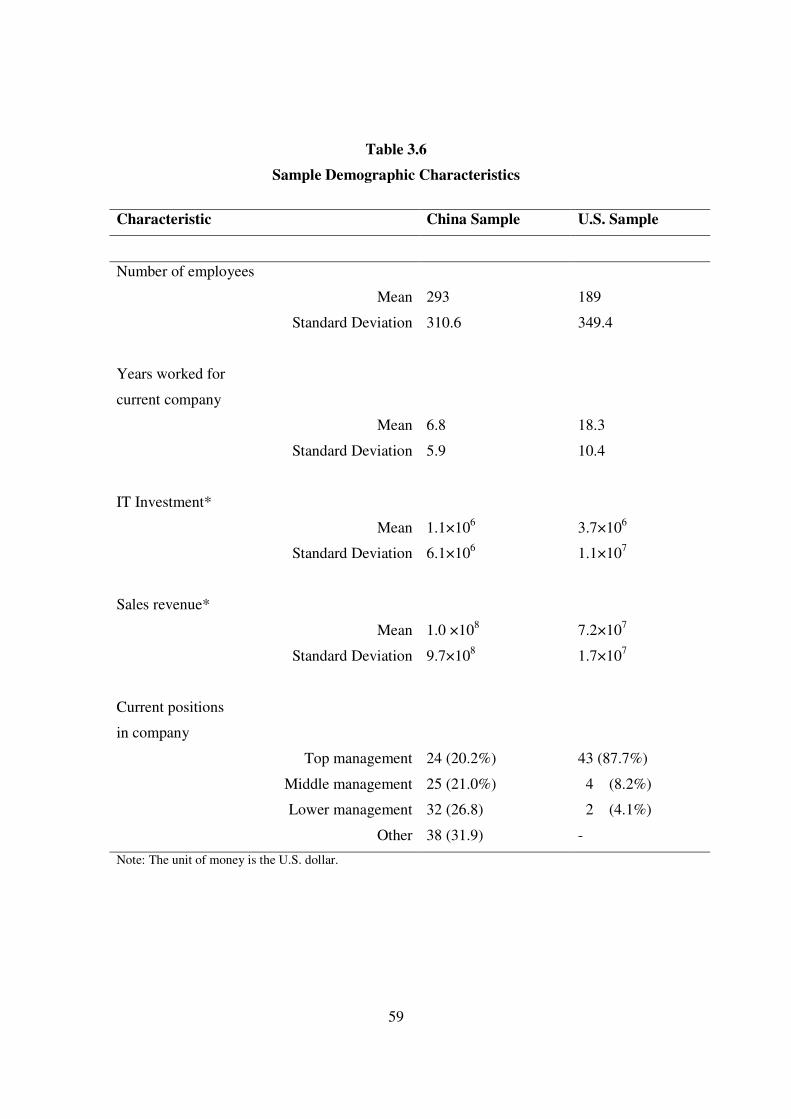
59
Table 3.6
Sample Demographic Characteristics
Characteristic China Sample U.S. Sample
Number of employees
Mean 293 189
Standard Deviation 310.6 349.4
Years worked for
current company
Mean 6.8 18.3
Standard Deviation 5.9 10.4
IT Investment*
Mean 1.1×10⁶ 3.7×10⁶
Standard Deviation 6.1×10⁶ 1.1×10⁷
Sales revenue*
Mean 1.0 ×10⁸ 7.2×10⁷
Standard Deviation 9.7×10⁸ 1.7×10⁷
Current positions
in company
Top management 24 (20.2%) 43 (87.7%)
Middle management 25 (21.0%) 4 (8.2%)
Lower management 32 (26.8) 2 (4.1%)
Other 38 (31.9) -
Note: The unit of money is the U.S. dollar.
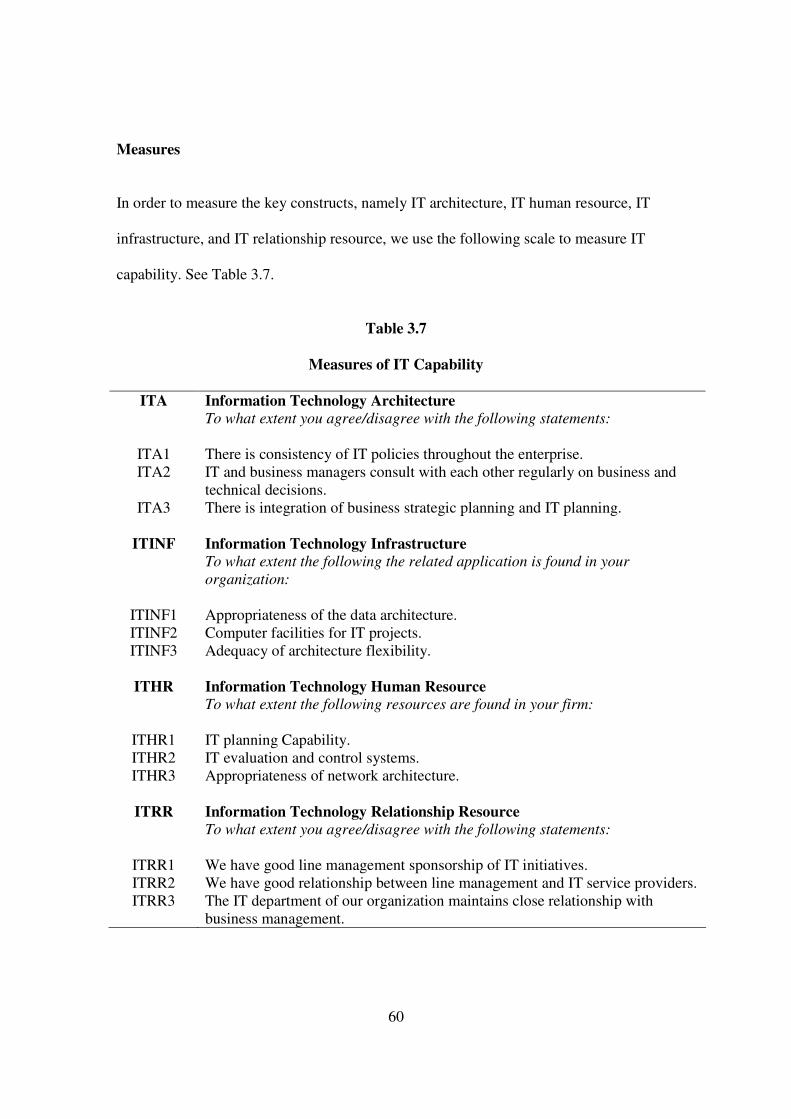
60
Measures
In order to measure the key constructs, namely IT architecture, IT human resource, IT
infrastructure, and IT relationship resource, we use the following scale to measure IT
capability. See Table 3.7.
Table 3.7
Measures of IT Capability
ITA Information Technology Architecture To what extent you agree/disagree with the following statements:
ITA1 There is consistency of IT policies throughout the enterprise. ITA2 IT and business managers consult with each other regularly on business and
technical decisions. ITA3 There is integration of business strategic planning and IT planning.
ITINF Information Technology Infrastructure
To what extent the following the related application is found in your
organization:
ITINF1 Appropriateness of the data architecture. ITINF2 Computer facilities for IT projects. ITINF3 Adequacy of architecture flexibility.
ITHR Information Technology Human Resource
To what extent the following resources are found in your firm:
ITHR1 IT planning Capability. ITHR2 IT evaluation and control systems. ITHR3 Appropriateness of network architecture.
ITRR Information Technology Relationship Resource
To what extent you agree/disagree with the following statements:
ITRR1 We have good line management sponsorship of IT initiatives. ITRR2 We have good relationship between line management and IT service providers. ITRR3 The IT department of our organization maintains close relationship with
business management.
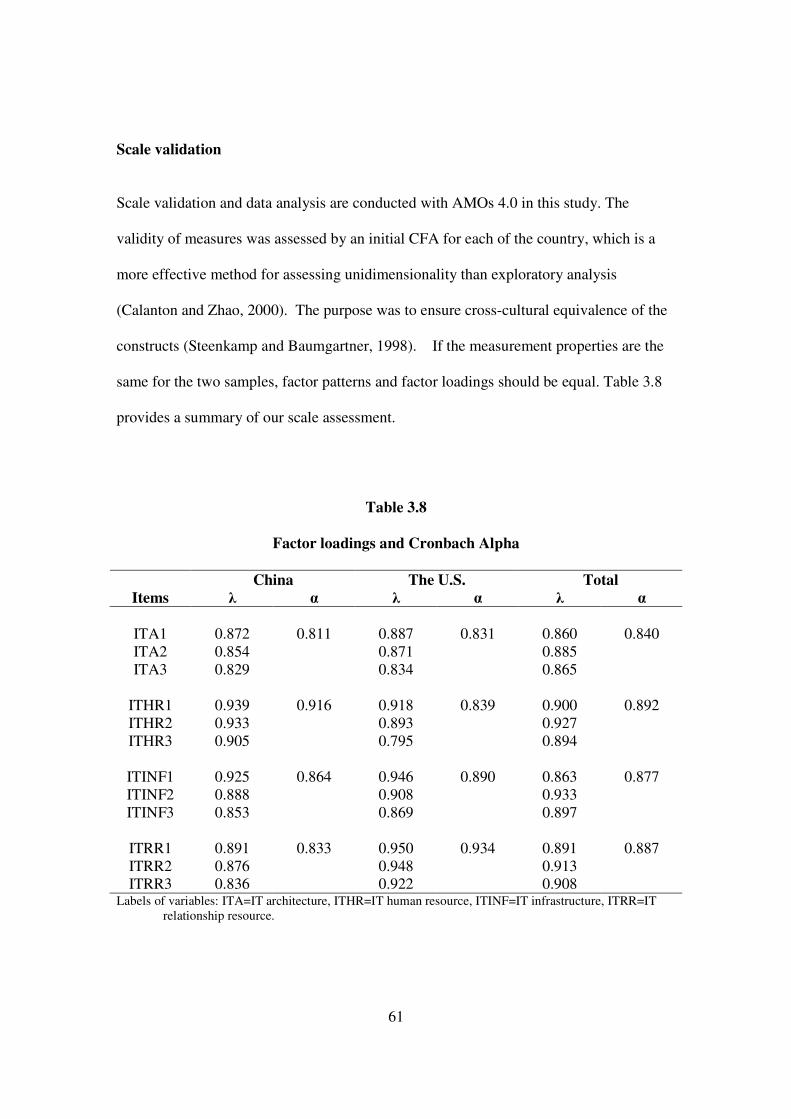
61
Scale validation
Scale validation and data analysis are conducted with AMOs 4.0 in this study. The
validity of measures was assessed by an initial CFA for each of the country, which is a
more effective method for assessing unidimensionality than exploratory analysis
(Calanton and Zhao, 2000). The purpose was to ensure cross-cultural equivalence of the
constructs (Steenkamp and Baumgartner, 1998). If the measurement properties are the
same for the two samples, factor patterns and factor loadings should be equal. Table 3.8
provides a summary of our scale assessment.
Table 3.8
Factor loadings and Cronbach Alpha
China The U.S. Total Items λ α λ α λ α
ITA1 0.872 0.887 0.860 ITA2 0.854 0.871 0.885 ITA3 0.829
0.811
0.834
0.831
0.865
0.840
ITHR1 0.939 0.918 0.900 ITHR2 0.933 0.893 0.927 ITHR3 0.905
0.916
0.795
0.839
0.894
0.892
ITINF1 0.925 0.946 0.863 ITINF2 0.888 0.908 0.933 ITINF3 0.853
0.864
0.869
0.890
0.897
0.877
ITRR1 0.891 0.950 0.891 ITRR2 0.876 0.948 0.913 ITRR3 0.836
0.833
0.922
0.934
0.908
0.887
Labels of variables: ITA=IT architecture, ITHR=IT human resource, ITINF=IT infrastructure, ITRR=IT relationship resource.
62
The results show that all of the factor loadings are above 0.800 and all the
cronbach alphas are above 0.800 too. This shows invariance of the measurement model.
Hypotheses Testing
In order to test the hypotheses in this study, we use ANOVA to analysis the data. To
examine the perceived IT capability in two countries, a 2 (countries) X 4 (Components)
mixed ANOVA was performed on the data.
The ANOVA results indicated a significant difference between IT architecture
(F=19.545, p<0.001). Yet, the values of IT architecture of U.S. firms are higher than
those of the Chinese firms. Thus, H1 is not supported. Even though U.S. firms in the
U.S. receive higher scores on IT human resource, the difference is not significant
(F=5.368, p<0.226). Thus H2 is not supported. It also shows that IT infrastructure is also
perceived differently in these two countries (F=5.368, p<0.022), and the value of the U.S.
IT infrastructure is higher than those of the Chinese firms. Thus, H3 is supported. H4 is
also supported because the result shows strong differences of perceived IT relationship
resource in these two countries (F=6.025, p<0.015). And the Chinese firms receive higher
scores than the U.S. firms. Tables 3.9 and 3.10 show the results and the results of the
hypotheses tests are summarized in Table 3.11.
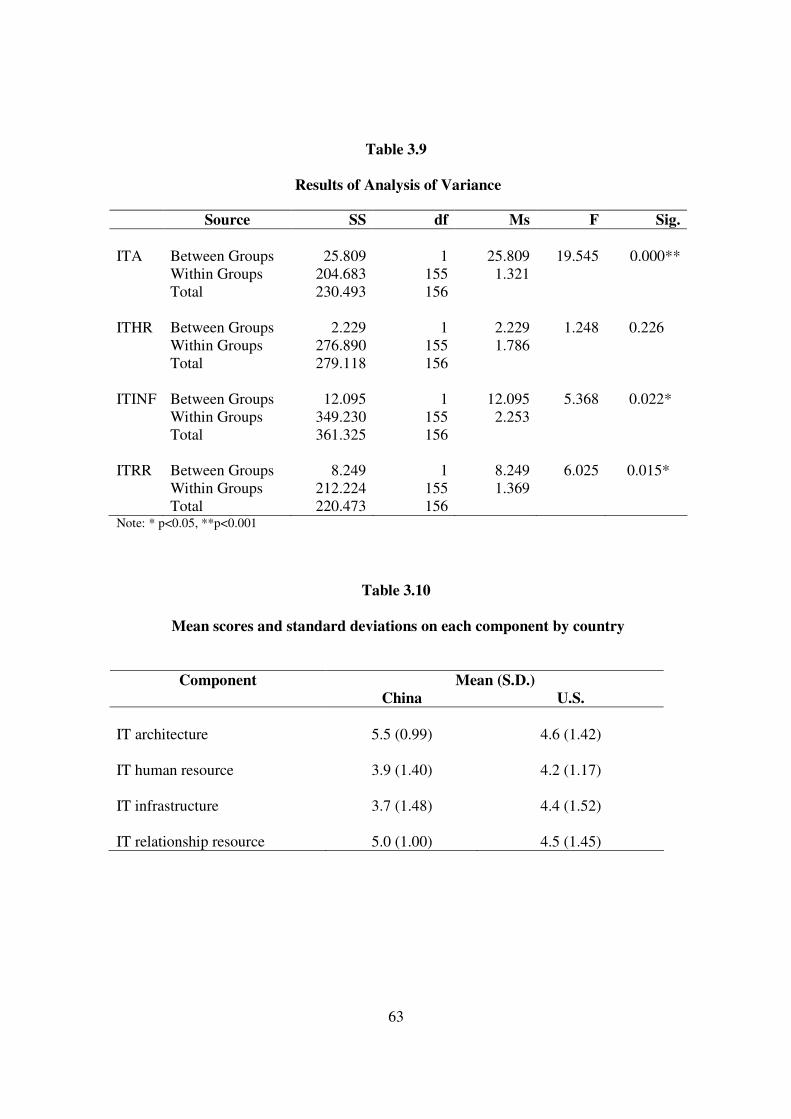
63
Table 3.9
Results of Analysis of Variance
Source SS df Ms F Sig.
ITA Between Groups 25.809 1 25.809 19.545 0.000** Within Groups 204.683 155 1.321 Total 230.493 156 ITHR Between Groups 2.229 1 2.229 1.248 0.226 Within Groups 276.890 155 1.786 Total 279.118 156 ITINF Between Groups 12.095 1 12.095 5.368 0.022* Within Groups 349.230 155 2.253 Total 361.325 156 ITRR Between Groups 8.249 1 8.249 6.025 0.015* Within Groups 212.224 155 1.369 Total 220.473 156 Note: * p<0.05, **p<0.001
Table 3.10
Mean scores and standard deviations on each component by country
Mean (S.D.) Component
China U.S.
IT architecture 5.5 (0.99) 4.6 (1.42) IT human resource 3.9 (1.40) 4.2 (1.17) IT infrastructure 3.7 (1.48) 4.4 (1.52) IT relationship resource 5.0 (1.00) 4.5 (1.45)
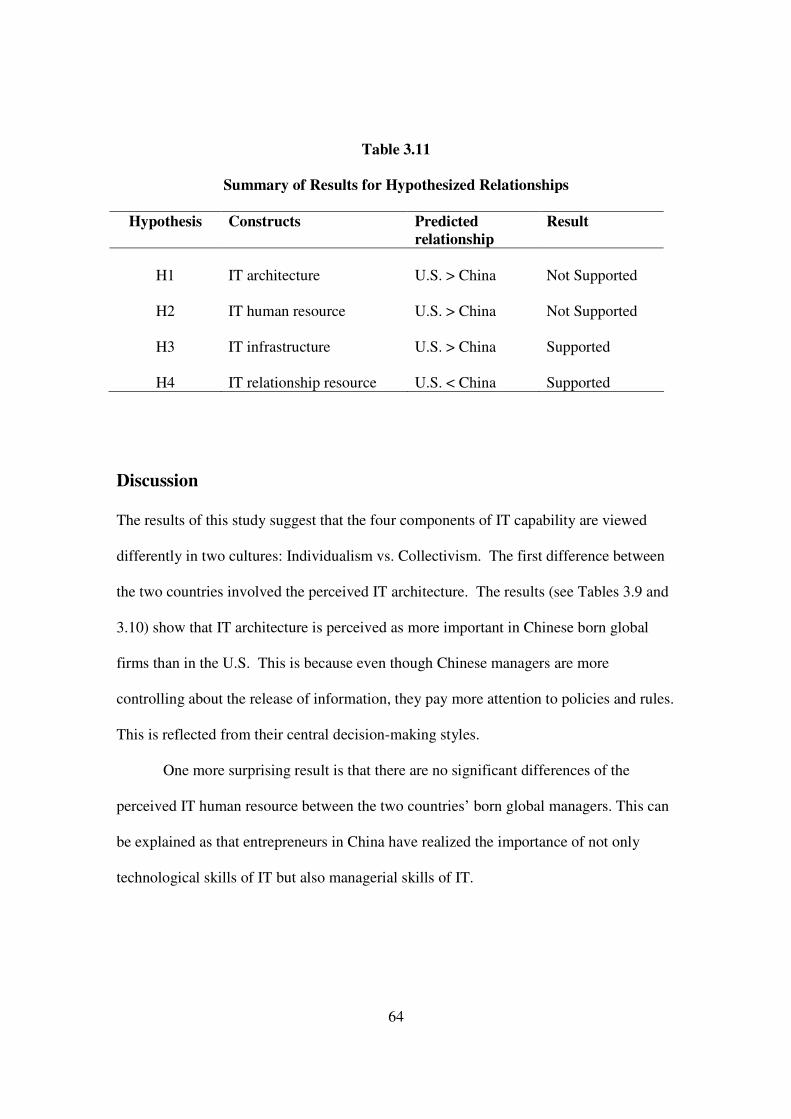
64
Table 3.11
Summary of Results for Hypothesized Relationships
Hypothesis Constructs Predicted relationship
Result
H1 IT architecture U.S. > China Not Supported
H2 IT human resource U.S. > China Not Supported
H3 IT infrastructure U.S. > China Supported
H4 IT relationship resource U.S. < China Supported
Discussion
The results of this study suggest that the four components of IT capability are viewed
differently in two cultures: Individualism vs. Collectivism. The first difference between
the two countries involved the perceived IT architecture. The results (see Tables 3.9 and
3.10) show that IT architecture is perceived as more important in Chinese born global
firms than in the U.S. This is because even though Chinese managers are more
controlling about the release of information, they pay more attention to policies and rules.
This is reflected from their central decision-making styles.
One more surprising result is that there are no significant differences of the
perceived IT human resource between the two countries’ born global managers. This can
be explained as that entrepreneurs in China have realized the importance of not only
technological skills of IT but also managerial skills of IT.
65
Contributions, limitations and future research
Despite a large volume of literature discussing the cultural influence on IS development,
there is a scarcity of empirical research investigating how firm’s ability of deploying IT
related resources, namely the IT capability, can be viewed in different cultural
environments. Existing literature focuses more on how national culture influences IS
development at the macro level. Limited research has been conducted in investigating
specific aspects of IS development. We thus advance the literature by comparing the
perceived IT capability in two culturally different countries, China and the U.S. The
findings from this study support our argument that even though IT capability is important,
it is viewed differently in different cultures.
The findings of our study have several implications for managers in the global
marketplace, especially those who interact with Chinese business leaders. Our results
show that even though Chinese management realizes that IT is very important in the
modern business world, they are still reluctant to establish integrated information systems.
They still rely on their personal information sources and make decisions based on their
experience and intuition. As a result, those who interact with Chinese business leaders
should be sensitive to and take account of the distinctively Chinese information
management practice. On the other hand, relationship plays important roles in their
businesses. Thus, foreign counterpart should take advantage of this valuable asset in
developing IT capability.
One limitation of this study is related to the sample size in the U.S. Even though
we tried our best, we couldn’t increase our sample size to a more satisfactory level. The
unequal size of the two samples might cause some bias of the final results. Another
66
limitation of this study is about the data collection methods. We used two different way
to collect data for this study. We used on-site interviews to collect data in China, but used
mail surveys in the U.S. Although we do not believe this influenced the results, we
cannot completely discount the possibility.
This study helps explain the influence of culture on perceived IT capability in two
different countries. Even though it produced very interesting results, how much of the
variance could be attributed to culture in the study is not clear. Future study should
include more countries into the study.
Conclusion
In this study, we addressed the question of how IT capability is perceived in different
cultures. The results of this study show that U.S. firms place higher average value in
terms of IT infrastructure and IT human resources. Even though the latter does not show
significant differences between the two countries, it still reflects the fact that the U.S.
born global firms have better IT infrastructure and more advanced managerial and
technical skills. Chinese firms on the other hand, have a higher score on IT relationship
resource reflecting the importance of relationship in Chinese businesses. One interesting
finding is that Chinese born global business managers pay closer attention to the IT
architecture. This is explainable since Chinese businessmen are still using centralized
decision-making style and they are especially concerned about how information is stored
and retrieved. We hope our research inspires more interest in the cultural influence on
specific IT implementations.
67
CHAPTER FOUR
ORGANIZATIONAL CULTURE, INFORMATION TECHNOLOGY CAPABILITY, AND PERFORMANCE OF THE BORN GLOBAL FIRM
Introduction
During the past decade, increased attention has been given to the growing number of new
and young firms that choose to compete in the international marketplace (McDougall et
al., 2003). By leapfrogging some of the traditional intermediate stages of
internationalization, these firms have become significant global players themselves in a
relatively short time. And they are prime examples of “born global”. The phenomenon
of born global has been studied under different labels: “International New Ventures”
(McDougall et al., 1994), “Instant International “(Preece et al., 1999), “Global Start-ups”
(Mamis, 1989; Jolly et al., 1992), and “Born Globals” (Rennie, 1993; Knight and
Cavusgil, 1996; Madsen and Servais, 1997).
Born global firms are characterized by smaller size and reliance on cutting edge
technology in the development of relatively unique product or process innovations
(Knight and Cavusgil, 1996). Extant literature has shown that the widespread emergence
of born global firms in many nations has become an important IB phenomenon (e.g.,
Moen and Servais, 2002; Rennie, 1993). They operate internationally from an early
stage in their development (Rennie, 1993; Knight and Cavusgil, 1996; Madsen and
Servais, 1997). They have the potential to become a leading species in the ecosystem of
international trade and they might be seen to herald a more diverse international business
system in which any firm can succeed internationally (Knight and Cavusgil, 2004).
Unaided by investments already in place or markets already developed, these companies

68
have overcome two drawbacks-that of being start-ups and that of competing against
global players (Jolly et al., 1992).
How born global firms successfully handle these drawbacks in the international
markets has been the subject of much research. Oviatt and McDougall (1994) present a
framework that describes four necessary and sufficient elements for the existence of this
type of firm. Knight and Cavusgil (1996) explain the critical factors and implications
associated with their arrival. McDougall et al. (2003) empirically tested the difference
between born global firms and domestic new ventures. They found out that international
new ventures use more aggressive strategies, and they operate in more channels of
distribution than did domestic new ventures in order to survive in the international
markets. Yeoh (2000) found that global start-ups engage in greater information search in
order to compete with global players than domestic firms do. And Johnson (2004) argues
that information technology is a very important facilitating factor for the international
process of born global firms.
In summary, existing literature has focused mainly on examining why these
entrepreneurial firms are going international at such an early age and what are the factors
that influence their success in international markets. Two answers to these questions are
heavy use of information technology and unique corporate cultures (e.g. Knight and
Cavusgil, 1996; Madsen and Servais, 1997; Oviatt and McDougall, 1999). Unfortunately,
there is no research explaining the relationship between IT, organizational culture, and
firm’s performance in the international market in born global literature.
The purpose of this research, therefore, is to examine the relationship between
strategic use of information technology, organizational culture, and born global firms’
69
performance in international markets. We test the proposed relationships in both China
and the U.S. To better understand the relationships between organizational cultures, IT
capability, and firm performance better, we had in-depth interviews with three born
global firms. The remainder of this paper is organized as follows: We first summarize
the interviews and follow with review of the existing literature and relevant theory. The
resource-based view (RBV) is chosen as a theoretical foundation for this work because
we treat information technology capability as a source of a firm’s competitive advantage.
We present our conceptual models based on the literature review and interviews.
Hypotheses are then stated followed by the research methods and data analysis. We
conclude with contributions, limitations, and future research opportunities.
Introduction to the three cases
An email was sent to 12 firms requesting their participation in the email interview; three
of them agreed to participate after explaining the purpose of the study. For
confidentiality, the three firms are referred as firms A, B, and C. The email interviews
were conducted by asking the participants some open-ended questions: 1) what prompts
their firm to get into international markets at such a young age? 2) How do they describe
their corporate culture? 3) What about IT usage in their firms? How is IT used? 4) How
do they describe the relationship between IT implementation and corporate culture?
Please see Table 4.1 for the details of the cases.
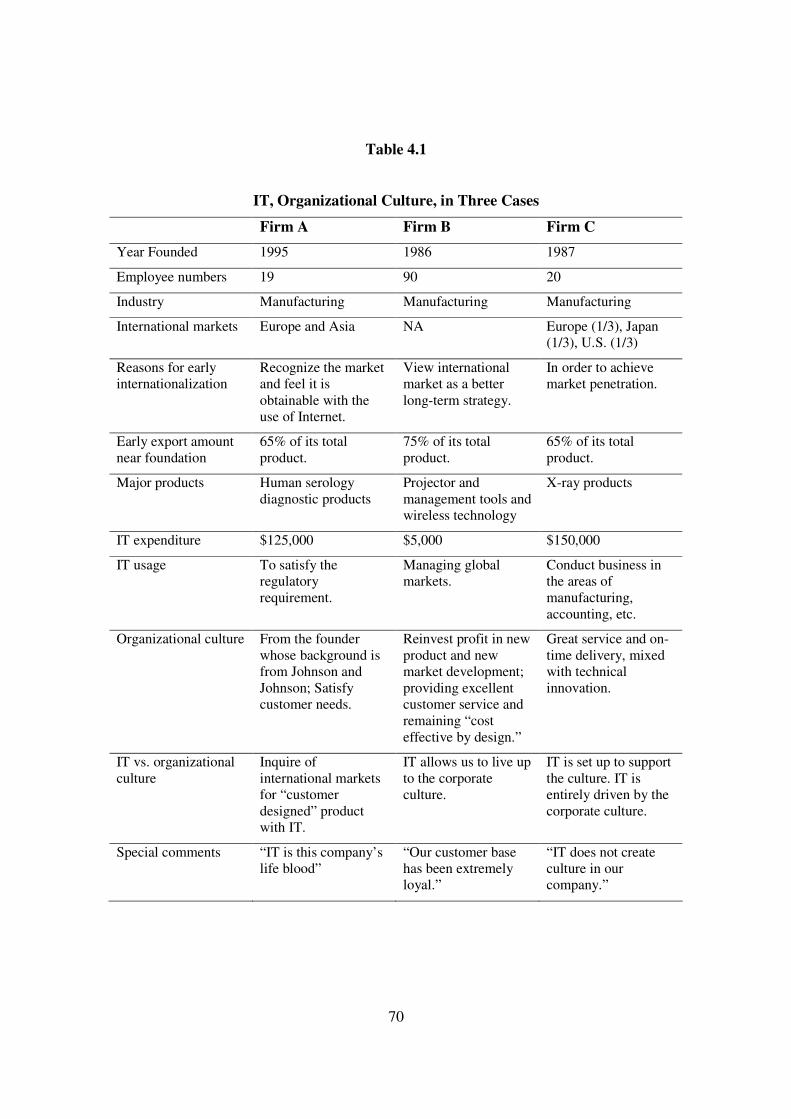
70
Table 4.1
IT, Organizational Culture, in Three Cases
Firm A Firm B Firm C
Year Founded 1995 1986 1987
Employee numbers 19 90 20
Industry Manufacturing Manufacturing Manufacturing
International markets Europe and Asia NA Europe (1/3), Japan (1/3), U.S. (1/3)
Reasons for early internationalization
Recognize the market and feel it is obtainable with the use of Internet.
View international market as a better long-term strategy.
In order to achieve market penetration.
Early export amount near foundation
65% of its total product.
75% of its total product.
65% of its total product.
Major products Human serology diagnostic products
Projector and management tools and wireless technology
X-ray products
IT expenditure $125,000 $5,000 $150,000
IT usage To satisfy the regulatory requirement.
Managing global markets.
Conduct business in the areas of manufacturing, accounting, etc.
Organizational culture From the founder whose background is from Johnson and Johnson; Satisfy customer needs.
Reinvest profit in new product and new market development; providing excellent customer service and remaining “cost effective by design.”
Great service and on- time delivery, mixed with technical innovation.
IT vs. organizational culture
Inquire of international markets for “customer designed” product with IT.
IT allows us to live up to the corporate culture.
IT is set up to support the culture. IT is entirely driven by the corporate culture.
Special comments “IT is this company’s life blood”
“Our customer base has been extremely loyal.”
“IT does not create culture in our company.”
71
Firm A was founded in 1995 in California. It develops and manufactures human
serology diagnostic products. The total employee number is 19. Recognizing that a
medical diagnostic firm has markets outside of the U.S. and that these markets are just as
obtainable as those in the U.S., firm A began an aggressive program to obtain
international business simultaneously with domestic businesses. It exported about 65%
of its product right after establishment. According to the president of firm A, it operates
in a strictly “regulated” industry. Its primary customers are “governments of each
country.” With governments consuming its products, they regulate it strictly in order to
save government money and to protect their populations. The president said without
heavy IT investment, it would not be possible for firm A as a small company to complete
all of the regulatory requirements. When a product is ordered, it is quality controlled and
entered online. When shipped, that product is tracked all the way back to its components
per regulations and if something goes wrong the complaints are gathered online and
relayed for investigations and possible recall. All of this used to take manpower but now
is done with a sophisticated IT system. Files can be put on their Web site for
international inspection and use for their own regulatory bodies. The company estimates
that for 200 products, it has more than 35,000 documents online in real time. IT is the
company’s lifeblood, said the president.
The founder of firm A describes it as a worldwide corporation. He has a
background at Johnson and Johnson and he has been trying to foster the same corporate
culture as Johnson and Johnson in firm A. It is very marketing oriented, inquiring of
international markets for “custom designed” products which meets their needs. Not to do
so would constitute a lost of opportunity, the president said. They are also very self-
72
controlled. There are no secretaries in this company and have been none for many years.
Everyone can access documentation and the availability of “the world’s library” allows a
small company like firm A to do everything that once was only possible for the large one.
Founded in 1986, firm B is a recognized projection pioneer and innovator,
producing the industry’s most comprehensive line of business and home projectors,
projector management tools, and wireless technology. It has 90 fulltime employees. It
saw the market changes and viewed international markets as a better long-term strategy
for their products. Thus, it exported 75% of its total products near the establishment of
the company.
Firm B uses IT extensively in managing global markets. It uses an external Web
site and links plus email, including digital photographs and video, as its main avenues of
communications for sales and technical support. Its instrument is designed to be
diagnosed and re-programmed via the Internet. It also uses IT in-house. It has a network
of more than 30 computers for software and firmware development, testing, and storage;
mechanical and electronic engineering; computer-controlled machine tools; inventory
management, production planning, accounting and payroll; Web site for employee
information and interoffice email; generation of sales literature and other desktop
publishing.
Firm B emphasizes on customers’ value. It uses IT to provide quick and
affordable service to customers in remote locations. IT allows it to live up to its culture
of providing excellent customer service and remaining “cost effective by design.” Firm
B is interested in making a profit through win-win interaction. In order to provide
customers with enduring and versatile products, it is willing to take risks. It is also very
73
entrepreneurial and learning oriented. Firm B learns from its experience and reinvests
profits in new product and new market development to secure the company’s future.
Firm C was founded in 1987. It mainly produces X-ray products. There are only
20 employees in this company. Most of its customers for its initial product were located
outside of the US. The ratio is 1/3 Europe, 1/3 Japan, and 1/3 U.S. About 65% of total
sales were exported near the establishment of the firm. Firm C also heavily invested in
IT. It uses IT in the areas of manufacturing, accounting, engineering documents, and
statistical analysis.
While management focused on great service and on-time delivery mixed with
technical innovation in the past, now they are changing to more of a high-quality, high-
volume manufacturing culture.
In summary, all three firms are typical born global firms. They are all
established after the 1980’s, and they started to get involved in the international markets
right after their establishment. In order to survive in the international market, they all
heavily depend on IT regardless of what industry they are in. Due to the competition and
rapid change in the international markets, these firms are learning from doing and heavily
invest in innovation. They survive by developing new products. They all emphasize
customer value. Providing good customer service and satisfying their needs are among
the most important features of their corporate culture. In summary, these three firms are
all very internationally marketing oriented, internationally entrepreneurial oriented and
organizational learning oriented.
Existing literature shows little consistent record about IT per se and firm
performance (Brynjolfsson and Hitt, 1998; Santhanam, 2003). The evidence of SMEs
74
such as born global firms that benefit directly from IT is even skimpier (Riquelme, 2002).
To explain how IT contributes to superior business performance, we take resource-based
view and treat IT-related resources as a firm’s source of competitive advantage, which, if
leveraged well, will lead to better business performance. Extant research and our case
studies also show that certain organizational cultures, e.g. international marketing
orientation, international entrepreneurial orientation, and organizational learning, are
closely related to firms’ ability to use IT. We argue that there must be direct
relationships between them. In the next section, we introduce the relevant theory and our
conceptual model.
Resource-based view of information technology
The resource-based view (RBV) started to appear in IS research in the mid-1990s (Wade
and Hulland 2004). It is based on the precept that firms competed on the basis of
resources that are heterogeneously distributed among them, which lead to observed
variability in financial performance across firms (Barney, 1991; Peteraf, 1993). Prior to
1990, most of the literature focused on the importance of information technology and its
potential to alter a wide range of strategic and industry structure variables, including cost
positions, scale economies, and bargaining power (Cash and Konsynski, 1985; Porter and
Millar, 1985; Clemons, 1986). According to the RBV, IT per se may not generate a
sustainable advantage, because it can be commoditized through competitive imitation and
acquisition (Clemons and Row, 1991). More recently, there is growing evidence that
competitive advantage often depends on the firm’s superior deployment of capabilities
(Christensen and Overdorf 2000; Bharadwaj 2000) as well as intangible assets (Hall 1997;
75
Feeny and Willcocks, 1998). Based on RBV, this advantage may result from
development of capabilities over an extended period of time that become embedded in a
company and are difficulty to trade. Alternatively, the firm may possess a capability that
is idiosyncratic to the firm. For example, an IS expert with specialized knowledge who is
loyal to the firm (Tippins and Sohi 2004).
Based on the literature review of RBV, we argue that there is a positive
relationship between IT capability and firm performance, and that IT capability is
influenced by certain organizational culture. We will study international marketing
orientation, international entrepreneurial orientation, and organizational learning in this
study. Figure 4.1 shows the conceptual model and hypothesized relationships. In this
model, IT capability is conceptualized as a multidimensional constructs consisting four
factors: IT architecture, IT human resource, IT infrastructure and IT relationship resource.
The contention of our model is that IT capability positively affects a firm’s performance
in international market (Autio, Sapienza, and Almeida, 2000; McDougall et al., 1994).
Each firm’s unique base of resource-derived capabilities drives its export performance
(Knight and Cavusgil, 2004). And the three organizational culture attributes positively
influence IT capability. Accordingly, we develop and test four hypotheses representing:
a) the relationship between international market orientation and IT capability; b) the
relationship between international entrepreneurial orientation and IT capability; c) the
relationship between organizational learning and IT capability; and, d) the relationship
between the components of IT capability and a firm’s performance in international
markets.
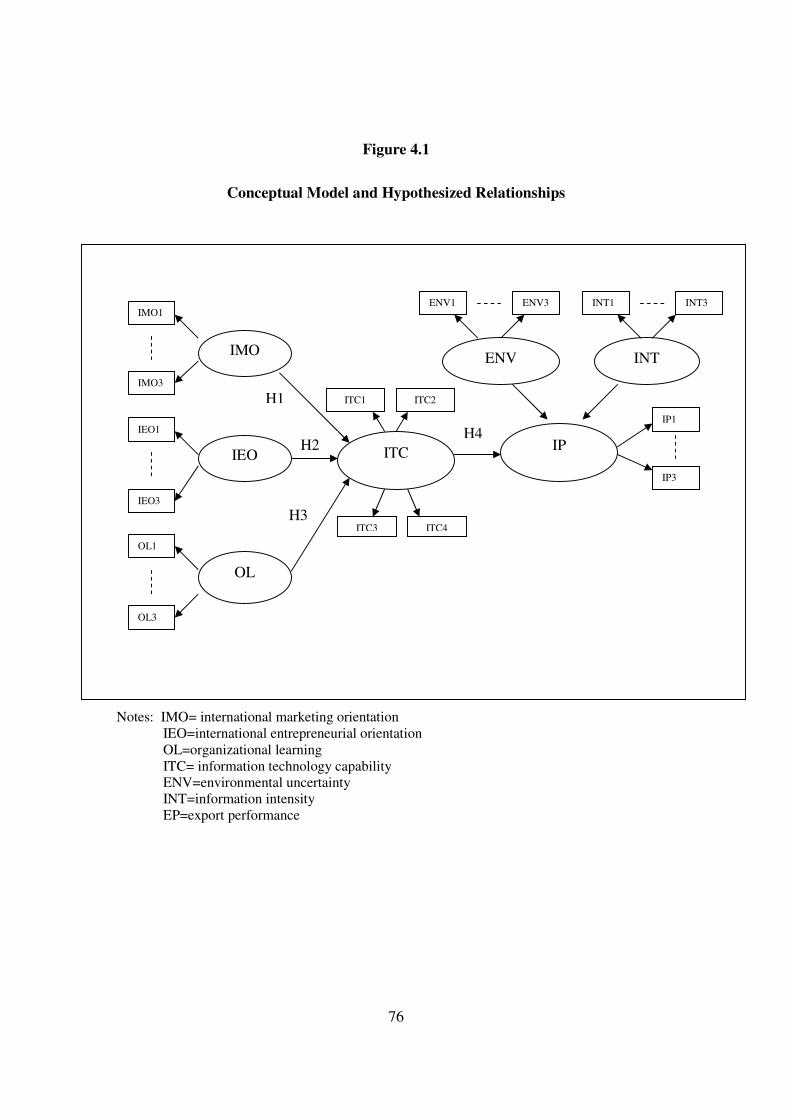
76
Figure 4.1
Conceptual Model and Hypothesized Relationships
H1
H2 H3
Notes: IMO= international marketing orientation
IEO=international entrepreneurial orientation OL=organizational learning ITC= information technology capability ENV=environmental uncertainty INT=information intensity EP=export performance
IMO
IEO
OL
ENV
IP
IMO1
R
IP1
IMO3
IEO1
IP3
IEO3
OL1
OL3
ENV1 ENV3
INT
INT1 INT3
ITC
ITC1 ITC2
ITC4 ITC3
H4
H1
H2
H3

77
Hypotheses
International marketing orientation and IT capability
Globalization is facilitating the emergence of customers who are better organized, have
more information, and are generally more demanding (Knight and Cavusgil, 2004).
Within their markets, marketing-oriented firms seek to offer products and services whose
value buyers perceive to exceed the expected value of alternative offerings. The urge to
continuously provide superior buyer value and attain superior performance drives the
firm to create and maintain a business culture that fosters the requisite business behaviors.
Superior information technology enables firms to leverage information and
communication technologies to interact more efficiently with channel members and
customers, and to obtain various other benefits (Clark, 1987; Zahra, Ireland, and Hitt,
2000). Thus, we can argue that international marketing orientation can foster information
technology capability.
H1: There is a positive relationship between international marketing orientation
and IT capability.
International entrepreneurial orientation and IT capability
Having international entrepreneurial orientation implies that these firms make the leap
into international markets because of unique entrepreneurial competences and outlook
(e.g., Autio, Sapienza, and Almeida, 2000; McDougall et al., 1994). International
entrepreneurial orientation is associated with innovativeness, managerial vision, and
proactive competitive posture in the pursuit of international markets (Covin and Slevin,
1989; Dess et al., 1997). Entrepreneurship derives from “the capability of small firms to
78
leverage resources and transform existing markets through innovation” (Steensma et al.,
2000:951). This basic innovativeness gives rise to new ideas and creative processes,
reflecting a willingness to depart from existing technologies (Lumpkin and Dess, 1996).
Entrepreneurial firms continually seek new capabilities that improve organizational
performance (e.g., Lumpkin and Dess, 1996; Miller and Friesen, 1984; Mintzberg, 1973;
Zahra, Ireland, and Hitt, 2000). We then can argue that:
H2: There is a positive relationship between international entrepreneurial
orientation and information technology capability.
Organizational learning and IT capability
Although the link between organizational learning and information technology has only
begun to be explored, two related streams of research can be identified. The first adopts
organizational learning as a means for explaining and resolving the problems of
implementing and using new information technologies in organizations. The second
stream of research develops applications of information technology to support the
processes of organizational learning and knowledge management (Robey et al., 2000).
The resource based view of IT suggests that firms can and do differentiate themselves on
the basis of their IT resources. A firm’s IT infrastructure, its human IT skills, and its
ability to leverage IT for intangible benefits serve as firm-specific resources, which in
combination create a firm-wide IT capability. While each of the individual IT resources
are complex to acquire and difficult to imitate, firms that achieve competitive advantage
through IT have also learned to combine effectively their IT resources to create an overall
IT capability. The development of such capability takes time and effort and involves
79
experiential learning (Bharadwaj, 2000). It requires a lot of teamwork to create a shared
information base and consistently solve business problems and addressing opportunities
through information technology. Organizational learning is viewed as one type of
organizational culture (Slater and Narver, 1995). It emphasizes managerial vision,
leadership, communication, and teamwork within human systems (Senge, 1990). Thus,
we can argue that:
H3: There is a positive relationship between organizational learning and IT
capability.
IT capability and export performance
From a resource-based perspective, capabilities are difficult to imitate because of
idiosyncratic development of resources that have little value outside the context of a
specific firm. This inimitability can form the basis of competitive advantage (Lei et al.,
1996; Bharadwaj 2000; Powell and Dent-Micallef, 1997). IT capability has been defined
as capability of IS function (Teo and King, 1997); the ability to underpin the pursuit of
high-value-added applications of IT and to capitalize on the external market’s ability to
deliver cost-effective IT services (Feeny and Willcocks, 1998 a, b); or firm’s ability to
use IT to support and enhance their distinctive competencies and skills in other business
functions (Prasad, Ramamurthy and Naidu; 2001), etc. Drawing from these views we
define IT capability as a firm’s ability to productively acquire, deploy, and leverage its IT
investment in combination with other resources and capabilities as well as to support and
enhance their distinctive competencies and skills in other business functions in order to
achieve business objectives through IT implementations.
80
IT capability is viewed as a multidimensional construct. Researchers view it as
containing different dimensions. In reviewing the IT literature, six models were
identified that have dimensions underlying the IT capability construct. The models are
shown in Table 1.2. They were proposed by Sabherwal and Kirs (1994, 1999); Ross,
Beath, and Goodhue (1996); Feeny and Willcocks (1998 a, b); Bharadwaj et al. (1999);
Byrd and Turner (2000), and Bharadwaj (2000). The resulting dimensions taken from
combining these models are: IT architecture, IT infrastructure, IT human resource, and IT
relationship resource.
Information technology architecture and export performance. Architecture sets
rules for distributing hardware, software, and support. These rules specify what kinds of
data to share and how to store them, where to locate servers, and how to support
applications and technologies. As IT becomes distributed throughout firms and even
beyond their boundaries, IT managers and their business partners need a clear vision of
where to locate individual technology components and responsibility for those
components. A well-defined architecture takes time and effort, and involves experiential
learning (Bharadwaj, 2000; Ross, Beath, and Goodhue, 1996). It always involves a
change of longstanding policy, logistic and overcome huge cultural clashes. Thus, it is
hard to be imitated. Flexible IT architecture is especially important for born global firms
because in order to provide quick and affordable service to customers in remote locations,
they must be able to update their information faster than their competitors. Open and
flexible IT architecture enables born global firms to reach this goal. Thus, it can be
argued that superior IT architecture is positively related to firm performance in
international markets.
81
IT human resources and export performance. This research identifies four major
dimensions of IT human resource: technical skills, managerial skills, and business
thinking and IS planning skills, and problem solving skills (Bharadwaj, 2000; Bharadwaj,
Sambamurthy, and Zmud, 1999; Ross, Beath, and Goodhue, 1996; Bassellier et al., 2000;
Feeny and Willcocks, 1998 a, b; Heijden, 2000; Byrd and Turner, 2000; Lee, Trauth, and
Farwell, 1995).
Technical IT skills include programming and systems analysis and design, as well
as competencies in emerging technologies (Bharadwaj, 2000). These skills are highly
valued to build bridges between old systems and new, to deliver data across locations and
applications, and to recognize opportunities to apply new technologies as they become
available (Ross, Beath, and Goodhue, 1996). Managerial IT skills includes effective
management of IS functions, coordination and interaction with the user community, and
project management and leadership skills (Capon and Glazer, 1987; Copeland and
McKenney, 1988; Bharadwaj, 2000). The managerial ability to coordinate the
multifaceted activities associated with the successful implementation of IT systems is a
key distinguishing factor of successful firms. Business thinking skills refers to the
management’s ability to envision how IT contributes to business value and the ability to
integrate IT planning with the firm’s business strategies (Bharadwaj, 1999). Related IS
planning skills require IS managers to be able to identify business opportunities on time
within limited budgets (Segars and Grover, 1998). Problems solving skills refer to the
distribution of analysis and solving problems to every IT staff manager (Ross, Beath, and
Goodhue, 1996).
82
Taking the RBV perspective, it is clear the all of these skills are difficult to
acquire and complex to imitate. Technical and managerial skills evolve over long periods
of time through the accumulation of experience. Managerial skills, most of the time, are
tacit and dependent on other interpersonal relationships, which may take a long time to
develop. Business thinking and planning skills also require long-term learning and
accumulation of experience.
All of the above-mentioned skills are related to strategic utilization of IT. Yet,
most of the studies conducted on strategic utilization of IT resources have concentrated
on large-sized organizations (Kyobe, 2004). However, strategic utilization of IT is
extremely important to SMEs if they want to survive in the international market. The
skills mentioned above would also help smaller firms, such as born global firms, to
provide customer services and links with suppliers (Tati, 2001), marketing capability
(Duncombe and Heeks (2001), differentiation of products/services (Eeden, 2001), better
innovation capability (Motwani et al., 1999), and reduction in costs (Duncombe and
Heeks, 2001). All of these are said to influence a firm’s performance in international
markets. So, we can argue that superior IT human resource can serve as a source of
competitive advantage and it will ultimately lead to better firm performance.
IT infrastructure and export performance. A firm’s IT infrastructure is comprised
of its computer and communication technologies and its shareable technical platforms
and databases (Ross, Beath, and Goodhue, 1996; Bharadwaj, 2000; Weill et al., 1996).
The IT platform determines the degrees of freedom a firm enjoys in its business plans. A
non-integrated IT infrastructure dominated by system incompatibilities severely restricts
an organization’s business choices. Resource-based theorists contend that physical assets,
83
such as infrastructure, can serve as sources of competitive advantage when they
outperform equivalent assets of competitors (Barney, 1991; Rumelt, 1984). Yet, it is
often argued that physical IT resources can be purchased or duplicated fairly easily by
competitors, and thus can’t serve as sources of competitive advantage. However,
building an integrated infrastructure takes time and effort, and involves experiential
learning. Neo (1988) found that the most successful IT implementers were the ones that
had previously implemented similar systems and had accumulated experience. Time
compression diseconomies make it difficult for newcomers to catch up by simply
“throwing money” at the effort and purchasing IT systems. Born global firms are big
spenders for IT infrastructure, yet only those who can build an integrative IT
infrastructure can succeed in international markets.
IT relationship resource and export performance. Creation of strong global
networks is one of the most important features for born global firms (Jolly et al., 1992).
These networks consist of relationships with suppliers, customers, and producers. And,
IT is an essential tool to maintain these relationships. Viewed from RBV, we can see that
the development of external linkage demands an extremely dedicated effort from
management because blending of business and IT experience through multi-disciplinary
teams and encouraging risk sharing and experimentation with IT will not be achieved
within a short time. Contract facilitation and monitoring skills also require many years for
highly skilled employees to develop. It is difficult to ensure that problems and conflicts
are solved fairly and promptly. A win-win situation is ideal for all firms, yet it also takes
many years to achieve. Thus, we can argue that superior IT relationship resource can
84
serve as sources of competitive advantage and will lead to better firm performance.
Hence, it can be argued:
H4: There is a positive relationship between IT capability and firm performance
in the international market.
Research context
The hypothesized relationships in this study are tested in two countries, namely China
and the U.S. The reasons that we take these two countries as study context is threefold:
First, China and the U.S. provide contrasting research contexts due to their differences in
level of economic development and national competitiveness (Foreign Policy, 2001,
2003). Second, the number of SMEs exporting to China surged by 310 percent,
compared to 129 percent for large-company exporters from 1992 to 2001, according to
the Office of Trade and Economic Analysis (2003). Among these SMEs, many can be
classified as born global firms (OECD, 1997). It is meaningful to study the born global
phenomenon in these two countries. Third, China and the U.S. are also very culturally
different (Hofstede, 1980, 1990) and cultural differences have proven to be a major
obstacle in global IS development when Asian cultures are involved (Burnson, 1989).
Research method
Sample
Our sample consists of small and medium-sized manufacturing firms established after
1980 that exported at least 25% of their total products from near their establishment date.
85
Both China and the U.S. have a large number of exporters in manufacturing industries.
We selected our target firms from a wide range of industries for two reasons. First,
information technology continues to contribute significantly to greater effectiveness in a
wide range of manufacturing industries. Second, a diverse sample increases the
generalizability of the results. In the U.S., firms were identified primarily via two
databases: the Directory of United States Exporters and CorpTech Directory of
Technology Companies. We use personal contacts identified firms in China.
Survey design and data collection
The main research instrument in this study was a questionnaire. Questionnaires were
initially developed in English and revised after discussing with 8 experts and managers
and a pretest with 38 firms. It was than translated into Chinese and back-translated by
two independent bilinguals using the method suggested by Douglas and Craig (1983).
This involves original translation, back-translation, and extensive refinements until the
translated instruments possessed both conceptual and functional equivalences (Cavusgil
and Das, 1997; Green and White, 1982; Mintu, Calantone, and Gassenheimer, 1994).
Companies were surveyed in the U.S. and China. Due to their different business
and cultural environments, this study adopts a mail survey in the U.S. and a survey that
was personally distributed.
In the U.S., the final questionnaire was sent to 682 manufacturing firms across the
country. The first wave resulted 143 invalid addresses. Following a three-wave mailing,
51 usable surveys were returned, reflecting a response rate of about 9.5%. In China, the

86
same questionnaire administrated to Chinese firms. The Chinese sample for the study
consists of the same type of firms. We contacted the top management of 240 firms to
introduce the study and ask participation in China. A total of 180 agreed to participate in
the study. We assured confidentiality to all respondents to encourage candid responses.
Our data collection efforts yielded 121 completed questionnaires (i.e., those who agreed
to participate and did participate in the interviews) for a participation rate of 66.7%
(121/180). Missing data and listwise deletion reduced the current analytic sample to 106,
for an effective participation rate of 58.9%.
Non-response bias analysis
To test whether our respondents were different from non-respondents in China, we
obtained demographic data, age of companies and employee numbers, from 28 non-
respondents (those managers who agreed to participate but failed to participate later) to
compare with those of the study participants. We found no statistically significant
differences in age of companies and employee numbers. Please refer to Table 3.3 for
details.
We used two methods to estimated non-response bias for our U.S. sample. The
first involved a comparison of differences in the mean of responses between early and
late groups. To do so, we divided the responses into early and late response groups on
the basis of their arrival dates (Armstrong and Overton, 1977). The second was a
comparison between a random and equal split of responses. To do so, we equally and
randomly split groups. The comparisons were conducted along key constructs. Such
comparison is considered a valid test of non-response bias as documented and practiced
87
by a volume of studies (e.g., Li and Calantone, 1998; Wu, Mahajan, and
Balasubramanian, 2004).
Following this approach, the completed questionnaires were initially divided into
two groups. Questionnaires received after the fourth week was considered late response.
The questionnaires were also categorized randomly into two equal groups. The means of
the major constructs in this study were compared in both groupings, and no significant
differences were found (see Tables 3.4 and 3.5 for details). Thus, we can conclude that
non-responses bias is not an issue in this study.
Measures
The samples of items used to measure key constructs in this study and the sources of the
scales are summarized in the Appendix A. While all the key constructs are measured by
using adapted scales from existing literature, IT capability is measured using the scale
developed in Chapter Two. The following section discusses all the measures in detail.
Dependent variable:
Export performance (EP) The dependent variable in this study is export performance. It
is defined as the extent to which financial and other goals are achieved as a function of
business strategies. Performance comprises expectations about the achievement of these
objectives with such measures as profitability, sales growth, market share, and general
international success. In this study, we adopted the scale of Zou et. al. (1998).
Independent variable
88
International marketing orientation (IMO) Marketing orientation refers to a culture in
which organizations strive to create superior value for their customers (and superior
performance for the business) by focusing on customer needs and long-term profitability
(Becherer et al., 2003). It has been defined as the process of generating marketing
intelligence, disseminating marketing intelligence, and responding to marketing
intelligence in order to provide superior customer value (Kohli and Jaworski, 1990;
Narver and Slater, 1990). International marketing orientation refers to a managerial
mindset that emphasizes the creation of value via key marketing elements for foreign
customers (Cavusgil and Zou, 1994). In this study, we adapted the scale from Knight and
Cavusgil (2004) to measure international marketing orientation.
International entrepreneurial orientation (IEO) International entrepreneurial orientation
reflects a firm’s overall innovativeness and proactiveness in the pursuit of international
markets (Knight and Cavusgil, 2004). Having an IEO implies that these firms make the
leap into international markets because of unique entrepreneurial competences and
outlook (e.g. Autio, Sapienza, and Almeida, 2000; McDougall et al., 1994). The scale
captures the extent to which the firm’s strategic leaders are innovative, proactive, and risk
seeking. We adopted the scale from Miller and Friesen (1984) and Knight and Cavusgil
(2004) to measure international entrepreneurial orientation in this study.
Organizational learning orientation (OL) Learning orientation is a set of organizational
values that defines the ability to create, disseminate, and utilize knowledge (Sinkular,
Baker, and Noordewier, 1997). Learning can be considered as a process whereby
89
members in an organization are stimulated to continually strive for new approaches and
acquire, as well as share, knowledge consequential to interactions with environments
(Argyris, 1991). Organizational learning orientation goes beyond one that adapts to
changes in the marketplace, but relates to knowledge questioning values that lead to
generative learning (Sinkula, Baker, and Noordewier, 1997). Thus, organizational
learning culture manifests itself in a behavioral norm that impacts the development and
processing of market information (Deshpande and Webster, 1989; Deshpande, Farley,
and Webster, 1993). To measure this construct, we adopted the scale from Hurley and
Hult (1998).
Control variable
To account for extraneous sources of variation in firm performance, we include
information intensity and environment uncertainty as two control variables in this study.
Information Intensity (INT) Information intensity is measured by the perceived extent to
which products and services of the divisions are dependent on information. Complex
products, such as the design of an aircraft, require a lot more information than those of
simple products, such as design of a table or chair. Moreover, in the operation of
complex products/services, the contents of information also increase, as customer
requirements become quite specific. In some cases, increasing information contents in the
products/services enable customers to order customized products/services, thus creating
the need to capture, store, and manipulate customer-related information (Bhatt 2000).
90
Environment Uncertainty (ENV) Environment uncertainty is operationalized in this
research in terms of technological uncertainty and environmental turbulence. Existing
research shows that the more uncertain the environment, the more information needed by
firms to deal with the environment (Feeny and Willcocks, 1998b). This study adopted
the existing scale, whose reliability and validity has been tested, from Karri (2001).
Measure Development and Validation
General measurement approach
Given the scarcity of prior empirical research, we developed the scale to measure IT
capability. We adopted existing scale to measure the rest of constructs, international
marketing orientation, international entrepreneurial orientation, organizational learning
orientation, information intensity, and environment uncertainty and export performance.
A confirmatory factor analysis by means of AMOS 4.01 (Arbuckle, 1999) was used to
assess the psychometric properties of the scales to validate the measures (Anderson and
Gerbing, 1988; Fornell and Larcker, 1981). AMOS is a new structural equation-
modeling program that has recently gained popularity among academic scholars.

91
Scale assessment
Table 4.2 provides a summary of our scale assessment. The validity of measures was
assessed by an initial CFA for each of the two groups, from China and the U.S. An
unconstrained CFA was conducted that allowed factor structure to vary across samples.
The results revealed a high level of consistency in model form and measurement across
the two groups. Factor loading for each indicator to its respective construct was
significant and all loadings are above 0.70, as can be seen in Table 4.2.
To test the equivalence of the measurement model across the Chinese and U.S.
samples, we conducted a constrained CFA. If the measurement properties are the same
for the two samples, factor structure and factor loadings should be equal. Therefore, we
set the factor structure to be invariant in the constrained model and compare this model
with an unconstrained model. The results indicated identical factor patterns. Compared
with the unconstrained model, the difference in χ2 value of 419.5 with d.f. of 219 suggests
that factor structure was indifferent across samples. The constrained model also
exhibited a good fit, the χ2 of the model was 897.8 with d.f. =421, the ratio of χ2 to d.f.
was 2.1, the CFI was 0.96, and the IFI was 0.97.
Results and discussion
Individual structure model
When the measurement issues were satisfied, the structural model in Figure 1 was tested
for each of the two groups, China and the U.S. The Chinese model converged well. Four
paths were all statistically significant, as shown in table 4.3. The χ2 was 474.76 with d.f.
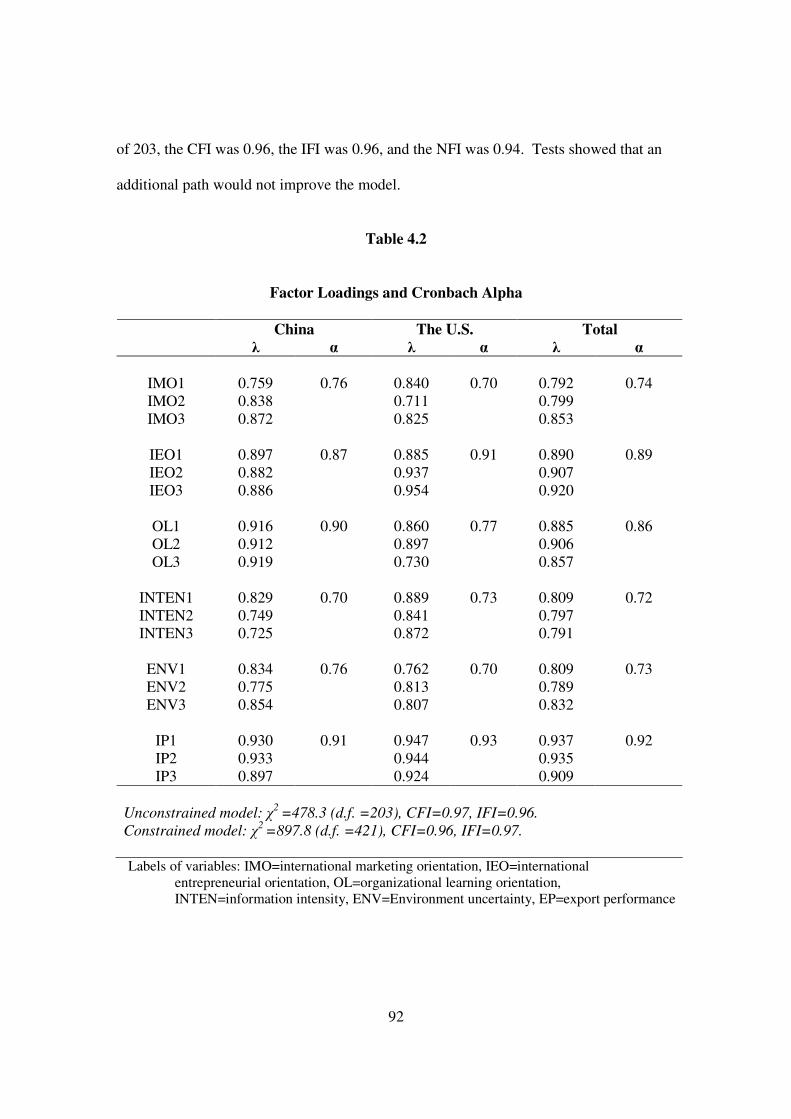
92
of 203, the CFI was 0.96, the IFI was 0.96, and the NFI was 0.94. Tests showed that an
additional path would not improve the model.
Table 4.2
Factor Loadings and Cronbach Alpha
China The U.S. Total λ α λ α λ α
IMO1 0.759 0.840 0.792 IMO2 0.838 0.711 0.799 IMO3 0.872
0.76
0.825
0.70
0.853
0.74
IEO1 0.897 0.885 0.890 IEO2 0.882 0.937 0.907 IEO3 0.886
0.87
0.954
0.91
0.920
0.89
OL1 0.916 0.860 0.885 OL2 0.912 0.897 0.906 OL3 0.919
0.90
0.730
0.77
0.857
0.86
INTEN1 0.829 0.889 0.809 INTEN2 0.749 0.841 0.797 INTEN3 0.725
0.70
0.872
0.73
0.791
0.72
ENV1 0.834 0.762 0.809 ENV2 0.775 0.813 0.789 ENV3 0.854
0.76
0.807
0.70
0.832
0.73
IP1 0.930 0.947 0.937 IP2 0.933 0.944 0.935 IP3 0.897
0.91
0.924
0.93
0.909
0.92
Unconstrained model: χ
2 =478.3 (d.f. =203), CFI=0.97, IFI=0.96.
Constrained model: χ2 =897.8 (d.f. =421), CFI=0.96, IFI=0.97.
Labels of variables: IMO=international marketing orientation, IEO=international
entrepreneurial orientation, OL=organizational learning orientation, INTEN=information intensity, ENV=Environment uncertainty, EP=export performance
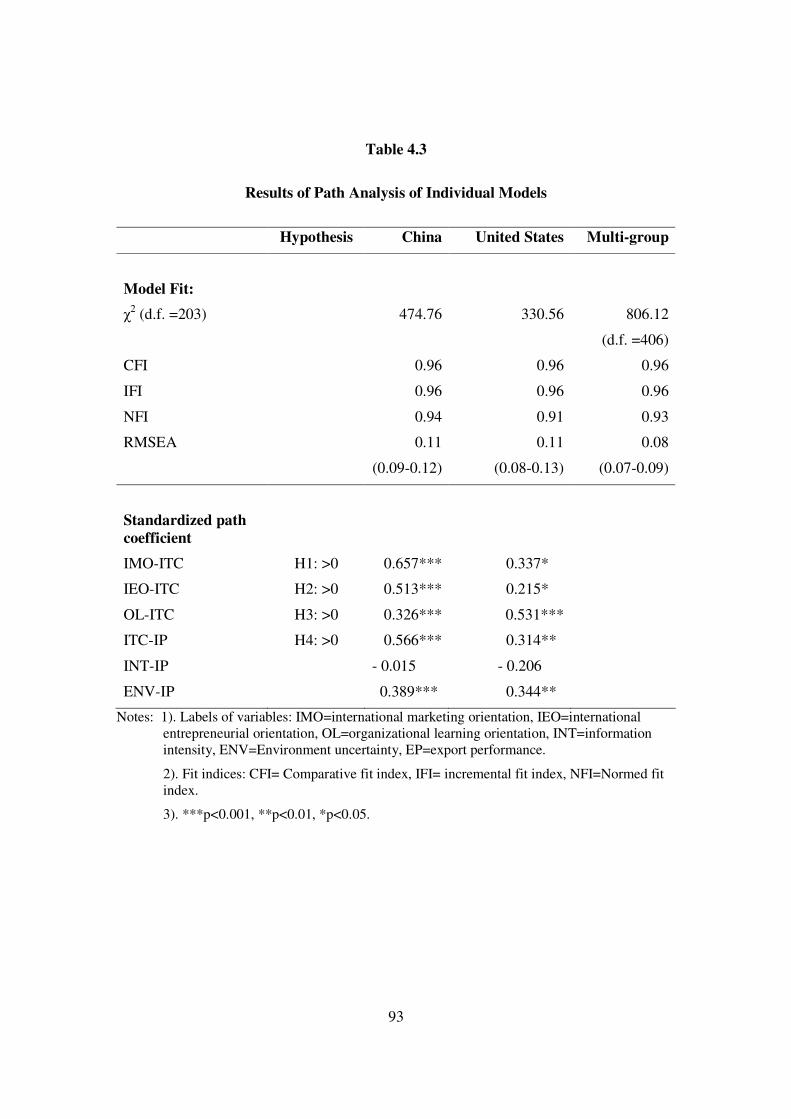
93
Table 4.3
Results of Path Analysis of Individual Models
Hypothesis China United States Multi-group
Model Fit:
χ2 (d.f. =203) 474.76 330.56 806.12
(d.f. =406)
CFI 0.96 0.96 0.96
IFI 0.96 0.96 0.96
NFI 0.94 0.91 0.93
RMSEA 0.11
(0.09-0.12)
0.11
(0.08-0.13)
0.08
(0.07-0.09)
Standardized path coefficient
IMO-ITC H1: >0 0.657*** 0.337*
IEO-ITC H2: >0 0.513*** 0.215*
OL-ITC H3: >0 0.326*** 0.531***
ITC-IP H4: >0 0.566*** 0.314**
INT-IP - 0.015 - 0.206
ENV-IP 0.389*** 0.344**
Notes: 1). Labels of variables: IMO=international marketing orientation, IEO=international entrepreneurial orientation, OL=organizational learning orientation, INT=information intensity, ENV=Environment uncertainty, EP=export performance.
2). Fit indices: CFI= Comparative fit index, IFI= incremental fit index, NFI=Normed fit index.
3). ***p<0.001, **p<0.01, *p<0.05.
94
The U.S. model also converged well. As shown in table 4.3, the four paths were also
statistically satisfied. All fit indices for the U.S. model were at an acceptable level
(χ2=330.56, d.f. =203; CFI=0.96, IFI= 0.96, NFI=0.91). Modification indexes showed
that no additional path should be released.
Examining the path coefficients across samples, we found some differences. Path
coefficients from international marketing orientation to IT capability are 0.657 for the
Chinese model, and 0.337 for the U.S. model. Path coefficients from international
entrepreneurial orientation to IT capability are 0.513 for the Chinese model, and 0.215 for
the U.S. model. And the path coefficients from organizational learning to IT capability
are 0.566 and 0.314, and from IT capability to performance is 0.566 and 0.314,
respectively.
Multigroup Model
Individual path models for Chinese and U.S. firms were different. We believe one reason
that caused the difference is in the organizational culture and the perception of IT
capability. On the basis of CFA analysis and individual path model results, we
performed a multigroup simultaneous path analysis to test for similarities and differences
in the relationships among organizational culture, IT capability and performance.
The objective of the multigroup analysis was to determine whether the path
coefficients were equal across the two groups. To test which paths were different, we
used the multiple-group comparison method of AMOS. We first constrained one path to
be equal across the two samples and then freely estimated this path. An insignificant χ2
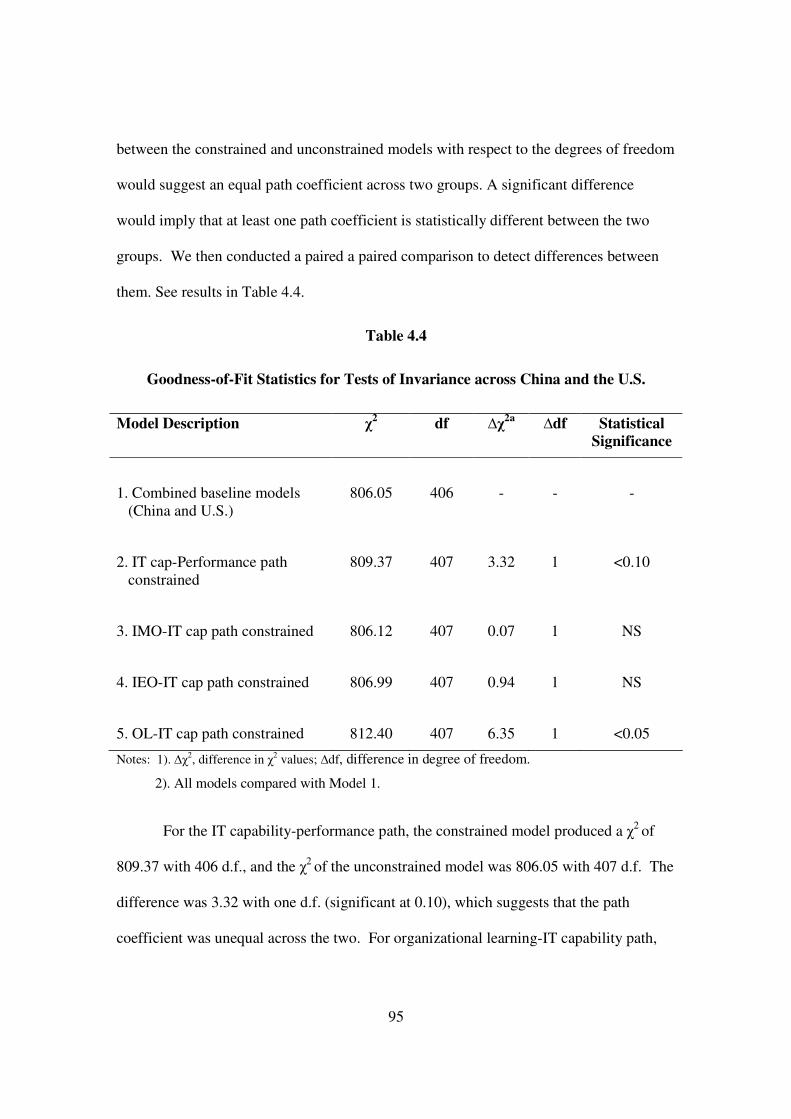
95
between the constrained and unconstrained models with respect to the degrees of freedom
would suggest an equal path coefficient across two groups. A significant difference
would imply that at least one path coefficient is statistically different between the two
groups. We then conducted a paired a paired comparison to detect differences between
them. See results in Table 4.4.
Table 4.4
Goodness-of-Fit Statistics for Tests of Invariance across China and the U.S.
Model Description χ2 df ∆χ
2a ∆df Statistical Significance
1. Combined baseline models (China and U.S.)
806.05 406 - - -
2. IT cap-Performance path constrained
809.37 407 3.32 1 <0.10
3. IMO-IT cap path constrained 806.12 407 0.07 1 NS
4. IEO-IT cap path constrained 806.99 407 0.94 1 NS
5. OL-IT cap path constrained 812.40 407 6.35 1 <0.05
Notes: 1). ∆χ2, difference in χ2 values; ∆df, difference in degree of freedom.
2). All models compared with Model 1.
For the IT capability-performance path, the constrained model produced a χ2 of
809.37 with 406 d.f., and the χ2 of the unconstrained model was 806.05 with 407 d.f. The
difference was 3.32 with one d.f. (significant at 0.10), which suggests that the path
coefficient was unequal across the two. For organizational learning-IT capability path,
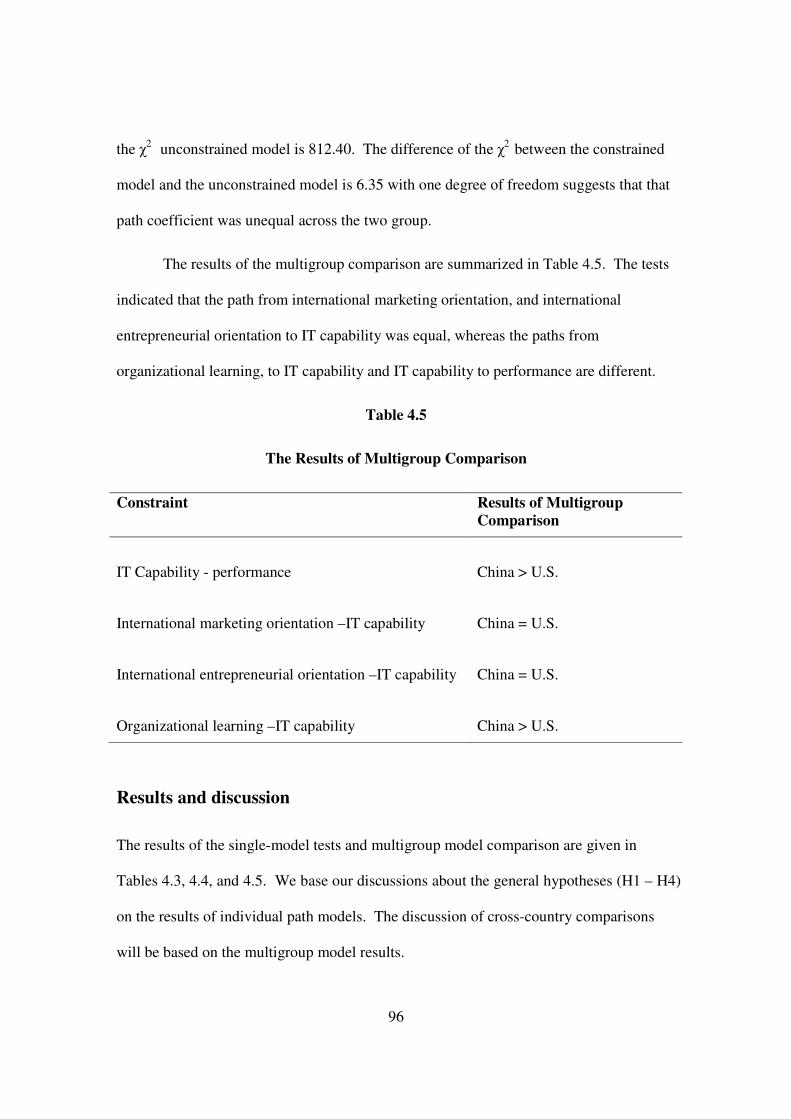
96
the χ2 unconstrained model is 812.40. The difference of the χ2 between the constrained
model and the unconstrained model is 6.35 with one degree of freedom suggests that that
path coefficient was unequal across the two group.
The results of the multigroup comparison are summarized in Table 4.5. The tests
indicated that the path from international marketing orientation, and international
entrepreneurial orientation to IT capability was equal, whereas the paths from
organizational learning, to IT capability and IT capability to performance are different.
Table 4.5
The Results of Multigroup Comparison
Constraint Results of Multigroup Comparison
IT Capability - performance China > U.S.
International marketing orientation –IT capability China = U.S.
International entrepreneurial orientation –IT capability China = U.S.
Organizational learning –IT capability China > U.S.
Results and discussion
The results of the single-model tests and multigroup model comparison are given in
Tables 4.3, 4.4, and 4.5. We base our discussions about the general hypotheses (H1 – H4)
on the results of individual path models. The discussion of cross-country comparisons
will be based on the multigroup model results.

97
General results of hypothesis testing
According to H1, the more the firm is internationally marketing oriented, the higher the
IT capability. The single model result shows that the coefficient between them is 0.621
(p<0.001) for the Chinese model; the coefficient is 0.395 (p<0.001) for the U.S. model.
Both models support H1, which confirms our expectation that IT capability is highly
influenced by a firm’s international marketing orientation. H2 states that the more the
firm is internationally entrepreneurial oriented, the higher the firm’s IT capability. The
coefficient between these two variables is 0.472 (p<0.001) in China and 0.329 (p<0.001)
in the U.S. Both the sample models supported H2. According to H3, there is a positive
relationship between firm’s organizational learning orientation and IT capability. Results
show that the coefficient is 0.384 (p<0.01) in China and 0.156 (p<0.01) in the U.S.
These results supported H3 that the more the firm is organizationally learning oriented,
the higher its IT capability. H4 states that the higher the firm’s IT capability, the better
the firm’s export performance. The coefficients are 0.553 (p<0.01) and 0.299 (p<0.10).
Thus, the last hypothesis is also supported. The results also show that environment
uncertainty significantly influences a firm’s export performance in both countries, yet
information intensity does not. The summaries of results for hypothesized relationships
are shown in Table 4.6.
Cross-national comparison
Multigroup tests revealed some differences between the two countries (refer to Tables 4.4
and 4.5). A multigroup comparison test indicated that the path coefficient from IT
capability to export performance is not equal across the two countries. It is stronger in
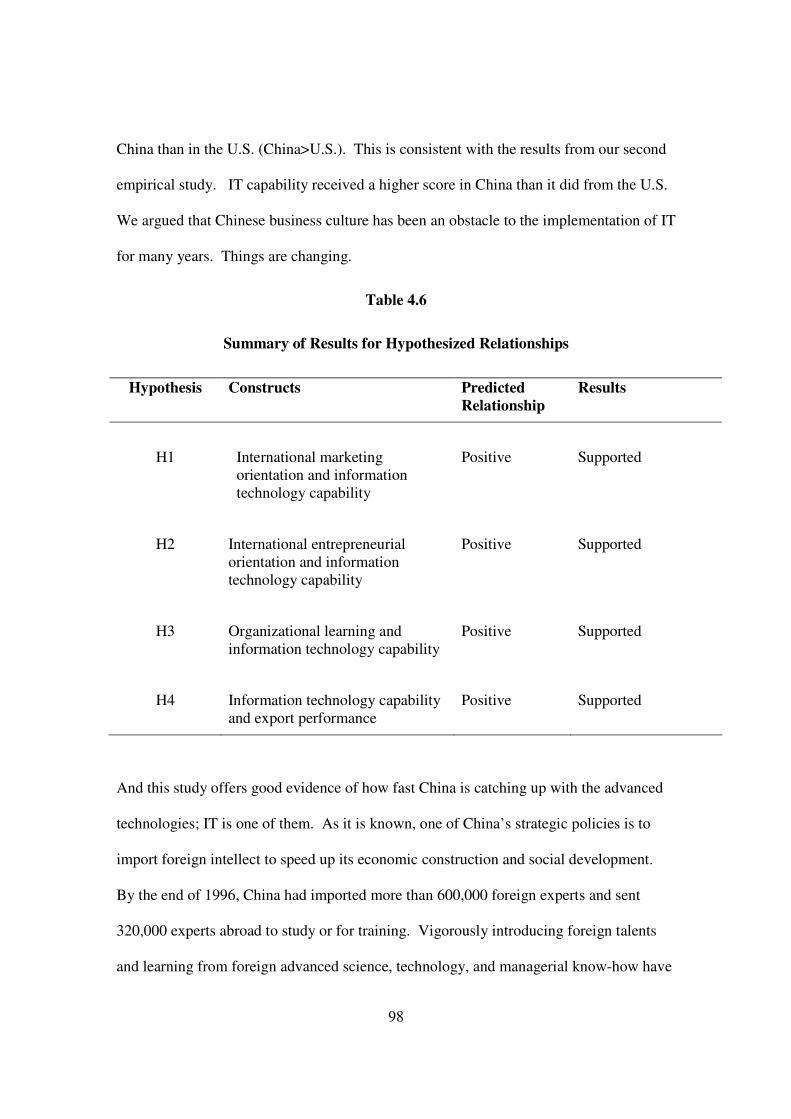
98
China than in the U.S. (China>U.S.). This is consistent with the results from our second
empirical study. IT capability received a higher score in China than it did from the U.S.
We argued that Chinese business culture has been an obstacle to the implementation of IT
for many years. Things are changing.
Table 4.6
Summary of Results for Hypothesized Relationships
Hypothesis Constructs Predicted Relationship
Results
H1 International marketing orientation and information technology capability
Positive Supported
H2 International entrepreneurial orientation and information technology capability
Positive Supported
H3 Organizational learning and information technology capability
Positive Supported
H4 Information technology capability and export performance
Positive Supported
And this study offers good evidence of how fast China is catching up with the advanced
technologies; IT is one of them. As it is known, one of China’s strategic policies is to
import foreign intellect to speed up its economic construction and social development.
By the end of 1996, China had imported more than 600,000 foreign experts and sent
320,000 experts abroad to study or for training. Vigorously introducing foreign talents
and learning from foreign advanced science, technology, and managerial know-how have
99
played an important role in China's socialist construction (Wattanavitukul, 2002). More
over, there are more and more overseas Chinese students returning to China after
graduation. The number of “sea turtles,” the nickname for returnees to China, is growing
rapidly. In 2002, 180,000 Chinese students went back home, up 47 percent from 2001
(Wattanavitukul, 2002). In summary, this paper confirmed that even though there is still
some gap between IT development in China and the U.S., the difference is becoming less
significant than before.
Another interesting finding is the difference in the link between organizational
learning orientation and IT capability. The multigroup comparison reveals that the path
coefficient from learning to IT capability is significantly different across samples. There
is a stronger relationship between learning and IT capability in China than in the U.S.
We believe this is because China is in the catching up stage with the Western
management style and thus those who learn faster and better survive in the competition.
Whereas in the U.S., even though learning is important, it is not the distinguishing factor.
Theoretical contributions
This study contributes to both international business and information systems literature
by linking organizational culture and information technology capability to born global
firms’ performance in international markets. The success of a strategy is linked to
proper development and building of core and distinctive capabilities which enable a firm
to create a competitive advantage. IT plays a significant role in supporting this goal
(Kyobe, 2004). It is often argued that effective utilization of IT or IT capability supports
100
or even shapes the strategies of many organizations (Henderson and Venkatraman, 1999).
Yet most of the studies conducted on IT capabilities have concentrated on large-sized
organizations. Little is known about IT capabilities in the born global firms. Thus, in
this research, we aim to fill the gap in existing international business and information
systems literature by examining the influence of IT capability on export performance of
born global firms. In our framework, we propose that IT capability is effective in
enhancing firm performance and international marketing orientation; international
entrepreneurial orientation and organizational learning are some organizational cultures
that foster the development of IT capability.
We believe that this research makes significant contributions to the literature on
born global. Traditional theories such as monopolistic advantage theory (Hymer, 1976,
Caves, 1982), product life cycle theory (Vernon, 1966), stage theory of
internationalization (Johanson and Vahlne, 1977), oligopolistic reaction theory
(Knickerbocker, 1973), and internalization theory (Hennart, 1982; Rugman, 1981; and
Buckley and Casson, 1976), have failed to explain the formation of born global
(McDougall et al., 1994). The application of the resource based view to explain the
phenomenon helps expand the body of knowledge in both international business and
information systems. Based on the resource based view, IT capability is treated as the
source of competitive advantage for firms and if leveraged well will lead to superior
performance in international markets. Our study contributes to the RBV by supporting
the perspective that a firm’s competitive advantage and performance are a function of
complex inimitable resource that is embedded within the organization.
101
Managerial Contributions
To business practitioners, this study illustrates the significant role of IT capability in
enhancing the export performance of born global firms. It also identifies some
antecedents of IT capability, international marketing orientation, international
entrepreneurial orientation, and organizational learning orientation. From a practical and
managerial standpoint, many important insights can be gained from this research. First,
our study demonstrates to managers that information technology cannot assure business
success. They need to develop IT capability. This means that firms need to know how to
mobilize and deploy IT-based resources in combination or co-present with other
resources and capabilities in the firms. Second, our study also found out that learning is
very important especially for Chinese firms. Those who learn faster will develop
superior IT capability faster, which in turn will bring better firm performance. Thus,
firms need to invest in learning. Only the fastest learners can gain the competitive
advantage and compete successfully (Parkhe, 1997). Third, our study also found that
organizational cultures have effects on IT capability. Certain organizational cultures,
such as international marketing orientation, international entrepreneurial orientation, and
organizational learning, give rise to specific capabilities, such as IT capability, suitable
for success in foreign markets. Managers should be proactive in creating such kinds of
organizational cultures.
Conclusion
Existing literature shows that born global firms are heavy users of IT. Yet, only a few of
them utilize their IT resources strategically. Many born global firms are still ignorant of
102
their competitive environment and do not use IT resources to facilitate the formation of
links with suppliers and customers or differentiation of products/services and innovation.
This study proposes a conceptual framework to investigate IT capability effects on firm
performance of born global firms and empirically tests the hypothesized relationships. It
confirms that firms who can build superior IT capability can have sustained competitive
advantage in the international markets. This study also contributes further to the existing
literature by identifying some organizational cultures that have positive relationships with
IT capability. They are international marketing orientation, international entrepreneurial
orientation, and organizational learning orientation.
103
CHAPTER FIVE
CONCLUSION
This dissertation is comprised of three papers relating to the influence of IT capability on
performance in the context of born global firms. The first paper reviews the literature on
IT capability and refines its definition. It also developed a scale to measure IT capability
and empirically tested its reliability and validity using primary data from the China
sample. The second paper compares the difference between perceived IT capability in
China and in the U.S. And the third paper examines how organizational culture and IT
capability together influence born global firms’ performance in international markets.
Given that born global is a relatively new phenomenon, there is a scarcity of
empirical research investigating strategic factors that influence its export performance.
IT capability as one such factor has only been studied in larger firms in the Western
culture. It has not been studied in the context of small firms such as born global firms in
Chinese culture. Thus, the three empirical papers are among the first research that
explores the effects of IT capability on born global firms. Hence, there are several
significant contributions of this dissertation: first, the examination of the development of
IT capability and validation of the scale in the context of born global firms in Chinese
culture; second, literature on international business, information systems, and
international entrepreneurship are integrated to address the effects of IT capability on
firms’ export performance; third, the application of the resource based view to explain the
phenomenon helps expand the body of knowledge in both international business and
information systems. Based on a resource based view, IT capability is treated as the
source of competitive advantage of firms which, if leveraged well, will lead to superior
104
firm performance. In the next few paragraphs, the major findings of each paper are
summarized.
The first paper in this dissertation develops a scale to measure IT capability. The
purpose of this paper is to gain a better understanding of IT capability. In this study, IT
capability is viewed as a multidimensional construct. In reviewing the IT literature, six
models were identified that have dimensions underlying the IT capability construct. The
models are shown in Table 1.2. They were proposed by Sabherwal and Kirs (1994, 1999);
Ross, Beath and Goodhue (1996); Feeny and Willcocks (1998 a, b); Bharadwaj,
Sambamurthy, and Zmud, (1999); Byrd and Turner (2000); and Bharadwaj (2000). The
resulting dimensions taken from combining these models are: IT architecture, IT
infrastructure, IT human resource, and IT relationship resource. The reliability and
validity of the scale were tested using data collected from China. Results show that the
scale is highly reliable and valid.
The second paper tested the differences of perceived IT capability in terms of the
four dimensions in two countries, China and the U.S. The reason we hypothesize that
managers in China and the U.S. view IT capability differently is due to the cultural
differences between these two countries. Existing literature shows that cross-cultural
differences limit the applicability of many management practices (Ein-Dor, Segev, and
Orgad, 1993; Westwood, 1995). Moreover these differences have particularly proven to
be major obstacles in global IS development when Asian partners are involved. Our
results show that three dimensions out of four are perceived as significantly different
between these two countries. They are IT architecture, IT infrastructure, and IT
relationship resources. The one exception is IT human resource. We argue that the
105
reason why this hypothesis is not supported is because those Chinese emerging business
managers are catching up with technical skills and managerial skills regarding IT.
The third paper included in this dissertation presents an empirical study that tests
the hypothesized relationships between organizational culture, IT capability, and export
performance of born global firms. We take the resource-based view and argue that IT
capability can be treated as a firm resource of competitive advantage that if leveraged
well will lead to better firm performance. We also identified three organizational cultures,
namely international marketing orientation, international entrepreneurial orientation, and
organizational learning, and argue that they will have a positive influence on IT
capability. We used a structure equation model with AMOS 4.01 to analyze the data.
And the results show that all the hypothesized relationships are significant.
IT capability is a very important organizational capability of born global firms. It
directly influences firms’ performance in international markets. Thus, small firms like
born global firms should pay considerable attention in developing IT capability. IT
investment itself is not enough. Born global managers should understand that IT
capability is a firm-level ability and it is related to IT policy making, IT technical and
managerial skills, IT infrastructure, and IT relationship building. All of these are equally
important in developing IT capability. Moreover, managers should help build certain
organizational cultures such as international marketing orientation, international
entrepreneurial orientation, and organizational learning because these organizational
cultures foster the development of IT capability. Even though we believe that we made
significant contributions to the literature, many issues remain to be addressed. It is hoped

106
that this research will inspire more studies on the issue of culture, capability, and born
global firms.
107
BIBLIOGRAPHY Abdul-Gader, A H. 1997. Information systems strategies for multinational companies in
Arab Gulf countries. International Journal of Information Management, 17(1): 3-13.
Adler, Nancy J, Richard Brahm, & John L Graham. 1992. Strategy implementation: A
comparison of face-to-face negotiations in the People’s Republic of china and the united states. Strategic Management Journal (1986-1998). 13(6): 449-67.
Ahuja, V. 1988. Common communications support in systems application architecture.
IBM Systems Journal, 27(3): 264-81. Aken, Bernard R., Jr. 1989. Large systems and enterprise systems architecture. IBM
Systems Journal, 28(1): 4-15. Anderson, James C. & David W. Gerbing. 1982. Some methods for respecifying
measurement models to obtain unidimensional construct measurement. JMR,
Journal of Marketing Research, 19(4): 453-61. Arbuckle, James L. 1999. AMOS 4.01. Chicago, IL: SmallWaters Corp. Argyris, Chris. 1991. Teaching Smart People How to learn. Harvard Business Review,
69(3): 99-109. Armstrong, J. Scott & Terry S. Overton. 1977. Estimating nonresponse bias in mail
surveys. Journal of marketing research, 14(3): 396-. Atuahene-Gima, Kwaku & Haiyang Li. 2002. When does trust matter? Antecedents and
contingent effects of supervisee trust on performance in selling new products in China and the United States. Journal of Marketing, 66(3): p.61 (21).
Autio, Erkko, Harry J Sapienza, & James G Almeida. 2000. Effects of age at entry,
knowledge intensity, and imitability on international growth. Academy of
Management Journal, 43(5): 909-25. Bagozzi, Richard P, Alice M Tybout, Samuel Craig, & Brian Sternthal. 1979. The
construct validity of the tripartite classification of attitudes. JMR, Journal of
Marketing Research (pre-1986). 16(1): 88-96. Barney, Jay B. 1991. Firm resources and sustained competitive advantage. Journal of
management, 17(1): 99-120. Barrett, S. & B Konsynski. 1982. Inter-organization information sharing systems. MIS
Quarterly, Special Issue.
108
Beckett, Helen. 2003. SME nation: an IT strategy for the future, Computer Weekly, Dec 2: 18
Benzie, David. 1997. Information technology capability: Is our definition wide of the
mark? IFIP: Chapman & Hall. Bernard C Y Tan, Kwok-Kee Wei, Richard T Watson, & Rita M Walczuch. 1998.
Reducing status effects with computer-mediated communication: Evidence from two distinct national cultures. Journal of Management Information Systems, 15(1): 119-42.
Bharadwaj, Anandhi S. 2000. A Resource-based perspective on information technology
capability and firm performance: An empirical investigation. MIS Quarterly, 24(1): 169-96.
Bharadwaj, Anandhi S., V. Sambamurthy, & Robert W. Zmud. 1999. IT Capabilities:
theoretical perspectives and empirical operationalization. Paper presented at 20th International Conferences on Information Systems, Charlotte, NC.
Bhatt, Ganesh D. 2000. Exploring the relationship between information technology,
infrastructure and business process re-engineering. Business Process Management
Journal, 6(2): 139-63. Blalock, Hubert M. 1974. Measurement in the social sciences. Chicago, IL: Aldine
Publishing Company. Bond, Michael Harris & Kwok Leung. 1984. The impact of cultural collectivism on
reward allocation. Journal of Personality and Social Psychology, 47(4): 793-804. Broadbent, Marianne & Peter Weill. 1997. Management by maxim: how business and IT
managers can create IT infrastructures. Sloan Management Review, 38(3): 77-83. Brynjolfsson, Erik & Lorin M. Hitt. 1998. Beyond the productivity paradox. Association
for Computing Machinery. Communications of the ACM, 41(8): 49-56. Buckley, Peter J. & Mark Casson. 1976. The Future of the Multinational Enterprise. Bucklin, Louis P. & Sanjit Sengupta. 1993. Organizing successful co-marketing alliances.
Journal of Marketing, 57(April): 32-46. Burnson, Patrick. 1989. The perils of going global, InfoWorld: 39-40 Byrd, Terry Anthony & Douglas E. Turner. 2000. Measuring the flexibility of
information technology infrastructure: Exploratory analysis of a construct. Journal of Management Information Systems, 17(1): 167-208.
109
Calantone, Roger J & Yushan Sam Zhao. 2001. Joint ventures in China: A comparative study of Japanese, Korean, and U.S. partners. Journal of International Marketing, 9(1): 1-24.
Campbell, Donald T. 1955. The information in quantitative research. American Journal
of sociology, 60(January): 339-42. Campbell, Donald T & Donald W Fiske. 1959. Convergent and discriminant validation
by the multitrait-multimethod matrix. Psychological Bulletin, 56: 81-105. Capon, D.C. & J.L. McKenney. 1988. Airline reservation systems: lessons from history.
MIS Quarterly, 12(3): 353-70. Capon, N. & R. Glazer. 1987. Marketing and technology: a strategic coalignment.
Journal of marketing, 51(3): 1-14. Carmines, E.G. & Richard A. Zeller. 1979. Reliability and Validity: Beverly Hills, CA:
Sage Publications. Cash, James I., Jr. & Benn R. Kosynski. 1985. IS redraws competitive boundaries.
Harvard Business Review, 63(2): 134-43. Caves, Richard E. 1982. Multinational enterprise and economic analysis: Cambridge;
New York: Cambridge University Press. Cavusgil, S. Tamer. 1994. A quiet revolution in Australian exporters. Marketing News,
28(11): 18-21. Cavusgil, S. Tamer & Ajay Das. 1997. Methodological Issues in empirical cross-cultural
research: A survey of the management literature and a framework. Management
International Review, 37(1): 71-96. Cavusgil, S. Tamer & Shaoming Zou. 1994. Marketing strategy-performance relationship:
an investigation of the empirical link in export market ventures. Journal of
Marketing, 58(1): 1-21. Cheney, P.H., D.P. Hale, & G.M. Kasper. 1989. Information systems professionals: skills
for the 1990s. Paper presented at Proceedings of the 22nd Annual Hawaii International Conference on Systems Science.
Chinanet. 2004. SME Firms to Lead IT Spending Recovery in 2004: Survey. Business.
[www.document] http://www.china.org.cn/english/BAT/81957.htm (accessed 1 April, 2005).
110
Chow, Chee W., Michael D. Shields, & Yoke Kai Chan. 1991. The effects of management controls and national culture on manufacturing performance: An experimental investigation. Accounting, Organizations and Society, 16(3): 209-27.
Churchill, Gilbert A. 1979. A Paradigm for developing better measures of marketing
constructs. Journal of marketing research, 16: 64-73. Clark, Charles E, Nancy C. Cavanaugh, Carol V. Brown, & V Sambamurthy. 1997.
Building change-readiness capabilities in the IS organization: Insights from the Bell Atlantic experience. MIS Quarterly, 21(4): 425-55.
Clark, K. 1987. Investment in New technology and competitive advantage. Cambridge,
MA: Ballinger Clayton M Christensen, Michael Overdorf. 2000. Meeting the challenge of disruptive
change. Harvard Business Review, 78(2): 66-77. Clemons, Eric K. 1986. Information systems for sustainable competitive advantage.
Information & Management, 11(3): 131-36. Clemons, Eric K. & Michael C. Row. 1991. Sustaining IT Advantage: The Role of
Structural Differences. MIS Quarterly, 15(3): 275-93. Clemons, Eric K. & Michael C. Row. 1991a. Sustaining IT advantage: The role of
structural differences. MIS Quarterly, 15(3): 275-92. Copeland, Duncan G. & James L. McKenney. 1988. Airline reservations systems: lessons
from history. MIS quarterly, 12(3): 353-71. Couger, J.D., G.B. Davis, D.G. Dologite, D.L. Feinstein, J.T. Gorgone, A.M. Jenkins,
G.M. Kasper, J.C. Little, H.E. Longenecker, & J.S. Valacich. 1995. IS '95: Guideline for undergraduate IS curriculum. MIS Quarterly, 19(3): 341-60.
Covin, Jeffrey G. & Dennis P. Slevin. 1989. Strategic management of small firms in
hostile and benign environments. Strategic Management Journal, (1986-1998). 10(1): 75-88.
Cronbach, Lee J. 1951. Coefficient alpha and the internal structure of tests.
Psychometrica, 16: 297-334. Daniel Robey, Huoy Min Khoo, & Carolyn Powers. 2000. Situated learning in cross-
functional virtual teams. IEEE Transactions on Professional Communication, 43(1): 51-.
111
Davenport, Thomas H. & James E. Short. 1990. The new industrial engineering: information technology and business process redesign. Sloan Management
Review, 31(4): 11-28. Dawar, Niraj, Philip M Parker, & Lydia J. Price. 1996. A cross-cultural study of
interpersonal information exchange. Journal of International Business Studies, 27(3): 497-517.
Deshpande, Rohit, John U. Farley, & Frederick E. Webster Jr. 1993. Corporate culture,
customer orientation, and innovativeness in Japaness Firms: A quadrad analysis. Journal of Marketing, 57(January): 23-37.
Deshpande, Rohit & Frederick E. Webster Jr. 1989. Organizational culture and marketing:
defining the research agenda. Journal of Marketing, 47(October): 101-10. DeVellis, Robert F. 1991. Scale development: Theory and applications. Newbury Park,
California: Sage Publications. DiRomualdo, Anthony & Vijay Gurbaxani. 1998. Strategic intent for it outsourcing.
Sloan Management Review, 39(4): 115-16. Douglas, Susan P. & C. Samuel Craig. 1983. International Marketing Research:
Englewood Cliffs, N.J.: Prentice-Hall. Earley, P. Christopher. 1993. East meets West meets Mideast: Further explorations of
collectivistic and individualistic work groups. Academy of Management Journal, 36(2): 319-49.
Earley, P. Christopher. 1994. Self or group? Cultural effects of training on self-efficacy
and performance. Administrative Science Quarterly. Ithaca, 39(1): 89-118. Eeden, S. 2001. Black businesses more positive to change: BIGNEWS. Ein-Dor, Phillip & Eli Segev. 1982. Organizational context and MIS Structure: Some
empirical evidence. MIS Quarterly: 55-67. Ein-Dor, Phillip, Eli Segev, & Moshe Orgad. 1993. The effect of national culture on IS:
Implications for international information systems. Journal of Global Information
Management, 1(1): 33-55. Eisenhardt, Kathleen M & Claudia Bird. Schoonhoven. 1996. Resource-based view of
strategic alliance formation: Strategic and social effects in entrepreneurial firms. Organization Science, 7(2): 136-51.
Eisenhardt, Kathleen M & Jeffrey A Martin. 2000. Dynamic capabilities: What are they?
Strategic Management Journal, 21: 1105-21.
112
Evers, Vanessa & Donald Day. 1997. The role of culture in interface acceptance. Paper
presented at the 6th IFIP TC13 International Conference on Human-Computer Interaction, Sydney.
Feeny, David F. & Leslie P. Willcocks. 1998 a. Core IS Capabilities for exploiting
information technology. Sloan Management Review: 9-21. Feeny, David F. & Leslie P. Willcocks. 1998 b. Re-designing the IS function around core
capabilities. Long Range Planning, 31(3): 354-67. Fertuck, L. 1992. Systems Analysis and Design: With CASE Tools, Wm. C. Brown
Communications Inc., Dubuque, Iowa. Fowler, A. 1988. Determinants of language growth in children with Down syndrome. In
L. Nadel (Ed.), The psychobiology of Down syndrome. (pp. 217-245). Cambridge: MIT Press.
Fornell, Claes & David F. Larcker. 1981. Structural equation models with unobservable
variables and measurement error: Algebra and statistics. Journal of marketing
research, 18(3): 382-88. Foreign Policy. 2001. Measuring Globalization. Foreign Policy, January/Februray (122):
56-65. Foreign Policy. 2003. Measuring Globalization: 'Who's up, Who's down?' Foreign Policy,
January/February (134): 60-72. Garfield, Monica J & Richard T. Watson. 1998. Differences in national information
infrastructure: the reflection of national cultures. Journal of strategic Information
Systems, 6: 313-37. Genevieve Bassellier, Blaize Horner Reich, & Izak Benbasat. 2001. Information
technology competence of business managers: A definition and research model. Journal of Management Information Systems, 17(4): 159-83.
Gerbing, David W. & James C. Anderson. 1988. An updated paradigm for scale
development incorporating unidimensionality and its assessment. JMR, Journal of
Marketing Research, 25(2): 186-93. Gibson, Rick. 1994. Global information technology architectures. Journal of Global
Information Management, 2(1): 28-39. Grant, R.M. 1996. Toward a knowledge-based theory of the firm. Strategic Management
Journal, 17: 109-22.
113
Green, Robert T. & Phillip D. White. 1982. Methodological considerations in cross-national consumer research. Journal of International Business Studies, 7(2): 81-87.
Gregory G Dess, G T Lumpkin, & Jeffrey E McGee. 1999. Linking corporate
entrepreneurship to strategy, structure, and process: Suggested research directions. Entrepreneurship Theory and Practice, 23(3): 85-103.
Grewal, Rajdeep, James M Comer, & Raj Mehta. 2001. An investigation into the
antecedents of organizational participation in business-to-business electronic markets. Journal of Marketing, 65(3): 17-34.
Grossman, Randall B. & Michael B. Packer. 1989. "Betting the business": strategic
programs to rebuild core information systems. Information Technology & People, 5(4): 235-44.
Hall, R. 1997. Complex systems, complex learning, and competence building. Wiley,
New York. Harris, Philip & Robert. Moran. 1987. Managing Cultural Differences, 2nd Edition //
Review: Mississauga. Harrison, Graeme L. 1992. The cross-cultural generalizability of the relation between
participation, budget emphasis and job related attitudes. Accounting,
Organizations and Society, 17(1): 1-16. Harrison, Graeme L. 1993. Reliance on accounting performance measures in superior
evaluative style - The influence of national culture and personality. Accounting,
Organizations and Society, 18(4): 319-40. Hasan, Helen & George Ditsa. 1999. The impact of culture on the adoption of IT: An
interpretive study. Journal of Global Information Management, 7(1): 5-16. Heijden, Hans V.D. 2000. Measuring IT core capabilities for electronic commerce:
results from a confirmatory factor analysis. Paper presented at Proceedings of the 21st ICIS, December.
Henderson, John C & N. Venkatraman. 1993. Strategic alignment: Leveraging
information technology for transforming organizations. IBM Systems Journal, 32(1): 4.
Hennart, Jean-François. 1982. A theory of multinational enterprise. Hofstede, Geert. 1984. The Cultural Relativity of the Quality of Life Concept. Academy
of Management. The Academy of Management Review, 9(3): 389-99.
114
Hofstede, Geert. 1980. Motivations, Leadership, and Organization: Do American Theories Apply Abroad. Organizational Dynamics. New York: Summer, 9 (1):42-
Hoffman, Thomas. 2003. Corporate execs try new ways to align IT with business units,
Computer word: 13. Hurley, Robert F. & G. Tomas M. Hult. 1998. Innovation, Market Orientation, and
Organizational Learning: An Integration and Empirical Examination. Journal of
Marketing, 62(3): 42-54. Hymer, S.H. 1976 The international operations of national firms: a study of direct foreign
investment. InformationWeek. 1999. Bond the new and the old: enterprise architecture,
InformationWeek. Inmon, W.H. 1989. Data architecture: The information paradigm. Wellesley, MA: QED
Information Sciences. Ivan P L Png, Bernard C Y Tan, & Khai-Ling Wee. 2001. Dimensions of national culture
and corporate adoption of IT infrastructure. IEEE Transactions on Engineering
Management, 48(1): 36. Jack Yeung, J.K.W., John Foster, & Gabriel O Ogunmokun. 1995. Marketing
information needs and it usage among very small businesses in Hong Kong. Journal of Management Systems, 7(1): 45-58.
Jan-Benedict E M Steenkamp, Hans Baumgartner. 1998. Assessing measurement
invariance in cross-national consumer research. Journal of Consumer Research., 25(1): 78-91.
Jan M Ulijn, Andreas Lincke, & Yunus Karakaya. 2001. Non-face-to-face international
business negotiation: How is national culture reflected in this medium? IEEE
Transactions on Professional Communication, 44(2): 126. Jenkins, A.M. 1985. Research methodologies and MIS research. North-Holland: Elsevier
Science Publisher B.V. Johanson, Jan & Jan-Erik Vahlne. 1977. The internationalization process of the firm---A
model of knowledge development and increasing foreign market commitment. Journal of International Business Studies, 4: 20-29.
Johnson, Jeffrey E. 2004. Factors influencing the early internationalization of high
technology start-ups: U.S. and U.K. evidence. Journal of International
Entrepreneurship, 2(1-2): 139-.
115
Jöreskog, Karl G. & Dag Sörbom. 1988. LISREL 7: A Guide to the program and
applications. Chicago, IL: SPSS Inc. Joseph F. Hair, Jr., Rolph E. Anderson, Ronald L. Tatham, & William C. Black. 1998.
Multivariate Data Analysis. Upper Saddle River,NJ: Prentice-Hall. Kachelmeier, Steven J & Mohamed Shehata. 1997. Internal auditing and voluntary
cooperation in firms: A cross-cultural experiment. The Accounting Review, 72(3): 407-32.
Keen, Peter G. W. 1991. Shaping the future: business design through information
technology. Boston: Harvard Business School Press. Kerlinger, Fred N. 1964. Foundations of behavioral research: New York: Holt, Reinhart,
and Winston. Kim, J. & C.W. Mueller. 1978. Introduction to Factor Analysis. Sage Publications,
Beverly Hills, CA. King, William R. & Thompson S.H. Teo. 1996. Key dimensions of facilitators and
inhibitors for the strategic use of information technology. Journal of Management
Information Systems, 12(4): 35-53. Knickerbocker, F.T. 1973. Oligopolistic reaction and the multinational enterprise:
Cambridge,MA: Harvard University Press. Knight, Gary A. & S. Tamer Cavusgil. 1996. The Born Global firm: A challenge to
traditional internationalization theory. Advances in International Marketing, 8: 11-26.
Knight, Gary A. & S. Tamer Cavusgil. 2004. Innovation, organizational capabilities, and
the born-global firm. Journal of International Business Studies, 35(2): 124-41. Kohli, Ajay K. & Bernard J. Jaworski. 1990. Market orientation: the construct, research
propositions, and managerial implications. Journal of Marketing, 54(2): 1-19. Krone, Kathleen, Mary Garrett, & Ling Chen. 1992. Managerial communication practices
in Chinese factories: A preliminary investigation. The Journal of Business
Communication, 29(3): 229-53. Kyobe, Michael E. 2004. Investigating the strategic utilization of IT resources in the
Small and Medium-sized firms of the Eastern free state province. International
Small Business Journal, 22(2): 131-58. Lacity, Mary, Leslie P. Willcocks, & David F. Feeny. 1996. The value of selective IT
sourcing. Sloan Management Review, Spring: 13-25.
116
Lambe, C. Jay, Robert E. Spekman, & Shelby D. Hunt. 2002. Alliance competence,
resources, and alliance success: conceptualization, measurement, and initial test. Journal of Academy of marketing science, 30(2): 141-58.
Langefors, Börje & Bo Sundgren. 1975. Information systems architecture: New York:
Petrocelli/Charter. Lee, Denis M S, Eileen M Trauth, & Douglas. Farwell. 1995. Critical skills and
knowledge requirements of IS professionals: A joint academic/industry investigation. MIS Quarterly, 19(3): 313-41.
Lee, Soonchul & Michael E Treacy. 1988. Information technology impacts on innovation.
R & D Management, 18(3): 257-72. Lee,G.L. & D.C. Robertson. 1989. Information technology impacts on potential power
and influence, Boston University Working Paper Series, September. Lesley R Matheson & Robert E Tarjan. 1998. Culturally induced information
impactedness: A prescription for failure in software ventures. Journal of
Management Information Systems., 15(2): 23-40. Li, Tiger & Roger J. Calantone. 1998. The impact of market knowledge competence on
new product advantage: Conceptualization and empirical examination. Journal of
marketing, 62(4): 13-29. Liu, Chang, Jack T Marchewka, & Catherina Ku. 2004. American and Taiwanese
perceptions concerning privacy, trust, and behavioral intentions in electronic commerce. Journal of Global Information Management, 12(1): 18-.
Lumpkin, G T & Gregory G. Dess. 1996. Clarifying the entrepreneurial orientation
construct and linking it to performance. Academy of Management. The Academy
of Management Review., 21(1): 135-73. Luo, Y. 2000. Dynamic capabilities in international expansion. Journal of World
Business, 35(4): 355-78. Madsen, Tage Koed & Per Servais. 1997. The internationalization of born globals: an
evolutionary process? International Business Review, 6(6): 561-83. Madsen, Tage Koed, Erik Rasmussen, & Per Servais. 2000. Differences and similarities
between born globals and other types of exporters. Advances in International
Marketing: 247-65. Makadok, Richard. 2001. Toward a synthesis of the resource-based and dynamic-
capability views of rent creation. Strategic Management Journal, 22: 387-401.
117
Mamis, R.A. 1989. Global Start-up Inc.: 38-47. Mano, M. Morris. Computer system architecture, 2d ed. NJ: Prentice Hall: Engelwood
Cliffs. Martinsons, Maris G. & Valdis Martinsons. 2002. Rethinking the value of IT, again.
Association for Computing Machinery. Communications of the ACM., 45(7): 25-. Martinsons, Maris G. & Aelita Brivins Martinsons. 1996. Conquering cultural constraints
to cultivate Chinese management creativity and innovation. The Journal of
Management Development, 15(9): 18. Martinsons, Maris G. & Robert I. Westwood. 1997. Management information systems in
the Chinese business culture: An explanatory theory. Information & Management, 32: 215-28.
McDougall, Patricia P., Benjamin M. Oviatt, & Rodney C. Shrader. 2003. A comparison
of international and domestic new ventures. Journal of International
Entrepreneurship, 1(1): 59-82. McDougall, Patricia Phillips, Scott Shane, & Benjamin M. Oviatt. 1994. Explaining the
formation of international new ventures: The limits of theories from international business research. Journal of Business Venturing, 9: 469-87.
McKenney, James L. 1995. Waves of Change: Business Evolution through information
technology. Cambridge, MA: Harvard Business School Press. McKinsey and Company. 1993. Emerging Exporters: Australia’s high value-added
manufacturing exporters. Melbourne: McKinsey and Company and the Australian manufacturing council.
Meador, J.G. 1990. Building a business information model. Journal of Information
Systems management, 7(Fall): 42-47. Miller, D. & P.H. Friesen. 1984. Organizations: A Quantum View: Prentice Hall:
Englewood Cliffs, NJ. Mintu, Alma T., Roger J. Calantone, & Jule B. Gassenheimer. 1994. Towards improving
cross-cultural research: Extending churchill's research paradigm. Journal of
international consumer marketing, 7(2): 5-23. Mintzberg, Henry. 1973. The Nature of managerial work: Harper and Row: New York. Mody, Ashoka & Carl Dahlman. 1992. Performance and potential information
technology: an international perspective. World Development, 20(12): 1703-19.

118
Moen, Oystein & Per Servais. 2002. Born global or gradual global? Examining the export
behavior of small and medium-sized enterprises. Journal of International
Marketing, 10(3): 49-72. Mohamed, Arif. 2005. AMR predicts merger of ERP apps and IT infrastructure to cut
costs, Computer Weekly. Mulligan, Paul. 1999. Differentiating service tasks for IT application An exploratory
analysis in financial services. International Journal of Service Industry
Management, 10(2): 190. Mulligan, Paul. 2002. Specification of a capability-based IT classification framework.
Information & Management, 39(8): p. 647. Nahapiet, Janine & Sumantra Ghoshal. 1998. Social capital, intellectual capital, and the
organizational advantage. Academy of Management, 23(2): 245-67. Narver, John C. & Stanley F. Slater. The Effect of a Market Orientation on Business
Profitability. Journal of Marketing. Chicago, 54(4): 20-36. Neo., Boon Siong. 1988. Factors Facilitating the Use of Information Technology for
Competitive Advantage: An Exploratory Study. Information & Management, 15(4): 191-202.
Nicholson, B. & S. Sahay. 2001. Some political and cultural issues in the globalisation of
software development: Case experience from Britain and India. Information and
Organization, 1(25-43). Nonaka, Ikujiro & Hirotaka Takeuchi. 1995. The knowledge-creating company: how
Japanese companies create the dynamics of innovation. New York: Oxford University Press.
Nunnally, Jum C. 1967. Psychometric theory. New York: McGraw Hill Book Co. Nunnally, Jum C. 1978. Psychometric Theory. New York: McGraw Hill, Inc. Nunnally, Jum C. & Ira H. Bernstein. 1994. Psychometric Theory. New York: McGraw-
Hill, Inc. O'Connor, Neale G. 1995. The influence of organizational culture on the usefulness of
budget participation by Singaporean-Chinese managers. Accounting,
Organizations and Society., 20(5): 383-404.
119
OECD. 1997. Globalization of small and medium sized enterprises. Organization for
Economic Co-operation and Development: Paris. Oviatt, Benjamin M. & Patricia Phillips McDougall. 1999. Challenges for
internationalization process theory: the case of international new ventures. Management International Review, 37: 85-99.
Oviatt, Benjamin M. & Patricia Phillips McDougall. 1994. Toward a theory of
international new ventures. Journal of International Business Studies, 25(1): 45-64.
Parkhe, Arvind. 1991. Interfirm Diversity, Organizational Learning, and Longevity.
Journal of International Business Studies, 22(4): 579-602. Parsons, Gregory L. 1983. Information technology: A new competitive weapon. Sloan
Management Review, 25(1): 3-15. Peteraf, Margaret A. 1993. The Cornerstones of competitive advantage: A resource-based
view. Strategic Management Journal (1986-1998). 14(3): 179-92. Ping, Z & D J. Grimshaw. 1992. A comparative study of the application of IT in China
and the West: Culture and the stages of growth model. International Journal of
Information Management, 12(4): 287-94. Porter, Michael E. & Victor E. Millar. 1985. How information gives you competitive
advantage. Harvard Business Review., 63(4): 149-61. Burnson, A. 1989. The perils of going global, Infoworld. Kyobe, Michael E. 2004. Investigating the Strategic Utilization of IT resources in the Small and Medium-sized firms of the Eastern Free State Province. International Small
Business Journal, 22(2): 131-58. Powell, Thomas C. & Anne Dent-Micallef. 1997. Information technology as competitive
advantage: The role of human, business, and technology resources. Strategic
Management Journal, 18(5): 375-405. Prasad, V Kanti, K Ramamurthy, & G M Naidu. 2001. The influence of Internet-
marketing integration on marketing competencies and export performance. Journal of International Marketing, 9(4): 82-111.
Preece, Stephen B, Grant Miles, & Mark C Baetz. 1999. Explaining the international
intensity and global diversity of early-stage technology-based firms. Journal of
Business Venturing, 14(3): 259-82.
120
Rajendra K Srivastava, Tasadduq A Shervani, & Liam Fahey. 1998. Market-based assets and shareholder value: A framework for analysis. Journal of Marketing, 62(1): 2-19.
Ralston, David A., David J. Gustafson, Priscilla M. Elsass, Fanny Cheung, & Robert H.
Terpstra. 1993. Differences in managerial values: A study of U.S., Hong Kong and PRC managers. Journal of International Business Studies: 249-75.
Ralston, David A., David J. Gustafson, Priscilla M. Elsass, Fanny Cheung, & Robert H.
Terpstra. 1992. Eastern Values: A Comparison of Managers in the United States, Hong Kong, and the People's Republic of China. Journal of Applied Psychology, 77(5): 664-72.
Redding, S. Gordon. 1990. The spirit of Chinese capitalism: Berlin; New York: W. de
Gruyter. Redding, S. Gordon & G. Wong. 1986. The Psychology of Chinese Organisational
Behaviour. M. H. Bond (Ed.). Hong Kong. Rennie, Michael W. 1993. Global competitiveness: born global. The McKingsey
Quarterly, Number 4: 45-52. Richard C Becherer, Diane Halstead, & Paula J Haynes. 2003. Marketing orientation in
SMEs: Effects of the internet environment. New England Journal of
Entrepreneurship, 6 (1): 13-. Riemenschneider, Cynthia K & Peter P Mykytyn Jr. 2000. What small business
executives have learned about managing information technology. Information &
Management, 37(5): 257-. Riquelme, Hernan. 2002. Commercial Internet adoption in China: comparing the
experience of small, medium and large businesses. Internet Research: Electronic
networking applications and policy, 12(3): 276-86. Rockart, John F, Michael J Earl, & Jeanne W. Ross. 1996. Eight imperatives for the new
IT organization. Sloan Management Review, 38(1): 43-56. Ross, Jeanne W, Cynthia Mathis Beath, & Dale L. Goodhue. 1996. Develop long-term
competitiveness through IT assets. Sloan Management Review, 38(1): 31-33. Ross, Jeanne W. & George Westerman. 2004. Preparing for utility computing: The role
of IT architecture and relationship management. IBM Systems Journal, 43(1): 5-19.
Rugman, Alan M. 1981. Inside the multinationals: the economics of internal markets.
121
Rumelt, Richard P. 1984. Towards a strategic theory of the firm. Prentice-Hall: Englewood Cliffs, NJ.
Sabherwal, Rajiv. 1999. The relationship between information system planning
sophistication and information system success: An empirical assessment. Decision Sciences, 30(1): 137-68.
Sabherwal, Rajiv & Peeter. Kirs. 1994. The alignment between organizational critical
success factors and information technology capability in academic institutions. Decision Sciences, 25(2): 301-31.
Sambamurthy, V. & Robert W. Zmud. 1992. Managing IT for success: The Empowering
Business Partnership. Morristown, NJ: Financial Executives Research Foundation. Santhanam, Radhika & Edward Hartono. 2003. Issues in linking information technology
capability to firm performance. MIS Quarterly, 27(1): 125-53. Seagrave, Sterling. 1995. Lords of the Rim: The invisible empire of the overseas Chinese.
New York: Bantam. Segars, Albert H & Varun Grover. 1998. Strategic information systems planning success:
An investigation of the construct and its measurement. MIS Quarterly, 22(2): 139-64.
Senge, Peter M. 1990. The Leader's New Work: Building Learning Organizations. Sloan
Management Review, 32(1): 7-24. Sethi, Vijay & William R. King. 1991. Construct measurement in information systems
research: An illustration in strategic systems. Decision Sciences, 22(3): 455-72. Shaker A Zahra, R Duane Ireland, & Michael A Hitt. 2000. International expansion by
new venture firms: International diversity, mode of market entry, technological learning, and performance. Academy of Management Journal, 43(5): 925-61.
Shore, Barry. 1998. Managing end-user challenges. Information Systems Management,
15(1): 79-84. Shore, Barry & Venky Venkatachalam. 1994. Prototyping: A metaphor for cross-cultural
transfer and implementation of IS applications. Information & Management, 27(3): 175-85.
Sinkula, James M., William E. Baker, & Thomas Noordewier. 1997. A Framework for
Market-Based Organizational Learning: Linking Values, Knowledge, and Behavior. Journal of the Academy of Marketing Science, 25(4): 305-18.
122
Slater, Stanley F & John C. Narver. 1995. Market orientation and the learning organization. Journal of Marketing., 59(3): 63-75.
Spencer, Richard A. 1985. Information architecture. Journal of Systems Management,
36(11): 34-42. Straub, D.W. 1994. The effect of culture on IT diffusion: e-mail and fax in Japan and the
U.S. Information systems Research, 5(1): 23-47. Sullivan, C.H., Jr. 1982. Rethinking computer systems architecture. Computerworld extra,
XVI: 5-10. Tan, Bernard C Y, Richard T Watson, & Kwok-Kee Wei. 1995. National culture and
group support systems: Filtering communication to dampen power differentials. European Journal of Information Systems., 4(2): 82-93.
Tati, S. 2001. Major Changes Make township Business struggle. BIGNEWS,
59(Novermber): 10-11. Teo, Thompson S.H. & William R. King. 1997. An assessment of perceptual differences
between informants in information systems research. Omega., 25(5): 557-. Teece, David J, Gary Pisano, & Amy Shuen. 1997. Dynamic capabilities and strategic
management. Strategic Management Journal, 18(7): 509-33. Tippins, Michael J. & Ravipreet S. Sohi. 2003. IT competency and firm performance: Is
organizational learning a missing link? Strategic Management Journal, 24(8): 745-61.
Torgerson, Warren S. 1967. Theory and methods of scaling. New York: Wiley. Triandis, Harry C. 1995. Individualism and collectivism. Boulder,CO: Westview Press. Triandis, Harry C, Robert Bontempo, Marcelo J Villareal, Masaaki Asai, & Nydia.
Lucca. 1988. Individualism and collectivism: Cross-cultural perspectives on self-ingroup relationships. Journal of Personality and Social Psychology, 54(2): 323.
Vaughan, Liwen Qiu. 1999. The contribution of information to business success: A
LISREL model analysis of manufacturers in Shanghai. Information Processing &
Management., 35(2): 193-209. Venkatraman, N. 1991. IT-related business reconfiguration. New York: Oxford
University Press. Vernon, Ray. 1966. International investment and international trade in the product cycle.
Quarterly Journal of Economics, 80: 190-207.
123
Vizard, M. (2000). "Your next business success will commence with an integrated IT
architecture." InforWorld 22(51): 65-. Wade, Michael & John Hulland. 2004. Review: The Resource-based view and
information systems research: Review, extension, and suggestions for future research. MIS Quarterly, 28(1): 107-43.
Walsham, Geoff. 2000. Making a world of difference: IT in a global context: John Wiley
and Sons, LTD. Watson, Richard T, Teck Hua Ho, Raman, K S. 1994. Culture: A fourth dimension of
group support systems. Association for Computing Machinery. Communications
of the ACM, 37(10): 44. Wattanavitukul, Piset. 2002. Hai Gui: The sea turtles come marching home.
[www.document] http://66.102.7.104/search?q=cache:m5k_hh84gXEJ:www.apmforum.com/columns/china19.htm+Sea+turtle+return+to+china&hl=en (accessed April 1, 2005)
Weill, Peter, Marianne Broadbent, & C. Butler. 1996. Exploring how firms view IT
infrastructure. Working Paper. Westwood, Robert I. 1995. Culture, information and MIS: The United States and East
Asia compared. Journal of Management Systems, 7(1): 29-44. Wong, S.L. 1985. The Chinese Family Firm. British Journal of Sociology, 36(1): 58-71. Wu, Fang, Vijay Mahajan, & Sridhar Balasubramanian. 2004. An analysis of E-business
adoption and its impact on business performance. Journal of Academy of
marketing science, 31(4): 425-47. Yeoh, Poh-Lin. 2000. Information acquisition activities: A study of global start-up
exporting companies. Journal of International Marketing, 8(3): 36-60. Zou, Shaoming, Charles R. Taylor, & Gregory E. Osland. 1998. The EXPERF Scale: A
cross-national generalized export performance measure. Journal of International
Marketing, 6(3): 37-58.

124
APPENDICES

125
APPENDIX A
Measures

126
Measures
IT Capability: New scale drawn from Bharadwaj, Sambamurthy, and Zmud(1999); Ross, Beath, and Goodhue (1996); Sabherwal and Kirs (1994); Grewal, Comer, and Mehta (2001); and Heijden (2000).
ITA Information Technology Architecture To what extent you agree/disagree with the following statements:
ITA1 There is consistency of IT policies throughout the enterprise. ITA2 IT and business managers consult with each other regularly on business and
technical decisions. ITA3 There is integration of business strategic planning and IT planning.
Scale items anchored by “Strongly Disagree” (1) to “Strongly Agree” (7).
ITINF Information Technology Infrastructure To what extent the following the related application is found in your
organization:
ITINF1 Appropriateness of the data architecture. ITINF2 Computer facilities for IT projects. ITINF3 Adequacy of architecture flexibility.
Scale items anchored by “Not Much” (1) to “Extensively” (7).
ITHR Information Technology Human Resource To what extent the following resources are found in your firm:
ITHR1 IT planning Capability. ITHR2 IT evaluation and control systems. ITHR3 Appropriateness of network architecture.
Scale items anchored by “Not Much” (1) to “Extensively” (7).
ITRR Information Technology Relationship Resource To what extent you agree/disagree with the following statements:
ITRR1 We have good line management sponsorship of IT initiatives. ITRR2 We have good relationship between line management and IT service providers. ITRR3 The IT department of our organization maintains close relationship with
business management. Scale items anchored by “Strongly Disagree” (1) to “Strongly Agree” (7).
127
Export performance: Scale adapted from Zou, Taylor, and Osland (1998).
IP1 The financial export performance of this firm. IP2 The strategic export performance of this firm. IP3 Satisfaction with this firm.
Scale items anchored by “Strongly Disagree” (1) to “Strongly Agree” (7).
International Marketing Orientation: Scale adapted from Knight and Cavusgil (2004).
IMO1 Marketing planning process. IMO2 Effectiveness of pricing. IMO3 Effectiveness of distribution.
Scale items anchored by “Much Worse” (1) to “Much Better” (7).
International entrepreneurial orientation: Scale adapted from Miller and Friesen (1984); and Knight and Cavusgil (2004).
IEO1 The prevailing organizational culture at our firm is conductive to active
exploration of new business opportunities abroad. IEO2 Management continuously communicates its mission to succeed in
international markets for firm employees. IEO3 Management develops human and other resources for achieving our goals in
international markets. Scale items anchored by “Strongly Disagree” (1) to “Strongly Agree” (7).
Organizational Learning Orientation: Scale adapted from Hurley and Hult (1998).
OL1 Sales growth position relative to competition. OL2 Sales growth rate. OL3 Market share relative to competition.
Scale items anchored by “Very Unsatisfactory” (1) to “Very Satisfactory” (7).
128
Information Intensity: Scale adapted from Bhatt (2000).
INT1 The firm needs a lot of product/service related information for customization. INT2 The product/service R&D requirements are high. INT3 Customers need a lot of product/service related information for ordering
products/services. Scale items anchored by “Strongly Disagree” (1) to “Strongly Agree” (7).
Environment Uncertainty: Scale adapted from Karri (2001).
ENV1 Competition in product quality. ENV2 Adapting products for overseas markets. ENV3 Finding low cost competitors.
Scale items anchored by “Not Much” (1) to “Very Much” (7).

129
APPENDIX B
COVER LETTER AND QUESTIONNAIRE
130
Date: Dear
We sincerely appreciate your precious time to assist us with this research. This
research project is conducted by International Business Institute at Washington State
University. The purpose of this research is to understand how organizational culture
influences information technology capability and affects firm’s performance in
international markets. If you would like to receive a summary of the results, please indicate this in the
questionnaire. If you are not in the right position to participate in our study, please forward the enclosed questionnaire to someone you think may be appropriate.
Please complete the questionnaire and return to us in the enclosed postage-paid
envelope as soon as possible. All responses will be held confidential, with only aggregate results used in the study.
As a small way of saying thanks and to show you our appreciation, please include
your business card along with the completed questionnaire to be entered into a lottery for
Three $100 Amazon.com gift certificates
Please contact me with questions and concerns at (509) 335-7175, College of
Business and Economics, Washington State University, Pullman, WA 99164-4851 or by email: [email protected].
Sincerely, Patriya Tansuhaj Director and Professor International Business Institute
Sincerely, Man Zhang, Ph.D. Candidate
131
QUESTIONNAIRE
INFORMATION TECHNOLOGY CAPABILITY, ORGANIZATIONAL CULTURE AND FIRM PERFORMANCE*
CONDUCTED BY: INTERNATIONAL BUSINESS INSTITUTE
COLLEGE OF BUSINESS AND ECONOMICS
World Class. Face to Face.
Summary data desired? Yes___________ No____________
*Please Read Both Sides of the Survey, Thank You!
132
Thank you for taking the time to participate in the study. This questionnaire should take about 20 minutes to complete. All responses are strictly confidential and no information
which could reveal your firm’s or your own identity will be used in any data reporting nor
will it be shared in its individual form with any outside party without your expressed
permission to do so. Q1. The firm has been established for _____________years Q2. Percentage of total sales accounted for by exports from or near the founding of the firm is about ________________% Q 3. How is your firm’s business activity divided between domestic and foreign markets?
Domestic market ____________ % Foreign market ______________% Total 100%
Q4. Please indicate the following information about your firm in the last fiscal year: (Please write down just one number between 0-100):
Percentage of total sales accounted for by exports________________% Percentage of total profits accounted for by exports______________ %
Q5. The following statements are related to the information technology architecture of your firm. Please indicate to what extent you agree/disagree with the following statements.
In our firm… a There is consistency of IT policies throughout the
enterprise. 1 2 3 4 5 6 7
b IT and business executives share a vision for how IT will support the business.
1 2 3 4 5 6 7
c IT and business managers consult with each other regularly on business and technical decisions.
1 2 3 4 5 6 7
d IT staff regularly invest in technical, business, and interpersonal training.
1 2 3 4 5 6 7
e There is consistency of IT application portfolios with business processes3.
1 2 3 4 5 6 7
f We restructure business work processes to leverage opportunities.
1 2 3 4 5 6 7
g We restructure IT work processes to leverage opportunities.
1 2 3 4 5 6 7
h There is clarity of vision regarding how IT contributes to business value
1 2 3 4 5 6 7
i There is integration of business strategic planning and IT planning
1 2 3 4 5 6 7
j Management has the ability to understand value of IT investments
1 2 3 4 5 6 7
3 IT application portfolios refer to the collection of different types of IT applications
Disagree Agree
133
Q6. The following statements are related to the information technology infrastructure of your firm. Please indicate the extent to which the related application is found in your organization.
Q7. Please choose the number that most accurately describes your firm’s performance during the last three years, relative to all other direct competitors:
Q8. Please use the scale provided to indicate the extent to which you agree or disagree with the following statements regarding the information intensity of your industry. a The firm needs a lot of product/service related
information for customization 1 2 3 4 5 6 7
b The product/service is complex to understand or use correctly
1 2 3 4 5 6 7
c The product/service R&D requirements are high 1 2 3 4 5 6 7
d The selling of product/service requires specialized knowledge
1 2 3 4 5 6 7
e Customers need a lot of product/service related information for ordering products/services
1 2 3 4 5 6 7
a Communication devices for access of remote
database
1 2 3 4 5 6 7
b Computer facilities for IT projects 1 2 3 4 5 6 7
c Computer labs for employee instruction 1 2 3 4 5 6 7
d Appropriateness of the data architectures 1 2 3 4 5 6 7
e Appropriateness of network architectures 1 2 3 4 5 6 7
f Adequacy of architecture flexibility 1 2 3 4 5 6 7
a Customer retention 1 2 3 4 5 6 7 b Sales growth 1 2 3 4 5 6 7 c Profitability 1 2 3 4 5 6 7 d Return on investment 1 2 3 4 5 6 7
Not much Extensively
Unsatisfactory Satisfactory
Disagree Agree
134
Q9. Please indicate the extent to which the following information technology human
resources are found in your firm. a Adequacy of the skill base 1 2 3 4 5 6 7
b Appropriateness of network architectures 1 2 3 4 5 6 7
c IT planning capabilities 1 2 3 4 5 6 7
d Technical support staff 1 2 3 4 5 6 7
e Effectiveness of IT planning 1 2 3 4 5 6 7
f IT project management practice 1 2 3 4 5 6 7
g Planning for security control, standards
compliance, and disaster recovery
1 2 3 4 5 6 7
h Systems development practices 1 2 3 4 5 6 7
i IT evaluation and control systems 1 2 3 4 5 6 7
Q10. The following statements are related to the relationship resources of your firm. Please indicate to what extent you agree/disagree with the following statements.
4 Line management refers to administration of the line functions of an organization; administration of activities contributing directly to the organization's output
a Our IT department ensures ownership of the business with respect to ecommerce activities
1 2 3 4 5 6 7
b The IT department of our organization maintains close relationship with business management
1 2 3 4 5 6 7
c We have multi-disciplinary teams to blend business and technology expertise
1 2 3 4 5 6 7
d We have good relationship between line management 4 and IT service providers
1 2 3 4 5 6 7
e We have good line management sponsorship of IT initiatives
1 2 3 4 5 6 7
f There is a climate that encouraging risk taking and experimentation with IT
1 2 3 4 5 6 7
g There is a climate that nurture IT project championship 1 2 3 4 5 6 7
h We have technology based links with customers 1 2 3 4 5 6 7
i We have technology based links with suppliers 1 2 3 4 5 6 7
j We use IT based entrepreneurial collaborations with external partners
1 2 3 4 5 6 7
Not at all Extensively
Disagree Agree
135
Q11. The following statements are related to the international entrepreneurial orientation of your firm. Please indicate to what extent you agree/disagree with the following statements. a Top management tends to see the world as our
firm’s marketplace 1 2 3 4 5 6 7
b The prevailing organizational culture at our firm is conductive to active exploration of new business opportunities abroad
1 2 3 4 5 6 7
c Management continuously communicates its mission to succeed in international markets to firm employees
1 2 3 4 5 6 7
d Management develops human and other resources for achieving our goals in international markets
1 2 3 4 5 6 7
e Our top management is experienced in international business
1 2 3 4 5 6 7
Q12. Most business will be some mixture of the various descriptions noted below. Indicate the degree to which these qualities reflect your firm. My firm is very: a personal. It’s like an extended family. People seem to
share a lot of themselves. 1 2 3 4 5 6 7
b dynamic and entrepreneurial. People are willing to stick their necks out and take risks.
1 2 3 4 5 6 7
c formalized and structural. Established procedures generally govern what people do.
1 2 3 4 5 6 7
d production oriented. The major concern is with getting the job done. People aren’t very personally involved.
1 2 3 4 5 6 7
The head of my firm is generally considered to be: a a mentor, sage, or a father or a mother figure. 1 2 3 4 5 6 7
b an entrepreneur, an innovator, or a risk taker. 1 2 3 4 5 6 7
c a coordinator, an organizer, or an administrator. 1 2 3 4 5 6 7
d a producer, a technician, or a hard-driver. 1 2 3 4 5 6 7
The glue that holds my firm together is: a loyalty and tradition. Commitment to this firm runs
high. 1 2 3 4 5 6 7
b a commitment to innovation and development. There is an emphasis on being first.
1 2 3 4 5 6 7
c formal rules and policies. Maintaining a smooth-running institution is important here
1 2 3 4 5 6 7
d an emphasis on tasks and goal accomplishment. A production orientation is shared.
1 2 3 4 5 6 7
Disagree Agree
Disagree
Disagree
Agree
Agree
Disagree Agree

136
My firm emphasizes: a human resources. High cohesion and morale in the firm
are important. 1 2 3 4 5 6 7
b growth and acquiring new resources. Readiness to meet new challenges is important.
1 2 3 4 5 6 7
c permanence and stability. Efficient, smooth operations are important.
1 2 3 4 5 6 7
d competitive actions and achievement. Measurable goals are important.
1 2 3 4 5 6 7
Q13. The following statements are related to the environmental uncertainty of your industry. Please indicate to what extent they are found in your industry. a Competition in product quality 1 2 3 4 5 6 7
b Differences in product standards 1 2 3 4 5 6 7
c Adapting products for overseas markets 1 2 3 4 5 6 7
d Finding new markets for our products 1 2 3 4 5 6 7
e Emerging low cost competitors 1 2 3 4 5 6 7
f Emergence of new technologies 1 2 3 4 5 6 7
Q14. Please indicate whether your firm is worse or better than your main competitors in terms of your firm’s international marketing orientation in the international markets in the following areas: a Knowledge of customers and competitors 1 2 3 4 5 6 7
b Marketing planning process 1 2 3 4 5 6 7
c Development or adaptation of the product 1 2 3 4 5 6 7
d Effectiveness of pricing 1 2 3 4 5 6 7
e Advertising effectiveness 1 2 3 4 5 6 7 f Effectiveness of distribution 1 2 3 4 5 6 7 g Image of your firm 1 2 3 4 5 6 7 h Ability to use marketing tools to differentiate this
product 1 2 3 4 5 6 7
i Control and evaluation of marketing activities 1 2 3 4 5 6 7
Not much Very much
Much worse Much better
Disagree Agree
137
Q15. Please indicate your level of satisfaction with your firm’s performance in each of the following areas. a Sales growth position relative to competition 1 2 3 4 5 6 7
b Sales growth rate 1 2 3 4 5 6 7
c Market share relative to competition 1 2 3 4 5 6 7
d Return on corporate investment 1 2 3 4 5 6 7
e Net profit position relative to competition 1 2 3 4 5 6 7
f ROI position relative to competition 1 2 3 4 5 6 7
g Return on sales 1 2 3 4 5 6 7
h Financial liquidity relative to our competition 1 2 3 4 5 6 7
Q16. Please indicate the extent to which you agree or disagree with the following statements regarding the learning orientation of your firm. a Our firm provides opportunities for individual
development other than formal training 1 2 3 4 5 6 7
b Our firm encourages managers to attend formal developmental activities such as training, professional seminars, symposia, etc.
1 2 3 4 5 6 7
c There are people at our firm who provide guidance and counsel regarding one’s career
1 2 3 4 5 6 7
d Career management is a shared responsibility of both employee and the manager
1 2 3 4 5 6 7
Q17. Please use the scale provided to indicate the extent to which you agree or disagree with the following statements regarding the export performance of your firm’s export activities Financial export performance of this export venture: a Has been very profitable 1 2 3 4 5 6 7
b Has generated a high volume of sales 1 2 3 4 5 6 7
c Has achieved rapid growth 1 2 3 4 5 6 7
Strategic export performance of this export venture: a Has improved our global competitiveness 1 2 3 4 5 6 7
b Has strengthened our strategic position 1 2 3 4 5 6 7
c Has significantly increased our global market share 1 2 3 4 5 6 7
Disagree Agree
Disagree Agree
Disagree Agree
Unsatisfactory Satisfactory
138
Satisfaction with the export venture: a The performance of this export venture has been
very satisfactory 1 2 3 4 5 6 7
b This export venture has been very successful 1 2 3 4 5 6 7
c This export venture has fully met our expectations 1 2 3 4 5 6 7
Q18. How important is it to you to:
Not
important
Very important
a. Have a job which leaves you sufficient time for your personal or family life
1 2 3 4 5 6 7
b. Have considerable freedom to adopt your own approach to the job
1 2 3 4 5 6 7
c. Have challenging work to do 1 2 3 4 5 6 7
d. Fully use your skills and abilities on the job
1 2 3 4 5 6 7
e. Have good physical working conditions 1 2 3 4 5 6 7 f. Have training opportunities 1 2 3 4 5 6 7
Q19. The number of full-time employees of your firm_______________ Q20. (1) How many years has your company been using IT for business purposes? _____________ (2)What proportion of the firm employees use IT (eg. Computer, internet) on the daily
basis to accomplish business tasks? ________________%
(3)What proportion of the work day of the typical employee is spent using IT?________% Q21. Sales revenues last year $__________________ Q22. Please estimate your firm’s IT investment last year $________________ Q23. How long have you worked for your firm? ______________years
Q24. What is your position now?________________ For how many years?___________ Thank you for your participation. Please return this completed questionnaire in the provided envelope. If you would like a summary of the results of this survey, please include your business card with this questionnaire and I will be happy to mail it to you upon completion of the study.
Disagree Agree
139
调查问卷调查问卷调查问卷调查问卷
博士论文研究课题博士论文研究课题博士论文研究课题博士论文研究课题 信息技术力量信息技术力量信息技术力量信息技术力量,,,,企业文化企业文化企业文化企业文化与企业业绩与企业业绩与企业业绩与企业业绩 研究单位研究单位研究单位研究单位:::: 国际国际国际国际商业商业商业商业研究院研究院研究院研究院 经济商业学院经济商业学院经济商业学院经济商业学院 华盛顿州立大学华盛顿州立大学华盛顿州立大学华盛顿州立大学 World Class. Face to Face.
140
博士论文研究课题博士论文研究课题博士论文研究课题博士论文研究课题 感谢您抽出时间参与这项调查。完成这份问卷大概需要 20分钟。所有回收的问卷将严格保密,未经您的许可,任何有可能泄漏贵公司或您本人身份的信息都不会在任何数据报告中使用,也不会以其个体的形式泄露给任何其他组织。 第一部分第一部分第一部分第一部分 Q1. Q1. Q1. Q1. 贵公司名称贵公司名称贵公司名称贵公司名称:________________________________:________________________________:________________________________:________________________________ Q2. Q2. Q2. Q2. 联系地址联系地址联系地址联系地址: ________________________________________________________________: ________________________________________________________________: ________________________________________________________________: ________________________________________________________________ _____________________________________ _____________________________________ _____________________________________ ________________________________________________________________ ___________________________ ___________________________ ___________________________ Q3. Q3. Q3. Q3. 贵公司所从事的行业贵公司所从事的行业贵公司所从事的行业贵公司所从事的行业________________________________________________________________________________ Q4. Q4. Q4. Q4. 贵公司主要出口产品贵公司主要出口产品贵公司主要出口产品贵公司主要出口产品 1).___________________________1).___________________________1).___________________________1).___________________________ 2).___________________________2).___________________________2).___________________________2).___________________________ 3).___________________________3).___________________________3).___________________________3).___________________________ 4).___________________________4).___________________________4).___________________________4).___________________________ Q5. Q5. Q5. Q5. 问卷回答人联系方式问卷回答人联系方式问卷回答人联系方式问卷回答人联系方式: : : : 电话电话电话电话____________________________________________________________________________________________或或或或 email___email___email___email_______________________________________________________________________________
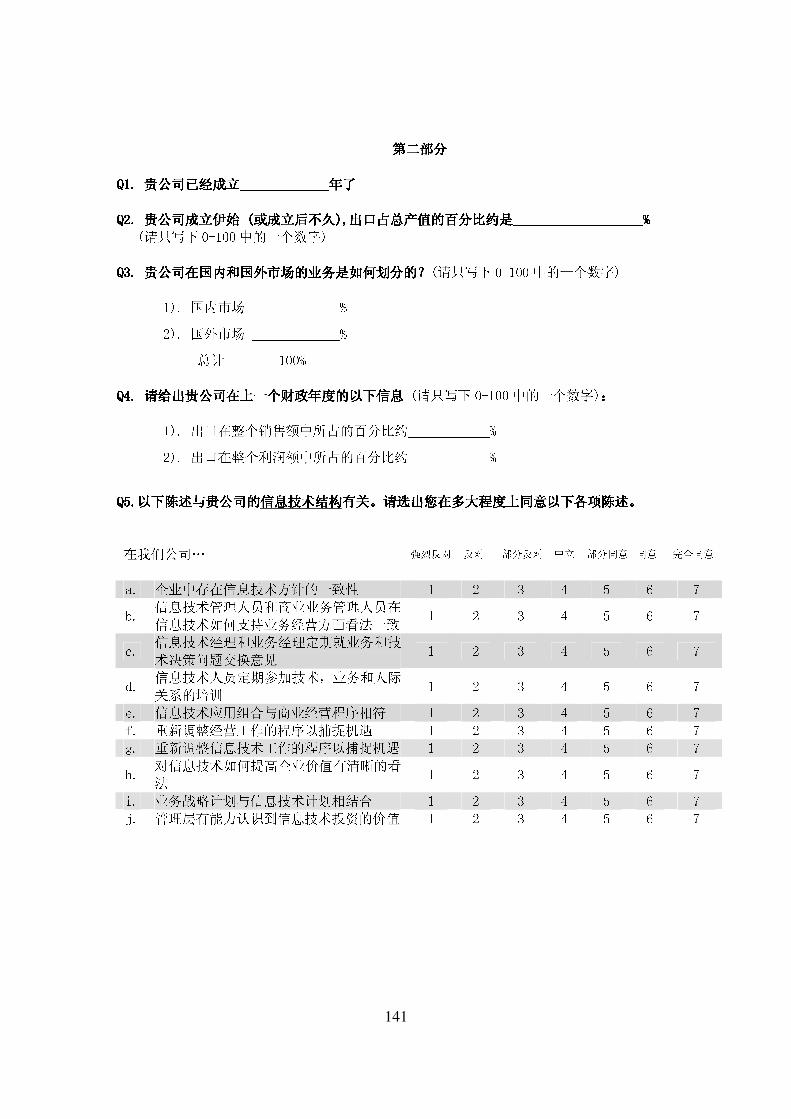
141
第二部分第二部分第二部分第二部分 QQQQ1111. . . . 贵公司已经成立贵公司已经成立贵公司已经成立贵公司已经成立____________________________________________________年了年了年了年了 Q2. Q2. Q2. Q2. 贵贵贵贵公司成立伊始公司成立伊始公司成立伊始公司成立伊始 ( ( ( (或成立后不久或成立后不久或成立后不久或成立后不久),),),),出口占总产值的百分比约是出口占总产值的百分比约是出口占总产值的百分比约是出口占总产值的百分比约是___________________%___________________%___________________%___________________% (请只写下 0-100 中的一个数字) QQQQ3333. . . . 贵贵贵贵公司在国内和国外市场的业务是如何划分的公司在国内和国外市场的业务是如何划分的公司在国内和国外市场的业务是如何划分的公司在国内和国外市场的业务是如何划分的????(请只写下 0-100 中的一个数字) 1). 国内市场 _____________% 2). 国外市场 _____________% 总计 100% QQQQ4444. . . . 请给请给请给请给出出出出贵贵贵贵公司在上一个财政年度的以下信息公司在上一个财政年度的以下信息公司在上一个财政年度的以下信息公司在上一个财政年度的以下信息 (请只写下 0-100 中的一个数字):::: 1). 出口在整个销售额中所占的百分比约____________% 2). 出口在整个利润额中所占的百分比约____________% QQQQ5555....以下陈述与贵公司的以下陈述与贵公司的以下陈述与贵公司的以下陈述与贵公司的信息技术结构信息技术结构信息技术结构信息技术结构有关有关有关有关。。。。请选出您在多大程度上同意以下各项陈述请选出您在多大程度上同意以下各项陈述请选出您在多大程度上同意以下各项陈述请选出您在多大程度上同意以下各项陈述。。。。 在我们公司… 强烈反对 反对 部分反对 中立 部分同意 同意 完全同意 a. 企业中存在信息技术方针的一致性 1 2 3 4 5 6 7 b. 信息技术管理人员和商业业务管理人员在信息技术如何支持业务经营方面看法一致 1 2 3 4 5 6 7 c. 信息技术经理和业务经理定期就业务和技术决策问题交换意见 1 2 3 4 5 6 7 d. 信息技术人员定期参加技术,业务和人际关系的培训 1 2 3 4 5 6 7 e. 信息技术应用组合与商业经营程序相符 1 2 3 4 5 6 7 f. 重新调整经营工作的程序以捕捉机遇 1 2 3 4 5 6 7 g. 重新调整信息技术工作的程序以捕捉机遇 1 2 3 4 5 6 7 h. 对信息技术如何提高企业价值有清晰的看法 1 2 3 4 5 6 7 i. 业务战略计划与信息技术计划相结合 1 2 3 4 5 6 7 j. 管理层有能力认识到信息技术投资的价值 1 2 3 4 5 6 7
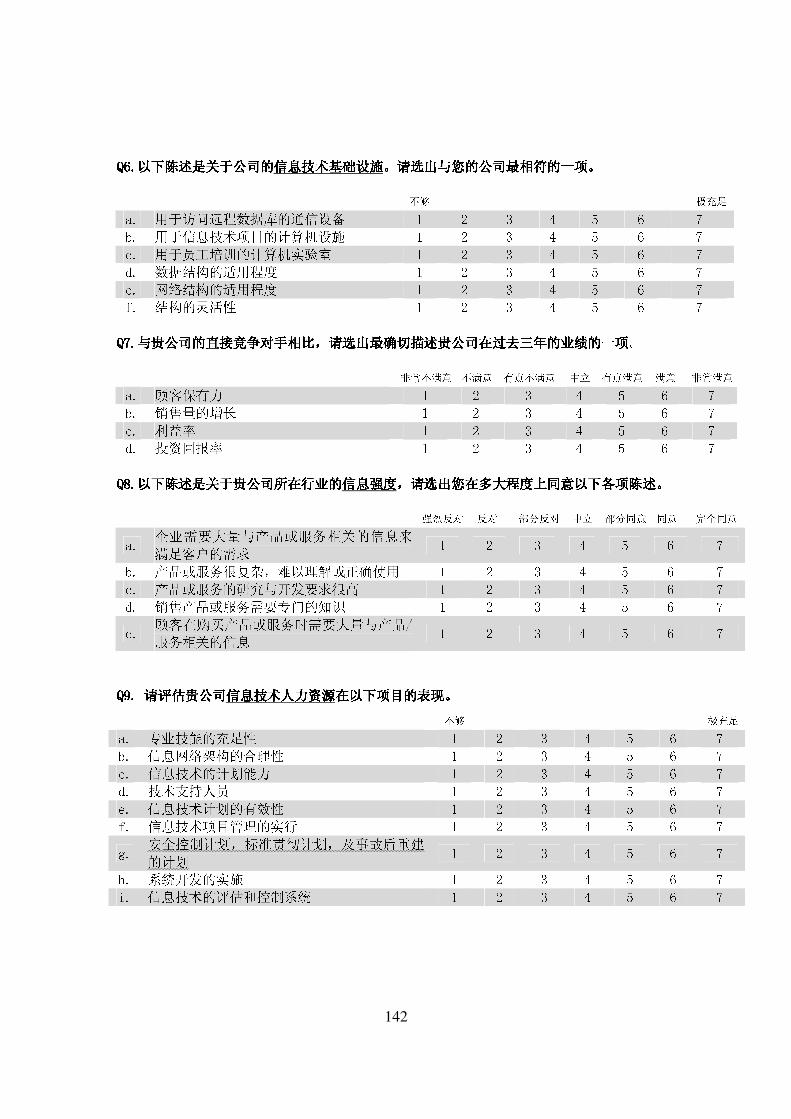
142
QQQQ6666....以下陈述是关于公司的以下陈述是关于公司的以下陈述是关于公司的以下陈述是关于公司的信息技术基础设施信息技术基础设施信息技术基础设施信息技术基础设施。。。。请选出与您的公司最相符的一项请选出与您的公司最相符的一项请选出与您的公司最相符的一项请选出与您的公司最相符的一项。。。。 不够 极充足 a. 用于访问远程数据库的通信设备 1 2 3 4 5 6 7 b. 用于信息技术项目的计算机设施 1 2 3 4 5 6 7 c. 用于员工培训的计算机实验室 1 2 3 4 5 6 7 d. 数据结构的适用程度 1 2 3 4 5 6 7 e. 网络结构的适用程度 1 2 3 4 5 6 7 f. 结构的灵活性 1 2 3 4 5 6 7 QQQQ7777....与贵公司的直接竞争对手相比与贵公司的直接竞争对手相比与贵公司的直接竞争对手相比与贵公司的直接竞争对手相比,,,,请选出最确切描述贵公司在过去三年的业绩的一项请选出最确切描述贵公司在过去三年的业绩的一项请选出最确切描述贵公司在过去三年的业绩的一项请选出最确切描述贵公司在过去三年的业绩的一项。 非常不满意 不满意 有点不满意 中立 有点满意 满意 非常满意 a. 顾客保有力 1 2 3 4 5 6 7 b. 销售量的增长 1 2 3 4 5 6 7 c. 利益率 1 2 3 4 5 6 7 d. 投资回报率 1 2 3 4 5 6 7 QQQQ8888....以下陈述是关于贵公司以下陈述是关于贵公司以下陈述是关于贵公司以下陈述是关于贵公司所在行业所在行业所在行业所在行业的的的的信息信息信息信息强度强度强度强度,,,,请选出您在多大程度上同意以下各项陈述请选出您在多大程度上同意以下各项陈述请选出您在多大程度上同意以下各项陈述请选出您在多大程度上同意以下各项陈述。。。。 强烈反对 反对 部分反对 中立 部分同意 同意 完全同意 a. 企业需要大量与产品或服务相关的信息来满足客户的需求 1 2 3 4 5 6 7 b. 产品或服务很复杂,难以理解或正确使用 1 2 3 4 5 6 7 c. 产品或服务的研究与开发要求很高 1 2 3 4 5 6 7 d. 销售产品或服务需要专门的知识 1 2 3 4 5 6 7 e. 顾客在购买产品或服务时需要大量与产品/服务相关的信息 1 2 3 4 5 6 7 QQQQ9999. . . . 请请请请评估贵公司评估贵公司评估贵公司评估贵公司信息技术人力资源信息技术人力资源信息技术人力资源信息技术人力资源在以下项目的表现在以下项目的表现在以下项目的表现在以下项目的表现。。。。
不够 极充足 a. 专业技能的充足性 1 2 3 4 5 6 7 b. 信息网络架构的合理性 1 2 3 4 5 6 7 c. 信息技术的计划能力 1 2 3 4 5 6 7 d. 技术支持人员 1 2 3 4 5 6 7 e. 信息技术计划的有效性 1 2 3 4 5 6 7 f. 信息技术项目管理的实行 1 2 3 4 5 6 7 g. 安全控制计划,标准贯彻计划,及事故后重建的计划 1 2 3 4 5 6 7 h. 系统开发的实施 1 2 3 4 5 6 7 i. 信息技术的评估和控制系统 1 2 3 4 5 6 7
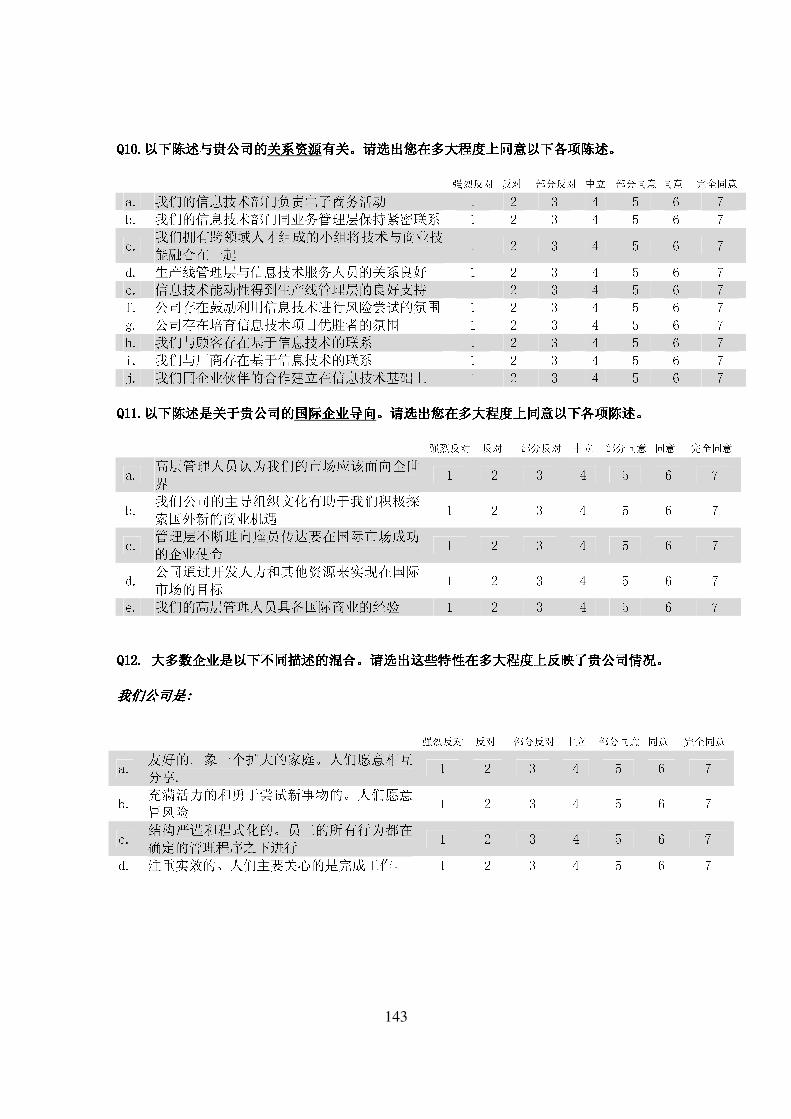
143
QQQQ10101010....以下陈述与贵公司的以下陈述与贵公司的以下陈述与贵公司的以下陈述与贵公司的关系资源关系资源关系资源关系资源有关有关有关有关。。。。请选出您在多大程度上同意以下各项陈述请选出您在多大程度上同意以下各项陈述请选出您在多大程度上同意以下各项陈述请选出您在多大程度上同意以下各项陈述。。。。 强烈反对 反对 部分反对 中立 部分同意 同意 完全同意 a. 我们的信息技术部门负责电子商务活动 1 2 3 4 5 6 7 b. 我们的信息技术部门同业务管理层保持紧密联系 1 2 3 4 5 6 7 c. 我们拥有跨领域人才组成的小组将技术与商业技能融合在一起 1 2 3 4 5 6 7 d. 生产线管理层与信息技术服务人员的关系良好 1 2 3 4 5 6 7 e. 信息技术能动性得到生产线管理层的良好支持 1 2 3 4 5 6 7 f. 公司存在鼓励利用信息技术进行风险尝试的氛围 1 2 3 4 5 6 7 g. 公司存在培育信息技术项目优胜者的氛围 1 2 3 4 5 6 7 h. 我们与顾客存在基于信息技术的联系 1 2 3 4 5 6 7 i. 我们与厂商存在基于信息技术的联系 1 2 3 4 5 6 7 j. 我们同企业伙伴的合作建立在信息技术基础上 1 2 3 4 5 6 7 QQQQ11111111....以下陈述是关于贵公司的以下陈述是关于贵公司的以下陈述是关于贵公司的以下陈述是关于贵公司的国际企业国际企业国际企业国际企业导向导向导向导向。。。。请选出您在多大程度上同意以下各项陈述请选出您在多大程度上同意以下各项陈述请选出您在多大程度上同意以下各项陈述请选出您在多大程度上同意以下各项陈述。。。。 强烈反对 反对 部分反对 中立 部分同意 同意 完全同意 a. 高层管理人员认为我们的市场应该面向全世界 1 2 3 4 5 6 7 b. 我们公司的主导组织文化有助于我们积极探索国外新的商业机遇 1 2 3 4 5 6 7 c. 管理层不断地向雇员传达要在国际市场成功的企业使命 1 2 3 4 5 6 7 d. 公司通过开发人力和其他资源来实现在国际市场的目标 1 2 3 4 5 6 7 e. 我们的高层管理人员具备国际商业的经验 1 2 3 4 5 6 7 QQQQ12121212. . . . 大多数企业是以下不同描述的混合大多数企业是以下不同描述的混合大多数企业是以下不同描述的混合大多数企业是以下不同描述的混合。。。。请选出这些特性在多大程度上反映了贵公司情况请选出这些特性在多大程度上反映了贵公司情况请选出这些特性在多大程度上反映了贵公司情况请选出这些特性在多大程度上反映了贵公司情况。。。。 我们公司我们公司我们公司我们公司是是是是:::: 强烈反对 反对 部分反对 中立 部分同意 同意 完全同意 a. 友好的. 象一个扩大的家庭。人们愿意相互分享. 1 2 3 4 5 6 7 b. 充满活力的和勇于尝试新事物的。人们愿意冒风险 1 2 3 4 5 6 7 c. 结构严谨和程式化的。员工的所有行为都在确定的管理程序之下进行 1 2 3 4 5 6 7 d. 注重实效的。人们主要关心的是完成工作。 1 2 3 4 5 6 7
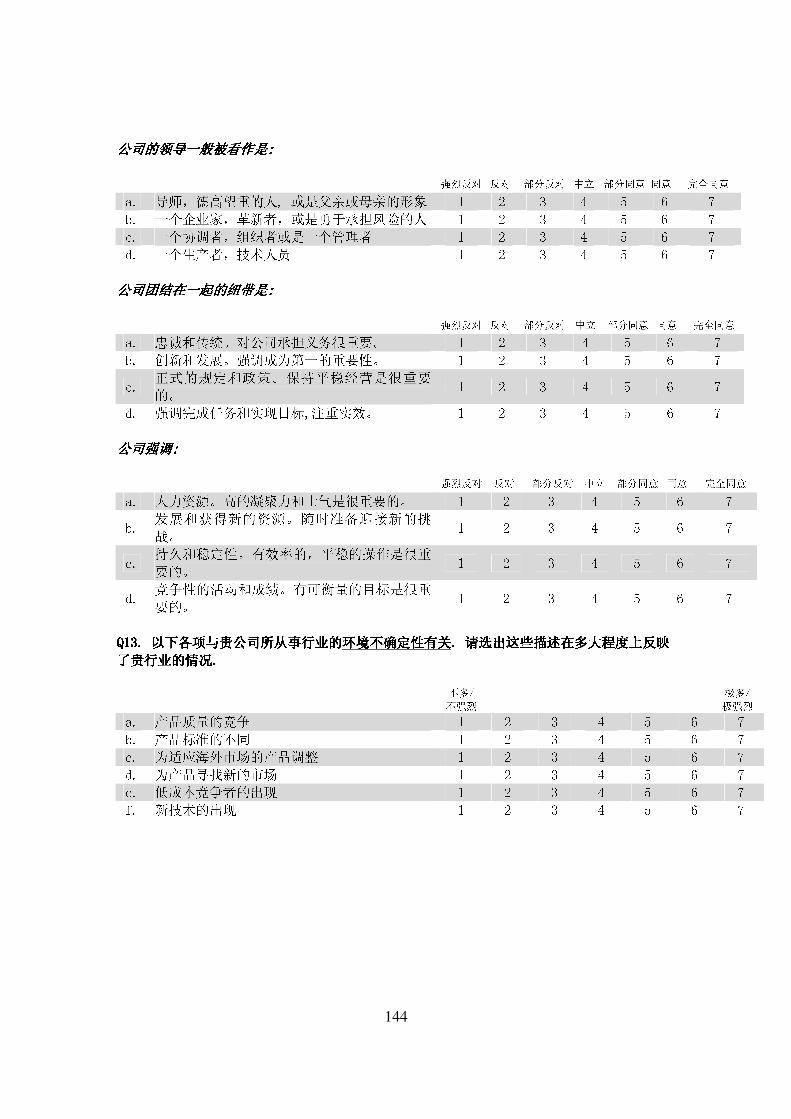
144
公司的公司的公司的公司的领导领导领导领导一般被看作是一般被看作是一般被看作是一般被看作是:::: 强烈反对 反对 部分反对 中立 部分同意 同意 完全同意 a. 导师,德高望重的人, 或是父亲或母亲的形象 1 2 3 4 5 6 7 b. 一个企业家,革新者,或是勇于承担风险的人 1 2 3 4 5 6 7 c. 一个协调者,组织者或是一个管理者 1 2 3 4 5 6 7 d. 一个生产者,技术人员 1 2 3 4 5 6 7 公司团结在一起的纽带是公司团结在一起的纽带是公司团结在一起的纽带是公司团结在一起的纽带是:::: 强烈反对 反对 部分反对 中立 部分同意 同意 完全同意 a. 忠诚和传统。对公司承担义务很重要。 1 2 3 4 5 6 7 b. 创新和发展。强调成为第一的重要性。 1 2 3 4 5 6 7 c. 正式的规定和政策。保持平稳经营是很重要的。 1 2 3 4 5 6 7 d. 强调完成任务和实现目标,注重实效。 1 2 3 4 5 6 7 公司强调公司强调公司强调公司强调:::: 强烈反对 反对 部分反对 中立 部分同意 同意 完全同意 a. 人力资源。高的凝聚力和士气是很重要的。 1 2 3 4 5 6 7 b. 发展和获得新的资源。随时准备迎接新的挑战。 1 2 3 4 5 6 7 c. 持久和稳定性。有效率的,平稳的操作是很重要的。 1 2 3 4 5 6 7 d. 竞争性的活动和成绩。有可衡量的目标是很重要的。 1 2 3 4 5 6 7 QQQQ13131313. . . . 以下各项与贵公司所从事行业的以下各项与贵公司所从事行业的以下各项与贵公司所从事行业的以下各项与贵公司所从事行业的环境不确定环境不确定环境不确定环境不确定性有关性有关性有关性有关. . . . 请选出请选出请选出请选出这些描述在多大程度上反映这些描述在多大程度上反映这些描述在多大程度上反映这些描述在多大程度上反映了贵行业的情况了贵行业的情况了贵行业的情况了贵行业的情况....
不多/ 不强烈 极多/ 极强烈 a. 产品质量的竞争 1 2 3 4 5 6 7 b. 产品标准的不同 1 2 3 4 5 6 7 c. 为适应海外市场的产品调整 1 2 3 4 5 6 7 d. 为产品寻找新的市场 1 2 3 4 5 6 7 e. 低成本竞争者的出现 1 2 3 4 5 6 7 f. 新技术的出现 1 2 3 4 5 6 7
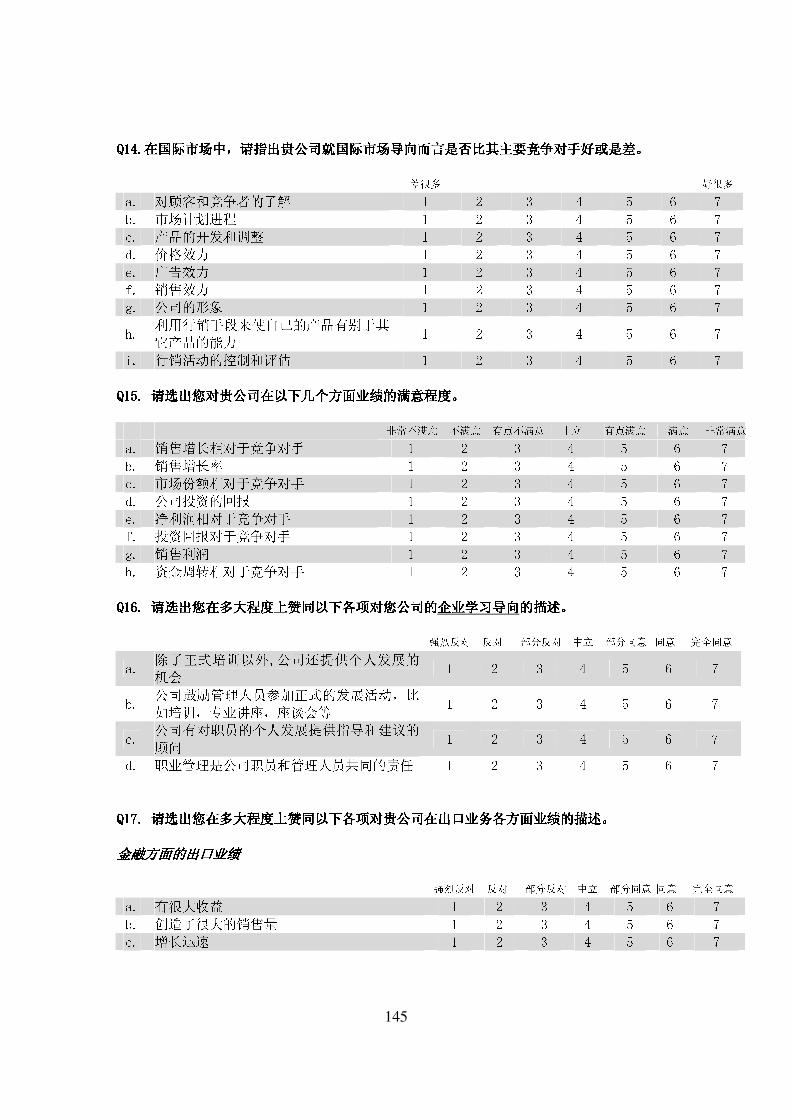
145
Q1Q1Q1Q14444....在国际市场中在国际市场中在国际市场中在国际市场中,,,,请指出请指出请指出请指出贵贵贵贵公司公司公司公司就就就就国际市场国际市场国际市场国际市场导向而言导向而言导向而言导向而言是否比其主要竞争对手好是否比其主要竞争对手好是否比其主要竞争对手好是否比其主要竞争对手好或是或是或是或是差差差差。。。。 差很多 好很多 a. 对顾客和竞争者的了解 1 2 3 4 5 6 7 b. 市场计划进程 1 2 3 4 5 6 7 c. 产品的开发和调整 1 2 3 4 5 6 7 d. 价格效力 1 2 3 4 5 6 7 e. 广告效力 1 2 3 4 5 6 7 f. 销售效力 1 2 3 4 5 6 7 g. 公司的形象 1 2 3 4 5 6 7 h. 利用行销手段来使自己的产品有别于其它产品的能力 1 2 3 4 5 6 7 i. 行销活动的控制和评估 1 2 3 4 5 6 7 Q1Q1Q1Q15555. . . . 请选出您对贵公司在以下几个方面业绩的满意程度请选出您对贵公司在以下几个方面业绩的满意程度请选出您对贵公司在以下几个方面业绩的满意程度请选出您对贵公司在以下几个方面业绩的满意程度。。。。 非常不满意 不满意 有点不满意 中立 有点满意 满意 非常满意a. 销售增长相对于竞争对手 1 2 3 4 5 6 7 b. 销售增长率 1 2 3 4 5 6 7 c. 市场份额相对于竞争对手 1 2 3 4 5 6 7 d. 公司投资的回报 1 2 3 4 5 6 7 e. 净利润相对于竞争对手 1 2 3 4 5 6 7 f. 投资回报对于竞争对手 1 2 3 4 5 6 7 g. 销售利润 1 2 3 4 5 6 7 h. 资金周转相对于竞争对手 1 2 3 4 5 6 7 Q1Q1Q1Q16666. . . . 请选出您在多大程度上赞同以下各项对您公司请选出您在多大程度上赞同以下各项对您公司请选出您在多大程度上赞同以下各项对您公司请选出您在多大程度上赞同以下各项对您公司的的的的企业企业企业企业学习导向学习导向学习导向学习导向的描述的描述的描述的描述。。。。 Q1Q1Q1Q17777. . . . 请选出您在多大程度上赞同以下各项对请选出您在多大程度上赞同以下各项对请选出您在多大程度上赞同以下各项对请选出您在多大程度上赞同以下各项对贵贵贵贵公司在出口业务各方面业绩的描述公司在出口业务各方面业绩的描述公司在出口业务各方面业绩的描述公司在出口业务各方面业绩的描述。。。。 金融金融金融金融方面的方面的方面的方面的出口业绩出口业绩出口业绩出口业绩 强烈反对 反对 部分反对 中立 部分同意 同意 完全同意 a. 有很大收益 1 2 3 4 5 6 7 b. 创造了很大的销售量 1 2 3 4 5 6 7 c. 增长迅速 1 2 3 4 5 6 7
强烈反对 反对 部分反对 中立 部分同意 同意 完全同意 a. 除了正式培训以外,公司还提供个人发展的机会 1 2 3 4 5 6 7 b. 公司鼓励管理人员参加正式的发展活动,比如培训,专业讲座,座谈会等 1 2 3 4 5 6 7 c. 公司有对职员的个人发展提供指导和建议的顾问 1 2 3 4 5 6 7 d. 职业管理是公司职员和管理人员共同的责任 1 2 3 4 5 6 7
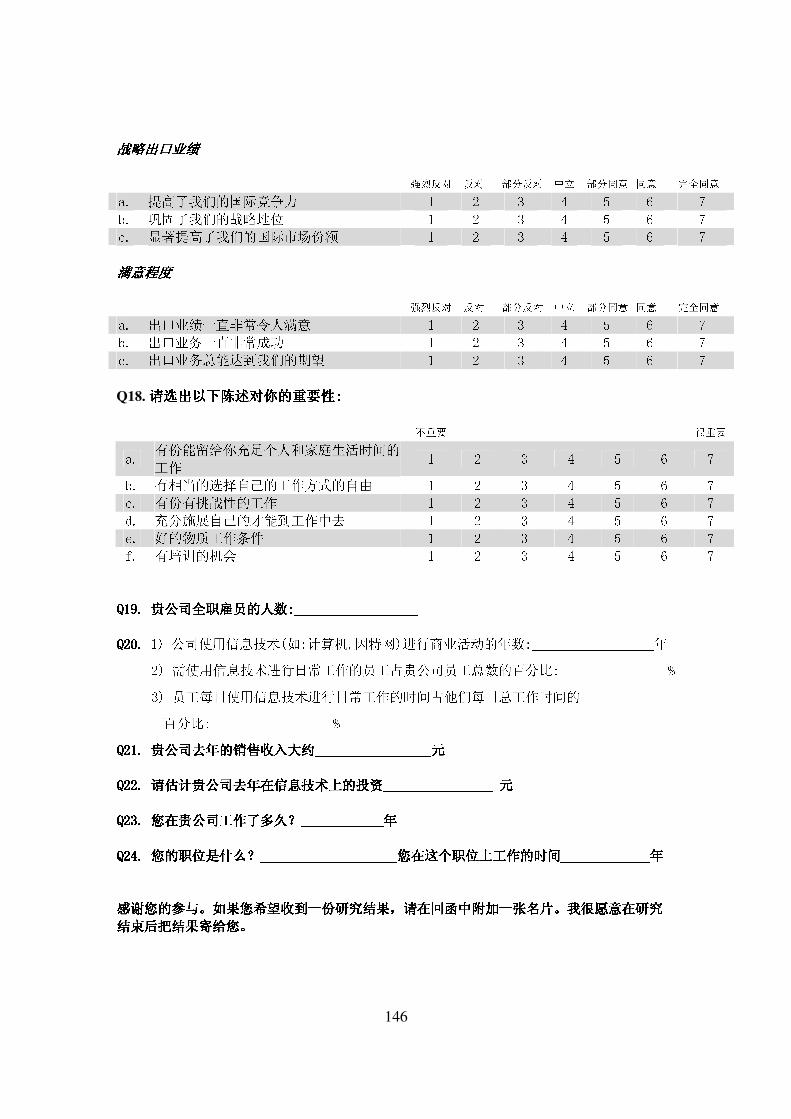
146
战略出口业绩战略出口业绩战略出口业绩战略出口业绩 强烈反对 反对 部分反对 中立 部分同意 同意 完全同意 a. 提高了我们的国际竞争力 1 2 3 4 5 6 7 b. 巩固了我们的战略地位 1 2 3 4 5 6 7 c. 显著提高了我们的国际市场份额 1 2 3 4 5 6 7 满意程度满意程度满意程度满意程度 强烈反对 反对 部分反对 中立 部分同意 同意 完全同意 a. 出口业绩一直非常令人满意 1 2 3 4 5 6 7 b. 出口业务一直非常成功 1 2 3 4 5 6 7 c. 出口业务总能达到我们的期望 1 2 3 4 5 6 7 Q18. 请选出以下陈述对你的重要性请选出以下陈述对你的重要性请选出以下陈述对你的重要性请选出以下陈述对你的重要性:::: 不重要 很重要 a. 有份能留给你充足个人和家庭生活时间的工作 1 2 3 4 5 6 7 b. 有相当的选择自己的工作方式的自由 1 2 3 4 5 6 7 c. 有份有挑战性的工作 1 2 3 4 5 6 7 d. 充分施展自己的才能到工作中去 1 2 3 4 5 6 7 e. 好的物质工作条件 1 2 3 4 5 6 7 f. 有培训的机会 1 2 3 4 5 6 7 Q1Q1Q1Q19999. . . . 贵公司全职雇员的贵公司全职雇员的贵公司全职雇员的贵公司全职雇员的人数人数人数人数:__________________:__________________:__________________:__________________ QQQQ20202020. . . . 1) 公司使用信息技术(如:计算机,因特网)进行商业活动的年数:__________________年 2) 需使用信息技术进行日常工作的员工占贵公司员工总数的百分比:________________% 3) 员工每日使用信息技术进行日常工作的时间占他们每日总工作时间的 百分比:__________________% QQQQ21212121. . . . 贵公司去年的销售收入贵公司去年的销售收入贵公司去年的销售收入贵公司去年的销售收入大约大约大约大约____________________________________________________________________元元元元 Q2Q2Q2Q22222. . . . 请估计贵公司去年在信息技术上的投资请估计贵公司去年在信息技术上的投资请估计贵公司去年在信息技术上的投资请估计贵公司去年在信息技术上的投资________________ ________________ ________________ ________________ 元元元元 Q2Q2Q2Q23333. . . . 您在贵公司工作了多久您在贵公司工作了多久您在贵公司工作了多久您在贵公司工作了多久????________________________________________________年年年年 Q2Q2Q2Q24444. . . . 您的职位是什么您的职位是什么您的职位是什么您的职位是什么????________________________________________________________________________________您在这个职位上工作的时间您在这个职位上工作的时间您在这个职位上工作的时间您在这个职位上工作的时间____________________________________________________年年年年 感谢您的参与感谢您的参与感谢您的参与感谢您的参与。。。。如果您希望收到一份研究结果如果您希望收到一份研究结果如果您希望收到一份研究结果如果您希望收到一份研究结果,,,,请在回函中附加一张名片请在回函中附加一张名片请在回函中附加一张名片请在回函中附加一张名片。。。。我我我我很愿意很愿意很愿意很愿意在研究在研究在研究在研究结束后把结果寄给您结束后把结果寄给您结束后把结果寄给您结束后把结果寄给您。。。。