information technology and the g7 economies technology and the g7 economies ... wyckoff. 3 paul...
TRANSCRIPT

Information Technologyand the G7 Economies
Dale W. Jorgenson
1. Introduction
In this paper I present new international comparisons of economic growthamong the G7 nations—Canada, France, Germany, Italy, Japan, the U.K.,and the U.S. (See the tables and charts pp. 154–166.) These comparisonsfocus on the impact of investment in information technology (IT) equip-ment and software over the period 1980–2000. In 1998 the G7 nationsaccounted for nearly sixty percent of world output1 and a much larger propor-tion of world investment in IT. Economic growth in the G7 has experienceda strong revival since 1995, driven by a powerful surge in IT investment.
The resurgence of economic growth in the United States during the1990s and the crucial role of IT investment has been thoroughly docu-mented and widely discussed.2 Similar trends in the other G7 economieshave been more difficult to detect, partly because of discrepancies amongofficial price indexes for IT equipment and software identified by AndrewWyckoff.3 Paul Schreyer has constructed “internationally harmonized” ITprices that eliminate many of these discrepancies.4
WORLD ECONOMICS • Vol. 4 • No. 4 • October–December 2003 139
Dale W. Jorgenson is the Samuel W. Morris University Professor at Harvard University. He hasbeen a Professor in the Department of Economics at Harvard since 1969, and is Director, Programon Technology and Economic Policy, at the John F. Kennedy School of Government.AcknowledgementsThe Economic and Social Research Institute provided financial support from its program oninternational collaboration through the Nomura Research Institute. The author is very grateful toJon Samuels for excellent research assistance. Mun S. Ho, Kazuyuki Motohashi, Koji Nomura,Kevin J. Stiroh, Marcel Timmer, and Bart Van Ark provided valuable data. The Bureau ofEconomic Analysis and the Bureau of Labor Statistics assisted with data for the U.S. and StatisticsCanada contributed the data for Canada. The author is grateful to all of them but retains soleresponsibility for any remaining deficiencies.
1 See Angus Maddison (2001) for 1998 data for world GDP and the GDP of each of the G7 countries. 2 See Dale Jorgenson and Kevin Stiroh (2000) and Stephen Oliner and Daniel Sichel (2000).3 See Wyckoff (1995). 4 See Schreyer (2000). Alessandra Colecchia and Schreyer (2002) have employed these internationallyharmonized prices in measuring the impact of IT investment.

140 WORLD ECONOMICS • Vol. 4 • No. 4 • October–December 2003
Dale W. Jorgenson
Using internationally harmonized prices, I have analyzed the role ofinvestment and productivity as sources of growth in the G7 countries overthe period 1980–2000. I have subdivided the period in 1989 and 1995 inorder to focus on the most recent experience. I have decomposed growth ofoutput for each country between growth of input and productivity. Finally,I have allocated the growth of input between investments in tangibleassets, especially information technology and software, and human capital.
Growth in IT capital input per capita jumped to double-digit levels inthe G7 nations after 1995. This can be traced to an acceleration in the rate ofdecline of IT prices, analyzed in my Presidential Address to the AmericanEconomic Association.5 The powerful upswing in investment was mostpronounced in Japan, but capital input growth in the U.S., Canada, and theU.K. was only slightly lower. France, Germany, and Italy also experienceddouble-digit growth, but lagged considerably behind the leaders.
During the 1980s productivity had disappeared as a source of growth forCanada, France, and Italy, while accounting for only sixteen percent ofU.S. growth, thirty-one percent of growth for Japan, and thirty-two percentin Germany. Productivity was the predominant source of growth only forthe U.K. Between 1989 and 1995 productivity growth declined further inthe G7 nations, except for Italy. Productivity growth was negative forCanada, France, and Germany, but remained positive for the U.S., theU.K., Italy, and Japan.
Productivity growth revived in all the G7 countries after 1995, againexcept for Italy. This resurgence was most dramatic in Germany, partly off-setting years of negative productivity growth, the aftermath of Germanreunification. However, productivity for Canada, France, and Italy in 2000remained below the levels of 1980.
Japan exhibited the highest growth in output per capita among the G7nations from 1980 to 1995. Japan’s level of output per capita rose from thelowest in the G7 to the middle of the group. Although this advance owedmore to input per capita than productivity, Japan’s productivity growth far out-stripped that for the other members of the G7, especially before 1989. None-theless, Japan’s productivity remained the lowest among the G7 nations.
The U.S. led the G7 in output per capita throughout the period1980–2000. Canada and the U.S. had similar levels of output per capita in
5 See Jorgenson (2001).
WORLD ECONOMICS • Vol. 4 • No. 4 • October–December 2003 141
Information Technology and the G7 Economies
1980, but Canada fell further behind during the 1980s and 1990s. The U.S.also led the G7 countries in input per capita during 1980–2000, but U.S.productivity languished at levels below those of Canada, France, and Italy.
In Section 2, I outline the methodology for this study, based on myPresidential Address. I have revised and updated the U.S. data presentedthere through 2000. Comparable data on investment in information tech-nology have been constructed for Canada by Statistics Canada.6 Data forthe four European countries—France, Germany, Italy, and the U.K.—have been developed for the European Commission by Bart Van Ark,et al.7 Finally, data for Japan have been assembled by myself and KazuyukiMotohashi for the Research Institute on Economy, Trade, and Industry.8 Ihave linked these data by means of the OECD’s purchasing power pari-ties for 1999.9
In Section 3, I consider the impact of IT investment and the relativeimportance of investment and productivity in accounting for economicgrowth among the G7 nations. Investments in human capital and tangibleassets, especially IT equipment and software, account for the overwhelm-ing proportion of growth. Differences in the composition of capital andlabor inputs are essential for identifying persistent international differ-ences in output and accounting for the impact of IT investment.
In Section 4, I consider alternative approaches to international compar-isons. The great revival of interest in economic growth among economistsdates from Maddison’s (1982) updating and extension of Simon Kuznets’(1971) long-term estimates of the growth of national product and popula-tion for fourteen industrialized countries, including the G7 nations.Maddison (1982, 1991) added Austria and Finland to Kuznets’ list and pre-sented growth rates covering periods beginning as early as 1820 andextending through 1989.
Maddison (1987, 1991) also generated growth accounts for majorindustrialized countries, but did not make level comparisons like thosepresented in Section 2 below. As a consequence, productivity differenceswere omitted from the canonical formulation of “growth regressions” byWilliam Baumol (1986). This proved to be a fatal flaw in Baumol’s
6 See John Baldwin and Tarek Harchaoui (2002).7 See Van Ark, Johanna Melka, Nanno Mulder, Marcel Timmer, and Gerard Ypma (2002). 8 See Jorgenson and Motohashi (2003). 9 See OECD (2002). Current data on purchasing power parities are available from the OECD website:http://www.sourceoecd.org.

142 WORLD ECONOMICS • Vol. 4 • No. 4 • October–December 2003
Dale W. Jorgenson
regression model, remedied by Nazrul Islam’s (1995) panel data model.Section 5 concludes the paper.
2. Investment and Productivity
My papers with Laurits Christensen and Dianne Cummings (1980, 1981)developed growth accounts for the United States and its major tradingpartners—Canada, France, Germany, Italy, Japan, Korea, TheNetherlands, and the United Kingdom for 1947–1973. We employed GNPas a measure of output and incorporated constant quality indices of capitaland labor input for each country. Our 1981 paper compared levels of out-put, inputs, and productivity for all nine nations.
I have updated the estimates for the G7—Canada, France, Germany,Italy, Japan, the United Kingdom, and the United States—through 1995 inearlier work. The updated estimates are presented in my papers withChrys Dougherty (1996, 1997) and Eric Yip (2000). We have shown thatproductivity accounted for only eleven percent of economic growth inCanada and the United States over the period 1960–1995.
My paper with Yip (2000) attributed forty-seven percent of Japaneseeconomic growth during the period 1960–1995 to productivity growth.The proportion attributable to productivity approximated forty percent ofgrowth for the four European countries—France (0.38), Germany (0.42),Italy (0.43), and the United Kingdom (0.36). Input growth predominatedover productivity growth for all the G7 nations.
I have now incorporated new data on investment in information tech-nology equipment and software for the G7. I have also employed interna-tionally harmonized prices like those constructed by Schreyer (2000). As aconsequence, I have been able to separate the contribution of capital inputto economic growth into IT and Non-IT components. While IT invest-ment follows similar patterns in all the G7 nations, Non-IT investmentvaries considerably and helps to explain important differences in growthrates among the G7.
2.1 Comparisons of Output, Input, and Productivity
My first objective is to extend my estimates for the G7 nations withChristensen, Cummings, Dougherty, and Yip to the year 2000. Followingthe methodology of my Presidential Address, I have chosen GDP as a

WORLD ECONOMICS • Vol. 4 • No. 4 • October–December 2003 143
Information Technology and the G7 Economies
measure of output. I have included imputations for the services of con-sumers’ durables as well as land, buildings, and equipment owned by non-profit institutions. I have also distinguished between investments ininformation technology equipment and software and investments in otherforms of tangible assets.
A constant quality index of capital input is based on weights that reflectdifferences in capital consumption, tax treatment, and the rate of declineof asset prices. I have derived estimates of capital input and propertyincome from national accounting data. Similarly, a constant quality indexof labor input is based on weights by age, sex, educational attainment, andemployment status. I have constructed estimates of hours worked andlabor compensation from labor force surveys for each country.
In Table 1, I present output per capita for the G7 nations from 1980 to2000, taking the U.S. as 100.0 in 2000. Output and population are givenseparately in Tables 2 and 3. I use 1999 purchasing power parities from theOECD to convert output from domestic prices for each country into U.S.dollars. The U.S. maintained its lead among the G7 during the 1980s andthe 1990s. Canada was close to the U.S. level in 1980, but the Canada-U.S.gap widened throughout the period 1980–2000.
The four major European nations—the U.K., France, Germany, andItaly—had very similar levels of output per capita throughout the period1980–2000, with Germany as the leader. Japan rose from last place in 1980to fourth place among the G7 in 2000, lagging considerably behind theU.S. and Canada, but only slightly behind Germany. Japan led the G7 inthe growth of output per capita from 1980–1995, but fell behind the U.S.,Canada, the U.K., and France after 1995.
In Table 1, I present input per capita for the G7 over the period1980–2000, taking the U.S. as 100.0 in 2000. I express input per capita inU.S. dollars, using purchasing power parities constructed for this study.10
The U.S. was the leader among the G7 in per capita input throughout theperiod. In 2000 Japan ranked next to the U.S., with Canada third andGermany fourth. France and Italy started at the bottom of the ranking andremained there throughout the period.
In Table 1, I also present productivity levels for the G7 over the period1980–2000. Productivity is defined as the ratio of output to input, including
10 The purchasing power parities for outputs are based on OECD (2002). Purchasing power parities for inputsfollow the methodology described in detail by Jorgenson and Yip (2001).
144 WORLD ECONOMICS • Vol. 4 • No. 4 • October–December 2003
Dale W. Jorgenson
both capital and labor inputs. Canada was the productivity leader through-out the period 1980–2000, despite the absence of productivity growth!Only the U.S., the U.K., and Japan made substantial gains in productivity. The level of productivity declined slightly in France andItaly and dropped precipitously in Germany after reunification.
I summarize growth in output and input per capita and productivity forthe G7 nations in Table 4. I present growth rates of output and populationfor the period 1980–2000 in Tables 2 and 3. Output growth slowed in theG7 after 1989, but revived for all nations except Japan after 1995. Outputper capita followed a similar pattern, but with negative growth for Canadaduring the period 1990–1995.
Japan led in growth of output and output per capita through 1995, butfell back to the middle echelon of the G7 after 1995. The U.K. led in pro-ductivity growth during the 1980s, when U.K. productivity growth out-stripped the growth of input per capita. For all other countries and all othertime periods the growth of input per capita exceeded growth of produc-tivity by a substantial margin. Productivity growth in the G7 slowed dur-ing the period 1989–1995, except for Italy, where productivity slumpedafter 1995.
Italy led the G7 in growth of input per capita for the period 1980–1995,but relinquished leadership to the U.S. after 1995. Differences amonginput growth rates are smaller than differences among output growth rates,but there was a slowdown in input growth during 1989–1995 in the U.S.,Canada, France, Italy, and Japan and an acceleration of growth in the U.K.and Germany. Growth of input per capita in the G7 increased after 1995,except in Germany and Japan.
2.2 Comparisons of Capital and Labor Quality
A constant quality index of capital input weights capital inputs by propertycompensation per unit of capital. By contrast, an index of capital stockweights different types of capital by asset prices. The ratio of capital inputto capital stock measures the average quality of a unit of capital. This rep-resents the difference between the constant quality index of capital inputand the index of capital stock employed, for example, by Kuznets (1971)and Robert Solow (1970).
In Table 5, I present capital input per capita for the G7 countries overthe period 1980–2000 relative to the U.S. in 2000. The U.S. was the leader

WORLD ECONOMICS • Vol. 4 • No. 4 • October–December 2003 145
Information Technology and the G7 Economies
in capital input per capita throughout the period. Germany led the remain-ing six countries in 1980, but was overtaken by Italy in 1989. Italy laggedbehind the United States, but led the rest of the G7 through 2000. Japanwas the laggard among the G7 in 1980, but surpassed the U.K. in 1989.
The picture for capital stock per capita has some similarities to capitalinput, but there are important differences. Capital stock levels do notaccurately reflect the substitutions among capital inputs that accompanyinvestments in tangible assets, especially investments in IT equipmentand software. The U.S. led throughout the period in capital stock percapita as well as capital input, while Germany was second to the U.S. incapital stock. Japan and the U.K. lagged the remaining countries of the G7throughout the period with Japan overtaking the U.K. in 1995.
The behavior of capital quality highlights the differences between theconstant quality index of capital input and capital stock. There are impor-tant changes in capital quality over time and persistent differences amongcountries, so that heterogeneity in capital input must be taken intoaccount in international comparisons of economic performance. The U.K.was the international leader in capital quality until 1995, but was over-taken by Italy in 2000, while the U.S. ranked near the bottom, rising aboveGermany only in 1980.
I summarize growth in capital input and capital stock per capita, as wellas capital quality for the G7 nations in Table 8. Italy was the internationalleader in capital input growth from 1980–1989, while Canada was the lag-gard. Japan led from 1989–1995, while Canada lagged considerably behindthe rest of the G7. After 1995 the U.S. took the lead. There was a slow-down in capital input growth in the G7 after 1989 and a revival after 1995in the U.S., Canada, Germany, and Italy.
A constant quality index of labor input weights hours worked for differ-ent categories by labor compensation per hour. An index of hours workedfails to take quality differences into account. The ratio of labor input tohours worked measures the average quality of an hour of labor, as reflectedin its marginal product. This represents the difference between the con-stant quality index of labor input and the index of hours workedemployed, for example, by Kuznets (1971) and Solow (1970).
In Table 11, I present labor input per capita for the G7 nations for theperiod 1980–2000 relative to the U.S. in 2000. Japan was the internationalleader throughout the period and Italy the laggard. Labor input in Japan

146 WORLD ECONOMICS • Vol. 4 • No. 4 • October–December 2003
Dale W. Jorgenson
was nearly double that of Italy. The U.S. led the remaining G7 nationsthroughout the period. Canada was only slightly behind the U.K. in 1980,but ranked third among the G7 for the rest of the period, while the U.K.remained in fourth place. Italy and France lagged behind the rest of theG7 for the entire period.
The picture for hours worked per capita has some similarities to laborinput, but there are important differences. Japan was the internationalleader in hours worked per capita. The U.S., Canada, and the U.K. movedroughly in parallel and Canada ranked second, except for 1995. Italy wasthe laggard from 1980–2000. France remained above Italy throughout theperiod, but fell below Germany in 1989.
The behavior of labor quality highlights the differences between laborinput and hours worked. Germany was the leader in labor quality through-out the period 1980–2000. The U.S. ranked second in labor quality, butCanada, France, and Japan approached U.S. levels in 2000. Labor qualitylevels in these three countries moved in parallel throughout the period.Italy was the laggard among the G7 in labor quality as well as hoursworked.
I summarize growth in labor input and hours worked per capita, as wellas labor quality for the period 1980–2000 in Table 12. The U.S. led the G7nations in labor input growth until 1995, but relinquished leadership toFrance. Hours worked per capita fell continuously throughout the period1980–2000 for Japan. Labor input growth was negative for the U.K. andFrance during the 1980s, for Canada during the periods 1989–1995, and forJapan after 1995. Hours worked per capita fell for the U.S., Canada, andthe U.K. during the period 1989–1995 and moved in parallel throughoutthe period 1980–2000.
Growth in labor quality was negative for the U.K. during the 1980s.Otherwise, labor quality growth was positive for the remaining G7 nationsin all time periods. Japan was the leader during the 1980s, relinquishing itslead to France during the 1990s. Growth in labor quality and hours workedare equally important as sources of growth in labor input for the G7.
3. Investment in Information Technology
Using data from Tables 1 and 2, I can assess the relative importance ofinvestment and productivity as sources of economic growth for the G7
WORLD ECONOMICS • Vol. 4 • No. 4 • October–December 2003 147
Information Technology and the G7 Economies
nations. Investments in tangible assets and human capital greatly pre-dominated over productivity during the period 1980–2000. Productivitygrowth was negative for Canada, France, and Italy, while the U.S., theU.K., Germany, and Japan had positive productivity growth for this period.Productivity was the most important source of economic growth only forthe U.K. and only during the 1980s.
Similarly, using data from Table 5 I can assess the relative importance ofgrowth in capital stock and capital quality. Capital input growth was posi-tive for all countries for the period 1980–2000 and all three sub-periods.Capital quality growth was positive for the period as a whole for all G7countries, except for the U.K. Although capital stock generally predomi-nated in capital input growth, capital quality was also quantitatively sig-nificant, especially after 1995.
Finally, using data from Table 7 I can assess the relative importance ofgrowth in hours worked and labor quality. Hours worked per capitadeclined for France, Germany, and Japan, while labor quality rose in thesenations during the period 1980–2000. For the U.S., Canada, the U.K., andItaly, both hours worked per capita and labor quality rose. I conclude thatlabor quality growth is essential to the analysis of growth in labor input.
3.1 Investment in IT Equipment and Software
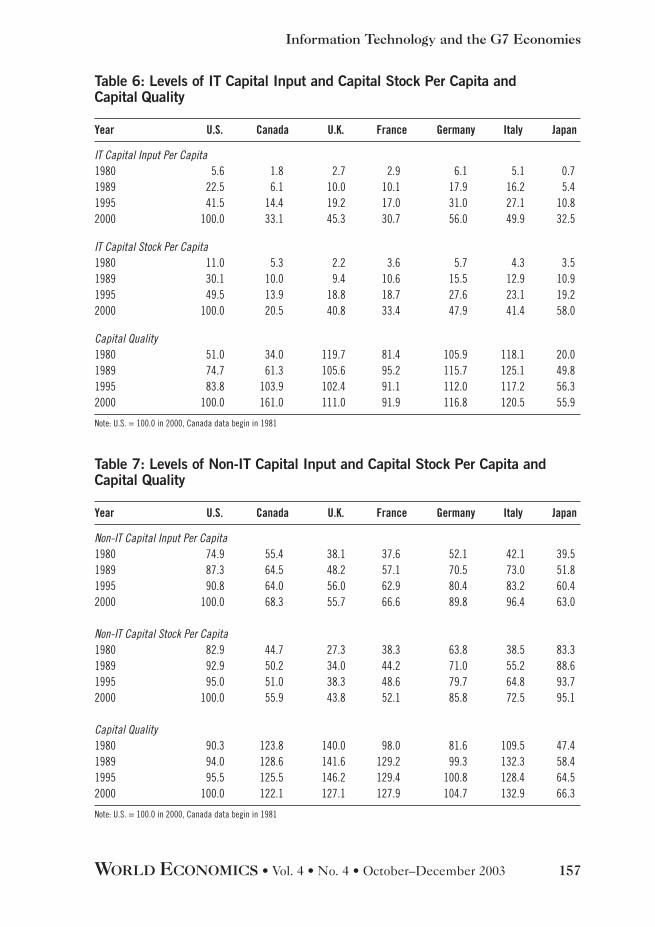
The final step in the comparison of patterns of economic growth amongthe G7 nations is to analyze the impact of investment in information tech-nology equipment and software. In Table 6, I present levels of IT capitalinput per capita for the G7 for the period 1980–2000, relative to the U.S.in 2000. The U.S. overtook Germany in 1989 and remained the leaderthroughout 2000, with Germany and Italy close behind. Japan laggedbehind the rest of the G7 until 2000, when France fell into last place.
Table 6 reveals substantial differences between IT capital stock and ITcapital input. The G7 nations began with very modest stocks of IT equip-ment and software per capita in 1980. These stocks expanded rapidly dur-ing 1980–2000. The U.S. led in IT capital stock throughout the period,while Japan, the laggard among the G7 in 1980, ranked second in 2000.
IT capital quality reflects differences in the composition of IT capitalinput, relative to IT capital stock. A rising level of capital quality indicatesa shift toward short-lived assets, such as computers and software. Thisshift is particularly dramatic for the U.S., Canada, and Japan, while the

148 WORLD ECONOMICS • Vol. 4 • No. 4 • October–December 2003
Dale W. Jorgenson
composition of capital stock changed relatively less for the U.K., France,Germany, and Italy. Patterns for Non-IT capital input, capital stock, andcapital quality largely reflect those for capital as a whole, presented inTable 5.
I give growth rates for IT capital input per capita, capital stock percapita, and capital quality in Table 9. The G7 nations have exhibited dou-ble-digit growth in IT capital input per capita since 1995. Japan was theinternational leader during this period with the U.S., Canada, and the U.K.close behind. Japan was also the leader in growth of IT capital input dur-ing the period 1980–1989, another period of double-digit growth in capitalinput. However, Japan fell behind Canada during 1989–1995, whengrowth slowed substantially.
Patterns of growth for IT capital stock per capita are similar to those forIT capital input for the four European countries. Changes in the compo-sition of IT capital stock per capita were important sources of growth of ITcapital input per capita for the U.S., Canada, and Japan. IT capital stockalso followed the pattern of IT capital input with substantial growth dur-ing the 1980s, followed by a pronounced lull during the period 1989–1995.After 1995 the growth rates of IT capital stock surged in all the G7 coun-tries, but exceeded the rates of the 1980s only for the U.S. and Japan.
Finally, growth rates for IT capital quality reflect the rates at whichshorter-lived IT assets are substituted for longer-lived assets. Japan led inthe growth of capital quality during the 1980s, but relinquished its lead toCanada in 1989. IT capital quality growth for the U.S., Canada, and Japanoutstripped that for the four European countries for most of the period1980–2000. Patterns of growth in Non-IT capital input per capita, Non-ITcapital stock per capita, and Non-IT capital quality given in Table 10largely reflect those for capital as a whole presented in Table 8.
Table 13 and Figure 1 present the contribution of capital input to eco-nomic growth for the G7 nations, divided between IT and Non-IT. Thepowerful surge of IT investment in the U.S. after 1995 is mirrored in sim-ilar jumps in growth rates of the contribution of IT capital through the G7.The contribution of IT capital input was similar during the 1980s and theperiod 1989–1995 for all the G7 nations, despite the dip in rates of eco-nomic growth after 1989. Japan is an exception to this general pattern witha contribution of IT capital comparable to that of the U.S. during the

WORLD ECONOMICS • Vol. 4 • No. 4 • October–December 2003 149
Information Technology and the G7 Economies
1980s, followed by a decline in this contribution from 1989–1995, reflect-ing the sharp downturn in Japanese economic growth.
The contribution of Non-IT capital input to economic growth after1995 exceeded that for IT capital input for five of the G7 nations; theexceptions were the U.K. and Japan. The U.S. stands out in the magni-tude of the contribution of capital input after 1995. Both IT and Non-ITcapital input contributed to the U.S. economic resurgence of the last halfof the 1990s. Despite the strong performance of IT investment in Japanafter 1995, the contribution of capital input declined substantially; the pat-tern for the U.K. is similar.
3.2 The Relative Importance of Investment and Productivity
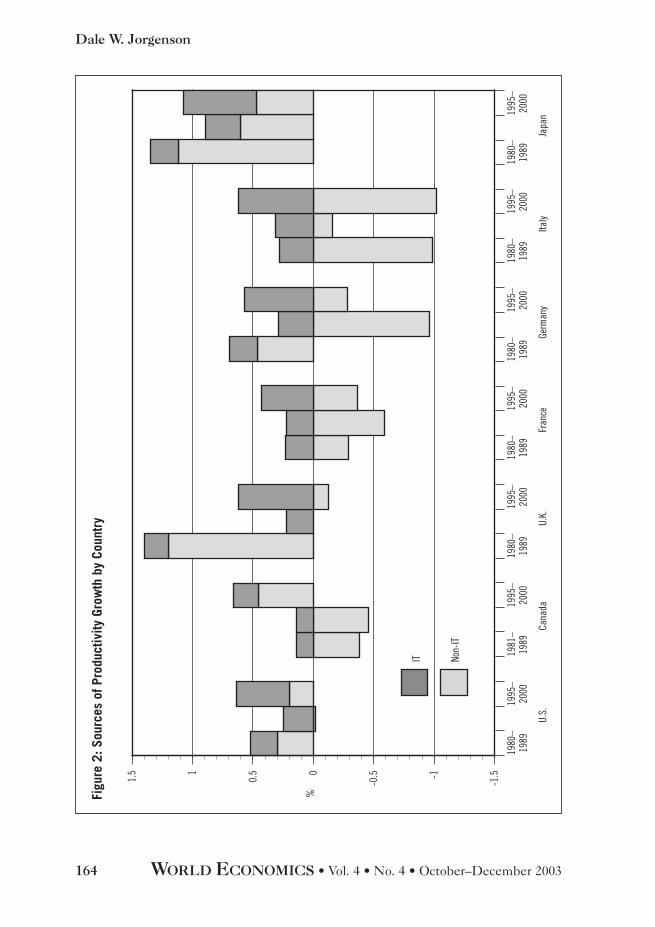
Table 14 and Figure 2 present contributions to economic growth from pro-ductivity, divided between the IT-producing and Non-IT-producingindustries. The methodology for this division follows Triplett (1996). Thecontribution of IT-producing industries is positive throughout the period1980–2000 and jumps substantially after 1995. Since the level of produc-tivity is higher in 1980 than in 2000 for Canada, France, and Italy, it is notsurprising that the contributions of Non-IT-producing industries in thesecountries are predominantly negative.
Table 15 and Figure 3 give a comprehensive view of the sources of eco-nomic growth for the G7. The contribution of capital input alone exceedsthat of productivity for most nations and most time periods. The contri-bution of Non-IT capital input predominates over IT capital input formost countries and most time periods with the U.K. and Japan after 1995as exceptions. This can be attributed to the unusual weakness in thegrowth of aggregate demand in these countries. The contribution of laborinput varies considerably among the G7 nations with negative contribu-tions after 1995 in Japan and during the 1980s in France.
Finally, Table 16 and Figure 4 translate sources of growth into sourcesof growth in average labor productivity (ALP). ALP, defined as output perhour worked, must be carefully distinguished from overall productivity,defined as output per unit of both capital and labor inputs. Output growthis the sum of growth in hours worked and growth in ALP. ALP growthdepends on the contribution of capital deepening, the contribution ofgrowth in labor quality, and productivity growth.

150 WORLD ECONOMICS • Vol. 4 • No. 4 • October–December 2003
Dale W. Jorgenson
Capital deepening is the contribution of growth in capital input per hourworked and predominates over productivity as a source of ALP growth forthe G7 nations. IT capital deepening predominates over Non-IT capitaldeepening in the U.S. throughout the period 1980–2000 and in Canada,the U.K., France, and Japan after 1995. Finally, the contribution of laborquality is positive, except for the U.K. in the 1980s.
4. Alternative Approaches
Edward Denison’s (1967) pathbreaking volume, Why Growth Rates Differ,compared differences in growth rates for national income net of capitalconsumption per capita for the period 1950–62 with differences of levelsin 1960 for eight European countries and the U.S. The European coun-tries were characterized by much more rapid growth and a lower level ofnational income per capita. However, this association did not hold for allcomparisons between the individual countries and the U.S. Nonetheless,Denison concluded:11
Aside from short-term aberrations Europe should be able to report highergrowth rates, at least in national income per person employed, for a long time.Americans should expect this and not be disturbed by it.
Maddison (1987, 1991) constructed estimates of aggregate output,input, and productivity growth for France, Germany, Japan, TheNetherlands, and the United Kingdom for the period 1870–1987.Maddison (1995) extended estimates for the U.S., the U.K., and Japanbackward to 1820 and forward to 1992. He defined output as gross of cap-ital consumption throughout the period and constructed constant qualityindices of labor input for the period 1913–1984, but not for 1870–1913.
Maddison employed capital stock as a measure of the input of capital,ignoring the changes in the composition of capital stock that are such animportant source of growth for the G7 nations. This omission is especiallycritical in assessing the impact of investment in information technology.Finally, he reduced the growth rate of the price index for investment byone percent per year for all countries and all time periods to correct forbiases like those identified by Wyckoff (1995).
11 See Denison (1967), especially Chapter 21, “The Sources of Growth and the Contrast between Europe andthe United States”, pp. 296–348.

WORLD ECONOMICS • Vol. 4 • No. 4 • October–December 2003 151
Information Technology and the G7 Economies
4.1 Comparisons without Growth Accounts
Kuznets (1971) provided elaborate comparisons of growth rates for four-teen industrialized countries. Unlike Denison (1967), he did not providelevel comparisons. Maddison (1982) filled this lacuna by comparing levelsof national product for sixteen countries. These comparisons used esti-mates of purchasing power parities by Irving Kravis, Alan Heston, andRobert Summers (1978).12
Maddison (1995) extended his long-term estimates of the growth ofnational product and population to 56 countries, covering the period1820–1992. Maddison (2001) updated these estimates to 1998 in his mag-isterial volume, The World Economy: A Millennial Perspective. He providedestimates for 134 countries, as well as seven regions of the world—WesternEurope, Western Offshoots (Australia, Canada, New Zealand, and theUnited States), Eastern Europe, Former USSR, Latin America, Asia, andAfrica.
Purchasing power parities have been updated by successive versions ofthe Penn World Table. A complete list of these tables through Mark 5 isgiven by Summers and Heston (1991). The current version of the PennWorld Table is available on the Center for International Comparisons web-site at the University of Pennsylvania (CICUP). This covers 168 countriesfor the period 1950–2000 and represents one of the most significantachievements in economic measurement of the postwar period.13
4.2 Convergence
Data presented by Kuznets (1971), Maddison, and successive versions ofthe Penn World Table have made it possible to reconsider the issue of con-vergence raised by Denison (1967). Moses Abramovitz (1986) was the firstto take up the challenge by analyzing convergence of output per capitaamong Maddison’s sixteen countries. He found that convergence charac-terized the postwar period, while there was no tendency toward conver-gence before 1914 and during the interwar period. Baumol (1986)formalized these results by running a regression of growth rate of GDP percapita over the period 1870–1979 on the 1870 level of GDP per capita.14
12 For details, see Maddison (1982), pp. 159–168. 13 See Heston, Summers, and Aten (2002). The CICUP website is at: http://pwt.econ.upenn.edu/aboutpwt.html.14 Baumol’s “growth regression” has spawned a vast literature, recently summarized by Steven Durlauf andDanny Quah (1999), Ellen McGrattan and James Schmitz (1999), and Islam (2003). Much of this literature isbased on data from successive versions of the Penn World Table.
152 WORLD ECONOMICS • Vol. 4 • No. 4 • October–December 2003
Dale W. Jorgenson
In a highly innovative paper on “Crazy Explanations for theProductivity Slowdown”, Paul Romer (1987) derived Baumol’s “growthregression” from Solow’s (1970) growth model with a Cobb-Douglas pro-duction function. Romer’s empirical contribution was to extend thegrowth regressions from Maddison’s (1982) sixteen advanced countries tothe 115 countries in the Penn World Table (Mark 3). Romer’s key findingwas an estimate of the elasticity of output with respect to capital close tothree-quarters. The share of capital in GNP implied by Solow’s model wasless than half as great.
Gregory Mankiw, David Romer, and David Weil (1992) defended thetraditional framework of Kuznets (1971) and Solow (1970). The empiricalpart of their study is based on data for 98 countries from the Penn WorldTable (Mark 4). Like Paul Romer (1987), Mankiw, David Romer, and Weilderived a growth regression from the Solow (1970) model; however, theyaugmented this by allowing for investment in human capital.
The results of Mankiw, David Romer, and Weil (1992) provided empir-ical support for the augmented Solow model. There was clear evidence ofthe convergence predicted by the model; in addition, the estimated elas-ticity of output with respect to capital was in line with the share of capitalin the value of output. The rate of convergence of output per capita wastoo slow to be consistent with 1970 version of the Solow model, but sup-ported the augmented version.
4.3 Modeling Productivity Differences
Finally, Islam (1995) exploited an important feature of the Penn WorldTable overlooked in prior studies. This panel data set contains benchmarkcomparisons of levels of the national product at five-year intervals, begin-ning in 1960. This made it possible to test an assumption maintained ingrowth regressions. These regressions had assumed identical levels of pro-ductivity for all countries included in the Penn World Table.
Substantial differences in levels of productivity among countries havebeen documented by Denison (1967), by my papers with Christensen andCummings (1981), Dougherty (1996, 1997), and Yip (2000) and inSection 2 above. By introducing econometric methods for panel data,Islam (1995) was able to allow for these differences. He corroborated thefinding of Mankiw, David Romer, and Weil (1992) that the elasticity of

WORLD ECONOMICS • Vol. 4 • No. 4 • October–December 2003 153
Information Technology and the G7 Economies
output with respect to capital input coincided with the share of capital inthe value of output.
In addition, Islam (1995) found that the rate of convergence of outputper capita among countries in the Penn World Table substantiated theunaugmented version of the Solow (1970) growth model. In short, “crazyexplanations” for the productivity slowdown, like those propounded byPaul Romer (1987, 1994), were unnecessary. Moreover, the model did notrequire augmentation by endogenous investment in human capital, as pro-posed by Mankiw, David Romer, and Weil (1992).
Islam concluded that differences in technology among countries must beincluded in econometric models of growth rates. This requires economet-ric techniques for panel data, like those originated by Gary Chamberlain(1984), rather than the regression methods of Baumol, Paul Romer, andMankiw, David Romer, and Weil. Panel data techniques have now super-seded regression methods in modeling differences in output per capita.
5. Conclusions
I conclude that a powerful surge in investment in information technologyand equipment after 1995 characterizes all of the G7 economies. Thisaccounts for a large portion of the resurgence in U.S. economic growth, butcontributes substantially to economic growth in the remaining G7economies as well. Another significant source of the G7 growth resurgenceafter 1995 is a jump in productivity growth in IT-producing industries.
For Japan, the dramatic upward leap in the impact of IT investmentafter 1995 was insufficient to overcome downward pressures from defi-cient growth of aggregate demand. This manifests itself in declining con-tributions of Non-IT capital and labor inputs. Similar downturns arevisible in Non-IT capital input in the U.K. and in labor input in Germany,but both were combined in Japan after 1995.
These findings are based on new data and new methodology for ana-lyzing the sources of economic growth. Internationally harmonized pricesfor information technology equipment and software are essential forcapturing differences among the G7 nations. Constant quality indices ofcapital and labor inputs are necessary to incorporate the impacts of invest-ments in information technology and human capital.

154 WORLD ECONOMICS • Vol. 4 • No. 4 • October–December 2003
Dale W. Jorgenson
Exploiting the new data and methodology, I have been able to showthat investment in tangible assets is the most important source of eco-nomic growth in the G7 nations. Productivity predominates only for theU.K. and only during the 1980s. The relative importance of productivitygrowth is far less than suggested by the traditional methodology ofKuznets (1971) and Solow (1970), which is now obsolete.
The conclusion from Islam’s (1995) research is that the Solow (1970)model is appropriate for modeling the endogenous accumulation of tangi-ble assets. It is unnecessary to endogenize human capital accumulation aswell. The transition path to balanced growth equilibrium after a change inpolicies that affects investment in tangible assets requires decades, whilethe transition after a change affecting investment in human capitalrequires as much as a century.
Table 1: Levels of Output and Input Per Capita and Productivity
Year U.S. Canada U.K. France Germany Italy Japan
Output Per Capita1980 64.8 66.0 44.3 46.2 50.9 46.8 40.01989 80.6 76.0 55.8 55.7 61.5 58.1 56.51995 86.3 75.0 60.7 59.2 65.5 63.0 64.32000 100.0 85.8 68.5 65.7 71.1 68.7 70.8
Input Per Capita1980 71.2 61.4 54.6 44.1 59.1 42.3 57.91989 84.4 72.1 60.5 53.4 67.2 56.1 72.31995 89.1 72.6 64.9 58.1 74.4 60.2 78.22000 100.0 80.3 71.4 64.2 79.7 67.0 81.5
Productivity1980 91.1 107.4 81.2 104.8 86.0 110.5 69.11989 95.5 105.4 92.3 104.3 91.4 103.7 78.01995 96.9 103.3 93.6 102.0 88.0 104.6 82.32000 100.0 106.8 95.9 102.3 89.3 102.5 86.9
Note: U.S. = 100.0 in 2000. Canada data begin in 1981

WORLD ECONOMICS • Vol. 4 • No. 4 • October–December 2003 155
Information Technology and the G7 Economies
Table 2: Growth Rate and Level in Output
Year U.S. Canada U.K. France Germany Italy Japan
Growth Rate (percentage)1980–1989 3.34 2.96 2.72 2.61 2.15 2.47 4.411989–1995 2.36 1.00 1.65 1.49 1.67 1.51 2.511995–2000 4.10 3.63 2.64 2.44 1.78 1.90 2.13
Level (billions of 2000 U.S. Dollars)1980 5403.9 599.2 913.7 931.9 1459.1 965.8 1711.21989 7301.8 759.1 1167.0 1178.6 1770.8 1206.1 2543.91995 8412.8 805.9 1288.6 1288.7 1957.1 1320.2 2956.92000 10326.2 966.5 1470.1 1456.1 2139.2 1452.2 3288.6
Level (U.S. = 100.0 in 2000)1980 52.3 5.8 8.8 9.0 14.1 9.4 16.61989 70.7 7.4 11.3 11.4 17.1 11.7 24.71995 81.5 7.8 12.5 12.5 19.0 12.8 28.62000 100.0 9.4 14.2 14.1 20.7 14.1 31.8
Note: Canada data begin in 1981
Table 3: Growth Rate and Level in Population
Year U.S. Canada U.K. France Germany Italy Japan
Growth Rate1980–1989 0.92 1.18 0.16 0.54 0.05 0.05 0.591989–1995 1.23 1.22 0.24 0.45 0.62 0.18 0.331995–2000 1.15 0.94 0.24 0.39 0.13 0.16 0.21
Level (millions)1980 227.7 24.8 56.3 55.1 78.3 56.4 116.81989 247.4 27.3 57.1 57.9 78.7 56.7 123.11995 266.3 29.4 58.0 59.4 81.7 57.3 125.62000 282.1 30.8 58.7 60.6 82.2 57.8 126.9
Level (U.S. = 100.0 in 2000)1980 80.7 8.8 20.0 19.5 27.8 20.0 41.41989 87.7 9.7 20.3 20.5 27.9 20.1 43.61995 94.4 10.4 20.5 21.1 28.9 20.3 44.52000 100.0 10.9 20.8 21.5 29.1 20.5 45.0
Note: Percentage, Canada data begin in 1981

156 WORLD ECONOMICS • Vol. 4 • No. 4 • October–December 2003
Dale W. Jorgenson
Table 4: Growth in Output and Input Per Capita and Productivity
Year U.S. Canada U.K. France Germany Italy Japan
Output per Capita1980–1989 2.42 1.77 2.56 2.07 2.10 2.42 3.821989–1995 1.13 –0.22 1.41 1.04 1.05 1.32 2.181995–2000 2.95 2.69 2.40 2.06 1.65 1.74 1.91
Input Per Capita1980–1989 1.89 2.01 1.14 2.13 1.41 3.13 2.471989–1995 0.90 0.10 1.18 1.41 1.71 1.18 1.291995–2000 2.31 2.03 1.91 2.00 1.36 2.14 0.83
Productivity1980–1989 0.53 –0.24 1.42 –0.06 0.69 –0.71 1.351989–1995 0.23 –0.32 0.23 –0.37 –0.64 0.15 0.891995–2000 0.64 0.66 0.49 0.06 0.29 –0.40 1.08
Note: Percentage, Canada data begin in 1981
Table 5: Levels of Capital Input and Capital Stock Per Capita and Capital Quality
Year U.S. Canada U.K. France Germany Italy Japan
Capital Input Per Capita1980 58.8 44.5 31.8 32.8 44.7 35.6 29.91989 74.7 54.2 41.8 50.7 62.5 63.4 42.31995 82.3 56.4 49.8 56.6 73.0 74.1 51.02000 100.0 63.2 54.2 61.6 85.2 89.4 58.4
Capital Stock Per Capita1980 77.2 42.5 25.3 36.4 60.4 36.2 77.41989 88.8 48.2 32.4 42.6 68.2 52.7 83.31995 92.5 49.4 37.1 47.2 77.3 62.6 88.72000 100.0 54.4 43.7 51.3 84.2 71.0 92.4
Capital Quality 1980 76.2 104.8 125.5 90.1 74.0 98.5 38.61989 84.0 112.5 128.8 119.2 91.6 120.4 50.81995 89.0 114.2 134.2 119.9 94.5 118.4 57.52000 100.0 116.3 124.1 120.1 101.2 125.8 63.2
Note: U.S. = 100.0 in 2000, Canada data begin in 1981
WORLD ECONOMICS • Vol. 4 • No. 4 • October–December 2003 157
Information Technology and the G7 Economies
Table 6: Levels of IT Capital Input and Capital Stock Per Capita andCapital Quality
Year U.S. Canada U.K. France Germany Italy Japan
IT Capital Input Per Capita1980 5.6 1.8 2.7 2.9 6.1 5.1 0.71989 22.5 6.1 10.0 10.1 17.9 16.2 5.41995 41.5 14.4 19.2 17.0 31.0 27.1 10.82000 100.0 33.1 45.3 30.7 56.0 49.9 32.5
IT Capital Stock Per Capita1980 11.0 5.3 2.2 3.6 5.7 4.3 3.51989 30.1 10.0 9.4 10.6 15.5 12.9 10.91995 49.5 13.9 18.8 18.7 27.6 23.1 19.22000 100.0 20.5 40.8 33.4 47.9 41.4 58.0
Capital Quality 1980 51.0 34.0 119.7 81.4 105.9 118.1 20.01989 74.7 61.3 105.6 95.2 115.7 125.1 49.81995 83.8 103.9 102.4 91.1 112.0 117.2 56.32000 100.0 161.0 111.0 91.9 116.8 120.5 55.9
Note: U.S. = 100.0 in 2000, Canada data begin in 1981
Table 7: Levels of Non-IT Capital Input and Capital Stock Per Capita andCapital Quality
Year U.S. Canada U.K. France Germany Italy Japan
Non-IT Capital Input Per Capita1980 74.9 55.4 38.1 37.6 52.1 42.1 39.51989 87.3 64.5 48.2 57.1 70.5 73.0 51.81995 90.8 64.0 56.0 62.9 80.4 83.2 60.42000 100.0 68.3 55.7 66.6 89.8 96.4 63.0
Non-IT Capital Stock Per Capita1980 82.9 44.7 27.3 38.3 63.8 38.5 83.31989 92.9 50.2 34.0 44.2 71.0 55.2 88.61995 95.0 51.0 38.3 48.6 79.7 64.8 93.72000 100.0 55.9 43.8 52.1 85.8 72.5 95.1
Capital Quality 1980 90.3 123.8 140.0 98.0 81.6 109.5 47.41989 94.0 128.6 141.6 129.2 99.3 132.3 58.41995 95.5 125.5 146.2 129.4 100.8 128.4 64.52000 100.0 122.1 127.1 127.9 104.7 132.9 66.3
Note: U.S. = 100.0 in 2000, Canada data begin in 1981

158 WORLD ECONOMICS • Vol. 4 • No. 4 • October–December 2003
Dale W. Jorgenson
Table 8: Growth in Capital Input and Capital Stock Per Capita andCapital Quality
Year U.S. Canada U.K. France Germany Italy Japan
Capital Input Per Capita1980–1989 2.65 2.46 3.03 4.85 3.72 6.42 3.861989–1995 1.61 0.65 2.94 1.83 2.61 2.59 3.131995–2000 3.91 2.30 1.68 1.69 3.07 3.74 2.68
Capital Stock Per Capita1980–1989 1.56 1.57 2.74 1.74 1.34 4.18 0.811989–1995 0.66 0.60 2.25 1.74 2.09 2.87 1.061995–2000 1.57 1.94 3.25 1.65 1.71 2.54 0.81
Capital Quality1980–1989 1.08 0.89 0.29 3.11 2.38 2.23 3.051989–1995 0.95 0.05 0.68 0.09 0.51 –0.27 2.061995–2000 2.34 0.37 –1.56 0.04 1.36 1.21 1.87
Note: Percentage, Canada data begin in 1981
Table 9: Growth in IT Capital Input and Capital Stock Per Capita and CapitalQuality
Year U.S. Canada U.K. France Germany Italy Japan
IT Capital Input Per Capita1980–1989 15.42 15.20 14.70 13.81 12.06 12.93 22.741989–1995 10.22 14.33 10.90 8.67 9.11 8.59 11.571995–2000 17.59 16.59 17.15 11.81 11.83 12.18 21.98
IT Capital Stock Per Capita1980–1989 11.18 7.83 16.08 12.07 11.08 12.29 12.611989–1995 8.32 5.53 11.42 9.40 9.65 9.68 9.521995–2000 14.05 7.83 15.53 11.66 10.99 11.63 22.10
Capital Quality1980–1989 4.24 7.37 –1.39 1.74 0.98 0.64 10.131989–1995 1.91 8.80 –0.52 –0.73 –0.54 –1.09 2.041995–2000 3.54 8.76 1.62 0.16 0.84 0.55 –0.12
Note: Percentage, Canada data begin in 1981

WORLD ECONOMICS • Vol. 4 • No. 4 • October–December 2003 159
Information Technology and the G7 Economies
Table 10: Growth in Non-IT Capital Input and Capital Stock Per Capita andCapital Quality
Year U.S. Canada U.K. France Germany Italy Japan
Non-IT Capital Input Per Capita1980–1989 1.71 1.90 2.60 4.65 3.37 6.11 3.001989–1995 0.64 –0.12 2.48 1.60 2.18 2.19 2.571995–2000 1.94 1.28 –0.09 1.16 2.22 2.94 0.86
Non-IT Capital Stock Per Capita1980–1989 1.26 1.43 2.47 1.59 1.19 4.01 0.681989–1995 0.37 0.29 1.95 1.58 1.93 2.68 0.941995–2000 1.03 1.82 2.71 1.39 1.48 2.25 0.29
Capital Quality1980–1989 0.45 0.47 0.13 3.07 2.18 2.10 2.321989–1995 0.27 –0.41 0.53 0.03 0.25 –0.49 1.641995–2000 0.91 –0.54 –2.80 –0.23 0.75 0.69 0.56
Note: Percentage, Canada data begin in 1981
Table 11: Levels of Labor Input and Hours Worked Per Capita andLabor Quality
Year U.S. Canada U.K. France Germany Italy Japan
Labor Input Per Capita1980 81.1 78.6 78.8 61.6 70.7 46.8 91.81989 91.9 89.8 77.8 56.5 71.2 51.4 104.81995 94.2 88.2 78.0 59.2 75.8 52.1 104.42000 100.0 96.5 86.5 66.9 75.9 54.8 102.1
Hours Worked Per Capita1980 89.7 95.1 92.8 78.2 73.9 60.0 116.91989 97.1 100.7 93.2 68.1 71.7 63.5 116.71995 95.9 95.1 89.6 65.4 73.8 62.2 109.92000 100.0 100.5 96.2 68.2 72.3 64.3 104.9
Labor Quality 1980 90.4 82.7 85.0 78.8 95.6 78.0 78.61989 94.7 89.2 83.5 82.9 99.3 80.9 89.91995 98.2 92.8 87.0 90.5 102.7 83.9 95.02000 100.0 96.0 89.9 98.1 105.0 85.2 97.3
Note: U.S. = 100.0 in 2000, Canada data begin in 1981

160 WORLD ECONOMICS • Vol. 4 • No. 4 • October–December 2003
Dale W. Jorgenson
Table 12: Growth in Labor Input and Hours Worked Per Capita andLabor Quality
Year U.S. Canada U.K. France Germany Italy Japan
Labor Input Per Capita1980–1989 1.38 1.67 –0.14 –0.97 0.08 1.03 1.471989–1995 0.41 –0.30 0.03 0.79 1.05 0.25 –0.081995–2000 1.20 1.79 2.07 2.44 0.03 1.00 –0.44
Hours Worked Per Capita1980–1989 0.87 0.72 0.05 –1.53 –0.33 0.62 –0.021989–1995 –0.21 –0.96 –0.65 –0.67 0.48 –0.36 –0.991995–2000 0.84 1.10 1.42 0.83 –0.42 0.68 –0.93
Labor Quality1980–1989 0.51 0.95 –0.19 0.57 0.41 0.40 1.501989–1995 0.61 0.65 0.67 1.46 0.57 0.61 0.921995–2000 0.36 0.69 0.65 1.60 0.44 0.32 0.49
Note: Percentage, Canada data begin in 1981
Table 13: Contribution of Total Capital, IT Capital and Non-IT Capital toOutput Growth
Year U.S. Canada U.K. France Germany Italy Japan
Total Capital1980–1989 1.46 1.62 1.34 2.93 1.39 2.52 1.851989–1995 1.15 0.81 1.29 1.36 1.33 1.10 1.471995–2000 2.08 1.51 0.83 1.21 1.41 1.63 1.18
IT Capital1980–1989 0.46 0.31 0.22 0.23 0.17 0.23 0.431989–1995 0.47 0.35 0.23 0.22 0.23 0.22 0.311995–2000 0.97 0.54 0.69 0.42 0.41 0.42 0.78
Non-IT Capital1980–1989 1.00 1.31 1.12 2.76 1.22 2.29 1.421989–1995 0.68 0.46 1.06 1.20 1.10 0.88 1.161995–2000 1.11 0.97 0.14 0.88 1.00 1.21 0.40
Note: Percentage. Contribution is growth rate times value share. Canada data begin in 1981

WORLD ECONOMICS • Vol. 4 • No. 4 • October–December 2003 161
Information Technology and the G7 Economies
Table 14: Contributions of Productivity from IT and Non-IT Production toOutput Growth
Year U.S. Canada U.K. France Germany Italy Japan
Productivity1980–1989 0.53 –0.24 1.42 –0.06 0.69 –0.71 1.351989–1995 0.23 –0.32 0.23 –0.37 –0.67 0.15 0.891995–2000 0.64 0.66 0.49 0.06 0.29 –0.40 1.08
Productivity from IT Production1980–1989 0.22 0.14 0.20 0.23 0.23 0.28 0.231989–1995 0.25 0.14 0.22 0.22 0.29 0.31 0.291995–2000 0.44 0.21 0.62 0.43 0.57 0.62 0.61
Productivity from Non-IT Production1980–1989 0.31 –0.38 1.22 –0.29 0.46 –0.99 1.121989–1995 –0.02 –0.46 0.01 –0.59 –0.96 –0.16 0.601995–2000 0.20 0.45 –0.13 –0.37 –0.28 –1.02 0.47
Note: Percentage. Canada data begin in 1981
Table 15: Sources of Output Growth
Year U.S. Canada U.K. France Germany Italy Japan
Output1980–1989 3.34 2.96 2.72 2.61 2.15 2.47 4.411989–1995 2.36 1.00 1.65 1.49 1.67 1.51 2.511995–2000 4.10 3.63 2.64 2.44 1.78 1.90 2.13
Labor1980–1989 1.35 1.57 –0.04 –0.26 0.07 0.66 1.201989–1995 0.98 0.51 0.13 0.50 1.00 0.26 0.141995–2000 1.38 1.46 1.32 1.18 0.08 0.67 –0.14
IT Capital1980–1989 0.46 0.31 0.22 0.23 0.17 0.23 0.431989–1995 0.47 0.35 0.23 0.22 0.23 0.22 0.311995–2000 0.97 0.54 0.69 0.42 0.41 0.42 0.78
Non-IT Capital1980–1989 1.00 1.31 1.12 2.76 1.22 2.29 1.421989–1995 0.67 0.46 1.06 1.20 1.10 0.88 1.161995–2000 1.11 0.97 0.14 0.88 1.00 1.21 0.40
Productivity from IT Production1980–1989 0.22 0.14 0.20 0.23 0.23 0.28 0.231989–1995 0.25 0.14 0.22 0.22 0.29 0.31 0.291995–2000 0.44 0.21 0.62 0.43 0.57 0.62 0.61
(continued)

162 WORLD ECONOMICS • Vol. 4 • No. 4 • October–December 2003
Dale W. Jorgenson
Table 15: Sources of Output Growth (continued)
Year U.S. Canada U.K. France Germany Italy Japan
Productivity from Non-IT Production1980–1989 0.31 –0.38 1.22 –0.29 0.46 –0.99 1.121989–1995 –0.02 –0.46 0.01 –0.59 –0.96 –0.16 0.601995–2000 0.20 0.45 –0.13 –0.37 –0.28 –1.02 0.47
Note: Percentage. Contributions. Canada data begin in 1981
Table 16: Sources of Labor Productivity Growth
Year U.S. Canada U.K. France Germany Italy Japan
Output1980–1989 3.34 2.96 2.72 2.61 2.15 2.47 4.411989–1995 2.36 1.00 1.65 1.49 1.67 1.51 2.511995–2000 4.10 3.63 2.64 2.44 1.78 1.90 2.13
Hours1980–1989 1.79 1.90 0.21 –0.99 –0.28 0.67 0.561989–1995 1.02 0.26 –0.41 –0.23 1.10 –0.17 –0.671995–2000 1.99 2.04 1.66 1.22 –0.29 0.85 –0.71
Labor Productivity1980–1989 1.55 1.06 2.51 3.60 2.43 1.80 3.841989–1995 1.34 0.74 2.06 1.72 0.57 1.68 3.171995–2000 2.11 1.59 0.98 1.22 2.07 1.06 2.84
IT Capital Deepening1980–1989 0.41 0.27 0.20 0.17 0.18 0.22 0.421989–1995 0.43 0.34 0.24 0.16 0.20 0.22 0.331995–2000 0.87 0.48 0.62 0.30 0.42 0.38 0.81
Non-IT Capital Deepening1980–1989 0.31 0.50 1.01 3.24 1.30 2.04 1.201989–1995 0.32 0.34 1.19 1.33 0.70 0.95 1.421995–2000 0.39 0.08 –0.50 0.20 1.11 0.90 0.66
Labor Quality1980–1989 0.30 0.53 –0.12 0.25 0.26 0.25 0.871989–1995 0.36 0.38 0.40 0.59 0.34 0.37 0.531995–2000 0.21 0.37 0.37 0.67 0.25 0.18 0.29
Productivity from IT Production1980–1989 0.22 0.14 0.20 0.23 0.23 0.28 0.231989–1995 0.25 0.14 0.22 0.22 0.29 0.31 0.291995–2000 0.44 0.21 0.62 0.43 0.57 0.62 0.61
Productivity from Non-IT Production1980–1989 0.31 –0.38 1.22 –0.29 0.46 –0.99 1.121989–1995 –0.02 –0.46 0.01 –0.59 –0.96 –0.16 0.601995–2000 0.20 0.45 –0.13 –0.37 –0.28 –1.02 0.47
Note: Percentage. Contributions. Canada data begin in 1981

WORLD ECONOMICS • Vol. 4 • No. 4 • October–December 2003 163
Information Technology and the G7 Economies
U.S.
%
Cana
daU.
K.Fr
ance
Germ
any
Italy
Japa
n
Figu
re 1
: Cap
ital I
nput
Con
trib
utio
n by
Cou
ntry
1980
–19
8919
95–
2000
1981
–19
8919
95–
2000
1980
–19
8919
95–
2000
1980
–19
8919
95–
2000
1980
–19
8919
95–
2000
1980
–19
8919
95–
2000
1980
–19
8919
95–
2000
0
0.51
1.52
2.53
Non-
IT
IT
164 WORLD ECONOMICS • Vol. 4 • No. 4 • October–December 2003
Dale W. Jorgenson
U.S.
%
Cana
daU.
K.Fr
ance
Germ
any
Italy
Japa
n
Figu
re 2
: Sou
rces
of P
rodu
ctiv
ity G
row
th b
y Co
untr
y
1980
–19
8919
95–
2000
1981
–19
8919
95–
2000
1980
–19
8919
95–
2000
1980
–19
8919
95–
2000
1980
–19
8919
95–
2000
1980
–19
8919
95–
2000
1980
–19
8919
95–
2000
IT Non-
IT
-1.5-1
-0.50
0.51
1.5

WORLD ECONOMICS • Vol. 4 • No. 4 • October–December 2003 165
Information Technology and the G7 Economies
U.S.
%
Cana
daU.
K.Fr
ance
Germ
any
Italy
Japa
n
Figu
re 3
: Sou
rces
of E
cono
my
Grow
th b
y Co
untr
y
1980
–19
8919
95–
2000
1981
–19
8919
95–
2000
1980
–19
8919
95–
2000
1980
–19
8919
95–
2000
1980
–19
8919
95–
2000
1980
–19
8919
95–
2000
1980
–19
8919
95–
2000
–2–1012345
Labo
urNo
n-IT
Cap
ital
IT C
apita
lNo
n-IT
Pro
duct
ivity
IT P
rodu
ctiv
ity

166 WORLD ECONOMICS • Vol. 4 • No. 4 • October–December 2003
Dale W. Jorgenson
U.S.
Annual contribution (%)
Cana
daU.
K.Fr
ance
Germ
any
Italy
Japa
n
Figu
re 4
: Sou
rces
of L
abor
Pro
duct
ivity
Gro
wth
by
Coun
try
1980
–19
8919
95–
2000
1981
–19
8919
95–
2000
1980
–19
8919
95–
2000
1980
–19
8919
95–
2000
1980
–19
8919
95–
2000
1980
–19
8919
95–
2000
1980
–19
8919
95–
2000
–2–101234
Labo
urNo
n-IT
Cap
ital
IT C
apita
lNo
n-IT
Pro
duct
ivity
IT P
rodu
ctiv
ity

WORLD ECONOMICS • Vol. 4 • No. 4 • October–December 2003 167
Information Technology and the G7 Economies
References
Abramovitz, Moses (1986), “Catching Up, Forging Ahead, and Falling Behind”,Journal of Economic History, Vol. 46, No. 2, June, pp. 385–406.
Baldwin, John R., and Tarek M. Harchaoui (2002), Productivity Growth in Canada –2002, Ottawa, Statistics Canada.
Baumol, William J. (1986), “Productivity Growth, Convergence, and Welfare”,American Economic Review, Vol. 76, No. 5, December, pp. 1072–1085.
Chamberlain, Gary (1984), “Panel Data”, in Zvi Griliches and Michael Intriligator,eds., Handbook of Econometrics, Vol. 2, pp. 1247–1318.
Christensen, Laurits R., Dianne Cummings, and Dale W. Jorgenson (1980),“Economic Growth, 1947–1973: An International Comparison”, in John W. Kendrickand Beatrice Vaccara, eds., New Developments in Productivity Measurement and Analysis,Chicago, University of Chicago Press, pp. 595–698.
——, —— and —— (1981), “Relative Productivity Levels, 1947–1973”, EuropeanEconomic Review, Vol. 16, No. 1, May, pp. 61–94.
Colecchia, Alessandra, and Paul Schreyer (2002), “ICT Investment and EconomicGrowth in the 1990s: Is the United States a Unique Case? A Comparative Study ofNine OECD Countries”, Review of Economic Dynamics, Vol. 5, No. 2, April 2002,pp. 408–442.
Denison, Edward F. (1967), Why Growth Rates Differ, Washington, The BrookingsInstitution.
Dougherty, Chrys, and Dale W. Jorgenson (1996), “International Comparisons of theSources of Economic Growth”, American Economic Review, Vol. 86, No. 2, May, pp. 25–29.
—— and —— (1997), “There Is No Silver Bullet: Investment and Growth in theG7”, National Institute Economic Review, No. 162, October, pp. 57–74.
Durlauf, Steven N., and Danny T. Quah (1999), “The New Empirics of EconomicGrowth”, in Taylor and Woodford, eds., pp. 235–310.
Heston, Alan, Robert Summers, and Bettina Aten (2002), Penn World Table Version 6.1,Philadelphia, Center for International Comparisons at the University of Pennsylvania(CICUP), October.
Islam, Nasrul (1995), “Growth Empirics”, Quarterly Journal of Economics, Vol. 110,No. 4, November, pp. 1127–1170.

168 WORLD ECONOMICS • Vol. 4 • No. 4 • October–December 2003
Dale W. Jorgenson
—— (2003), “What Have We Learned from the Convergence Debate?” Journal ofEconomic Surveys, Vol. 17, No. 3, July, pp. 309–362.
Jorgenson, Dale W. (2001), “Information Technology and the U.S. Economy”,American Economic Review, Vol. 91, No. 1, March, pp. 1–32.
Jorgenson, Dale W., and Kazuyuki Motohashi (2003), “Economic Growth of Japanand the U.S. in the Information Age”, Tokyo, Research Institute of Economy, Trade,and Industry, July.
Jorgenson, Dale W., and Kevin J. Stiroh (2000), “Raising the Speed Limit: U.S. EconomicGrowth in the Information Age”, Brookings Papers on Economic Activity, 1, pp. 125–211.
Jorgenson, Dale W., and Eric Yip (2000), “Whatever Happened to ProductivityGrowth?” in Charles R. Hulten, Edwin R. Dean, and Michael J. Harper, eds.,New Developments in Productivity Analysis, Chicago, University of Chicago Press,pp. 509–540.
Kravis, Irving B., Alan Heston, and Robert Summers (1978), International Comparisonsof Real Product and Purchasing Power, Baltimore, Johns Hopkins University Press.
Kuznets, Simon (1971), Economic Growth of Nations, Cambridge, Harvard University Press.
Maddison, Angus (1982), Phases of Capitalist Development, Oxford, Oxford University Press.
—— (1987), “Growth and Slowdown in Advanced Capitalist Economies: Techniquesof Quantitative Assessment”, Journal of Economic Literature, Vol.25, No. 2, June,pp. 649–698.
—— (1991), Dynamic Forces in Capitalist Development, Oxford, Oxford University Press.
—— (1995), Monitoring the World Economy, Paris, Organisation for EconomicCo-operation and Development.
—— (2001), The World Economy: A Millennial Perspective, Paris, Organisation forEconomic Co-operation and Development.
Mankiw, N. Gregory, David Romer, and David Weil (1992), “A Contribution to theEmpirics of Economic Growth”, Quarterly Journal of Economics, Vol. 107, No. 2, May,pp. 407–437.
McGrattan, Ellen, and James Schmitz (1999), “Explaining Cross-Country IncomeDifferences”, in Taylor and Woodford, eds., pp. 669–737.
Organization for Economic Co-operation and Development (2002), Purchasing PowerParities and Real Expenditures, 1999 Benchmark Year, Paris, Organization for EconomicCo-operation and Development.

WORLD ECONOMICS • Vol. 4 • No. 4 • October–December 2003 169
Information Technology and the G7 Economies
Oliner, Stephen D., and Daniel J. Sichel (2000), “The Resurgence of Growth in theLate 1990s: Is Information Technology the Story?” Journal of Economic Perspectives,Vol. 14, No. 4, Fall, pp. 3–22.
Romer, Paul (1987), “Crazy Explanations for the Productivity Slowdown”, in StanleyFischer, ed., NBER Macroeconomics Annual, Cambridge, The MIT Press, pp. 163–201.
Schreyer, Paul (2000), “The Contribution of Information and CommunicationTechnology to Output Growth: A Study of the G7 Countries”, Paris, Organisation forEconomic Co-operation and Development, May 23.
Solow, Robert M. (1970), Growth Theory: An Exposition, New York, Oxford University Press.
Summers, Robert, and Alan Heston (1991), “The Penn World Table (Mark 5): AnExpanded Set of International Comparisons, 1950–1988”, Quarterly Journal ofEconomics, Vol. 106, No. 2, May, pp. 327–368.
Taylor, John B., and Michael Woodford (1999), eds., Handbook of Macroeconomics,Vol. 1A, Amsterdam, North-Holland.
Triplett, Jack (1996), “High-Tech Industry Productivity and Hedonic Price Indices”,in Organization for Economic Co-operation and Development, Industry Productivity,Paris, Organization for Economic Co-operation and Development, pp. 119–142.
Van Ark, Bart, Johanna Melka, Nanno Mulder, Marcel Timmer, and Gerard Ypma(2002), ICT Investment and Growth Accounts for the European Union, 1980–2000,Brussels, European Commission, June.
Wyckoff, Andrew W. (1995), “The Impact of Computer Prices on InternationalComparisons of Productivity,” Economics of Innovation and New Technology, Vol. 3Nos. 3–4, pp. 277–93.
