information searches that solve problemsmajor finding: those who do turn to libraries have success,...
TRANSCRIPT
s
Information searches that solve problems
How people use the internet, libraries, and government agencies when they need help
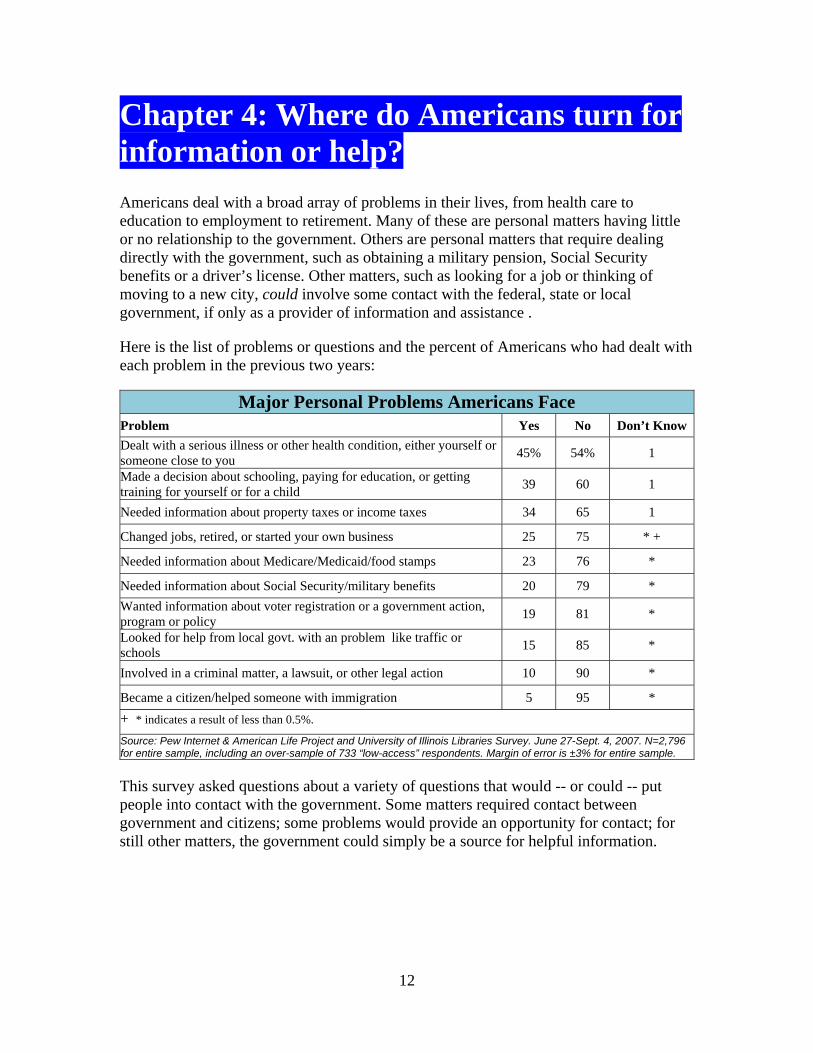
DECEMBER 30, 2007
Leigh Estabrook, Professor Emerita, University of Illinois-Urbana-Champaign
Evans Witt, CEO, PSRAI
Lee Rainie, Director, Pew Internet & American Life Project
Table of contents Executive Summary and Major Findings...........................................................................iii Acknowledgements ........................................................................................................... x Chapter 1: Libraries, Information, and the Internet ...........................................................1
A Portrait of Those with Low-access to the Internet ......................................................3 Views of those with Low-access..................................................................................28
Chapter 2: Americans in contact with their government....................................................6 78% of internet users have visited government websites..............................................7 How would American like to contact their governments? ..............................................8
Chapter 3: Who goes to Public Libraries?.........................................................................9 Chapter 4: Where do Americans turn for information or help?........................................12
What search strategies do Americans use for problem solving?.................................13 Specifically, how did they contact the government?....................................................16 Non-internet users who “use” the internet ...................................................................17
Chapter 5: Public Libraries step up.................................................................................18 Which problems drive people to libraries? ...............................................................19 The kind of help people got at libraries ....................................................................20 Did people get personal help at the library? ............................................................20 Why not go to the public library?..............................................................................21 Will the public library be a source in the future? ......................................................22
Chapter 6: Successful Encounters and Best Sources ....................................................23 Which sources provide the most? ...............................................................................24
Chapter 7: The Impact of Privacy Concerns on Information Seeking ............................26 Chapter 8: The Special Circumstances: Low-access to the Internet ..............................27 Chapter 8: Where Libraries stand ...................................................................................30 Methodology ……………………………………………………………………………………32
Summary - Page iii
Executive Summary This report emerges from a national survey that looks at how people use a variety of information sources to help them address some common problems that could be related in some way to government agencies and programs. The problems about which we queried included: dealing with a serious illness or health concern; making a decision about school enrollment, financing school, or upgrading work skills; dealing with a tax matter; changing a job or starting a business; and getting information about major programs such as Social Security, Medicare, and Medicaid. The survey’s major findings:
• The internet is a go-to source. In general, more people turn to the internet (at home, work, libraries or other places) than any other source of information and support, including experts and family members. There was some variance in the results, depending on the type of problem people faced. Experts mattered most when people faced health problems; government agencies topped the list when information about specific programs was the concern.
• Searchers usually end up satisfied. People tended to use two or three
information sources in their quest and they generally report good results, especially when they consult government agencies, librarians, and the internet.
• Libraries meet special needs. Young adults in Generation Y (age 18-29) are the
heaviest users of libraries when they face these problems. They are also the most likely library visitors for any purpose. Most of those who visit libraries to seek problem-solving information are very satisfied with what they find and they appreciate the resources available there, especially access to computers and the internet.
• Digital divides matter. Compared to those who have broadband connections,
people who do not use the internet or who only use dial-up connections have different problems and different search strategies when they face personal issues. We call this group the low-access population and they are less successful than those with high-access to the internet in getting the material they need to address these problems.
• Government documents should be created and delivered in all shapes and
sizes. A plurality of respondents said they prefer access to government documents on the internet, but significant numbers said they still would prefer to get printed government publications by mail or from government offices and libraries.
• E-government is not an option, it’s a necessity. The vast majority of Americans
want and expect information about government programs to be available on the internet. People have different preferences for dealing with government, depending on the issue they face. They prefer to use the internet for information

Summary - Page iv
queries, but they want to use the phone or face-to-face visits to address more personal matters.
Summary - Page v
Major Questions and Findings Americans deal with a complex array of issues and problems in their everyday lives –from health care to education to employment to retirement. Many of these problems require negotiating a bewildering bunch of information sources. This report focuses on some common problems that have connections to government agencies and programs.
We examine how people search for information when they face these problems and how they act on that information. Beyond that, we pay particular attention to the 36% of Americans who have limited access to the internet. They either do not have any internet access at all (23% of Americans), or they have no broadband at home or at work (another 13% of Americans). This research was particularly oriented towards helping librarians and government officials learn how their institutions currently serve this “low internet access” population. In all, 2,796 American adults were surveyed about these issues, and an oversample of 733 “low internet access” respondents is part of the survey. The overall sample has a margin of error of 2.5 percentage points for the whole sample and 3 points for the low-access sample.
Question 1) What sources of information do people consult when they need to address problems?
Major finding: More people turned to the internet than any other source of information and support, including experts, family members, government agencies, or libraries.
Respondents were asked whether they had encountered 10 possible problems in the previous two years, all of which had a potential connection to dealing with the government or seeking government information. The problems were: 1) dealing with a serious illness or health concern; 2) making a decision about school enrollment, financing school, or upgrading work skills; 3) dealing with a tax matter; 4) changing a job or starting a business; 5) getting information about Medicare, Medicaid, or food stamps; 6) getting information about Social Security or military benefits; 7) getting information about voter registration or a government policy; 8) seeking helping on a local government matter such as a traffic problem or schools; 9) becoming involved in a legal matter; and 10) becoming a citizen or helping another person with an immigration matter.
Respondents often had faced multiple problems so they were instructed to focus on the most recent episode they had experienced on the list. They were then asked where they went for help and the internet topped the list:
• 58% of those who had recently experienced one of those problems said they used the internet (at home, work, a public library or some other place) to get help.
• 53% said they turned to professionals such as doctors, lawyers or financial experts.
• 45% turned to friends and family members for advice and help. • 36% consult newspapers and magazines. • 34% directly contacted a government office or agency.
Summary - Page vi
• 16% consult television and radio. • 13% went to the public library.
Question 2) Which sources of information yield the most successful outcomes in these problem-solving searches? Major finding: Most people were successful in getting information to help them address a problem no matter what channel they chose and no matter what problem they faced. [A table of all results on success appears on page 15 of the main report.]
• 65% of those who approached the government for help said they were very successful.
• 64% of those who went to the public library were very successful. • 63% of those who used the internet were very successful.
The nature of the problem being solved did not much affect successful outcomes. Both simple and complex problems yielded similar results. The range for the very successful searches ran from 65% for those trying to get further educational help to 57% of those dealing with a health problem. All others fell in between. Question 3) Do public libraries play special roles in people’s lives as they try to solve problems?
Major finding: Those who do turn to libraries have success, and they appreciate all the resources available at libraries, especially access to computers and the internet. And those in Generation Y (age 18-30) were the most likely to turn to libraries for problem-solving information.
Faced with a problem in the past two years that they needed to address, about one in eight adults (13%) say they turned to their local public library for help and information. Here’s why:
• 65% of adults who went to a library for problem-solving help said that access to computers, particularly the internet, was key reason they go to the library for help. And 62% of adults who went to the library for help actually used the computers at the library.
• 58% of those with problems said they used library reference books. • 42% of those with problems said they perused library newspapers and magazines.
The problem that was most likely to be cited by those who went to libraries related to education – either making a decision about a school, getting more training, or finding financial resources. That reason was cited by 20% of the adults who went to libraries for help.
Asked whether they would go to a library in the future to help them solve problems, 40% of Gen Y said it was likely they would go, compared with 20% of those over age 30.
Summary - Page vii
Question 4) Who uses libraries, not just for problem solving, but for all purposes?
Major finding: 53% of American adults report going to a local public library in the past 12 months. The profile of library users shows an economically upscale, information hungry clientele who use the library to enhance their already-rich information world. Gen Y again leads the pack again. Public library patrons are generally younger adults, those with higher income and education levels, and those who are internet users. Parents with minor children living at home are very likely to be patrons. There are no significant differences in library usage by race and ethnicity. Question 5) How many people have encounters with government, whether to solve problems or address other matters?
Major finding: More than half of Americans contacted various branches of government in the past year. The most common method of contact was visiting a government office, followed by phoning a government agency.
Some 58% of Americans said they contacted any branch of government in the past year. Those who had contacted government were asked how they made the connection:
• 42% said they visited a government office. • 29% said they have called a government office. • 18% said they have sent an email to a government office or agency. • 13% say they have written a letter to the government.
Contact with the government is made across various levels of administration and not concentrated at one level. Twenty-seven percent of those who had contacted government in the previous year said they contacted local government, and the same percentage said they contacted state government. Slightly fewer, 23%, said they contacted the federal government. And 12% said they reached out to several different levels of government.
Question 6) If they had a choice, how would people prefer to interact with government?
Major finding: People’s preferences for dealing with government are driven by the nature of the problem they are trying to address – sometimes the internet is preferred; sometimes the phone; sometimes other kinds of contact such as face-to-face visits. [A full table of answers to the question on preferences is on page 9 of the main report.]
We asked respondents about six different kinds of problems or types of encounters they might have with government and how they would prefer to interact with officials if those problems emerged in their lives. It turns out that the path people would like to use depends on the kind of problem they are addressing.
• If they faced a personal tax question, a majority of respondents (57%) said they would prefer to use the phone to interact with government.
Summary - Page viii
• If they wanted to do research for school or work using government material, a substantial majority (66%) would prefer to use the internet.
• If they wanted to get a license or permit for their car, the majority (53%) would opt for doing it in person at a government office.
• If they wanted to learn about government benefits for themselves or another person, a plurality (46%) would prefer to do so online. Some 26% say they would use a phone and 25% would pick a different way, such as in-person encounters.
• If they wanted to learn about programs that various government agencies offer, a majority (55%) would prefer to use the internet.
• If they wanted to get information about community matters such as education, crime or traffic from government sources, 35% say they would pick the internet, 32% would pick a face-to-face encounter; and 26% would choose a phone call.
Question 7) As they deal with problems, do people with limited or no access to the internet have different needs and search strategies than those who have broadband connections? Major finding: Those in the low-access population – the 36% of adults who do not use the internet or only have dial-up connections – face health problems and matters related to government benefits at the same rate as those with high-access. But they do not face most other problems at the same level as those with high-access. The internet is not a factor in their searches and they rely more on television and radio than the high-access group. And they are less successful than those with high-access in getting the material they need.
• The low-access population is older, poorer, and less well-educated than the general population: 55% of low-access group live in households earning less than $40,000 a year, compared with 24% of the high-access group.
• 39% of the low-access group is age 63 or older: only 9% of the high-access group is in this age bracket.
• 64% of the low-access group has a high school education or less, compared with 33% of the high-access group.
Those in the low-access group are less likely to have interacted with government in the previous year or visited a library. Those with low-access are just as likely as those with high-access to have faced a health problem, or sought information about major government aid programs such as Medicare, Medicaid and Social Security. But they are much less likely than those who have high-access to say they had job-related matters enter their lives, or face an education-related problem, or deal with a tax question, or handle an immigration matter, or seek information about a local government concern. They are more likely than high-access users to say they consulted TV and radio as sources of information.
Those in the low-access cohort are less likely to report being very successful in their searches for help than those than those with high-access (54% v 63%). Broken down
Summary - Page ix
further within the low-access group, 61% of those with dial-up internet access said they were very successful, compared with 50% of those with no access at all. Question 8) Are privacy concerns a hindrance to use of government agencies, libraries, and the internet in problem solving? Major finding: About a fifth of Americans with problems to address said they were concerned about privacy disclosures as they hunted for information. These concerns influenced the method they ultimately chose for gathering information, and they were somewhat more pronounced for the low-access group. Some 19% of those who faced problems said that the fear of the disclosure of personal information played at least some role in the path they chose toward information or help. Those in the low-access group were somewhat more concerned than others. Question 9) How would people like to have access to government documents? Major finding: A plurality of Americans interviewed said that in the future, they would prefer to access government documents via the internet, but significant numbers said they would still prefer to get the printed form of government publications by mail or from government offices and libraries. The U.S. Government Printing Office provides citizens with documents in both print and digital forms and distributes them in many different ways. Americans have an appetite for access documents through all available options: Two in five Americans (40%) said they would prefer to get the government document on the internet, compared with 31% who would prefer it be sent via the mail. One in five (19%) would prefer to pick up the document at a government office and 6% said they would go to the local public library.
The low-access group more strongly favors print publications delivered in the traditional way: 46% would like the document by mail, 25% from the government office, 15% on the internet and 8% at the library.
Page x
Acknowledgements
About the Library Research Center, Graduate School for Library and Information Science, University of Illinois-Urbana-Champaign: The Graduate School of Library and Information Science is the top-ranked such school in the United States, according to U.S. News and World Report (2006). Established in 1961 to provide statistical support for state and public libraries, the Library Research Center focuses on library trends, community analyses for libraries and policy outcomes. Its clients include members of the publishing industry, library vendors, library associations, individual libraries, government agencies, foundation and others. Lauren C. Teffeau and Megan Mustafoff were especially helpful in development of this grant, survey, and report. Its website: http://lrc.lis.uiuc.edu/web/index.html
About the Pew Internet & American Life Project: The Project produces reports that explore the social impact of the internet on families, communities, work and home, daily life, education, health care, and civic and political life. Support for the project is provided by The Pew Charitable Trusts. The project is an initiative of the Pew Research Center. The project's website: www.pewinternet.org. Amy Tracy Wells was especially helpful in analyzing data and helping prepare the report. About Princeton Survey Research Associates International: PSRAI conducted the survey that is covered in this report. It is an independent research company specializing in social and policy work. The firm designs, conducts, and analyzes surveys worldwide. Its expertise also includes qualitative research and content analysis. With offices in Princeton, N.J. and Washington, D.C., PSRA serves the needs of clients around the nation and the world. The firm can be reached at 911 Commons Way, Princeton, NJ 08540, by telephone at 609-924-9204, by fax at 609-924-7499, or by email at [email protected]. Jonathan Best, Julie Gasior, Jennifer Su and Brian Kenney were critical to the collection and analysis of the survey. About the Institute for Museum and Library Services: Funding for this survey and report came from the IMLS under grant award number LG-06-05-0398-05. The IMLS is the primary source of federal support for the nation’s 122,000 libraries and 17,500 museums. The Institute's mission is to create strong libraries and museums that connect people to information and ideas. The Institute works at the national level and in coordination with state and local organizations to sustain heritage, culture, and knowledge; enhance learning and innovation; and support professional development. Its website is: http://www.imls.gov/index.shtm.
1
Chapter 1: Libraries, Information, and the Internet
For generations, public libraries have played a central role in providing a vast range of information to Americans. From the stacks of non-fiction books, to racks of newspapers and magazines, to shelves of reference materials and government documents, libraries have been the place to go to find answers to questions.
Over the last 15 years, the internet has challenged libraries’ traditional role by providing a seemingly limitless amount of information for only the price of an internet connection and a computer. Now from one’s own living room, it is possible to track down a government document, look up an article in the archives of a magazine, a traditional encyclopedia or even in the newest user-created encyclopedia, Wikipedia. Even asking for – and getting – help for all manner of questions or circumstances is now possible online, at any hour of the day or night.
Libraries have rushed to adapt themselves to the internet age, adding computers with digital catalogs of library holdings as well as free internet access. Libraries have worked to become the place to go for those who cannot afford a computer or an internet connection, or who need training or help in computer and internet literacy.
To explore this changing landscape, the Pew Internet & American Life Project and the University of Illinois partnered with funding from the U.S. Institute of Museum and Library Services1 to explore the role of libraries, the internet and other avenues in how Americans seek information and assistance on matters often related to the government, how well they succeed in their searches and how they see their efforts in the future.
The internet-user landscape
The partners administered a survey to 2,796 American adults to seek insights into the way they seek information and support when they have problems to solve or questions to confront, and how libraries fit into the overall search. Because those with less access to the internet are of particular interest to libraries, this survey includes an oversample of 733 interviews with those who have low-access to the internet – or no access at all. In sum, this survey provides a rich, in-depth look at how Americans of all incomes and educational levels find the help they need, and the role played by libraries and government agencies in those efforts.
1 OMB Clearance Number, expiration date 06.30.2010.
2
It is clear from previous work by the Pew Internet Project that the internet can play a major role in how people seek information about their everyday interests and help with their everyday needs (including those government-related interests and needs, which are the special focus of this report). Increasingly, those who lack full access to the internet may be hindered in their ability to simply keep up, as more information and services are offered online, and sometimes exclusively online.
Adoption of the internet is often not a simple, one-dimensional effort. One can go online from home, from work, and innumerable places in between. It is increasingly common for people to log on from school, from public libraries and other locales. Cell phones, Blackberries and iPhones allow users to go online while they are on the move.
The internet in America long ago moved from the province of the technology sophisticates to part of life in Main Street America.2 In this survey, a total of 76% of American adults (those age 18 and older) reported using the internet. And 24% say they do not use the internet.3 Fifty-nine percent of internet users go online at least once a day from home, and 43% say they use it that often from work.
The Pew Internet Project and other organizations have done much to explore the social and economic differences among those who have access to the internet and those who do not.4 It is increasingly clear that simple access to the internet is just one of several dimensions along which Americans differ in their technology use. The rapid evolution of the internet is putting an increasing premium on how fast one can access the internet. Those who have broadband or high-speed internet access at home use the internet more often and for different, richer purposes than those who have dial-up access at home.5
In this survey, 77% of the home internet users – or 55% of all Americans – have high speed access via cable modem, DSL, a wireless connection, a satellite link or some other way. Some 18% of home users say they have dial-up access and 5% said they had some other type of access or did not know the specifics of their access at home.
2 See A decade of adoption: How the internet has woven itself into American life, http://www.pewinternet.org/PPF/r/148/report_display.asp. 3 Respondents are asked if they use the internet, at least occasionally, and whether they send or receive email, at least occasionally. These are questions Q6a and Q6b in the questionnaire. 4 For example, Digital Divisions: Clear differences among those with broadband, dial-up, and no connections at all, http://www.pewinternet.org/PPF/r/165/report_display.asp. 5 See Home Broadband Adoption 2006: Going mainstream, Pew Internet and American Life Project, http://www.pewinternet.org/PPF/r/184/report_display.asp.
3
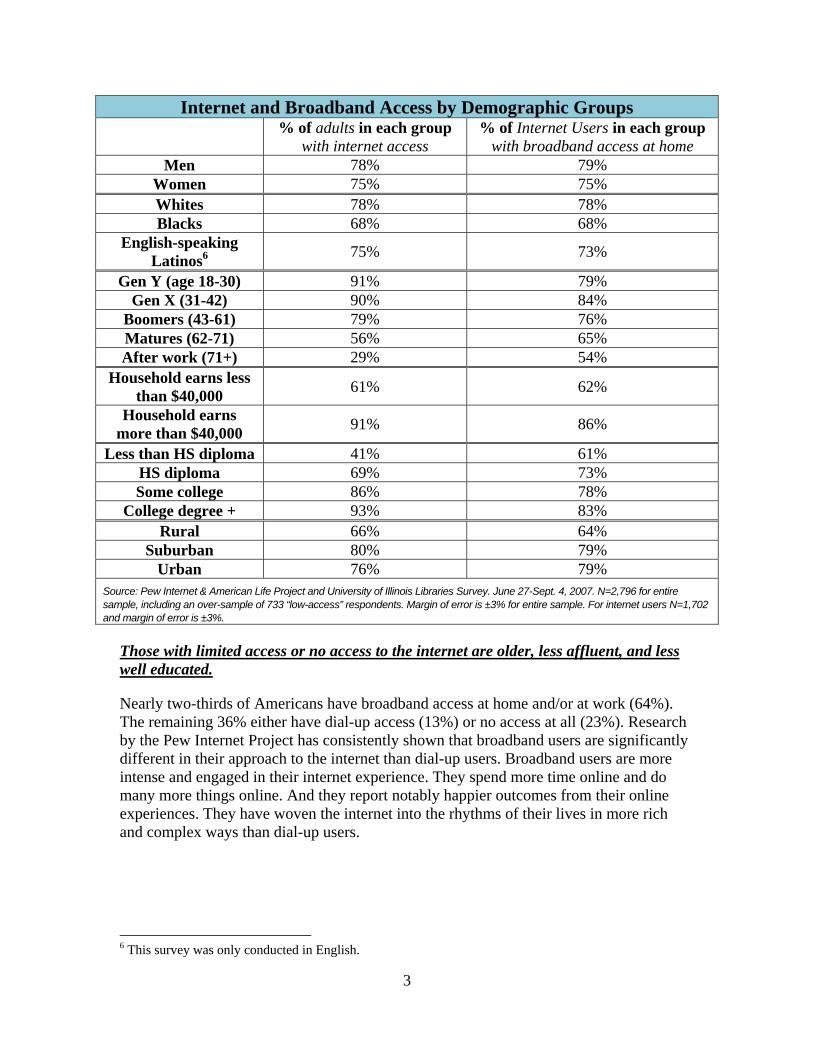
Internet and Broadband Access by Demographic Groups % of adults in each group
with internet access % of Internet Users in each group
with broadband access at home Men 78% 79%
Women 75% 75% Whites 78% 78% Blacks 68% 68%
English-speaking Latinos6 75% 73%
Gen Y (age 18-30) 91% 79% Gen X (31-42) 90% 84%
Boomers (43-61) 79% 76% Matures (62-71) 56% 65% After work (71+) 29% 54%
Household earns less than $40,000 61% 62%
Household earns more than $40,000 91% 86%
Less than HS diploma 41% 61% HS diploma 69% 73% Some college 86% 78%
College degree + 93% 83% Rural 66% 64%
Suburban 80% 79% Urban 76% 79%
Source: Pew Internet & American Life Project and University of Illinois Libraries Survey. June 27-Sept. 4, 2007. N=2,796 for entire sample, including an over-sample of 733 “low-access” respondents. Margin of error is ±3% for entire sample. For internet users N=1,702 and margin of error is ±3%.
Those with limited access or no access to the internet are older, less affluent, and less well educated.
Nearly two-thirds of Americans have broadband access at home and/or at work (64%). The remaining 36% either have dial-up access (13%) or no access at all (23%). Research by the Pew Internet Project has consistently shown that broadband users are significantly different in their approach to the internet than dial-up users. Broadband users are more intense and engaged in their internet experience. They spend more time online and do many more things online. And they report notably happier outcomes from their online experiences. They have woven the internet into the rhythms of their lives in more rich and complex ways than dial-up users.
6 This survey was only conducted in English.
4
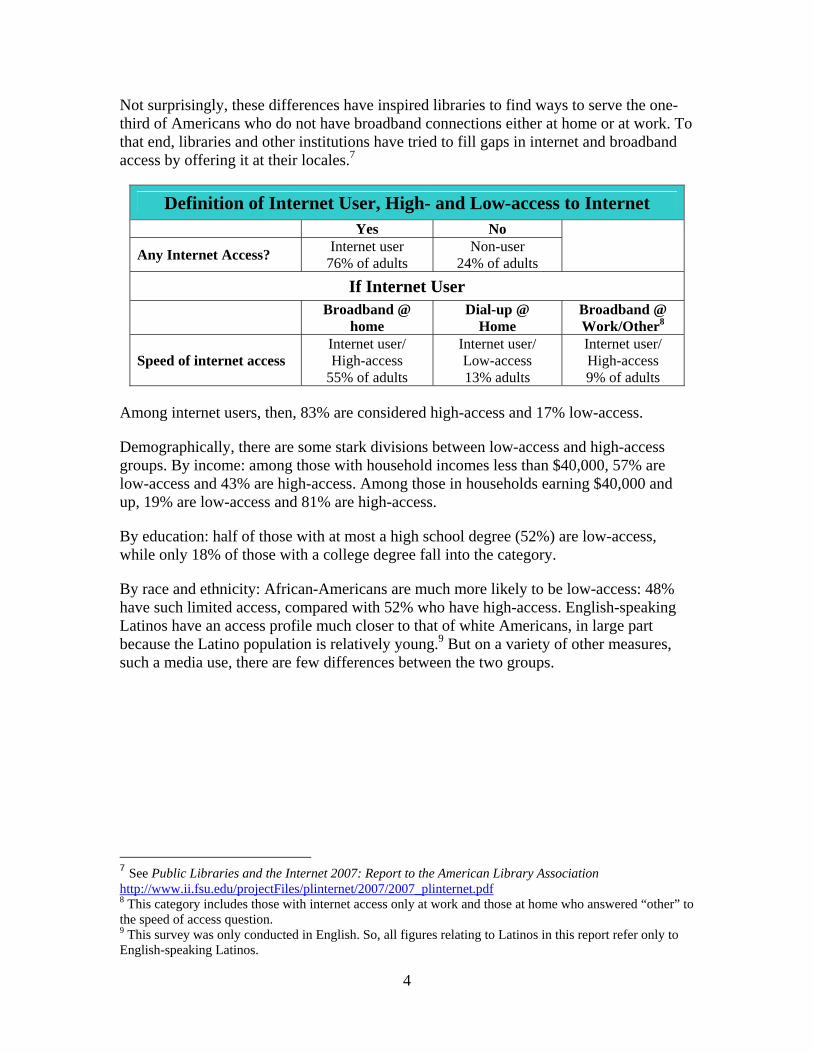
Not surprisingly, these differences have inspired libraries to find ways to serve the one-third of Americans who do not have broadband connections either at home or at work. To that end, libraries and other institutions have tried to fill gaps in internet and broadband access by offering it at their locales.7
Definition of Internet User, High- and Low-access to Internet Yes No
Any Internet Access? Internet user 76% of adults
Non-user 24% of adults
If Internet User
Broadband @ home
Dial-up @ Home
Broadband @ Work/Other8
Speed of internet access Internet user/ High-access
55% of adults
Internet user/ Low-access 13% adults
Internet user/ High-access 9% of adults
Among internet users, then, 83% are considered high-access and 17% low-access.
Demographically, there are some stark divisions between low-access and high-access groups. By income: among those with household incomes less than $40,000, 57% are low-access and 43% are high-access. Among those in households earning $40,000 and up, 19% are low-access and 81% are high-access.
By education: half of those with at most a high school degree (52%) are low-access, while only 18% of those with a college degree fall into the category.
By race and ethnicity: African-Americans are much more likely to be low-access: 48% have such limited access, compared with 52% who have high-access. English-speaking Latinos have an access profile much closer to that of white Americans, in large part because the Latino population is relatively young.9 But on a variety of other measures, such a media use, there are few differences between the two groups.
7 See Public Libraries and the Internet 2007: Report to the American Library Association http://www.ii.fsu.edu/projectFiles/plinternet/2007/2007_plinternet.pdf 8 This category includes those with internet access only at work and those at home who answered “other” to the speed of access question. 9 This survey was only conducted in English. So, all figures relating to Latinos in this report refer only to English-speaking Latinos.
5
Low-access to the Internet by Group Low-access (% of all adults) % of group in each category Total No Access Dial-up Only
High-access (% of all adults)
Household income less than $40,000 57% 39% 18% 43% Household income $40,000+ 19% 9% 10% 81% High School diploma or less 52% 39% 13% 48%
Some college 29% 15% 14% 71% College degree or more 18% 7% 11% 82%
African-Americans 48% 32% 16% 52% Generation Y (Age 18-30) 20% 9% 12% 80%
Generation X (31-42) 21% 10% 11% 79% Baby Boomers (43-61) 36% 21% 15% 64%
Matures (62-71) 61% 44% 17% 39% After Work (72+) 80% 71% 9% 20%
Source: Pew Internet & American Life Project and University of Illinois Libraries Survey. June 27-Sept. 4, 2007. N=2,796 for entire sample, including an over-sample of 733 “low-access” respondents.
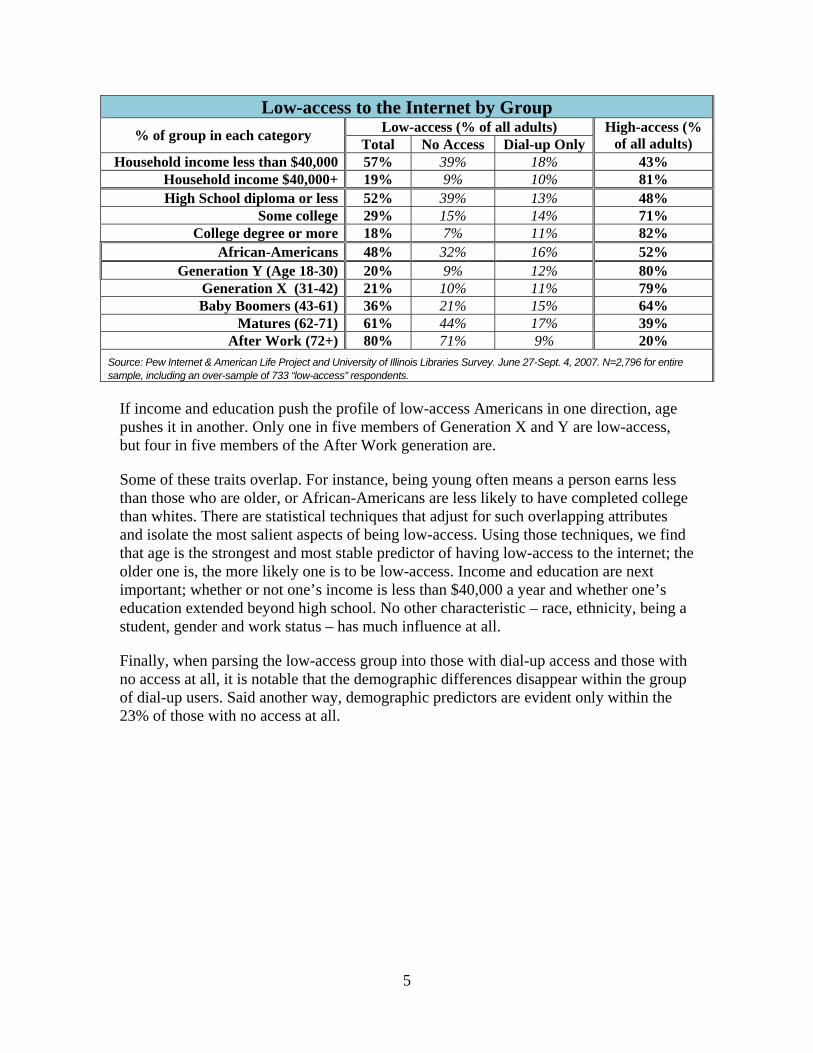
If income and education push the profile of low-access Americans in one direction, age pushes it in another. Only one in five members of Generation X and Y are low-access, but four in five members of the After Work generation are.
Some of these traits overlap. For instance, being young often means a person earns less than those who are older, or African-Americans are less likely to have completed college than whites. There are statistical techniques that adjust for such overlapping attributes and isolate the most salient aspects of being low-access. Using those techniques, we find that age is the strongest and most stable predictor of having low-access to the internet; the older one is, the more likely one is to be low-access. Income and education are next important; whether or not one’s income is less than $40,000 a year and whether one’s education extended beyond high school. No other characteristic – race, ethnicity, being a student, gender and work status – has much influence at all.
Finally, when parsing the low-access group into those with dial-up access and those with no access at all, it is notable that the demographic differences disappear within the group of dial-up users. Said another way, demographic predictors are evident only within the 23% of those with no access at all.
6
Chapter 2: Americans in contact with their government
At this time in internet history, e-government is evolving to offer information, help, and efficiencies of all sorts to citizens. Measuring citizen participation in e-government and evaluating its success and shortcomings so far can help point the way toward improved online services and to a more satisfied, and therefore involved, engaged citizenry.
This research was designed as a lens into this e-government moment in time. The report focuses on people’s problems that fall within the realm of government administration or concern. It examines how people seek to deal with these kinds of problems and solve these kinds of matters. In particular, it compares and contrasts the different ways (internet versus more traditional ways) people approach the government for the help they need.
A majority of Americans (58%) have contacted their government in some way during the past year. The methods for contacting the government varied. Some 42% of those who contacted the government say they visited an agency in person; about one in three (29%) say they called a government office; 18% say they sent an email to a government office or agency; and 13% say they wrote a letter to the government.
Americans reached out to different layers of government administration. Some 27% of those who say they contacted the government in the past year say they contacted their local government; another 27% say they contacted their state government. Slightly fewer – 23% – say they contacted the federal government. And 12% say they reached out to several different levels of government. About 10% of respondents either could not remember or would not say where they approached the government.
Members of minority groups are less likely to have contacted the government than others. Three in five white Americans (60%) say they have contacted their government in the past year, while 49% of minority adults have done the same.
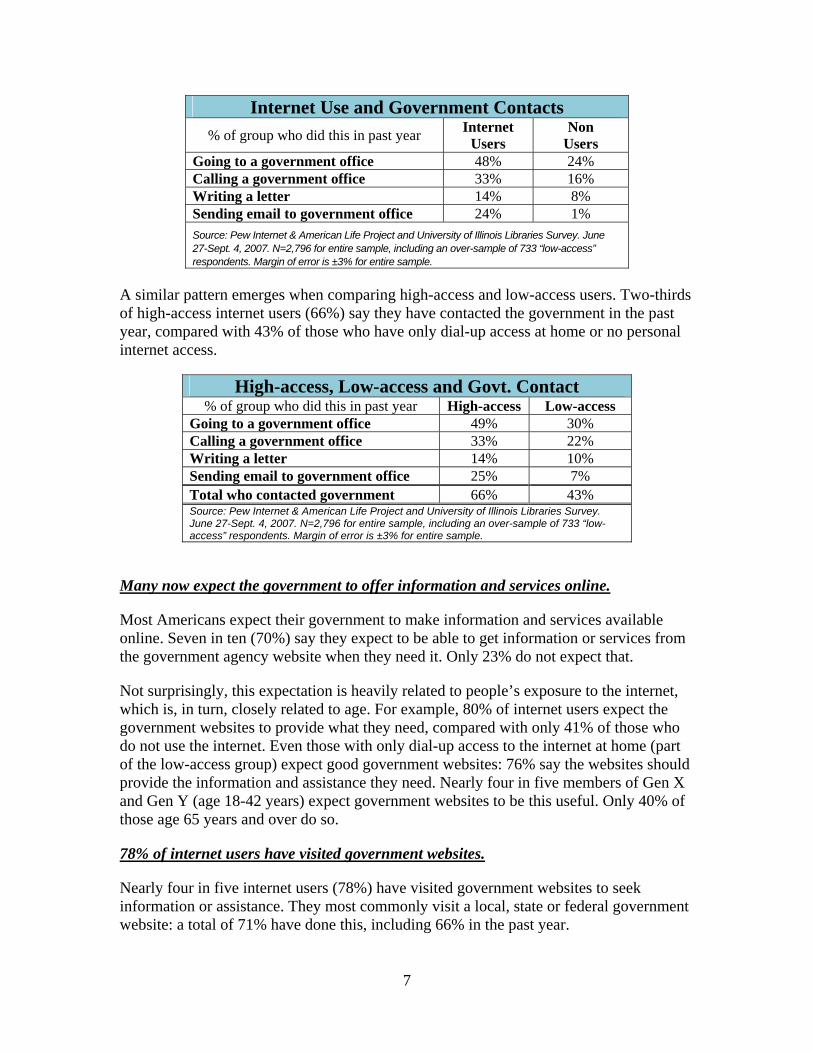
Internet users are much more likely to contact the government than non-users, whether or not they actually used the internet to make that contact. Two-thirds of internet users (65%) say they have contacted the government in the past year, compared with 36% of those who do not use the internet. Internet users double non-users in contacting the government offline as well. There are no certain causes in our data that explain this finding. Perhaps internet users, who are more highly educated than non-users, feel more confident using their research or problem-solving skills, or perhaps they are inclined to use multiple approaches in trying to accomplish their mission.
7
Internet Use and Government Contacts % of group who did this in past year Internet
Users Non
Users Going to a government office 48% 24% Calling a government office 33% 16% Writing a letter 14% 8% Sending email to government office 24% 1% Source: Pew Internet & American Life Project and University of Illinois Libraries Survey. June 27-Sept. 4, 2007. N=2,796 for entire sample, including an over-sample of 733 “low-access” respondents. Margin of error is ±3% for entire sample.
A similar pattern emerges when comparing high-access and low-access users. Two-thirds of high-access internet users (66%) say they have contacted the government in the past year, compared with 43% of those who have only dial-up access at home or no personal internet access.
High-access, Low-access and Govt. Contact % of group who did this in past year High-access Low-access
Going to a government office 49% 30% Calling a government office 33% 22% Writing a letter 14% 10% Sending email to government office 25% 7% Total who contacted government 66% 43% Source: Pew Internet & American Life Project and University of Illinois Libraries Survey. June 27-Sept. 4, 2007. N=2,796 for entire sample, including an over-sample of 733 “low-access” respondents. Margin of error is ±3% for entire sample.
Many now expect the government to offer information and services online.
Most Americans expect their government to make information and services available online. Seven in ten (70%) say they expect to be able to get information or services from the government agency website when they need it. Only 23% do not expect that.
Not surprisingly, this expectation is heavily related to people’s exposure to the internet, which is, in turn, closely related to age. For example, 80% of internet users expect the government websites to provide what they need, compared with only 41% of those who do not use the internet. Even those with only dial-up access to the internet at home (part of the low-access group) expect good government websites: 76% say the websites should provide the information and assistance they need. Nearly four in five members of Gen X and Gen Y (age 18-42 years) expect government websites to be this useful. Only 40% of those age 65 years and over do so.
78% of internet users have visited government websites.
Nearly four in five internet users (78%) have visited government websites to seek information or assistance. They most commonly visit a local, state or federal government website: a total of 71% have done this, including 66% in the past year.
8
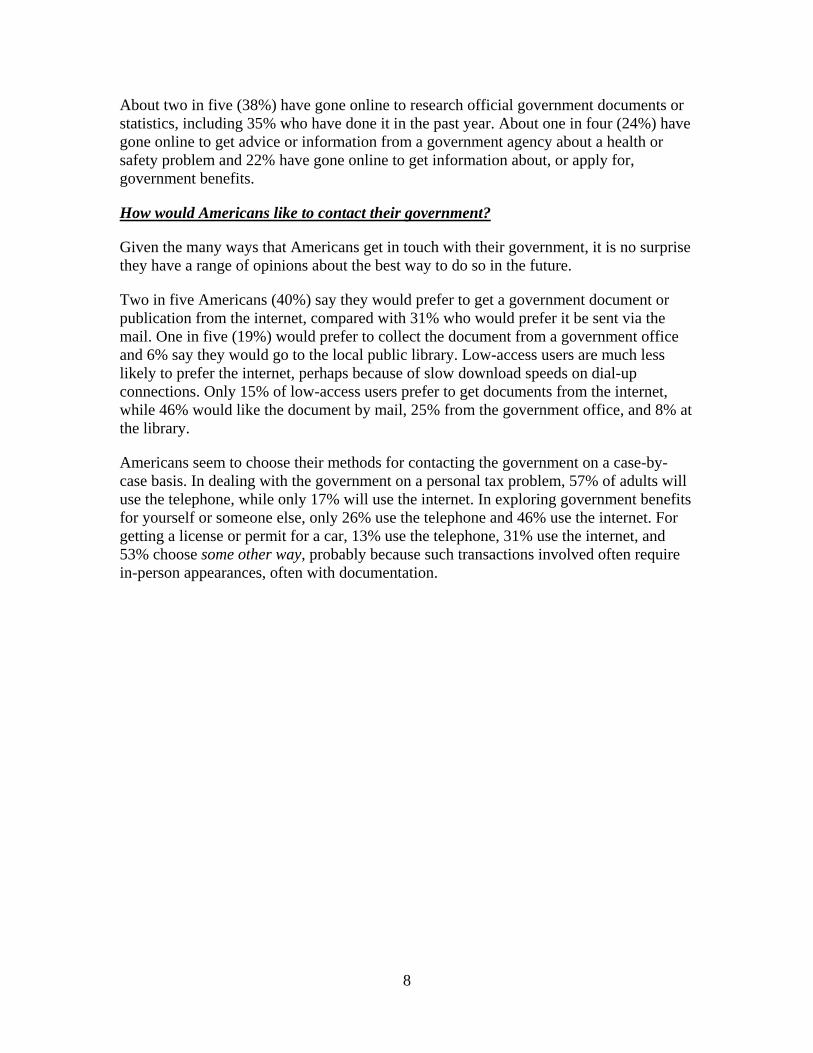
About two in five (38%) have gone online to research official government documents or statistics, including 35% who have done it in the past year. About one in four (24%) have gone online to get advice or information from a government agency about a health or safety problem and 22% have gone online to get information about, or apply for, government benefits.
How would Americans like to contact their government?
Given the many ways that Americans get in touch with their government, it is no surprise they have a range of opinions about the best way to do so in the future.
Two in five Americans (40%) say they would prefer to get a government document or publication from the internet, compared with 31% who would prefer it be sent via the mail. One in five (19%) would prefer to collect the document from a government office and 6% say they would go to the local public library. Low-access users are much less likely to prefer the internet, perhaps because of slow download speeds on dial-up connections. Only 15% of low-access users prefer to get documents from the internet, while 46% would like the document by mail, 25% from the government office, and 8% at the library.
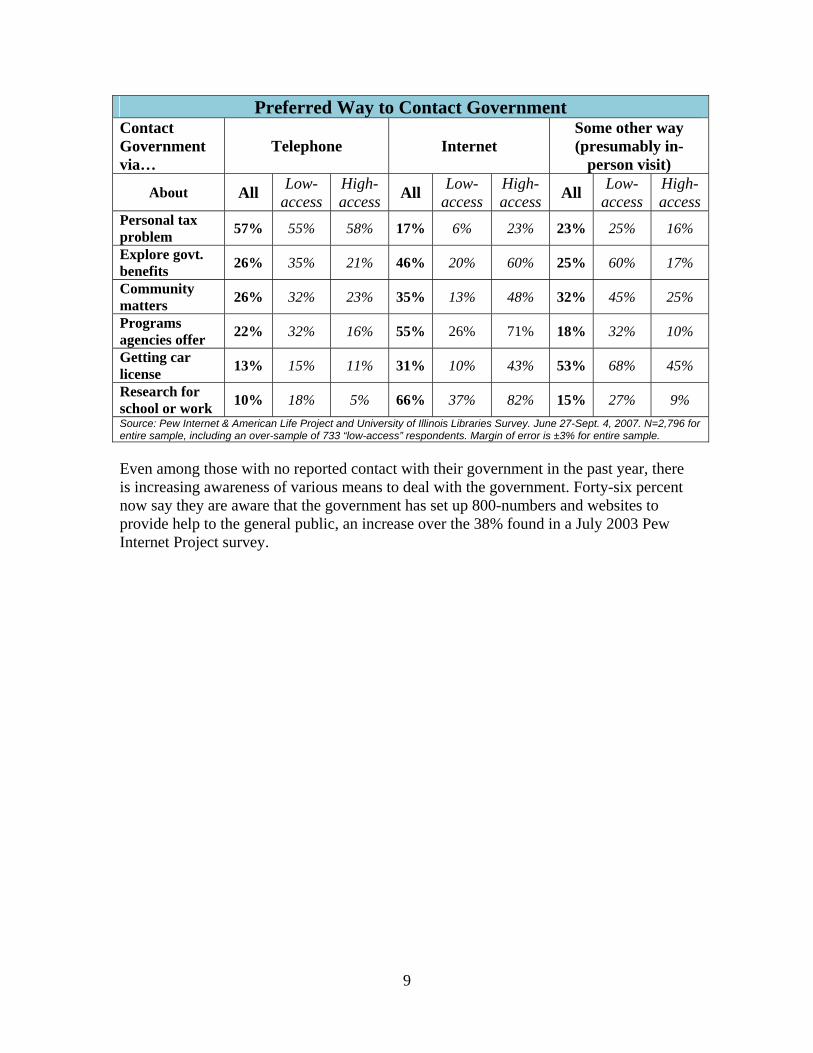
Americans seem to choose their methods for contacting the government on a case-by-case basis. In dealing with the government on a personal tax problem, 57% of adults will use the telephone, while only 17% will use the internet. In exploring government benefits for yourself or someone else, only 26% use the telephone and 46% use the internet. For getting a license or permit for a car, 13% use the telephone, 31% use the internet, and 53% choose some other way, probably because such transactions involved often require in-person appearances, often with documentation.
9
Preferred Way to Contact Government Contact Government via…
Telephone Internet Some other way (presumably in-
person visit)
About All Low-access
High-access All Low-
access High-access All Low-
access High-access
Personal tax problem 57% 55% 58% 17% 6% 23% 23% 25% 16%
Explore govt. benefits 26% 35% 21% 46% 20% 60% 25% 60% 17%
Community matters 26% 32% 23% 35% 13% 48% 32% 45% 25%
Programs agencies offer 22% 32% 16% 55% 26% 71% 18% 32% 10%
Getting car license 13% 15% 11% 31% 10% 43% 53% 68% 45%
Research for school or work 10% 18% 5% 66% 37% 82% 15% 27% 9% Source: Pew Internet & American Life Project and University of Illinois Libraries Survey. June 27-Sept. 4, 2007. N=2,796 for entire sample, including an over-sample of 733 “low-access” respondents. Margin of error is ±3% for entire sample. Even among those with no reported contact with their government in the past year, there is increasing awareness of various means to deal with the government. Forty-six percent now say they are aware that the government has set up 800-numbers and websites to provide help to the general public, an increase over the 38% found in a July 2003 Pew Internet Project survey.
10
Chapter 3: Who goes to Public Libraries?
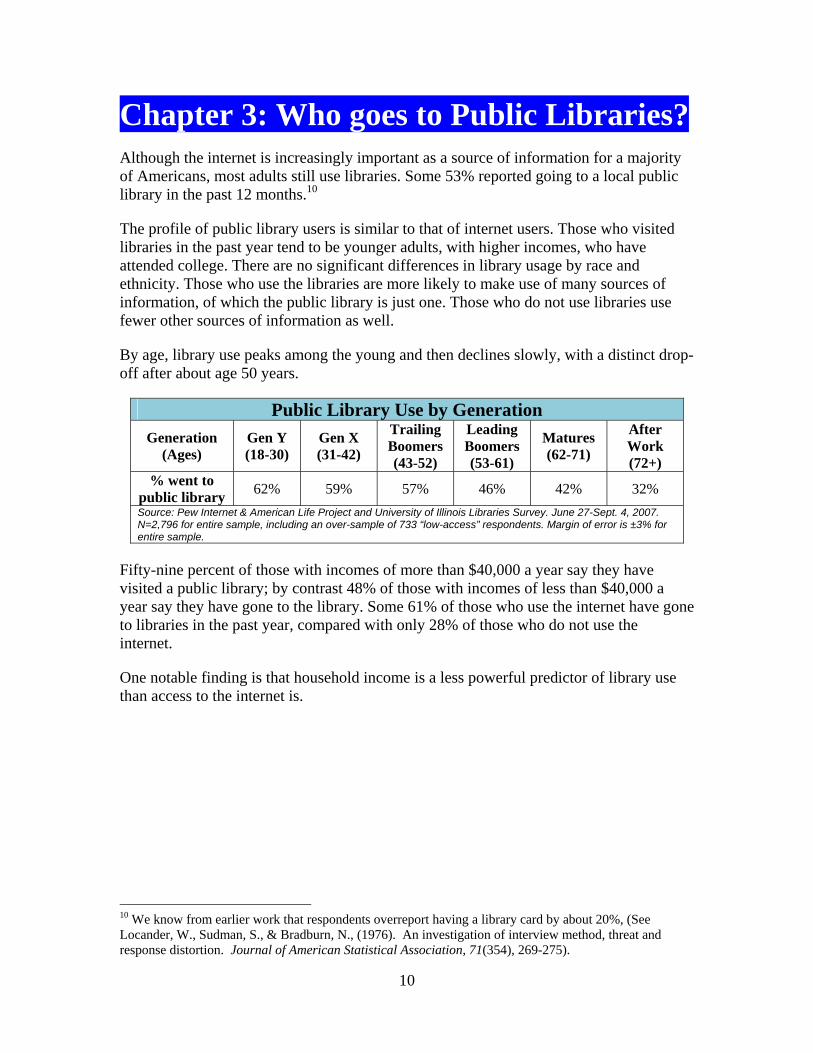
Although the internet is increasingly important as a source of information for a majority of Americans, most adults still use libraries. Some 53% reported going to a local public library in the past 12 months.10
The profile of public library users is similar to that of internet users. Those who visited libraries in the past year tend to be younger adults, with higher incomes, who have attended college. There are no significant differences in library usage by race and ethnicity. Those who use the libraries are more likely to make use of many sources of information, of which the public library is just one. Those who do not use libraries use fewer other sources of information as well.
By age, library use peaks among the young and then declines slowly, with a distinct drop-off after about age 50 years.
Public Library Use by Generation Generation
(Ages) Gen Y (18-30)
Gen X (31-42)
Trailing Boomers (43-52)
Leading Boomers (53-61)
Matures (62-71)
After Work (72+)
% went to public library 62% 59% 57% 46% 42% 32% Source: Pew Internet & American Life Project and University of Illinois Libraries Survey. June 27-Sept. 4, 2007. N=2,796 for entire sample, including an over-sample of 733 “low-access” respondents. Margin of error is ±3% for entire sample.
Fifty-nine percent of those with incomes of more than $40,000 a year say they have visited a public library; by contrast 48% of those with incomes of less than $40,000 a year say they have gone to the library. Some 61% of those who use the internet have gone to libraries in the past year, compared with only 28% of those who do not use the internet.
One notable finding is that household income is a less powerful predictor of library use than access to the internet is.
10 We know from earlier work that respondents overreport having a library card by about 20%, (See Locander, W., Sudman, S., & Bradburn, N., (1976). An investigation of interview method, threat and response distortion. Journal of American Statistical Association, 71(354), 269-275).
11
Percent Using Libraries by Income and Internet Access
HH Income less than $40,000
HH Income more than $40,000
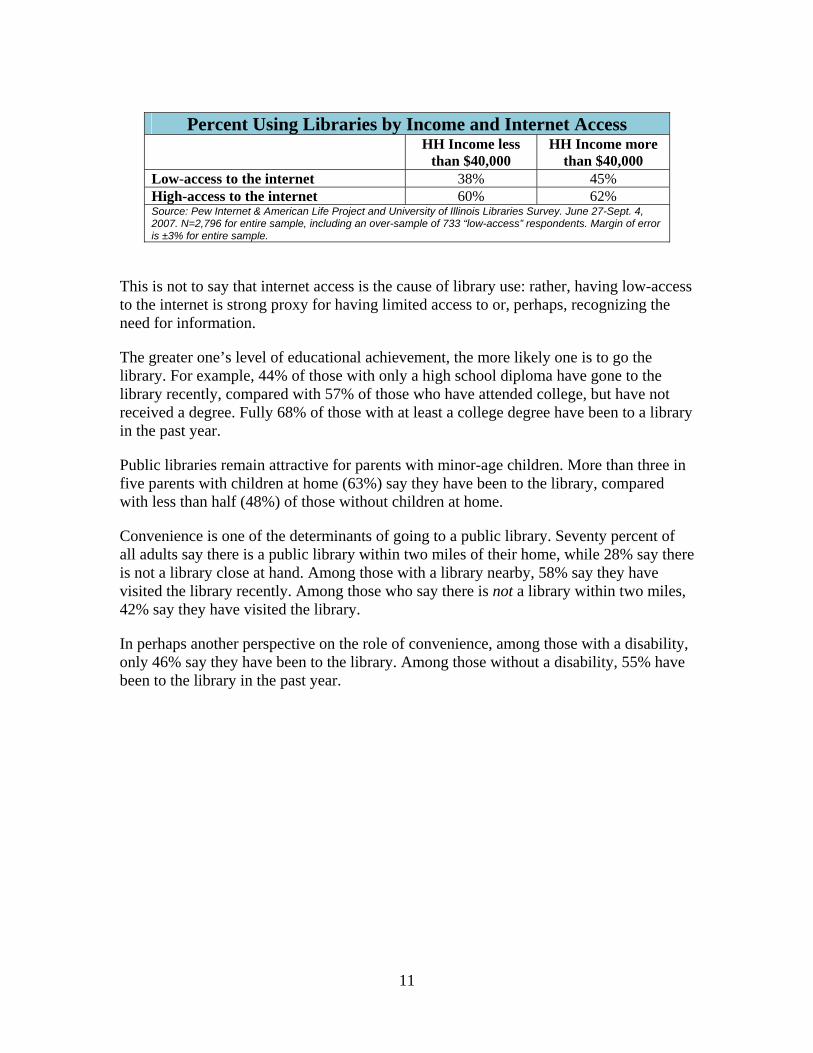
Low-access to the internet 38% 45% High-access to the internet 60% 62% Source: Pew Internet & American Life Project and University of Illinois Libraries Survey. June 27-Sept. 4, 2007. N=2,796 for entire sample, including an over-sample of 733 “low-access” respondents. Margin of error is ±3% for entire sample.
This is not to say that internet access is the cause of library use: rather, having low-access to the internet is strong proxy for having limited access to or, perhaps, recognizing the need for information.
The greater one’s level of educational achievement, the more likely one is to go the library. For example, 44% of those with only a high school diploma have gone to the library recently, compared with 57% of those who have attended college, but have not received a degree. Fully 68% of those with at least a college degree have been to a library in the past year.
Public libraries remain attractive for parents with minor-age children. More than three in five parents with children at home (63%) say they have been to the library, compared with less than half (48%) of those without children at home.
Convenience is one of the determinants of going to a public library. Seventy percent of all adults say there is a public library within two miles of their home, while 28% say there is not a library close at hand. Among those with a library nearby, 58% say they have visited the library recently. Among those who say there is not a library within two miles, 42% say they have visited the library.
In perhaps another perspective on the role of convenience, among those with a disability, only 46% say they have been to the library. Among those without a disability, 55% have been to the library in the past year.
12
Chapter 4: Where do Americans turn for information or help?
Americans deal with a broad array of problems in their lives, from health care to education to employment to retirement. Many of these are personal matters having little or no relationship to the government. Others are personal matters that require dealing directly with the government, such as obtaining a military pension, Social Security benefits or a driver’s license. Other matters, such as looking for a job or thinking of moving to a new city, could involve some contact with the federal, state or local government, if only as a provider of information and assistance .
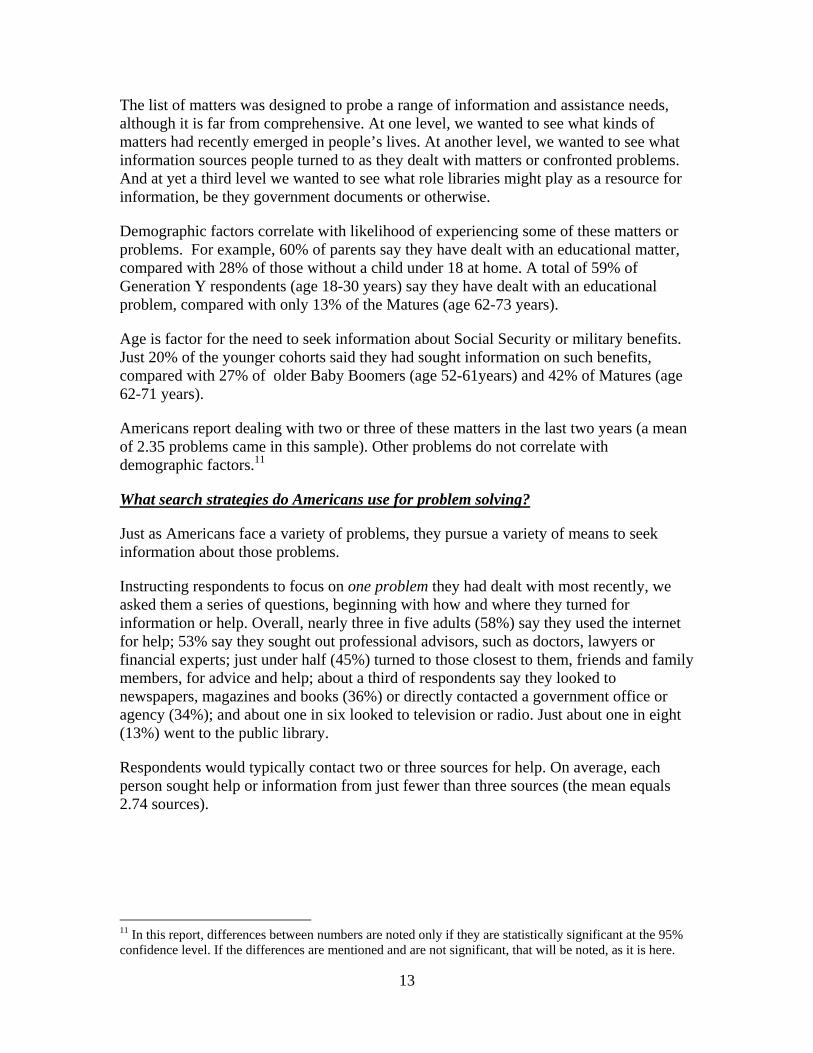
Here is the list of problems or questions and the percent of Americans who had dealt with each problem in the previous two years:
Major Personal Problems Americans Face Problem Yes No Don’t Know Dealt with a serious illness or other health condition, either yourself or someone close to you 45% 54% 1
Made a decision about schooling, paying for education, or getting training for yourself or for a child 39 60 1
Needed information about property taxes or income taxes 34 65 1
Changed jobs, retired, or started your own business 25 75 * +
Needed information about Medicare/Medicaid/food stamps 23 76 *
Needed information about Social Security/military benefits 20 79 * Wanted information about voter registration or a government action, program or policy 19 81 *
Looked for help from local govt. with an problem like traffic or schools 15 85 *
Involved in a criminal matter, a lawsuit, or other legal action 10 90 *
Became a citizen/helped someone with immigration 5 95 * + * indicates a result of less than 0.5%. Source: Pew Internet & American Life Project and University of Illinois Libraries Survey. June 27-Sept. 4, 2007. N=2,796 for entire sample, including an over-sample of 733 “low-access” respondents. Margin of error is ±3% for entire sample. This survey asked questions about a variety of questions that would -- or could -- put people into contact with the government. Some matters required contact between government and citizens; some problems would provide an opportunity for contact; for still other matters, the government could simply be a source for helpful information.
13
The list of matters was designed to probe a range of information and assistance needs, although it is far from comprehensive. At one level, we wanted to see what kinds of matters had recently emerged in people’s lives. At another level, we wanted to see what information sources people turned to as they dealt with matters or confronted problems. And at yet a third level we wanted to see what role libraries might play as a resource for information, be they government documents or otherwise.
Demographic factors correlate with likelihood of experiencing some of these matters or problems. For example, 60% of parents say they have dealt with an educational matter, compared with 28% of those without a child under 18 at home. A total of 59% of Generation Y respondents (age 18-30 years) say they have dealt with an educational problem, compared with only 13% of the Matures (age 62-73 years).
Age is factor for the need to seek information about Social Security or military benefits. Just 20% of the younger cohorts said they had sought information on such benefits, compared with 27% of older Baby Boomers (age 52-61years) and 42% of Matures (age 62-71 years).
Americans report dealing with two or three of these matters in the last two years (a mean of 2.35 problems came in this sample). Other problems do not correlate with demographic factors.11
What search strategies do Americans use for problem solving?
Just as Americans face a variety of problems, they pursue a variety of means to seek information about those problems.
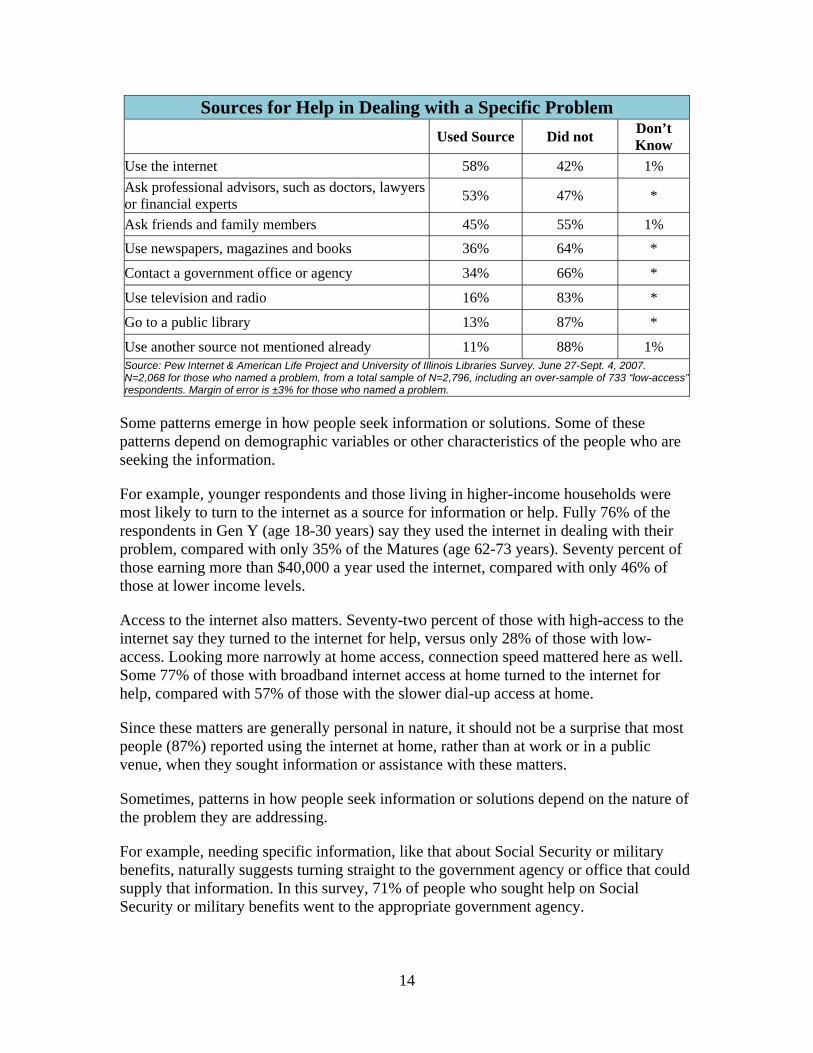
Instructing respondents to focus on one problem they had dealt with most recently, we asked them a series of questions, beginning with how and where they turned for information or help. Overall, nearly three in five adults (58%) say they used the internet for help; 53% say they sought out professional advisors, such as doctors, lawyers or financial experts; just under half (45%) turned to those closest to them, friends and family members, for advice and help; about a third of respondents say they looked to newspapers, magazines and books (36%) or directly contacted a government office or agency (34%); and about one in six looked to television or radio. Just about one in eight (13%) went to the public library.
Respondents would typically contact two or three sources for help. On average, each person sought help or information from just fewer than three sources (the mean equals 2.74 sources).
11 In this report, differences between numbers are noted only if they are statistically significant at the 95% confidence level. If the differences are mentioned and are not significant, that will be noted, as it is here.
14
Sources for Help in Dealing with a Specific Problem Used Source Did not Don’t
Know Use the internet 58% 42% 1% Ask professional advisors, such as doctors, lawyers or financial experts 53% 47% *
Ask friends and family members 45% 55% 1% Use newspapers, magazines and books 36% 64% *
Contact a government office or agency 34% 66% *
Use television and radio 16% 83% *
Go to a public library 13% 87% *
Use another source not mentioned already 11% 88% 1% Source: Pew Internet & American Life Project and University of Illinois Libraries Survey. June 27-Sept. 4, 2007. N=2,068 for those who named a problem, from a total sample of N=2,796, including an over-sample of 733 “low-access” respondents. Margin of error is ±3% for those who named a problem.
Some patterns emerge in how people seek information or solutions. Some of these patterns depend on demographic variables or other characteristics of the people who are seeking the information.
For example, younger respondents and those living in higher-income households were most likely to turn to the internet as a source for information or help. Fully 76% of the respondents in Gen Y (age 18-30 years) say they used the internet in dealing with their problem, compared with only 35% of the Matures (age 62-73 years). Seventy percent of those earning more than $40,000 a year used the internet, compared with only 46% of those at lower income levels.
Access to the internet also matters. Seventy-two percent of those with high-access to the internet say they turned to the internet for help, versus only 28% of those with low-access. Looking more narrowly at home access, connection speed mattered here as well. Some 77% of those with broadband internet access at home turned to the internet for help, compared with 57% of those with the slower dial-up access at home.
Since these matters are generally personal in nature, it should not be a surprise that most people (87%) reported using the internet at home, rather than at work or in a public venue, when they sought information or assistance with these matters.
Sometimes, patterns in how people seek information or solutions depend on the nature of the problem they are addressing.
For example, needing specific information, like that about Social Security or military benefits, naturally suggests turning straight to the government agency or office that could supply that information. In this survey, 71% of people who sought help on Social Security or military benefits went to the appropriate government agency.
15
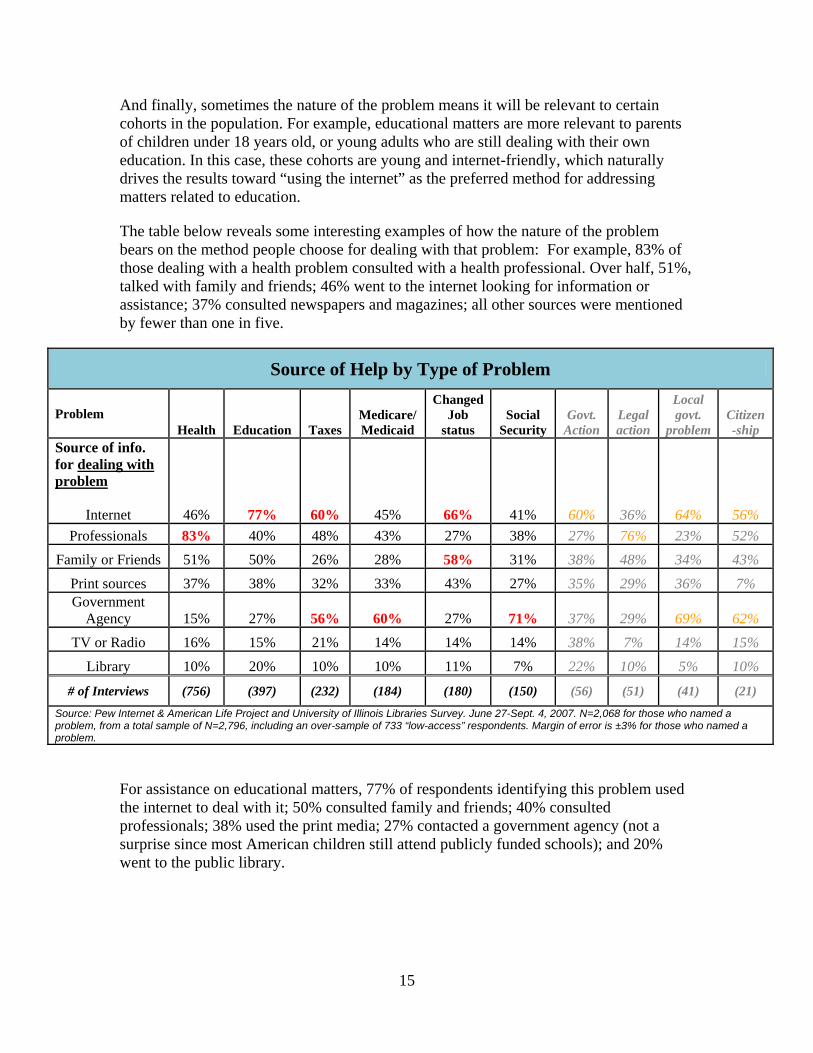
And finally, sometimes the nature of the problem means it will be relevant to certain cohorts in the population. For example, educational matters are more relevant to parents of children under 18 years old, or young adults who are still dealing with their own education. In this case, these cohorts are young and internet-friendly, which naturally drives the results toward “using the internet” as the preferred method for addressing matters related to education.
The table below reveals some interesting examples of how the nature of the problem bears on the method people choose for dealing with that problem: For example, 83% of those dealing with a health problem consulted with a health professional. Over half, 51%, talked with family and friends; 46% went to the internet looking for information or assistance; 37% consulted newspapers and magazines; all other sources were mentioned by fewer than one in five.
Source of Help by Type of Problem
Problem Health Education Taxes
Medicare/Medicaid
Changed Job
status Social
Security Govt.
Action Legal action
Local govt.
problem Citizen-ship
Source of info. for dealing with problem
Internet 46% 77% 60% 45% 66% 41% 60% 36% 64% 56% Professionals 83% 40% 48% 43% 27% 38% 27% 76% 23% 52%
Family or Friends 51% 50% 26% 28% 58% 31% 38% 48% 34% 43% Print sources 37% 38% 32% 33% 43% 27% 35% 29% 36% 7% Government
Agency 15% 27% 56% 60% 27% 71% 37% 29% 69% 62% TV or Radio 16% 15% 21% 14% 14% 14% 38% 7% 14% 15%
Library 10% 20% 10% 10% 11% 7% 22% 10% 5% 10%
# of Interviews (756) (397) (232) (184) (180) (150) (56) (51) (41) (21) Source: Pew Internet & American Life Project and University of Illinois Libraries Survey. June 27-Sept. 4, 2007. N=2,068 for those who named a problem, from a total sample of N=2,796, including an over-sample of 733 “low-access” respondents. Margin of error is ±3% for those who named a problem.
For assistance on educational matters, 77% of respondents identifying this problem used the internet to deal with it; 50% consulted family and friends; 40% consulted professionals; 38% used the print media; 27% contacted a government agency (not a surprise since most American children still attend publicly funded schools); and 20% went to the public library.
16
In dealing with property taxes or income taxes, 60% of those facing the problem say they went to the internet looking for help or assistance. That is roughly the same number as those who actually dealt with a government agency directly, 56%. Some 48% consulted the experts: professionals such as accountants, lawyers and tax advisers.
Those who were dealing with government programs such as Medicare, Medicaid and food stamps behave similarly to those needing information about Social Security and military benefits. In both cases, contacting the government agency topped both lists at 71% for Social Security and 60% for Medicare/Medicaid. The internet was second for both groups at 45% for Medicare/Medicaid and 41% for Social Security. Professionals were a close third for both groups.
In dealing with employment matters such as finding a job, retiring or starting a business, 66% of those facing the problem turned to the internet. Some 58% sought help from family and friends. This was the only problem where the print media, newspapers and magazines, played a major role: 43% of those dealing with employment matters used print media, despite the internet’s recent challenge to print as the traditional source of such information.
When Americans turn to the government for help with a specific problem
Just over one-third (34%) of respondents in this survey reported contacting the government – at some level – to look for information or assistance dealing with the specific problems included in this survey. (Overall, the number is much higher; when respondents are asked in a general way – not requiring them to think about a specific problem they dealt with recently. Some 58% of Americans say have contacted their government in the past year for some reason.)
When queried about the specific matters identified in this survey, respondents differed in their answers depending on their age. Specifically, 37% of those in the middle-age group, age 30-64 years, have sought help or information from the government, compared with 26% of those under age 30, and 27% of those age 65 and older. No other demographic variables were significant.
Specifically, how do Americans contact the government?
Calling a government office on the telephone is still the number one means that people report for seeking information or help (37%) with a specific problem. Reflecting the many options available today, using a combination of approaches – phone calls, visits, online actions or writing a letter – was the second most mentioned method, with 30% citing multiple methods of contact. Sixteen percent say they visited a government agency in person and 10% say they went to the agency website. Four percent say they sent an email and 1% say they sent a letter.
17
Education stands out as a factor potentially influencing how a person contacted a government office: only 18% of those with a high school education or less used multiple ways to contact the government versus 38% of those with at least a college degree. Income is also a major variable. Twenty-three percent of those with household incomes of under $40,000 say they visited a government office to seek help or get information, versus only 11% of those with higher incomes. Conversely, those in the lower income group were less likely to use a combination of communication channels (25%) compared with those making $40,000 and up (35%).
Access to the internet also seems to make an independent difference: 47% of those with low-access to the internet report calling a government office, while only 33% of those with a high-level of access to the internet report doing so. Conversely, only 21% of those with low-access report using a combination of means to contact the government, less than the 33% of those with high-access.
There are “non-internet users” who use the internet.
One of the lessons the Pew Internet Project has learned over the years is that those who say they are not internet users sometimes rely on others to go online for them. One in four non-internet users (27%) say they asked someone to use the internet to obtain assistance or information for them when dealing with one of the matters queried in this survey. This behavior does not seem to be identified with any demographic cohort, although the number of interviews in this group is relatively small and not conducive to making further conclusions. The data suggest that just one group does this frequently: parents who are not internet users themselves, but have children who are.
18
Chapter 5: Public Libraries step up
Libraries continue to fulfill their historic role as information centers and sources, even as the internet has made so much data available. At the same time the role of the library in helping people deal with one of the specific matters in this survey is changing.
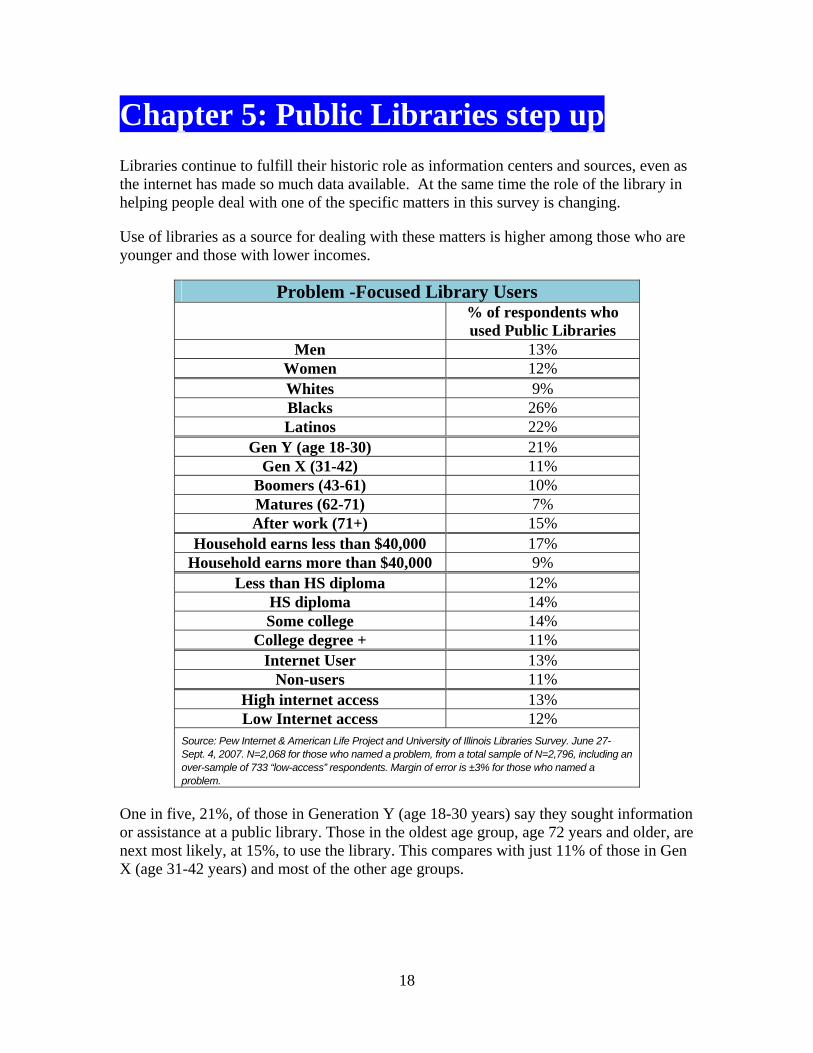
Use of libraries as a source for dealing with these matters is higher among those who are younger and those with lower incomes.
Problem -Focused Library Users % of respondents who
used Public Libraries Men 13%
Women 12% Whites 9% Blacks 26% Latinos 22%
Gen Y (age 18-30) 21% Gen X (31-42) 11%
Boomers (43-61) 10% Matures (62-71) 7% After work (71+) 15%
Household earns less than $40,000 17% Household earns more than $40,000 9%
Less than HS diploma 12% HS diploma 14% Some college 14%
College degree + 11% Internet User 13%
Non-users 11% High internet access 13% Low Internet access 12%
Source: Pew Internet & American Life Project and University of Illinois Libraries Survey. June 27-Sept. 4, 2007. N=2,068 for those who named a problem, from a total sample of N=2,796, including an over-sample of 733 “low-access” respondents. Margin of error is ±3% for those who named a problem.
One in five, 21%, of those in Generation Y (age 18-30 years) say they sought information or assistance at a public library. Those in the oldest age group, age 72 years and older, are next most likely, at 15%, to use the library. This compares with just 11% of those in Gen X (age 31-42 years) and most of the other age groups.
19
Income is also a significant variable: 17% of those with incomes under $40,000 say they went to the library, compared with only 9% of those with higher incomes. More than one in five African-Americans (26%) and Latinos (22%) went to the library, compared with 9% of white Americans.
But there were no differences by education or gender in problem-oriented library use. Nor were there were significant differences between internet users (13%) and non-users (11%); or between those with low-access to the internet (12%) and high-access to the internet (13%).
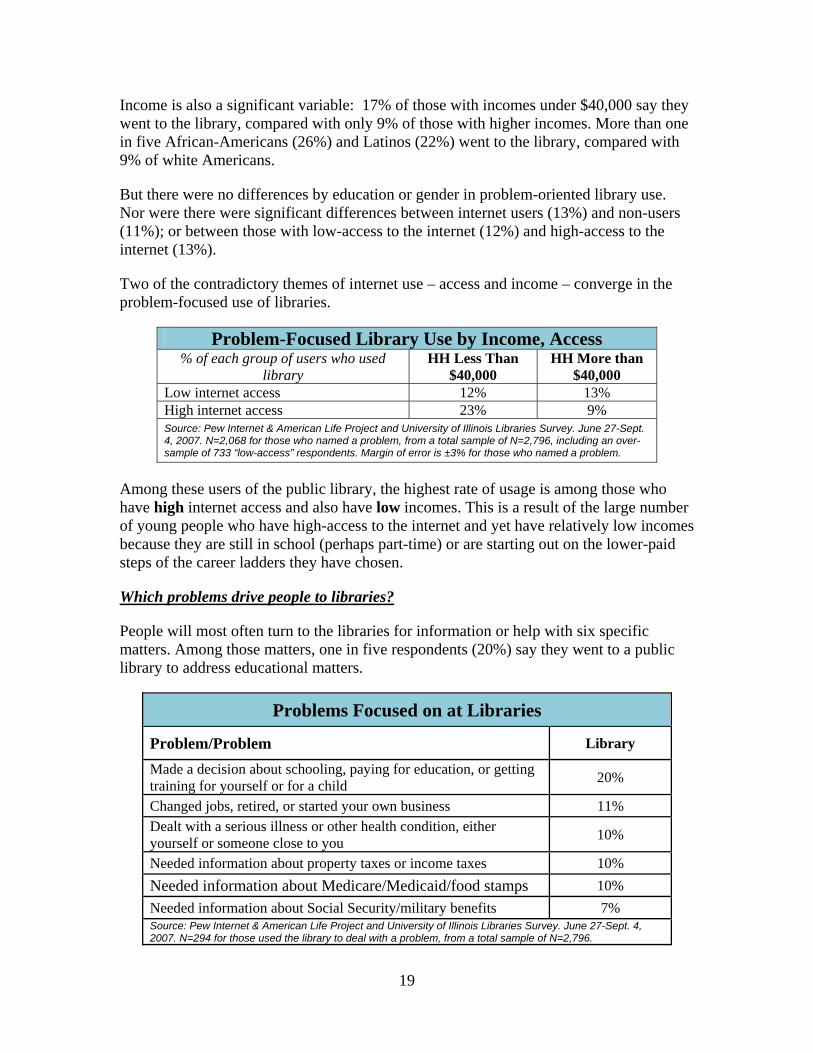
Two of the contradictory themes of internet use – access and income – converge in the problem-focused use of libraries.
Problem-Focused Library Use by Income, Access % of each group of users who used
library HH Less Than
$40,000 HH More than
$40,000 Low internet access 12% 13% High internet access 23% 9% Source: Pew Internet & American Life Project and University of Illinois Libraries Survey. June 27-Sept. 4, 2007. N=2,068 for those who named a problem, from a total sample of N=2,796, including an over-sample of 733 “low-access” respondents. Margin of error is ±3% for those who named a problem.
Among these users of the public library, the highest rate of usage is among those who have high internet access and also have low incomes. This is a result of the large number of young people who have high-access to the internet and yet have relatively low incomes because they are still in school (perhaps part-time) or are starting out on the lower-paid steps of the career ladders they have chosen.
Which problems drive people to libraries?
People will most often turn to the libraries for information or help with six specific matters. Among those matters, one in five respondents (20%) say they went to a public library to address educational matters.
Problems Focused on at Libraries
Problem/Problem Library
Made a decision about schooling, paying for education, or getting training for yourself or for a child 20%
Changed jobs, retired, or started your own business 11% Dealt with a serious illness or other health condition, either yourself or someone close to you 10%
Needed information about property taxes or income taxes 10% Needed information about Medicare/Medicaid/food stamps 10% Needed information about Social Security/military benefits 7% Source: Pew Internet & American Life Project and University of Illinois Libraries Survey. June 27-Sept. 4, 2007. N=294 for those used the library to deal with a problem, from a total sample of N=2,796.
20
About 10% went for help or information with changing job status, health, taxes and Medicare/Medicaid. Nearly as many, 7%, went to libraries with concerns about Social Security or military benefits.
Which resources do people use at libraries?
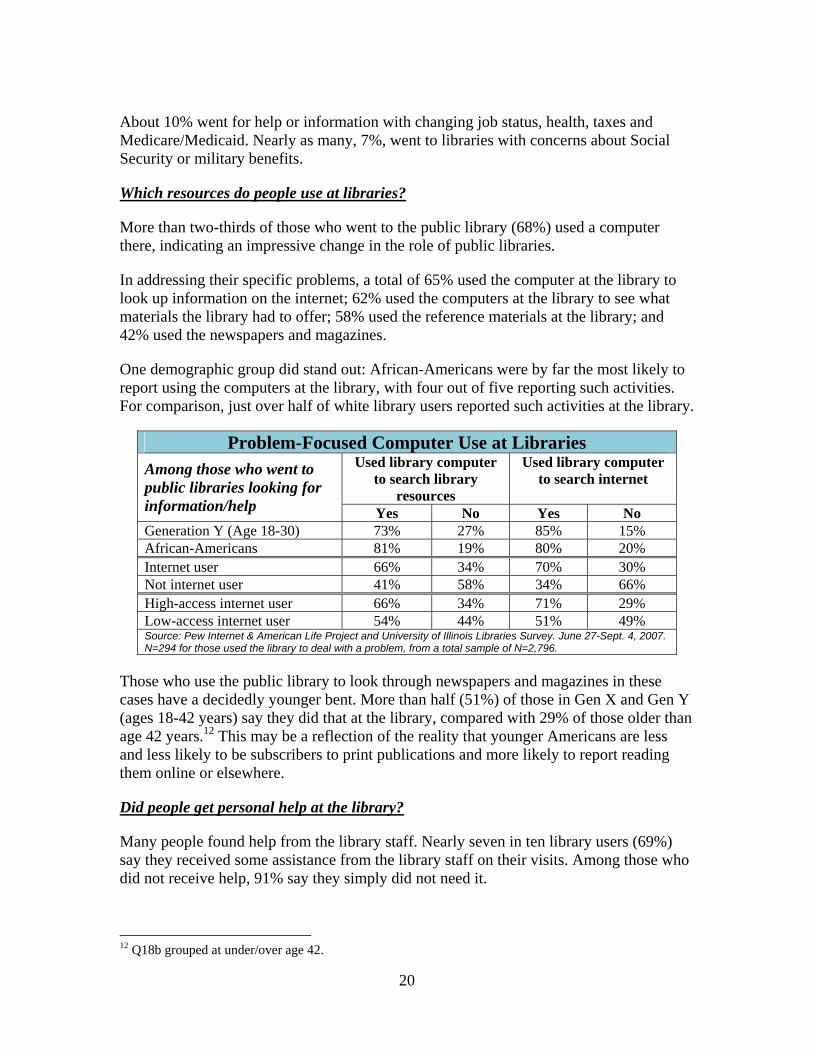
More than two-thirds of those who went to the public library (68%) used a computer there, indicating an impressive change in the role of public libraries.
In addressing their specific problems, a total of 65% used the computer at the library to look up information on the internet; 62% used the computers at the library to see what materials the library had to offer; 58% used the reference materials at the library; and 42% used the newspapers and magazines.
One demographic group did stand out: African-Americans were by far the most likely to report using the computers at the library, with four out of five reporting such activities. For comparison, just over half of white library users reported such activities at the library.
Problem-Focused Computer Use at Libraries Used library computer
to search library resources
Used library computer to search internet Among those who went to
public libraries looking for information/help Yes No Yes No Generation Y (Age 18-30) 73% 27% 85% 15% African-Americans 81% 19% 80% 20% Internet user 66% 34% 70% 30% Not internet user 41% 58% 34% 66% High-access internet user 66% 34% 71% 29% Low-access internet user 54% 44% 51% 49% Source: Pew Internet & American Life Project and University of Illinois Libraries Survey. June 27-Sept. 4, 2007. N=294 for those used the library to deal with a problem, from a total sample of N=2,796.
Those who use the public library to look through newspapers and magazines in these cases have a decidedly younger bent. More than half (51%) of those in Gen X and Gen Y (ages 18-42 years) say they did that at the library, compared with 29% of those older than age 42 years.12 This may be a reflection of the reality that younger Americans are less and less likely to be subscribers to print publications and more likely to report reading them online or elsewhere.
Did people get personal help at the library?
Many people found help from the library staff. Nearly seven in ten library users (69%) say they received some assistance from the library staff on their visits. Among those who did not receive help, 91% say they simply did not need it.
12 Q18b grouped at under/over age 42.
21
Thirty-nine percent of library users report receiving help on reference services and 38% report one-on-one instruction in using computers or the internet. Sixteen percent say they received help using printed materials. Six percent say they used an electronic or interactive help system and 4% say they received tutorials or took classes from library personnel. Seven percent reported using some other kind of assistance.
The library users who did receive help were quite satisfied. Nearly four in five (79%) say they were very satisfied with the assistance they received from the library staff, and 19% say there were satisfied. Only 1% said they were unsatisfied.
Library help is effective. Among those who received help at the library, 88% say they found a lot or some of what they were seeking, including 38% who say a lot. By contrast, among those who did not seek help at the library, only 53% found a lot or some of what they were seeking, including 29% who say a lot.
Libraries offered the most help to those seeking help on Social Security and military benefits, and also Medicare, Medicaid and food stamps. Fully 58% of those looking for help about Medicare and Medicaid and 54% of those looking for help on Social Security or military benefits found a lot of what they were seeking at the libraries. Those looking for help in other areas found the libraries slightly less productive; 40% of those working on employment matters found a lot of what they needed, compared with 39% dealing with health matters, 30% dealing with education and 28% dealing with taxes.
When people don’t go to the public library
If public libraries are good places for some people to find information and assistance, why don’t more people turn to them when addressing matters or problems?
One in ten people who faced one of these matters (10%) thought about going to the library but did not do so.13 This suggests that a key challenge for librarians is to make sure that those who consider the library as a potential problem-solving resource actually recognize they can use the library.
Those who considered going to the library, but ultimately chose not to, are similar in many respects to those who did go to the library. One group that stands out is that 30% of the Latinos thought about going to the library but did not, in contrast to 10% of the overall population who behaved likewise.
Among those who chose not to use the library, 13% obtained the information or assistance elsewhere; 11% found the information online at home; 11% had the information at home; 10% found the information online somewhere besides home or the library. The rest had other reasons for not using the library, including inconvenience of using the library, a shortage of library holdings, a dislike for libraries, and other miscellaneous reasons.
13 This equals 14% of those who did not use the library in seeking a solution to their problem.
22
Will the public library be a strong resource in the future?
Twelve percent of respondents say it is very likely they would go to the public library in the future for information or assistance in dealing with a problem, and 17% say they are somewhat likely to do so. Another 17% say they are somewhat unlikely to go to the public library and 54% say they are very unlikely to go in the future.
Fortunately for the public libraries, their potential customers skew toward the younger age group. Fully 40% of those in Gen Y (age 18-30 years) say they are very likely or somewhat likely to go to the public library if faced with a problem in the future, compared with 25% of older respondents from Gen X (age 31-41 years). Income is also a determinant: 41% of those earning less than $40,000 a year say they are likely to use the library, compared with 22% of those with higher incomes.
Among minority groups, the libraries are attractive: half of the African-Americans (50%) and 42% of the Latinos say they are likely to turn to the library, compared with 24% of white Americans.
23
Chapter 6: Successful Encounters, Best Sources
Overall, Americans overwhelmingly report that they were successful at finding the information or assistance they needed to deal with a particular problem. Three in five, 60%, report they were very successful and 29% report they were somewhat successful.
Self-reporting on success varied according to income and degree of internet access. Higher income means higher reporting of success: Among those with household incomes over $40,000 a year, 93% reported they were very successful in their search, including 64% who were very successful. In the lower income group, 84% report being successful in their search, with 52% reporting very successful.
Similarly, greater internet access means higher reporting of success: Among those with high internet access, 93% say they were successful, including 63% who report being very successful in their search. In the low-access group 82% report success, including 54% who are very successful.
The inter-related factors of income, internet access and education are related to greater success in dealing with these personal problems. Contrary to what one might expect, success is not necessarily related to using more sources of help. While the data is far from definitive, it appears that greater efficiency at identifying and getting assistance from various sources is what leads those with higher incomes and greater internet access to greater success.
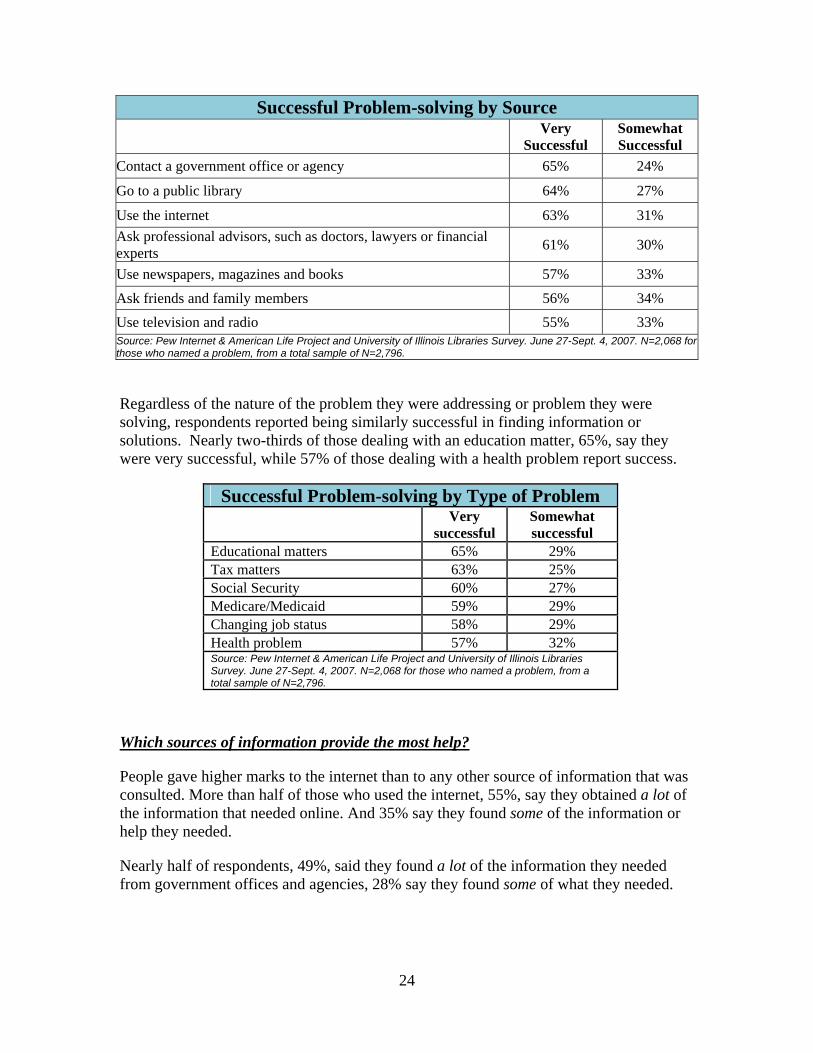
Contacting the government, going to a public library and using the internet are the three sources most related to being successful in addressing matters or problems. In each case, about two-thirds of people reported that they were successful in their efforts: 65% for contacting a government agency or office, 64% using the library and 63% using the internet.
24
Successful Problem-solving by Source Very
Successful Somewhat Successful
Contact a government office or agency 65% 24%
Go to a public library 64% 27%
Use the internet 63% 31% Ask professional advisors, such as doctors, lawyers or financial experts 61% 30%
Use newspapers, magazines and books 57% 33%
Ask friends and family members 56% 34% Use television and radio 55% 33% Source: Pew Internet & American Life Project and University of Illinois Libraries Survey. June 27-Sept. 4, 2007. N=2,068 for those who named a problem, from a total sample of N=2,796.
Regardless of the nature of the problem they were addressing or problem they were solving, respondents reported being similarly successful in finding information or solutions. Nearly two-thirds of those dealing with an education matter, 65%, say they were very successful, while 57% of those dealing with a health problem report success.
Successful Problem-solving by Type of Problem
Very
successful Somewhat successful
Educational matters 65% 29% Tax matters 63% 25% Social Security 60% 27% Medicare/Medicaid 59% 29% Changing job status 58% 29% Health problem 57% 32% Source: Pew Internet & American Life Project and University of Illinois Libraries Survey. June 27-Sept. 4, 2007. N=2,068 for those who named a problem, from a total sample of N=2,796.
Which sources of information provide the most help?
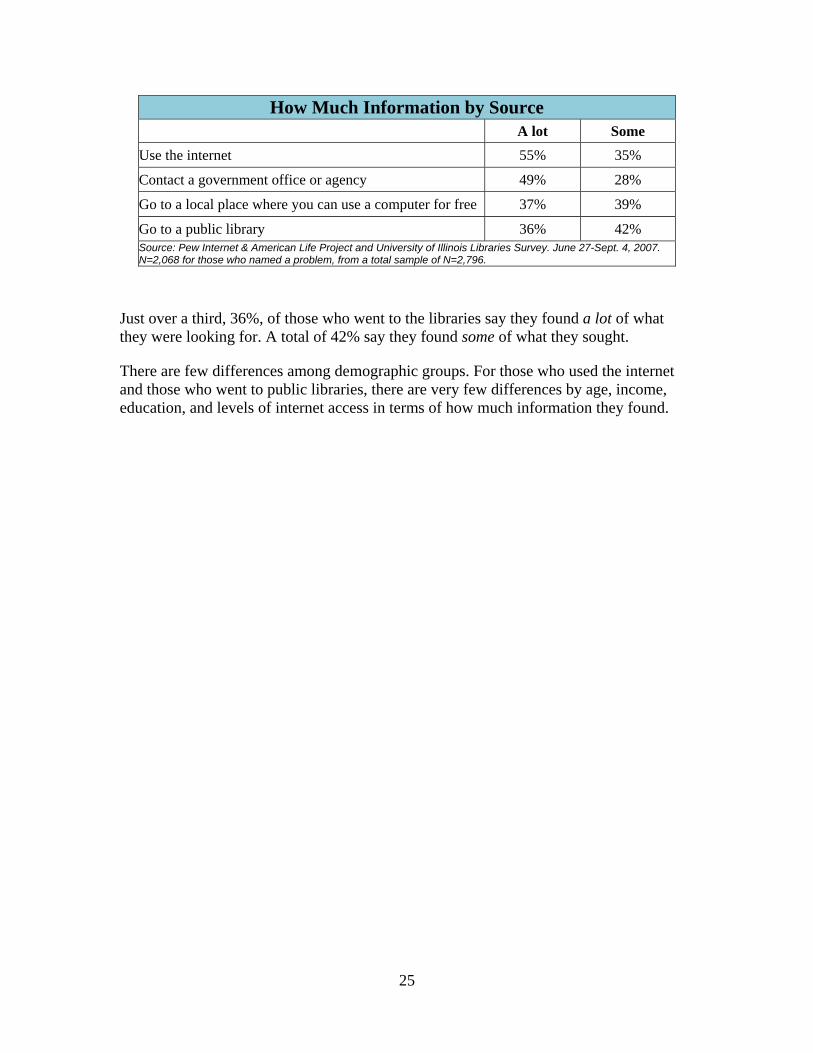
People gave higher marks to the internet than to any other source of information that was consulted. More than half of those who used the internet, 55%, say they obtained a lot of the information that needed online. And 35% say they found some of the information or help they needed.
Nearly half of respondents, 49%, said they found a lot of the information they needed from government offices and agencies, 28% say they found some of what they needed.
25
How Much Information by Source A lot Some Use the internet 55% 35%
Contact a government office or agency 49% 28%
Go to a local place where you can use a computer for free 37% 39%
Go to a public library 36% 42% Source: Pew Internet & American Life Project and University of Illinois Libraries Survey. June 27-Sept. 4, 2007. N=2,068 for those who named a problem, from a total sample of N=2,796.
Just over a third, 36%, of those who went to the libraries say they found a lot of what they were looking for. A total of 42% say they found some of what they sought.
There are few differences among demographic groups. For those who used the internet and those who went to public libraries, there are very few differences by age, income, education, and levels of internet access in terms of how much information they found.
26
Chapter 7: The Impact of Privacy Concerns on Information Seeking o
The internet has opened worlds of information to Americans, but going online to search for it can carry a risk of unintentionally disclosing personal, sensitive and even embarrassing personal information. About one in five of those who have dealt with some specific problem recently (19%) say that such a fear of disclosure of personal information played at least some role in deciding how they would search for information or help. The fears play a role for those searching offline as well as online.
Just over one quarter, 26%, of those who used the internet to address a recent problem admitted a concern that doing so might reveal private or sensitive information about themselves to others – such as someone they know, or a private company, or a government agency. Similarly, 23% of those who used the library voiced the same concern. And those who contacted a government office or agency were least concerned about such disclosures, at 17%.
Demographics are relatively unrelated to privacy concerns. Education has the most impact: 34% of those who completed high school at most expressed privacy concerns about using the internet, compared with 22% of those who attended college. And 32% of those who completed high school at most were also concerned about using the library, compared with 16% of those with more education.
Race also mattered in one circumstance: 30% of Latinos showed concern about privacy when going to a government office, compared with 13% of white Americans.
People who identified health matters or education matters showed more concern in using libraries than people who had other matters.
Worries about privacy may have had some modest impact on the individuals’ success rates in finding information. Among those who said a privacy concern shaped their choice of information sources, about 51% reported being very successful, while 63% of those who did not mention privacy concerns were very successful. That margin is partially offset by the 39% of those with concerns who report being somewhat successful, compared with 27% of those without such concerns.
27
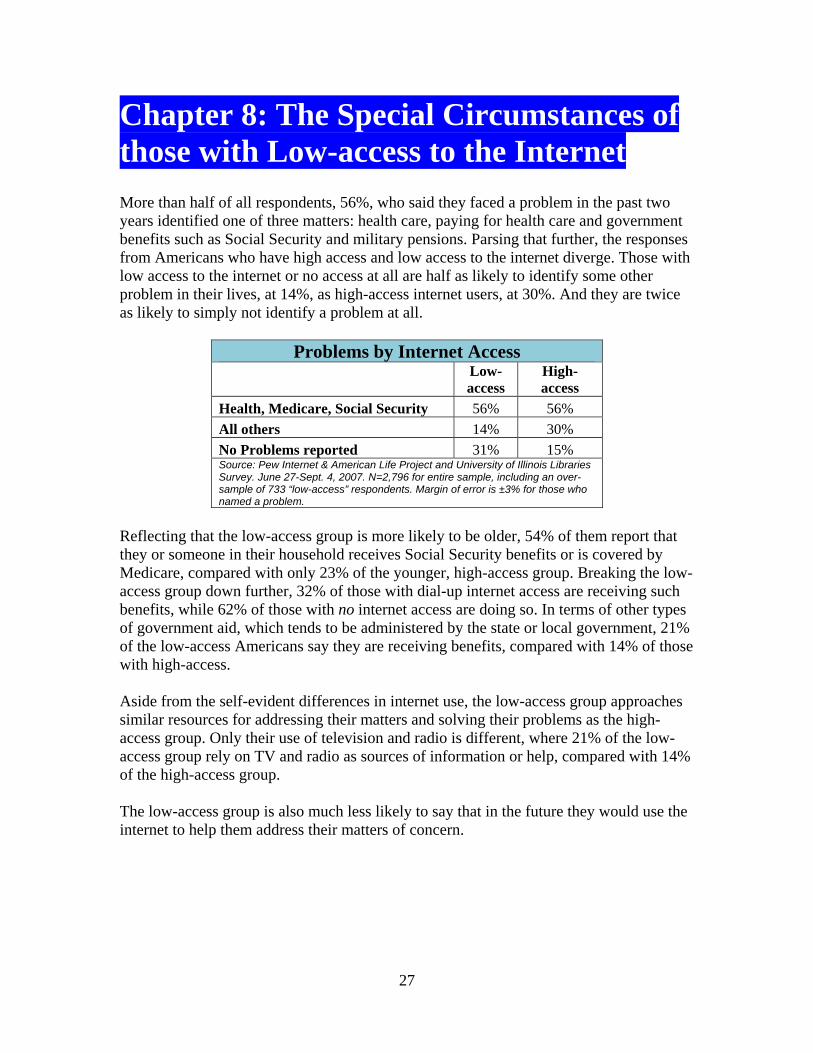
Chapter 8: The Special Circumstances of those with Low-access to the Internet More than half of all respondents, 56%, who said they faced a problem in the past two years identified one of three matters: health care, paying for health care and government benefits such as Social Security and military pensions. Parsing that further, the responses from Americans who have high access and low access to the internet diverge. Those with low access to the internet or no access at all are half as likely to identify some other problem in their lives, at 14%, as high-access internet users, at 30%. And they are twice as likely to simply not identify a problem at all.
Problems by Internet Access
Low-access
High-access
Health, Medicare, Social Security 56% 56% All others 14% 30% No Problems reported 31% 15% Source: Pew Internet & American Life Project and University of Illinois Libraries Survey. June 27-Sept. 4, 2007. N=2,796 for entire sample, including an over-sample of 733 “low-access” respondents. Margin of error is ±3% for those who named a problem.
Reflecting that the low-access group is more likely to be older, 54% of them report that they or someone in their household receives Social Security benefits or is covered by Medicare, compared with only 23% of the younger, high-access group. Breaking the low-access group down further, 32% of those with dial-up internet access are receiving such benefits, while 62% of those with no internet access are doing so. In terms of other types of government aid, which tends to be administered by the state or local government, 21% of the low-access Americans say they are receiving benefits, compared with 14% of those with high-access. Aside from the self-evident differences in internet use, the low-access group approaches similar resources for addressing their matters and solving their problems as the high-access group. Only their use of television and radio is different, where 21% of the low-access group rely on TV and radio as sources of information or help, compared with 14% of the high-access group. The low-access group is also much less likely to say that in the future they would use the internet to help them address their matters of concern.
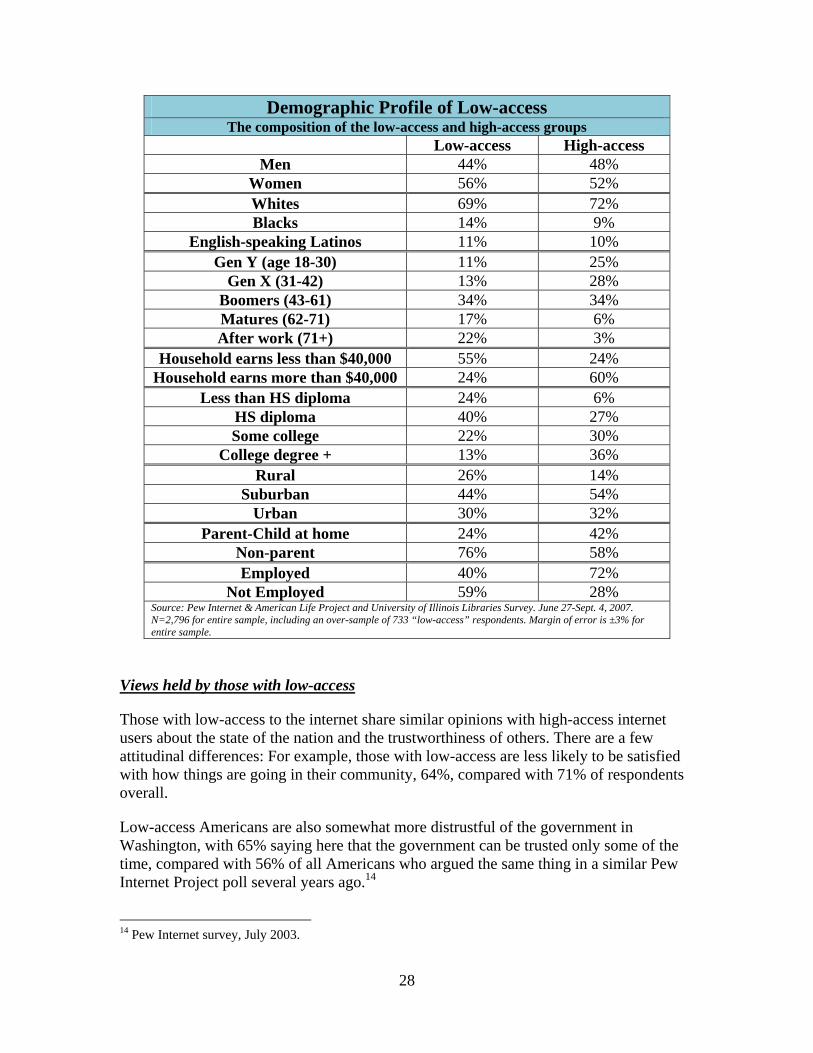
28
Demographic Profile of Low-access The composition of the low-access and high-access groups
Low-access High-access Men 44% 48%
Women 56% 52% Whites 69% 72% Blacks 14% 9%
English-speaking Latinos 11% 10% Gen Y (age 18-30) 11% 25%
Gen X (31-42) 13% 28% Boomers (43-61) 34% 34% Matures (62-71) 17% 6% After work (71+) 22% 3%
Household earns less than $40,000 55% 24% Household earns more than $40,000 24% 60%
Less than HS diploma 24% 6% HS diploma 40% 27% Some college 22% 30%
College degree + 13% 36% Rural 26% 14%
Suburban 44% 54% Urban 30% 32%
Parent-Child at home 24% 42% Non-parent 76% 58% Employed 40% 72%
Not Employed 59% 28% Source: Pew Internet & American Life Project and University of Illinois Libraries Survey. June 27-Sept. 4, 2007. N=2,796 for entire sample, including an over-sample of 733 “low-access” respondents. Margin of error is ±3% for entire sample.
Views held by those with low-access
Those with low-access to the internet share similar opinions with high-access internet users about the state of the nation and the trustworthiness of others. There are a few attitudinal differences: For example, those with low-access are less likely to be satisfied with how things are going in their community, 64%, compared with 71% of respondents overall.
Low-access Americans are also somewhat more distrustful of the government in Washington, with 65% saying here that the government can be trusted only some of the time, compared with 56% of all Americans who argued the same thing in a similar Pew Internet Project poll several years ago.14
14 Pew Internet survey, July 2003.
29
Low-access Americans appreciate the new glut of available information as much as high-access internet users: two-thirds, 65%, of low-access Americans say they like having so much information, just about the same as the 67% in the population at large.
This willingness to deal with the flood of information is also reflected in the media use patterns. Low-access Americans are just as likely as other Americans to say they get information from television, radio and magazines. They are a bit less likely to say they get news or information from newspapers (79% v. 85%). And not surprisingly, they are a lot less likely to say they get news or information from the internet (29% v. 53%).
Those with low-access to the internet report dealing with fewer problems on average (a mean number of problems of 1.7) than those with high-access (2.6). This is almost certainly because those with low-access are older and thus less likely to be dealing with a number of the matters identified in this study, such as education for dependent children and changing job situations. Those in the low-access group who do identify a problem they addressed, report using a slightly smaller number of sources as they try to address those problems than those in the high-access group (a mean of 2.5 sources v. 2.9 sources). This suggests that the lack of good access to the internet could have an impact on the scope of help available to them. Those with high-access to the internet are more likely to report being very successful in their searches for help, 63%, than those with low-access, 54%. Broken down further within the low-access group, 61% of those with dial-up internet access said they were very successful, compared with 50% of those with no access at all. How the low-access group uses the library. The low-access group is potentially a core group of customers for the nation’s public libraries. Although they are less likely in general to use the library than the high-access group (39% v. 61%), those with low-access are equally likely to turn to the library for help with their problems. Some 12% of those with low-access do that. Low-access people were slightly more likely to seek help from the library staff (75% v. 66%). The low-access group also sought more information or help from other people besides the library staff, 13%, than did the high-access group, 2%.
30
Chapter 9: Where Libraries stand
A 1996 survey by the Benton Foundation15 found that the youngest adult Americans, those age 18-24 years, were the least supportive of libraries and also saw libraries as becoming less important in future. In a turn around today, however, the youngest adults form a key group of library users. And many librarians believe that retaining their interest will be critical to the future of public libraries. Some libraries, for example, have accounts and characters in computer games like Second Life. Others answer reference questions on My Space. In the Benton survey the public saw libraries as appropriate for low-income low-access individuals. Libraries operated on the same idea, focusing for over a decade on bridging the “digital divide”—providing computer access and computer training to people who do not have it. Findings from this survey show that Americans on both sides of the digital divide – those with both low-access and high-access to computing -- are equally likely to use the public library for information that helps them address matters and solve problems in their lives – especially those matters that lie in some way within the government domain. Regardless of income, African-Americans are particularly interested in computer use at libraries. And African-Americans and Latinos are more likely than whites to say they will go to the public library should they encounter a similar problem in the future. At the same time, Latinos were the most likely to report that they chose not to use libraries when they were looking for information on a specific problem. Assistance in finding information is very important, particularly for older Americans. Users who received assistance were more likely to have been successful in finding the information they needed. At least one group of library users is identified as having a specific problem: it is possible that older library users from minority groups are frustrated or confused in searching for government information at the library.16 This group is also less likely to say they would go back to a library to solve a problem if it comes up again.
Privacy concerns seem to be on the minds of library users, possibly in part because of awareness raised from recent public debate about library records under the USA PATRIOT Act. Almost a quarter of Americans have expressed privacy concerns about using the public library. This is a particularly thorny problem for libraries, as two of the key drivers in library use are around matters related to health and education, both of which involve referring to a considerable amount of personal information.
15 Benton Foundation. Buildings, books, and bytes Libraries and communities in the digital age, 1996. http://www.benton.org/publibrary/kellogg/buildings.html 16 The questions in this survey do not directly address that issue.
31
One paradox in the survey results is this: While libraries have worked to become the place to go for those who cannot afford a computer or an internet connection, people with high access are equally likely to turn to libraries for government information as those with low access. Instead of the internet making libraries less relevant, internet use seems to create an information hunger that libraries help satisfy. But many more people consider going to libraries than actually do. This suggests that libraries should try to untangle the complex web of reasons why different groups of people – even those who might profit most from using the library – don’t in fact use the library, and in some cases, actually shun using it. The reasons are likely to challenge many assumptions about the digital divide.
Methodology - Page i
Methodology
The results in this report are based on data from telephone interviews conducted by Princeton Survey Research Associates International between June 27 to September 4, 2007, among a sample of 2,796 adults, 18 and older. For results based on the total sample, one can say with 95% confidence that the error attributable to sampling is plus or minus 2.5 percentage points. For results based Internet users (n=1,702), the margin of sampling error is plus or minus 3.1 percentage points. For results based on low-access Internet users (n=1,579) the margin of sampling error is plus or minus 3.3 percentage points. In addition to sampling error, question wording and practical difficulties in conducting telephone surveys may introduce some error or bias into the findings of opinion polls.
Two separate samples were used for interviewing. The main sample yielded 2,063 interviews. This RDD consolidated sample was drawn disproportionately from areas in the country with higher than average numbers of African-American and Latino residents. In order to increase the number of low-access Internet users in our sample, an additional 733 interviews were conducted with respondents from low-access households that were identified in previous PIAL surveys.
Sample was released for interviewing in replicates, which are representative subsamples of the larger sample. Using replicates to control the release of sample ensures that complete call procedures are followed for the entire sample. At least 10 attempts were made to complete an interview at sampled households. Calls were staggered over times of day and days of the week to maximize the chance of making contact with potential respondents. Each household received at least one daytime call in an attempt to find someone at home. In each contacted household, interviewers asked to speak with the youngest male currently at home. If no male was available, interviewers asked to speak with the youngest female at home. This systematic respondent selection technique has been shown to produce samples that closely mirror the population in terms of age and gender.
Non-response in telephone interviews produces some known biases in survey-derived estimates because participation tends to vary for different subgroups of the population, and these subgroups are likely to vary also on questions of substantive interest. In order to compensate for these known biases, the sample data are weighted in analysis. The demographic weighting parameters are derived from a special analysis of the Census Bureau’s March 2006 Annual Social and Economic Supplement Survey. This analysis produces population parameters for the demographic characteristics of adults age 18 or older, living in households that contain a telephone. These parameters are then compared with the sample characteristics to construct sample weights. The weights are derived using an iterative technique that simultaneously balances the distribution of all weighting parameters. The sample weighting also corrects for the disproportionate consolidated sample design.
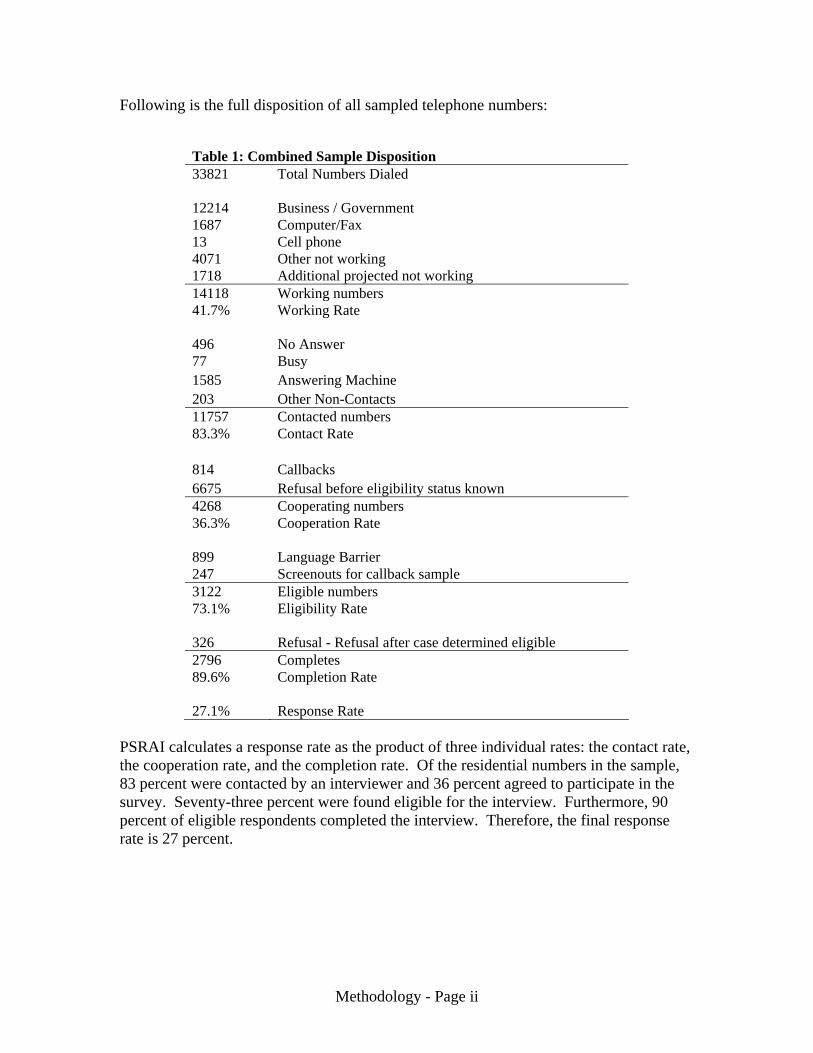
Methodology - Page ii
Following is the full disposition of all sampled telephone numbers:
Table 1: Combined Sample Disposition 33821 Total Numbers Dialed 12214 Business / Government 1687 Computer/Fax 13 Cell phone 4071 Other not working 1718 Additional projected not working 14118 Working numbers 41.7% Working Rate 496 No Answer 77 Busy 1585 Answering Machine 203 Other Non-Contacts 11757 Contacted numbers 83.3% Contact Rate 814 Callbacks 6675 Refusal before eligibility status known 4268 Cooperating numbers 36.3% Cooperation Rate 899 Language Barrier 247 Screenouts for callback sample 3122 Eligible numbers 73.1% Eligibility Rate 326 Refusal - Refusal after case determined eligible 2796 Completes 89.6% Completion Rate 27.1% Response Rate
PSRAI calculates a response rate as the product of three individual rates: the contact rate, the cooperation rate, and the completion rate. Of the residential numbers in the sample, 83 percent were contacted by an interviewer and 36 percent agreed to participate in the survey. Seventy-three percent were found eligible for the interview. Furthermore, 90 percent of eligible respondents completed the interview. Therefore, the final response rate is 27 percent.