information package for the financial results
TRANSCRIPT

Information Packagefor
The Financial Results
Inquiries: Contact IR Group, Corporate Planning Department at [email protected]
1 April 2007 - 31 March 2008
(Including historical data and outlook for future performance)
15 May 2008

1 FINANCIAL HIGHLIGHTS P.3 7 HISTORICAL TRENDS P.26 -1 Financial Summary (Non-Consolidated) 27
2 BUSINESS OVERVIEW (Consolidated) 5 -2 Financial Summary (Consolidated) 29 -3 Income Statements (Non-Consolidated) 30
3 MEDIUM-TERM BUSINESS PLAN (FY2006-2008) 7 -4 Balance Sheets (Non-Consolidated) 32 -5 Supplementary Information (Non-Consolidated) 35
4 RESULTS (FY2007) / PROJECTIONS (FY2008) 9 -6 Contract Awards (Non-Consolidated) 36 -1 Contract Awards (Non-Consolidated) 10 -7 Revenues (Non-Consolidated) 37 -2 Construction Contract Awards (Non-Consolidated) 11 -8 Contract Backlogs (Non-Consolidated) 38 - Segmental Analysis -9 Income Statements (Consolidated) 39 -3 Income Statements (Non-Consolidated) 13 -10 Balance Sheets (Consolidated) 41 -4 Supplementary Information (Non-Consolidated) 14 -11 Supplementary Information (Consolidated) 44 -5 Income Statements (Consolidated) 15 -12 Business & Geographical Segment (Consolidated) 45 -6 Supplementary Information (Consolidated) 16 -13 Overseas Revenues (Consolidated) 46
-14 Kajima Group - Japan 47
5 SUBSIDIARIES AND AFFILIATES UPDATES 17 -15 Kajima Group - Overseas 48 -1 Japan 18 -2 Overseas 20
6 BUSINESS UPDATES 22 -1 Real Estate Development (Japan) 23 -2 PFI (Japan) 25
CONTENTS
Note:In this report, data are rounded down to the digit presented in the respective tables. The aggregated figures may not equate to the aggregated breakdown.
Projections/forecasts contained in this package are based on the judgments made with information available as at 15 May 2008, and are subject to risks and uncertainties that may cause the actual results to vary.While every attempt has been made to ensure the accuracy of information, we cannot be held responsible for any errors contained.

1. FINANCIAL HIGHLIGHTS
3

1. FINANCIAL HIGHLIGHTS
NON-CONSOLIDATED CONSOLIDATED
Operating Performance (Projection) Operating Performance (Projection)
FY2006 FY2007 FY2008 FY2006 FY2007 FY2008
JPY bln JPY bln JPY bln JPY bln JPY bln JPY bln
Contract Awards 1,387.8 1,463.6 1,275.0 Contract Awards (Construction) 1,612.5 1,677.2 1,560.0
Revenues 1,444.9 1,423.1 1,370.0 Revenues 1,891.4 1,894.1 1,890.0
Gross Profit 116.3 71.1 87.0 Gross Profit 154.0 115.8 132.5
Operating Income 51.0 4.6 21.0 Operating Income 55.5 18.2 34.0
Recurring Profit 52.0 5.1 22.0 Recurring Profit 58.7 29.6 38.0
Net Income 29.4 5.8 8.0 Net Income 41.4 42.1 25.0
Basic Net Income per Share ¥27.92 ¥5.62 ¥7.84 Basic Net Income per Share ¥39.41 ¥40.53 ¥24.61
Assets and Equity Assets and EquityAs at 31 Mar 07 31 Mar 08 As at 31 Mar 07 31 Mar 08
JPY bln JPY bln JPY bln JPY bln
Total Assets 1,741.9 1,534.3 Total Assets 2,107.2 1,918.5 1 Total Equity 341.2 265.0 2 Total Equity 352.2 308.5 1 Stockholders' Equity / Assets Ratio 19.6% 17.3% 2 Stockholders' Equity / Assets Ratio 16.2% 15.6%
Equity per Share ¥323.41 ¥259.85 Equity per Share ¥325.11 ¥295.08
Cash Flows (Projection)
FY2006 FY2007 FY2008
JPY bln JPY bln JPY bln
Operating Activities (4.1) (52.5) 30.0
Investing Activities 22.1 3.0 (40.0)
Financing Activities (4.8) (7.6) (10.0)
Cash and Cash Equivalentsat the end of the Period 158.1 100.2 -
1. 2.From the financial year ended 31 March 07, "Equity" includes "Subscription Rights toShares" while "Stockholders' Equity" excludes it. (Up till 31 March '08, no Subscription Rights to Shares had been recorded.)
From the financial year ended 31 March 07, "Equity" includes "Subscription Rights toShares" and "Minority Interests" while "Stockholders' Equity" excludes them. The amount in"Stockholders' Equity" as at 31 March '08 represents "Equity" less "Minority Interests". (Uptill 31 March '08, no Subscription Rights to Shares had been recorded.)
4

2. BUSINESS OVERVIEW
5

2. BUSINESS OVERVIEW
(CONSOLIDATED)Highlights of Performance during FY07
Segment - Construction Segment - Real Estate Segment - Other
Revenues increased 1.0% to JPY1,599.6 bln.Gross Profit fell 27.3% to JPY74.5 bln, causedmainly by aggravated gross profit margin of theParent. (FY06: 7.1%, FY07: 4.1%)Operating Income fell into a loss of JPY5.0 bln as aresult of a decrease in the gross profit.
Revenues dropped 7.3% to JPY192.4 bln.Operating Income shrank 27.1% toJPY20.9 bln.
Japanese Construction Business Environment Earnings Projections
(FY07 results) RevenuesOperating IncomeRecurring ProfitNet Income
JPY 1,890.0 blnJPY 34.0 blnJPY 38.0 blnJPY 25.0 bln
(1,894.1)(18.2)(29.6)(42.1)
FY07
FY08
Other businesses, e.g. construction materialssales, design and engineering, and real estatemanagement etc., delivered Revenues ofJPY102.1bln, up 1.5%, and Operating Incomeof JPY1.2 bln.
Financial ResultsConstruction Contract Awards grew 4.0% to JPY 1,677.2 bln, driven principally by an increase in building construction contracts by the Parent.Revenues edged up 0.1% to JPY1,894.1 bln, resulting mainly from an increase in revenues of civil engineering works by the Parent.Operating Income plunged 67.1% to JPY18.2 bln, and Recurring Profit 49.6% to JPY29.6 bln, both as a result of falling gross profit margin of the Parent.Net Income, however, rose 1.7% to JPY42.1 bln, resulting mainly from Extraordinary Profit of JPY38.4 bln, including a gain on sale of a portion of preferredunits in UDX SPC.
We are paying closer attention to the trends in the US and other overseas economies, raw materialprices, and stock and foreign exchange markets, as Japanese economy is highly vulnerable to them.
The operating environment for the construction industry is expected to remain severe as uncertaintyremains with regard to trends in private capex and raw material prices.
Affected by such external factors as the slowdown in the US economy, the sharp appreciation of yen against US dollar, and the worldwide escalation in rawmaterial costs, the Japanese economic recovery has hit a lull, adding uncertainty about corporate earnings.
In the domestic construction market, continuous decrease in the public spending, the enactment of the revised Building Standards Law, and softeningcondominium market aroused concern about the slowing construction investment. Hit by this downturn trend and upward cost pressures in raw materials, theoperating environment for Japanese construction industry has become increasingly harsh.
6

3. MEDIUM-TERM BUSINESS PLAN (FY2006-2008)
7

3. MEDIUM-TERM BUSINESS PLAN (FY2006-2008)
Announced on 18 May 2006
Basic Principles
Earnings Targets (FY2008)
- Achieving a Debt/equity Ratio of around 1.00 (at the end of FY2008)
Business Strategies
Management Foundation
For further details, visit our web-site at; http://www.kajima.co.jp/ir/newplan/pdf/20060518.pdf
- Pursuing synergistic effects in the construction business through proactive expansion of the real estate development business, strengthening theenvironment and PFI businesses, and expanding the construction-related field, seeking to enhance the earnings capacity of the Kajima Group.
- Implementing rapid reform to increase the level of social trust and our standing.
"Focus on Client Orientation""Ensure Corporate Ethics"
- Establishing a structure capable of maintaining a stable level of consolidated recurring profit of more than JPY60.0 bln.
- Further boosting competitiveness in the core domestic construction business and enhancing our sales capability to win contracts through a projectproposal capacity that respects the growing sophistication and diversification of customer needs, and through our advanced technology andengineering capabilities, thereby boosting earning capacity.
8

4. RESULTS (FY2007) / PROJECTIONS (FY2008)
9

4. RESULTS (FY2007) / PROJECTIONS (FY2008)
4-1 Contract Awards (Non-Consolidated)
FY2007 FY2006
Result Projection YoYChange Result Mid-Year
Projection Result YoYChange Projection YoY
ChangeA B B/A-1 C D D/C-1 E E/D-1
JPY bln JPY bln % JPY bln JPY bln JPY bln % JPY bln %
Civil Engineering (A)
Japan 78.5 95.0 21.0% 214.5 225.0 239.7 11.8% 250.0 4.3%
Overseas 44.4 15.0 (66.3%) 161.7 75.0 100.0 (38.1%) 30.0 (70.0%)
Total 122.9 110.0 (10.5%) 376.2 300.0 339.8 (9.7%) 280.0 (17.6%)
Building Construction (B)
Japan 571.9 450.0 (21.3%) 910.8 920.0 1,057.5 16.1% 920.0 (13.0%)
Overseas 1 0.0 0.0 - 1.0 0.0 0.4 (56.8%) 0.0 -
Total 572.0 450.0 (21.3%) 911.9 920.0 1,057.9 16.0% 920.0 (13.0%)
Construction Total (A)+(B)
Japan 650.4 545.0 (16.2%) 1,125.4 1,145.0 1,297.2 15.3% 1,170.0 (9.8%)
Overseas 44.5 15.0 (66.3%) 162.8 75.0 100.5 (38.3%) 30.0 (70.2%)
Total 695.0 560.0 (19.4%) 1,288.2 1,220.0 1,397.8 8.5% 1,200.0 (14.2%)
Real Estate and Other 30.9 45.0 45.2% 99.6 65.0 65.8 (33.9%) 75.0 13.8%
Grand Total 726.0 605.0 (16.7%) 1,387.8 1,285.0 1,463.6 5.5% 1,275.0 (12.9%)
1. The figures represent overseas building construction projects undertaken by the parent only. Overseas building construction projects undertaken by overseassubsidiaries and affiliates are not included.
1st Half
FY2007FY2008
Full-Year
FY2008
10

4. RESULTS (FY2007) / PROJECTIONS (FY2008)
4-2 Construction Contract Awards - Segmental Analysis (Non-Consolidated)
FY06 FY08 FY06Result Result YoY Change Projection Result Result YoY Change
JPY bln JPY bln % JPY bln JPY bln JPY bln %Public Sector Flood Control 20.0 19.9 (0.5%) Central Gov't 93.4 84.6 (9.4%) Railway 55.9 68.7 22.8% Local Gov't 22.2 20.9 (6.2%) Potable / Waste Water 18.5 12.7 (31.3%) Total - Public Sector 115.7 105.5 (8.7%) Land Improvement 10.3 21.1 103.8% Private Sector Port / Airport 15.3 3.2 (79.0%) Manufacturing 38.0 44.7 17.6% Road 182.9 113.0 (38.2%) Non-manufacturing 60.8 89.4 47.1% Others 73.1 101.0 38.1% Total - Private Sector 98.8 134.1 35.7% A Total 376.2 339.8 (9.7%) Total - Domestic 214.5 239.7 11.8% 250.0 Office (Public / Private) 223.5 245.9 10.0% Overseas 161.7 100.0 (38.1%) 30.0 Lodging 30.4 44.4 45.6%
A Total - Civil Engineering 376.2 339.8 (9.7%) 280.0 Retail 45.6 98.3 115.6% Power Plant / Factory 213.6 260.4 21.9% (Manufacturing Plant) 190.2 239.8 26.1% Warehouse / Distribution Centre 48.4 48.3 (0.1%)
FY06 FY08 Residential 141.1 147.7 4.7% Result Result YoY Change Projection Education / Research / Culture 82.3 84.9 3.1%
JPY bln JPY bln % JPY bln Medical / Welfare 75.8 28.1 (62.8%) Public Sector Others 50.8 99.5 95.8% Central Gov't 33.3 14.7 (55.7%) B Total 911.9 1,057.9 16.0% Local Gov't 13.2 6.6 (50.0%) Total D 1,288.2 1,397.8 8.5% Total - Public Sector 46.5 21.3 (54.1%) Private Sector Manufacturing 237.8 311.0 30.8% Non-manufacturing 626.5 725.0 15.7% Total - Private Sector 864.3 1,036.1 19.9% FY06Total - Domestic 910.8 1,057.5 16.1% 920.0 Result Result YoY Change Overseas 1.0 0.4 (56.8%) 0.0 JPY bln JPY bln %
B Total - Bldg. Construction 911.9 1,057.9 16.0% 920.0 Food Processing 24.4 10.2 (58.3%) Petrochemical 86.8 91.9 5.8% Electronics 64.1 83.2 29.6% Vehicle 22.1 55.1 149.1%
FY06 FY08 Others 78.1 115.3 47.6% Result Result YoY Change Projection Total 275.8 355.8 29.0%
JPY bln JPY bln % JPY bln Commercial 46.6 66.0 41.7% Public Sector Finance 33.9 33.9 (0.0%) Central Gov't 126.7 99.4 (21.5%) Real Estate 252.3 351.4 39.2% Local Gov't 35.5 27.5 (22.5%) Transportation / Distribution 76.3 101.1 32.6% Total - Public Sector 162.2 126.9 (21.8%) Power / Gas 39.6 43.0 8.5% Private Sector Information Technology 29.5 37.0 25.7% Manufacturing 275.8 355.8 29.0% Service 176.7 169.2 (4.2%) Non-manufacturing 687.3 814.5 18.5% (Medical / Welfare) 44.0 21.1 (51.9%)
C Total - Private Sector 963.1 1,170.3 21.5% (Education) 56.6 45.1 (20.2%) Total - Domestic 1,125.4 1,297.2 15.3% 1,170.0 Others 32.1 12.5 (61.1%) Overseas 162.8 100.5 (38.3%) 30.0 Total 687.3 814.5 18.5%
D Total - Construction 1,288.2 1,397.8 8.5% 1,200.0 Total C 963.1 1,170.3 21.5%
Manufacturing
BUILDING CONSTRUCTIONFY07
Non-Manufacturing
TOTAL - CONSTRUCTION
CONSTRUCTION AWARDS BY CUSTOMER (Private Sector)
FY07
FY07
Building Construction
FY07CIVIL ENGINEERING CONSTRUCTION AWARDS BY PROJECT TYPE
FY07
Civil Engineering
11

4. RESULTS (FY2007) / PROJECTIONS (FY2008)
4-2 Construction Contract Awards - Segmental Analysis (Non-Consolidated) - continued
GEOGRAPHICAL REGION (JAPAN) CONTRACT SIZE
JPY bln Proportion JPY bln Proportion YoYChange JPY bln Proportion JPY bln Proportion YoY
Change
Urban Large-scaleKanto 586.5 52.1% 699.0 53.9% 19.2% (JPY 5 bln. or above) 479.4 37.2% 637.7 45.6% 33.0% (Metropolitan Tokyo) 524.2 46.6% 613.3 47.3% 17.0% Medium-scaleTokai 117.8 10.5% 105.9 8.2% (10.1%) (JPY 1 to 5 bln.) 488.0 37.9% 479.5 34.3% (1.7%) Kinki 151.3 13.4% 171.6 13.2% 13.4% Small-scaleTotal - Urban 855.7 76.0% 976.6 75.3% 14.1% (JPY 1 bln. or below) 320.7 24.9% 280.5 20.1% (12.5%)
Suburban Total 1,288.2 100.0% 1,397.8 100.0% 8.5% Hokkaido 24.5 2.2% 21.1 1.6% (14.2%) Tohoku 69.1 6.1% 101.3 7.8% 46.5% Hokuriku 30.9 2.8% 42.2 3.3% 36.4% Chugoku 50.9 4.5% 59.2 4.6% 16.2% Shikoku 17.7 1.6% 27.4 2.1% 54.5% Kyushu 76.1 6.8% 69.3 5.3% (9.0%) Civil Engineering 22.9 6.1% 22.4 6.6% (2.3%) Total - Suburban 269.6 24.0% 320.6 24.7% 18.9% Building Construction 140.4 15.4% 158.5 15.0% 12.9%
Total - Domestic 1,125.4 100.0% 1,297.2 100.0% 15.3% Total 163.3 12.7% 181.0 13.0% 10.8%
Kanto Tokyo, Kanagawa, Saitama, Chiba, Ibaraki, Tochigi, Gunma, Yamanashi, Nagano
Metropolitan Tokyo Tokyo, Kanagawa, Saitama, Chiba
Tokai Gifu, Shizuoka, Aichi, Mie
Kinki Shiga, Kyoto, Osaka, Hyogo, Nara, Wakayama
CONTRACT TYPE CONSOLIDATED BASISFY06 FY07
% % CONTRACT AWARDS (construction)Designated / Negotiated ContractsCivil Engineering 17.7% 22.2% Building Construction 60.1% 49.7% JPY bln JPY bln %Total - Construction 47.7% 43.0% Japan 1,245.0 1,407.1 13.0%
Overseas 367.4 270.0 (26.5%) Design-Build Contracts Total 1,612.5 1,677.2 4.0% Civil Engineering 47.5% 26.3% Building Construction 50.8% 47.1% Total - Construction 49.8% 42.1%
YoYChange
YoYChange
FY07
JPY bln
FY07
% in totalawards
FY07
FY06 FY07
FY06
FY06
% in totalawardsJPY bln
REFURBISHMENT PROJECTS
FY06
12

4. RESULTS (FY2007) / PROJECTIONS (FY2008)
4-3 Income Statements (Non-Consolidated)
FY07 FY06
Result Projection YoYChange Result Mid-year
Projection Result YoYChange Projection YoY
Change
JPY bln JPY bln JPY bln JPY bln JPY bln JPY bln JPY bln JPY bln JPY bln
Revenues 598.1 630.0 31.8 1,444.9 1,400.0 1,423.1 (21.7) 1,370.0 (53.1)
Construction 579.7 610.0 30.2 1,298.1 1,265.0 1,288.7 (9.4) 1,295.0 6.2
(Civil Engineering) 172.0 160.0 (12.0) 309.1 330.0 350.4 41.2 315.0 (35.4)
(Building Construction) 407.7 450.0 42.2 988.9 935.0 938.3 (50.6) 980.0 41.6
(Japan) 533.7 545.0 11.2 1,240.9 1,172.2 1,185.5 (55.4) 1,187.5 1.9
(Overseas) 45.9 65.0 19.0 57.2 92.8 103.1 45.9 107.5 4.3
Real Estate and Other 18.4 20.0 1.5 146.7 135.0 134.4 (12.3) 75.0 (59.4)
Gross Profit 34.8 34.5 (0.3) 116.3 75.5 71.1 (45.2) 87.0 15.8
Gross Profit Margin ("GPM") 5.8% 5.5% (0.3 pts) 8.1% 5.4% 5.0% (3.1 pts) 6.4% 1.4 pts
Construction Gross Profit 30.5 31.0 0.4 92.6 58.5 52.2 (40.4) 72.0 19.7 GPM 5.3% 5.1% (0.2 pts) 7.1% 4.6% 4.1% (3.0 pts) 5.6% 1.5 pts
(Civil Engineering) Gross Profit 13.6 8.0 (5.6) 29.1 24.0 18.8 (10.3) 18.0 (0.8) GPM 7.9% 5.0% (2.9 pts) 9.4% 7.3% 5.4% (4.0 pts) 5.7% 0.3 pts
(Building Construction) Gross Profit 16.9 23.0 6.0 63.5 34.5 33.3 (30.1) 54.0 20.6 GPM 4.2% 5.1% 0.9 pts 6.4% 3.7% 3.6% (2.8 pts) 5.5% 1.9 pts
Real Estate and Other Gross Profit 4.3 3.5 (0.8) 23.6 17.0 18.9 (4.7) 15.0 (3.9) GPM 23.6% 17.5% (6.1 pts) 16.1% 12.6% 14.1% (2.0 pts) 20.0% 5.9 pts
5.6 5.6 0.0 - 21.7 23.0 - 19.3 (3.7)
Selling, General and Administrative Expenses (33.3) (32.5) 0.8 (65.3) (66.5) (66.4) (1.1) (66.0) 0.4
Operating Income 1.5 2.0 0.4 51.0 9.0 4.6 (46.4) 21.0 16.3
Non-Operating Income - Net 5.2 1.0 (4.2) 1.0 4.0 0.5 (0.4) 1.0 0.4
Financing 4.6 1.5 (3.1) 0.0 4.8 6.4 6.3 2.2 (4.2)
Foreign Currency Exchange Gain (Loss) 0.3 - - 2.9 0.3 (5.3) (8.3) - -
Recurring Profit 6.7 3.0 (3.7) 52.0 13.0 5.1 (46.9) 22.0 16.8
Extraordinary Profit (Loss) - Net 0.4 0.0 (0.4) 3.3 (5.5) 10.8 7.4 (2.0) (12.8)
Income before Income Taxes 7.1 3.0 (4.1) 55.4 7.5 16.0 (39.4) 20.0 3.9
Income Taxes (5.1) (3.0) 2.1 (25.9) (7.0) (10.1) 15.8 (12.0) (1.8)
Net Income 2.0 0.0 (2.0) 29.4 0.5 5.8 (23.5) 8.0 2.1
1. "Adjusted Gross Profit"Recalculated gross profit of real estate and otherafter including dividend income from 3 SPCs(posted as non-operating income on the non-consolidated income statement) and gross profitfrom Kajima Yaesu Kaihatsu Co., Ltd (shown in theconsolidated income statement).
Adjusted Gross Profit 1
1st Half
FY08 FY07
Full-Year
FY08
13

4. RESULTS (FY2007) / PROJECTIONS (FY2008)
4-4 Supplementary Information (Non-Consolidated)
FY06
Result Mid-yearProjection Result YoY
Change Projection YoYChange
JPY bln JPY bln JPY bln JPY bln JPY bln JPY bln
Selling, General and Admin. Expenses 65.3 66.5 66.4 1.1 66.0 (0.4)
- Payrolls and Related Expenses 31.5 31.9 31.3 (0.2) 31.9 0.5
- Other 33.7 34.6 35.1 1.4 34.1 (1.0) R&D 9.9, Business Expenses 10.0, Office Expenses 6.1 etc.
Research and Development 8.9 9.7 9.4 0.4 10.8 1.3
Capital Expenditure 1 24.9 16.6 17.1 (7.7) 10.7 (6.4)
Depreciation / Amortization 1 8.3 9.2 9.0 0.7 9.9 0.8
Interest-bearing Debt 310.8 270.0 314.2 3.3 310.0 (4.2)
Loans Guaranteed 119.4 - 80.7 (38.6) - -
(Guarantee Commitments) 49.9 - 28.1 (21.7) - -
1. The capital expenditure and the depreciation/amortization relate to tangible, intangible fixed assets as well as other investment assets.
Details (FY08 projection)
FY07 FY08
14

4. RESULTS (FY2007) / PROJECTIONS (FY2008)
4-5 Income Statements (Consolidated)
FY07 FY06
Result Projection YoYChange Result Mid-year
Projection Result YoYChange Projection YoY
Change
JPY bln JPY bln JPY bln JPY bln JPY bln JPY bln JPY bln JPY bln JPY bln
Revenues 815.1 870.0 54.8 1,891.4 1,850.0 1,894.1 2.7 1,890.0 (4.1)
Construction 732.2 770.0 37.7 1,583.1 1,555.0 1,599.6 16.4 1,640.0 40.3
Real Estate and Other 82.9 100.0 17.0 308.3 295.0 294.5 (13.7) 250.0 (44.5)
Gross Profit 53.0 56.0 2.9 154.0 114.0 115.8 (38.2) 132.5 16.6 Gross Profit Margin ("GPM") 6.5% 6.4% (0.1 pts) 8.1% 6.2% 6.1% (2.0 pts) 7.0% 0.9 pts
Construction Gross Profit 40.6 40.0 (0.6) 102.6 75.0 74.5 (28.0) 93.5 18.9 GPM 5.6% 5.2% (0.4 pts) 6.5% 4.8% 4.7% (1.8 pts) 5.6% 1.0 pts
Real Estate and Other Gross Profit 12.4 16.0 3.5 51.3 39.0 41.2 (10.1) 39.0 (2.2) GPM 15.0% 16.0% 1.0 pts 16.7% 13.2% 14.0% (2.7 pts) 15.6% 1.6 pts
Selling, General and Administrative Expenses (47.5) (50.0) (2.4) (98.5) (97.0) (97.5) 0.9 (98.5) (0.9)
Operating Income 5.4 6.0 0.5 55.5 17.0 18.2 (37.2) 34.0 15.7
Non-Operating Income - Net 9.9 3.0 (6.9) 3.1 10.0 11.3 8.1 4.0 (7.3)
Financing (0.3) (0.2) 0.1 (2.5) (2.6) (1.2) 1.2 (2.0) (0.7)
7.7 1.2 (6.5) 5.3 8.0 10.5 5.2 2.2 (8.3)
Recurring Profit 15.4 9.0 (6.4) 58.7 27.0 29.6 (29.1) 38.0 8.3
Extraordinary Profit - Net 14.0 4.0 (10.0) 14.3 9.5 21.6 7.2 1.0 (20.6)
29.4 13.0 (16.4) 73.0 36.5 51.2 (21.8) 39.0 (12.2)
Income Taxes and Minority Interests (4.6) (8.0) (3.3) (31.6) (9.5) (9.0) (22.5) (14.0) (4.9)
Net Income 24.8 5.0 (19.8) 41.4 27.0 42.1 0.7 25.0 (17.1)
1st Half
FY08 FY07
Full-Year
FY08
Income before Income Taxesand Minority Interests
Equity in Earnings of UnconsolidatedSubsidiaries and Affiliates
15

4. RESULTS (FY2007) / PROJECTIONS (FY2008)4-6 Supplementary Information (Consolidated)
CASH FLOWSFY07 Result
FY06
Result Mid-yearProjection Result YoY
Change Projection YoYChange Operating Investing Financing
JPY bln JPY bln JPY bln JPY bln JPY bln JPY bln JPY bln JPY bln JPY bln JPY bln
Capital Expenditure 1 39.8 35.0 34.5 (5.2) 25.0 (9.5) (52.5) 3.0 (7.6) 100.2
Depreciation / Amortization 1 15.9 17.0 17.1 1.2 19.0 1.8
Interest-bearing Debt 463.8 450.0 473.8 9.9 470.0 (3.8) FY08 ProjectionLoans Guaranteed 27.9 - 22.0 (5.9) - -
Operating Investing Financing
JPY bln JPY bln JPY bln JPY bln
30.0 (40.0) (10.0) -
PERFORMANCE BY BUSINESS SEGMENT STAFF NUMBERSFY07 Result By Business Segment
Construction Real Estate Other Adjustments Total Construction Real Estate Other Total
JPY bln JPY bln JPY bln JPY bln JPY bln As at No. No. No. No.
Revenues 1,599.6 192.4 102.1 - 1,894.1 31 Mar 07 11,468 1,104 2,265 14,837
Inter-company 2.5 1.6 16.7 (21.0) - 31 Mar 08 11,489 1,159 2,286 14,934
Total Revenues 1,602.2 194.1 118.9 (21.0) 1,894.1 YoY Change 21 55 21 97
Operating Income (5.0) 20.9 1.2 1.1 18.2
FY08 Projection By Business Entity
Construction Real Estate Other Adjustments Total Kajima Corp Subsidiaries(Japan)
Subsidiaries(Overseas) Total
JPY bln JPY bln JPY bln JPY bln JPY bln As at No. No. No. No.
Revenues 1,640.0 150.0 100.0 - 1,890.0 31 Mar 07 9,084 3,437 2,316 14,837
Inter-company 1.0 0.4 18.6 (20.0) - 31 Mar 08 8,817 3,411 2,706 14,934
Total Revenues 1,641.0 150.4 118.6 (20.0) 1,890.0 YoY Change (267) (26) 390 97
Operating Income 14.5 18.5 1.0 0.0 34.0
Cash andCash
Equivalents
FY07
Cash andCash
Equivalents
Cash Flows
1. The capital expenditure and the depreciation/amortization relate to tangible, intangible fixed assets as well as otherinvestment assets.
FY08 Cash Flows
16

5. SUBSIDIARIES AND AFFILIATES UPDATES
17

5. SUBSIDIARIES AND AFFILIATES UPDATES
5-1 Japan
FY06 FY08
Result Mid-yearProjection Result Projection
JPY m JPY m JPY m JPY m
Const. Contract Awards 82,922 60,000 52,673 70,000 Total Assets JPY 70.0 bln Sale of Building Materials and Equipment / Interior Work etc.
Revenues 182,906 160,000 168,556 150,000
Operating Income 632 500 453 500 Capital JPY 0.4 bln
(Kajima's ownership: 79.6%) Recurring Profit 755 600 559 550
Net Income 161 290 206 270 291
Const. Contract Awards 94,860 97,700 108,267 99,000 Total Assets JPY 84.9 bln Road Pavement Work / Sale of Asphalt
Revenues 114,753 119,000 121,304 123,000
Operating Income 1,375 1,350 1,243 1,200 Capital JPY 4.0 bln
(Kajima's ownership: 50.5%) Recurring Profit 1,240 1,200 1,199 1,000
Net Income 405 60 376 200 1,098
Const. Contract Awards - - - - Total Assets JPY 14.0 bln Facility Management
Revenues 35,463 39,650 40,817 38,810
Operating Income 1,091 1,150 1,289 1,270 Capital JPY 0.1 bln
(Kajima's ownership: 100%) Recurring Profit 1,130 1,200 1,369 1,300
Net Income 584 940 1,029 710 1,038
Const. Contract Awards 24,244 24,000 24,077 24,000 Total Assets JPY 20.6 bln Construction Foundation Work
Revenues 23,697 24,500 24,515 24,500
Operating Income 707 477 404 480 Capital JPY 0.3 bln
(Kajima's ownership: 100%) Recurring Profit 926 577 401 590
Net Income 513 410 352 320 281
Const. Contract Awards - - 5 - Total Assets JPY 28.2 bln Leasing / Financing
Revenues 9,023 10,000 10,324 10,000
Operating Income 176 400 505 390 Capital JPY 0.4 bln
(Kajima's ownership: 100%) Recurring Profit 154 390 502 380
Net Income 216 200 382 240 30
Kajima TatemonoSogo Kanri Co., Ltd.
Chemical GroutingCo., Ltd.
Kajima LeasingCorporation
Kajima Road Co., Ltd.
Taiko Trading Co., Ltd.
The growing business in the private sector offset the weakeningpublic sector. By maximising the technological edge over itscompetitors, the company aims to raise profitability.
The building leasing business made a steady performance duringFY07. FY08 earnings are projected to drop largely due to leasingasset sales in FY07. During FY08, the company will be aiming tooptimise its performance by reinforcing the fee business.
While revenues are projected to decrease in FY08 as a result ofsmaller volume of new contracts during FY07, the operatingincome is expected to grow through profitability improvement.
The volume of new contracts, both public and private, grew inFY07. The profitability, however, trended down under the harshmarket conditions. The projected earnings in FY08 reflect the fiercecompetition and cost increase.
Improved building maintenance business led to record operatingincome and recurring profit. FY08 operating income is projected toremain broadly in line with FY07 result.
Staff Numbers
Staff Numbers
Staff Numbers
Staff Numbers
Staff Numbers
Business Overview / ProjectionAs at 31 Mar 08
FY07
18
5. SUBSIDIARIES AND AFFILIATES UPDATES
5-1 Japan - continued
FY06 FY08
Result Mid-yearProjection Result Projection
JPY m JPY m JPY m JPY m
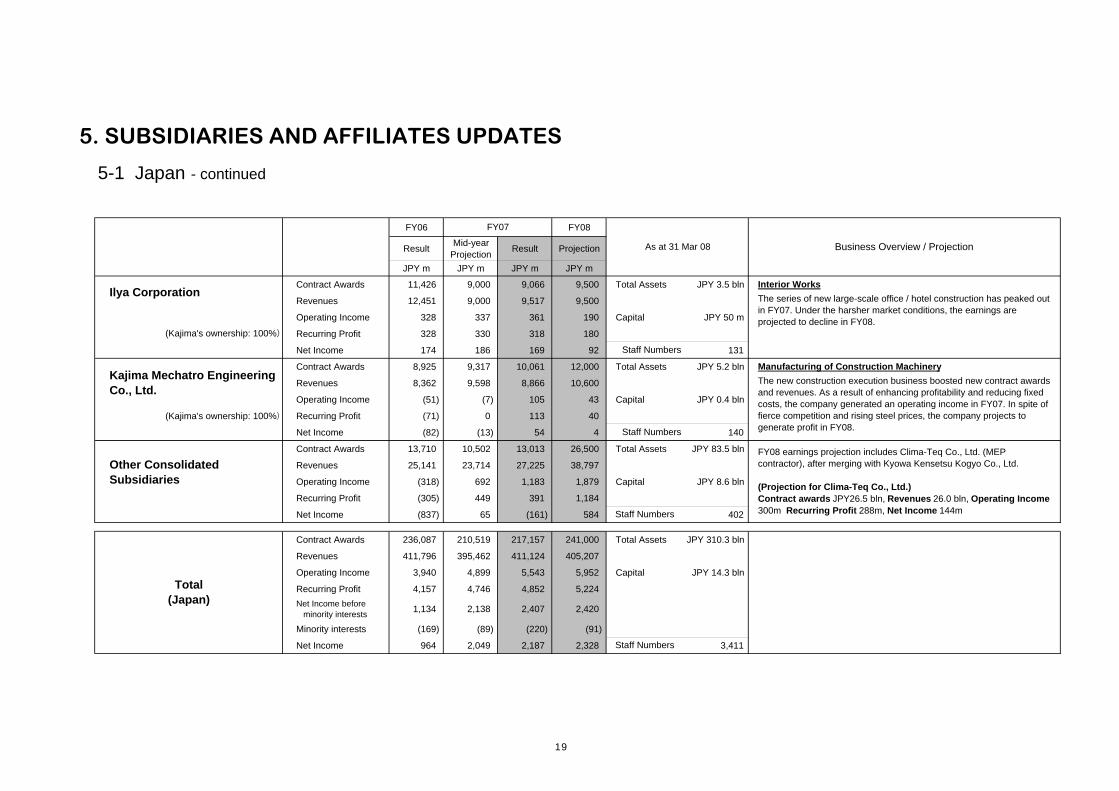
Contract Awards 11,426 9,000 9,066 9,500 Total Assets JPY 3.5 bln Interior Works
Revenues 12,451 9,000 9,517 9,500
Operating Income 328 337 361 190 Capital JPY 50 m
Recurring Profit 328 330 318 180
Net Income 174 186 169 92 131
Contract Awards 8,925 9,317 10,061 12,000 Total Assets JPY 5.2 bln Manufacturing of Construction Machinery
Revenues 8,362 9,598 8,866 10,600
Operating Income (51) (7) 105 43 Capital JPY 0.4 bln
(Kajima's ownership: 100%) Recurring Profit (71) 0 113 40
Net Income (82) (13) 54 4 140
Contract Awards 13,710 10,502 13,013 26,500 Total Assets JPY 83.5 bln
Revenues 25,141 23,714 27,225 38,797
Operating Income (318) 692 1,183 1,879 Capital JPY 8.6 bln
Recurring Profit (305) 449 391 1,184
Net Income (837) 65 (161) 584 402
Contract Awards 236,087 210,519 217,157 241,000 Total Assets JPY 310.3 bln
Revenues 411,796 395,462 411,124 405,207
Operating Income 3,940 4,899 5,543 5,952 Capital JPY 14.3 bln
Recurring Profit 4,157 4,746 4,852 5,224 Net Income before minority interests 1,134 2,138 2,407 2,420
Minority interests (169) (89) (220) (91)
Net Income 964 2,049 2,187 2,328 3,411
Staff Numbers
The new construction execution business boosted new contract awardsand revenues. As a result of enhancing profitability and reducing fixedcosts, the company generated an operating income in FY07. In spite offierce competition and rising steel prices, the company projects togenerate profit in FY08.
Kajima Mechatro EngineeringCo., Ltd.
Business Overview / ProjectionAs at 31 Mar 08
FY07
FY08 earnings projection includes Clima-Teq Co., Ltd. (MEPcontractor), after merging with Kyowa Kensetsu Kogyo Co., Ltd.
(Projection for Clima-Teq Co., Ltd.)Contract awards JPY26.5 bln, Revenues 26.0 bln, Operating Income300m Recurring Profit 288m, Net Income 144m
Total(Japan)
The series of new large-scale office / hotel construction has peaked outin FY07. Under the harsher market conditions, the earnings areprojected to decline in FY08.
Staff Numbers
(Kajima's ownership: 100%)
Ilya Corporation
Staff Numbers
Staff Numbers
Other ConsolidatedSubsidiaries
19

5. SUBSIDIARIES AND AFFILIATES UPDATES
5-2 Overseas
FY06 FY08
Result Mid-yearProjection Result Projection
JPY m JPY m JPY m JPY m
Const. Contract Awards 133,327 69,370 56,046 134,980 Total Assets JPY 153.3 bln Construction / Real Estate Development in North America / Hawaii
Revenues 150,377 155,910 162,645 171,370
Operating Income 4,181 1,840 4,745 3,020 Capital US$ 5 m
(Kajima's ownership: 100%) Recurring Profit 6,793 6,230 10,760 7,780
Net Income 8,112 2,690 9,396 5,500 839
Const. Contract Awards - - - - Total Assets JPY 0.8 bln Hotel / Commercial Property Business in L.A.
Revenues 2,202 1,480 1,466 -
Operating Income (27) 0 4 - Capital US$ 35 m
(Kajima's ownership: 56.1%) Recurring Profit (77) (10) (1) -
Net Income (52) 1,850 1,798 - 0
Const. Contract Awards 24,247 69,630 74,210 69,570 Total Assets JPY 76.4 bln Construction / Real Estate Development in Asia
Revenues 28,192 37,380 38,843 67,050
Operating Income 2,374 2,180 2,484 3,650 Capital S$ 230 m
Recurring Profit 5,133 3,990 4,635 3,530
Net Income 3,792 15,240 15,955 2,150 1,477
Const. Contract Awards 12,429 21,050 21,331 15,490 Total Assets JPY 50.4bln Construction / Real Estate Development in Europe
Revenues 27,271 26,500 25,705 36,970
Operating Income (7,766) (700) (2,329) 2,450 Cap. (KE) ₡ 286 m
Recurring Profit (8,528) (590) 103 2,520 Cap. (KEUKH) £ 141 m (Kajima's ownership: 100%) Net Income (8,118) 2,670 4,131 3,160 255
Const. Contract Awards 33,950 14,010 11,408 16,480 Total Assets JPY 7.7 bln Construction in Taiwan
Revenues 13,940 14,790 16,271 19,020
Operating Income 343 140 276 930 Capital NT$ 0.3 bln
Recurring Profit 442 170 388 960
Net Income 325 130 266 720 135
Const. Contract Awards 203,954 174,060 162,996 236,530 Total Assets JPY 290.7 bln
Revenues 229,756 236,090 244,932 294,430
Operating Income 22 3,470 5,180 10,060
Recurring Profit 4,258 9,830 15,885 14,800
Net Income 25,221 22,570 31,478 11,540 2,706
Exchange rates: US$= JPY119.11 JPY115.43 JPY114.15 JPY100.00
1. The total includes financial performance of unconsolidated overseas subsidiaries and affiliates accounted for using equity method.
(The figures in the total include financial results of KKH, which is under liquidation procedures.)
FY07
East West DevelopmentCorporation ("EWDC")
Staff Numbers
FY07: EWDC sold its fixed assets (New Otani Hotel & Garden Los Angeles and Weller CourtShopping Center) to a real estate investment company. (posted as extraordinary profit)FY08: Liquidation procedures are likely to commence in FY08. No material impact, however, isanticipated on the financial results for FY08.
FY07: Contract awards surpassed our mid-year projection, following successful awards in CentralEurope. Net income exceeded JPY4 bln, resulting from real estate sales and others.FY08: Contract awards are projected to decrease due to higher-than-usual awards achieved duringFY07. The company estimates that it can generate profit through real estate sales and others. (We willestablish, some time in FY08, a wholly-owned subsidiary, which will serve as our new Europeanheadquarters.)
Chung-Lu ConstructionCo., Ltd.
FY07: Contract awards fell short of our mid-year projection due to a delay of new contract. Revenuesand profit, however, exceeded the mid-year projection.FY08: Contract awards, revenues, and profit are all projected to increase from FY07.
(Kajima's ownership: 100%)
(Kajima's ownership: 100%)
FY07: Contract awards more than tripled from FY06 largely due to new contracts in Singapore. Thesale of KOA's stake at Millenia Singapore made a considerable contribution to the record net income.FY08: A high level of new contract awards is projected for FY08 again. Although profit will inevitablydrop due to Millenia sale in FY07, KOA estimates that the operating earnings remain strong.
FY07: Another significant year for KUSA, driven mainly by IDI and other real estate developmentcompanies. Caused in part by smaller-than-expected income taxes, KUSA achieved its record netincome.FY08: Contract awards and revenues are expected to increase as Batson-Cook joined KUSA group inJanuary. Earnings, however, are projected to drop due to the high performance in the previous yearand conservative budgeting for FY08.
Staff Numbers
Staff Numbers
As at 31 Mar 08 Business Overview / Projection
1 Total(Overseas)
Staff Numbers
Staff Numbers
Staff Numbers
Kajima Overseas AsiaPte. Ltd. ("KOA")
Kajima U.S.A. Inc. ("KUSA")
Kajima Europe B.V. ("KE")Kajima Europe UK HoldingLtd. ("KEUKH")
20

5. SUBSIDIARIES AND AFFILIATES UPDATES
5-2 Overseas - continued
Major business in the overseas marketOverseas subsidiaries and affiliates: Building Construction / Real Estate DevelopmentKajima Corporation: Civil Engineering
Kajima U.S.A.Kajima Europe
Kajima Corp.
Kajima Overseas Asia
Kajima Group Global Network
21

6. BUSINESS UPDATES
22

6. BUSINESS UPDATES
6-1 Real Estate Development (Japan)
1. PROJECTS UNDER DEVELOPMENT (By Kajima Corporation)
Site Area Floor Area
Sendai Ichibancho-4 Bldg.(office)
Sendai City,Miyagi 34,500 302,400 ◆ Development of a 14-story office building for lease on the ex-police station site.
Construction schedule: Mar 07 - Jul 08
Kaga Condominium("Kaga Residence")
Itabashi-ku,Tokyo 88,900 334,400
◆ Development of a condominium for sale (246 units on 14 stories) on the ex-Shiseido Itabashi factorysite. Construction schedule: Jan 07 - Aug 08 (handover: Nov 08)
Shinsuna Commercial Complex Koto-ku,Tokyo 263,300 999,800
◆ Development of a large-scale commercial complex. A sales and purchase agreement has beensigned with a third-party, by which Kajima will sell the complex after completion of the construction. Construction schedule: Mar 07 - Sep 08
Omiya Shimocho Office Building Saitama City,Saitama 24,900 113,900 ◆ Development of an office building for lease. Our plan is to sell the property after the development.
Construction schedule: Dec 07 - Mar 09
Higashi Shinagawa 4-Chome OfficeBuilding
Shinagawa-ku,Tokyo 32,700 209,900
◆ Development of a 13-story office building for lease. We plan to sell the property after thedevelopment.◆ Kajima acquired the land through a tender by its previous owner. (The Furukawa Electric Co Ltd.) Construction schedule: Apr 08 - Feb 10
Shiohama 2-Chome Condominium Koto-ku,Tokyo 67,610 256,200 ◆ Development of a 17-story condominium (262 units) for sale.
Construction schedule: Feb 08 - Mar 10
(By Kajima Affiliated Company)
Minami Aoyama 2-Chome OfficeBuilding
Minato-ku,Tokyo 15,300 117,400 ◆ Development of a 9-story office building for lease. We plan to sell the property after the development.
Construction schedule: Jul 08 - Oct 09 (handover: Nov 09)
Note: The floor area represents the entire area for development and include the portion of Kajima's partners.
Project Location Project OverviewApprox. Sqft
(Note)
(Note)
(Note)
(Note)
23

6. BUSINESS UPDATES
6-1 Real Estate Development (Japan) - continued
2. PROJECTS UNDER OPERATION
Site Area Floor Area
Akihabara UDX Building("AKIHABARA UDX") Chiyoda-ku,
Tokyo 124,500 1,740,000
◆ Office (5-22F) and commercial (1-4F) complex building.◆ The commercial space, together with Akihabara Daibiru Bldg. (Office), forms "Akihabara Crossfield". Grand opening: Mar 06 The operation is conducted through a SPC, which is accounted for by equity method.
Toranomon 4-Chome Office("Toranomon Towers Office")
Minato-ku,Tokyo 71,100 644,000
◆ 23-story office tower for lease, one of the twin towers of Toranomon 4-Chome development project.◆ The leasing started in Sep 06. Construction schedule: Dec 03 - Aug 06
Tokyo Station Yaesu Development("Tokyo Station City") Chiyoda-ku,
Tokyo 213,400 3,790,000
◆ A joint project with East Japan Railway Company, Mitsui Fudosan Co., Ltd., and Nippon Oil Corporation.(Kajima Group owns a minority stake in the South Wing development.) Construction schedule: Phase 1 - South Wing & North Wing Phase 1: Sep 04 - Oct 07 (The operation started in November 07.) Phase 2 - North Wing Phase 2 & Central Wing: to be completed between the summer of 2012 and the spring of 2013
Note: The floor area represents the entire area for development and includes the portion of Kajima's partners.
Project OverviewProject LocationApprox. sqft
(Note)
(Note)
24

6. BUSINESS UPDATES
6-2 PFI (Japan)
1. PROJECTS UNDER DEVELOPMENT: 7 PFI Projects JPY bln
Location Type Approx. Length ofOperation
EstimatedProjectCosts
Office Building for Members of the Houseof Councilors
Chiyoda-ku,Tokyo BTO 10 years from
opening (Jun '10)◆ Design-build, maintain and operate an office building for members of the House ofCouncilors. 58.4
Apron Zone etc for International Flights inTokyo International (Haneda) Airport
Ota-ku,Tokyo BTO 26 years from
opening (Dec '09)◆ Design-build and maintain an apron zone etc for international flights in TokyoInternational (Haneda) Airport. 49.9
New Office for Chiba Police Headquarters Chiba City,Chiba BTO 20 years from
opening (Jun '09)◆ Build, maintain and operate the new Headquarters, and maintain specialequipment and machineries. 30.2
Plaza North for Saitama City Saitama City,Saitama BTO 15 years from
opening (Apr '08)◆ Design-build, maintain and operate a multi-purpose city office and local city hall(library etc). 14.9
Sumida City Multi-purpose Gymnasium Sumida-ku,Tokyo BTO 20 years from
opening (Apr '10)◆ Design-build, maintain and operate a multi-purpose gymnasium for Sumida City,Tokyo. 14.1
The Building for Naha Area Control Center Naha City,Okinawa BTO 15 years from
opening (Nov '08) ◆ Design-build, maintain and operate Naha Area Control Center. 4.6
School Lunch Center for Ogaki CitySchools
Ogaki City,Gifu BTO 15 years from
opening (Sep '10)◆ Design-build, maintain and operate school lunch center for 32 elementary schoolsand kindergartens in Ogaki City. 4.1
2. PROJECTS UNDER OPERATION: 15 PFI Projects JPY bln
Location Type Length ofOperation
EstimatedProjectCosts
Akasaka House of RepresentativesAccommodation
Minato-ku,Tokyo BTO
25 years fromopening(Apr '07)
◆ Design-build, maintain, and assist in operating accommodation facilities formembers of the House of Representatives, lease the vacant space, providetemporary accommodation during construction.
33.4
Kuwana City Library and OtherMultipurpose Public Complex
Kuwana City,Mie BOT
30 years fromopening(Oct '04)
◆ Design-build, operate and maintain a multipurpose complex incl. a library, ahealthcare center and a dormitory for working youths. 11.6
Nagasaki City Central Library Nagasaki City,Nagasaki BTO
15 years fromopening(Oct '07)
◆ Build, operate and maintain a city library, meeting space, and "memorial exhibitioncorner", etc. 10.3
12 Other Projects 60.8
Total : 22 PFI Projects Total 292.3BTO: Build-Transfer-OperateBOT: Build-Operate-Transfer
The estimated project costs include costs to be incurred during the operation period.
Project Project Overview
Project Project Overview
25

7. HISTORICAL TRENDS
26

7. HISTORICAL TRENDS
7-1 Financial Summary (Non-Consolidated)
NON-CONSOLIDATEDFY03 FY04 FY05 FY06 FY07 FY08
Result Result Result Result Result Projection
JPY m JPY m JPY m JPY m JPY m JPY m
Contract Awards 1,178,155 1,484,454 1,374,000 1,387,864 1,463,688 1,275,000
Construction Contract Awards 1,092,595 1,339,308 1,212,382 1,288,222 1,397,807 1,200,000
Revenues 1,172,432 1,296,226 1,341,282 1,444,925 1,423,143 1,370,000
Gross Profit 98,259 119,607 123,029 116,371 71,113 87,000
(Gross Profit Margin) 8.4% 9.2% 9.2% 8.1% 5.0% 6.4%
Operating Income 30,286 55,084 57,516 51,065 4,642 21,000
(Operating Margin) 2.6% 4.2% 4.3% 3.5% 0.3% 1.5%
Recurring Profit 21,255 50,051 54,745 52,068 5,163 22,000
Net Income (Loss) (14,492) 10,975 18,584 29,465 5,870 8,000
Basic Net Income (Loss) per Share 1 (¥14.49) ¥10.25 ¥17.54 ¥27.92 ¥5.62 ¥7.84
Total Assets 1,586,814 1,510,847 1,547,153 1,741,948 1,534,353
Stockholders' Equity 2 236,472 237,991 306,671 341,257 265,026
Equity 2 - - - 341,257 265,026
Interest-bearing Debt 383,883 325,049 288,151 310,845 314,216 310,000
Stockholders' Equity / Assets Ratio 2, 3 14.9% 15.8% 19.8% 19.6% 17.3%
ROE 4 (6.9%) 4.6% 6.8% 9.1% 1.9%
Stockholders' Equity per Share 1 ¥223.89 ¥225.28 ¥290.49 - -
Equity per Share 1 - - - ¥323.41 ¥259.85
1. Calculated based on "ASBJ Statement No.2,Accounting Standard for Earning Per Share" and"ASBJ Guidance No.9, Guidance on AccountingStandard for Earning Per Share."
2. From the financial year ended 31 March '07,"Equity" includes "Subscription Rights to Shares"while "Stockholders' Equity" excludes it. (Up till 31March '08, no Subscription Rights to Shares hadbeen recorded.)
3. The assets represent those at the end of therespective accounting period.
4. The net assets applied here represents thoseaverage amounts in the respective financial year.
27
7. HISTORICAL TRENDS
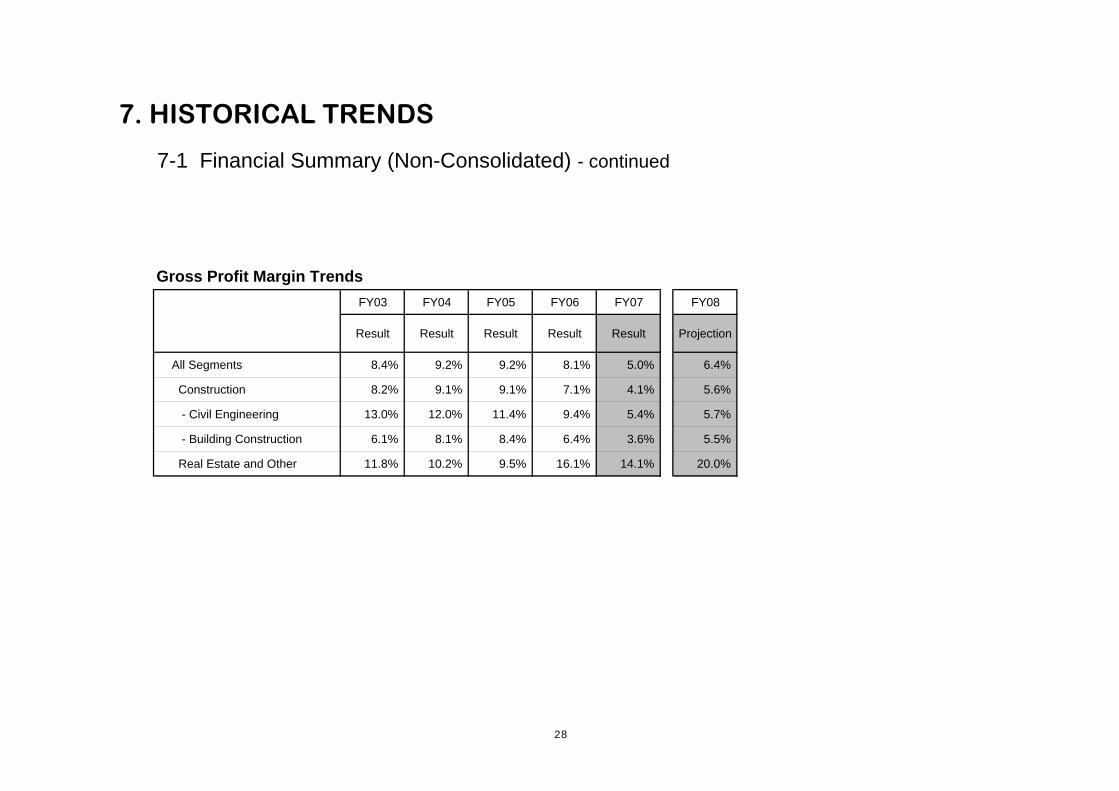
7-1 Financial Summary (Non-Consolidated) - continued
Gross Profit Margin TrendsFY03 FY04 FY05 FY06 FY07 FY08
Result Result Result Result Result Projection
All Segments 8.4% 9.2% 9.2% 8.1% 5.0% 6.4%
Construction 8.2% 9.1% 9.1% 7.1% 4.1% 5.6%
- Civil Engineering 13.0% 12.0% 11.4% 9.4% 5.4% 5.7%
- Building Construction 6.1% 8.1% 8.4% 6.4% 3.6% 5.5%
Real Estate and Other 11.8% 10.2% 9.5% 16.1% 14.1% 20.0%
28

7. HISTORICAL TRENDS7-2 Financial Summary (Consolidated)
CONSOLIDATEDFY03 FY04 FY05 FY06 FY07 FY08
Result Result Result Result Result Projection
JPY m JPY m JPY m JPY m JPY m JPY m
Construction Contract Awards 1,312,744 1,619,394 1,462,799 1,612,531 1,677,272 1,560,000
Revenues 1,621,760 1,687,379 1,775,273 1,891,465 1,894,187 1,890,000
Gross Profit 146,256 142,504 153,915 154,039 115,832 132,500
(Gross Profit Margin) 9.0% 8.4% 8.7% 8.1% 6.1% 7.0%
Operating Income 46,418 47,114 55,734 55,515 18,239 34,000
(Operating Margin) 1.9% 2.9% 2.8% 2.9% 1.0% 1.8%
Recurring Profit 37,749 47,253 55,354 58,713 29,610 38,000
Net Income (Loss) (4,474) 13,219 22,506 41,439 42,162 25,000
Basic Net Income (Loss) per Share 1 (¥4.61) ¥12.28 ¥21.19 ¥39.41 ¥40.53 ¥24.61
Cash Dividends per Share ¥5.00 ¥6.00 ¥6.00 ¥7.00 ¥7.00 ¥7.00
Total Assets 1,870,279 1,817,729 1,905,964 2,107,222 1,918,510
Stockholders' Equity 2 216,509 219,741 297,921 341,738 299,772
Equity 2 - - - 352,274 308,581
Interest-bearing Debt 543,262 475,820 458,505 463,858 473,800 470,000
Stockholders' Equity / Assets Ratio 2, 3 11.6% 12.1% 15.6% 16.2% 15.6%
ROE 4 (2.4%) 6.1% 8.7% 13.0% 13.1%
Stockholders' Equity per Share 1 ¥205.60 ¥208.59 ¥283.05 - -
Equity per Share 1 - - - ¥325.11 ¥295.08
Ratio of Consolidated Net Income toNon-Consolidated Net Income - 1.20 1.21 1.41 7.18
('000 shares) ('000 shares) ('000 shares) ('000 shares) ('000 shares)No. of Shares Outstanding - Year-end(excluding treasury stock) 1,052,504 1,052,055 1,051,778 1,051,142 1,015,889
No. of Shares Outstanding - Average(excluding treasury stock) 996,618 1,052,320 1,051,925 1,051,383 1,040,232
Cash Flow - Operating Activities 50,102 87,489 53,402 (4,132) (52,541) 30,000
Cash Flow - Investing Activities (34,650) 16,104 (14,844) 22,117 3,020 (40,000)
Cash Flow - Financing Activities 6,666 (71,359) (35,999) (4,845) (7,678) (10,000)
1. Calculated based on "ASBJ Statement No.2, Accounting Standard forEarning Per Share" and "ASBJ Guidance No.9, Guidance onAccounting Standard for Earning Per Share."
2. From the financial year ended 31 March 07, "Equity" includes"Subscription Rights to Shares" and "Minority Interests" while"Stockholders' Equity" excludes them. The amount in "Stockholders'Equity" at 31 March '08 represents "Equity" less "Minority Interests".(Up till 31 March '08, no Subscription Rights to Shares had beenrecorded.)
3. The assets represent those at the end of the respective accountingperiod.
4. The net assets applied here represents those average amounts in therespective financial year
29

7. HISTORICAL TRENDS
7-3 Income Statements (Non-Consolidated)
FY03 FY04 FY05 FY06 FY07 FY08
Result Result Result Result Result Projection
JPY m JPY m JPY m JPY m JPY m JPY m
Revenues 1,172,432 1,296,226 1,341,282 1,444,925 1,423,143 1,370,000 Construction 1,098,393 1,137,975 1,256,777 1,298,154 1,288,730 1,295,000
Real Estate and Other 74,039 158,251 84,504 146,771 134,413 75,000
Gross Profit 98,259 119,607 123,029 116,371 71,113 87,000 8.4% 9.2% 9.2% 8.1% 5.0% 6.4%
Construction 89,532 103,520 114,977 92,698 52,205 72,000 8.2% 9.1% 9.1% 7.1% 4.1% 5.6%
Real Estate and Other 8,727 16,086 8,051 23,672 18,908 15,000 11.8% 10.2% 9.5% 16.1% 14.1% 20.0%
67,973 64,523 65,513 65,305 66,471 66,000 5.8% 5.0% 4.9% 4.5% 4.7% 4.8%
Operating Income 30,286 55,084 57,516 51,065 4,642 21,000 2.6% 4.2% 4.3% 3.5% 0.3% 1.5%
Non-Operating Income 5,408 6,569 7,860 11,040 15,052 Interest / Dividends Income 3,547 3,564 5,373 5,777 13,096
Foreign Currency Exchange Gain - 1,051 1,076 2,996 -
Other 1,861 1,952 1,410 2,266 1,956
Non-Operating Expenses 14,438 11,601 10,631 10,037 14,531 Interest Expense 6,733 5,888 4,889 5,682 6,615
Provision for Doubtful Accounts 4,332 3,048 3,632 1,220 -
Other 3,372 2,665 2,109 3,134 7,915
Recurring Profit 21,255 50,051 54,745 52,068 5,163 22,000 1.8% 3.9% 4.1% 3.6% 0.4% 1.6%
1,000
Selling, General and AdministrativeExpenses
30

7. HISTORICAL TRENDS
7-3 Income Statements (Non-Consolidated) - continued
FY03 FY04 FY05 FY06 FY07 FY08
Result Result Result Result Result Projection
JPY m JPY m JPY m JPY m JPY m JPY m
Extraordinary Profit 8,451 12,416 1,924 28,749 26,499
Extraordinary Loss 45,811 38,973 21,835 25,363 15,619
Net Income before Tax / Adjustments (16,103) 23,494 34,834 55,455 16,043 20,000
Income Taxes - Current 70 1,352 930 9,883 4,732
Income Taxes - Deferred (1,681) 11,166 15,319 16,105 5,441
Net Income (14,492) 10,975 18,584 29,465 5,870 8,000
Unappropriated Retained Earnings - Prior 5,142 5,437 6,413
Transfer of Legal Reserve 16,017 - -
Transfer of Revaluation Surplus of Land 119 (7,282) 3,153
Interim Cash Dividend Paid 2,400 2,640 3,166
Unappropriated Retained Earnings 4,386 6,490 24,984
Extraordinary Loss DetailsLoss on Sales of Fixed Assets 1,593 - - 457 2,094
Loss on Disposals of Fixed Assets - - - 624 5,629
Loss on Sales of Marketable and InvestmentSecurities 95 - - - -
Valuation Loss on Marketable and InvestmentSecurities 496 - - 369 2,172
Valuation Loss on Investment Securities ofSubsidiaries and Affiliates 6,012 15,460 9,441 - -
Loss on Restructuring of Affiliates - 15,310 - - -
Loss on Investments in Affiliates - - - 3,320 -
Provision for Loss on Investments in Subsidiariesand Affiliates 3,389 - 10,767 8,502 -
Valuation Loss on Inventories - - - 7,398 -
Provision for Loss on Development Projects - 1,858 - - -
Loss on Impairment of Long-lived Assets - 1,376 - 560 2,122
Loss on Defect Rectification - - - - 3,589
Loss on Dissolution of Welfare Pension Fund 33,483 - - - -
Other 740 4,969 1,626 4,130 11
Total 45,811 38,973 21,835 25,363 15,619
12,000
(2,000)
31

7. HISTORICAL TRENDS7-4 Balance Sheets (Non-Consolidated)
As at 31 Mar 04 31 Mar 05 31 Mar 06 31 Mar 07 31 Mar 08
Result Result Result Result Result
JPY m JPY m JPY m JPY m JPY m
(ASSETS)Current Assets 899,435 891,742 869,112 1,043,857 898,142
Cash and Cash in Banks 81,539 111,313 102,144 118,915 66,326 Notes Receivable - Trade 9,736 9,853 14,921 17,537 12,042 Accounts Receivable - Trade 287,717 353,443 358,921 488,599 460,519 Marketable Securities 119 218 99 158 99 Inventories: Real Estate for Sale 47,832 44,961 38,596 34,637 30,755 Construction Projects in Progress 146,808 99,538 76,644 91,905 79,464 Development Projects in Progress and Other 123,343 93,791 119,546 98,385 64,407 Deferred Income Taxes 72,428 77,476 61,545 63,815 63,647 Other Account Receivable 21,588 31,813 32,289 30,957 32,283 Suspense Payment 85,692 50,448 47,713 68,738 57,014 Other 32,173 24,268 24,122 32,331 33,243 Allowance for Doubtful Accounts (9,544) (5,383) (7,433) (2,125) (1,662)
Fixed Assets 687,379 619,104 678,041 698,090 636,211 Tangible Fixed Assets 253,016 224,314 222,222 234,374 231,508
Buildings 91,968 77,921 72,922 68,062 74,068 Structures 4,553 3,601 3,795 3,041 3,090 Machinery 2,506 2,787 2,652 1,999 2,245 Vehicles 183 132 320 271 307 Tools and Equipment 1,611 1,590 1,599 1,705 2,144 Land 150,552 137,561 138,236 146,882 145,746 Construction in Progress 1,237 317 2,289 12,004 3,502 Other 403 399 406 407 402
Intangible Fixed Assets 9,638 8,855 8,122 6,867 7,660 Investments and Other Assets 424,724 385,934 447,695 456,847 397,043
Investment in Securities 205,276 198,529 302,647 334,434 241,011 Investment in Subsidiaries and Affiliates and in their Securities 71,816 72,806 74,586 64,008 61,258 Other Investment Securities of Subsidiaries and Affiliates - - - - 3,120 Long-term Loans Receivable 67,941 36,903 32,905 42,029 38,982 Claims in Bankruptcy or Reorganization Proceedings 7,066 10,973 4,374 562 239 Long-term Prepaid Expenses 3,770 3,699 4,564 4,701 4,703 Deferred Income Taxes 71,833 62,338 21,834 1,342 37,621 Other 57,843 34,338 34,558 25,439 20,680 Allowance for Doubtful Accounts (60,825) (33,654) (27,775) (15,670) (10,574)
Total Assets 1,586,814 1,510,847 1,547,153 1,741,948 1,534,353
32

7. HISTORICAL TRENDS7-4 Balance Sheets (Non-Consolidated) - continued
As at 31 Mar 04 31 Mar 05 31 Mar 06 31 Mar 07 31 Mar 08
Result Result Result Result Result
JPY m JPY m JPY m JPY m JPY m
(LIABILITIES)Current Liabilities 966,338 964,968 918,846 1,084,999 970,362
Notes Payable - Trade 6,674 2,864 3,419 4,007 1,934
Accounts Payable - Trade 365,677 406,881 426,848 514,144 446,515
Short-term Borrowings 98,853 98,298 78,973 80,142 79,068
Commercial Paper 44,000 26,000 24,000 50,000 77,000
Current Portion of Bonds 20,000 40,000 10,000 25,000 10,000
Income Taxes Payable 1,069 2,952 1,859 10,578 848
Advances Received:
Construction Projects in Progress 147,773 164,333 141,403 143,133 150,270
Development Projects in Progress and Other 72,860 62,930 61,036 33,311 17,996
Deposits Received 158,361 93,244 102,412 144,205 111,306
Allowance for Warranty on Completed Construction Projects 575 488 760 1,016 1,140
Allowance for Foreseeable Losses on Construction Projects - 3,820 4,000 8,290 20,770
Employees' Savings Deposit 22,806 22,046 22,611 22,574 22,038
Other 27,686 41,108 41,520 48,596 31,474
Long-term Liabilities 384,003 307,887 321,636 315,691 298,964 Bonds Payable 95,000 75,000 85,000 60,000 60,000
Long-term Debt 126,029 85,750 90,178 95,702 88,148
Deferred Income Taxes on Revaluation of Land 10,342 14,343 12,197 18,038 18,995
Liability for Retirement Benefits - Employees 56,629 53,855 56,148 57,585 56,990
Liability for Retirement Benefits - Directors and Corporate Auditors 4,344 4,740 4,943 - -
Allowance for Loss on Development Projects 13,050 14,908 5,904 5,904 5,904
Allowance for Loss on Investments in Subsidiaries and Affiliates 24,131 10,408 17,863 26,366 18,452
Long-term Accounts Payable 26,778 24,664 22,916 24,405 22,210
Long-term Deposits Received 24,198 21,117 23,517 24,465 24,762
Other 3,499 3,099 2,966 3,223 3,501
Total Liabilities 1,350,342 1,272,856 1,240,482 1,400,691 1,269,327
33
7. HISTORICAL TRENDS7-4 Balance Sheets (Non-Consolidated) - continued
As at 31 Mar 04 31 Mar 05 31 Mar 06 31 Mar 07 31 Mar 08
Result Result Result Result Result
JPY m JPY m JPY m JPY m JPY m
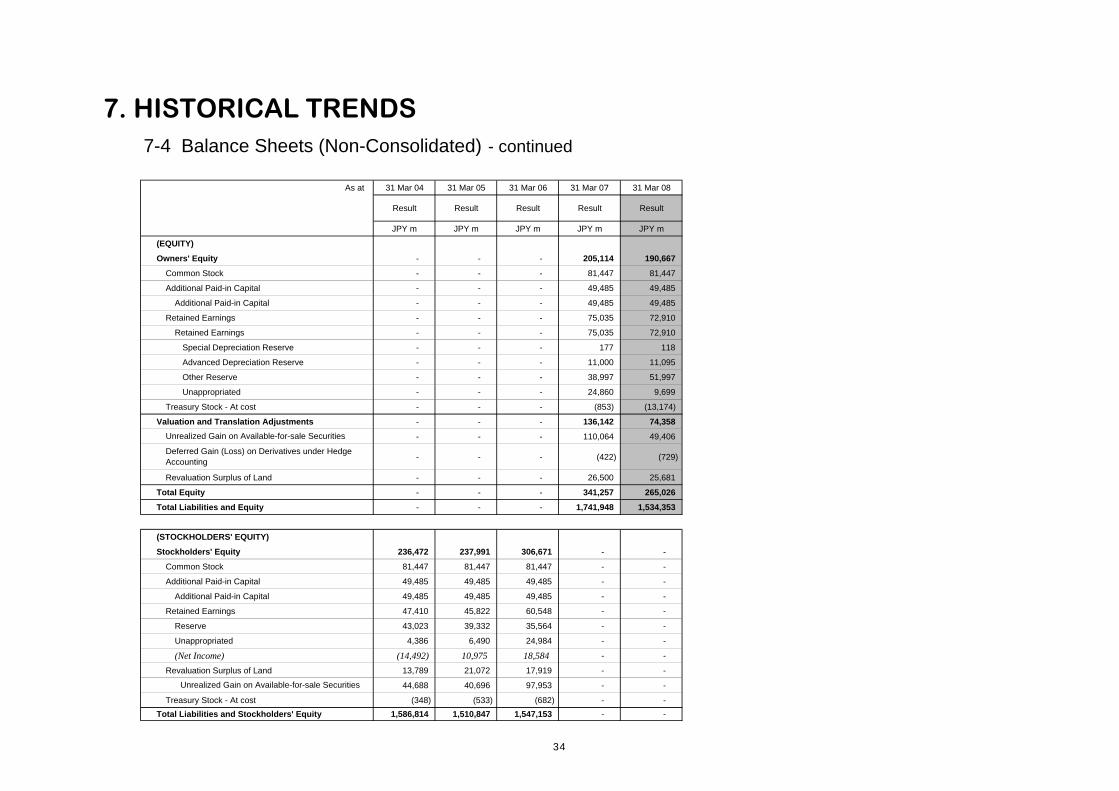
(EQUITY)
Owners' Equity - - - 205,114 190,667
Common Stock - - - 81,447 81,447
Additional Paid-in Capital - - - 49,485 49,485
Additional Paid-in Capital - - - 49,485 49,485
Retained Earnings - - - 75,035 72,910
Retained Earnings - - - 75,035 72,910
Special Depreciation Reserve - - - 177 118
Advanced Depreciation Reserve - - - 11,000 11,095
Other Reserve - - - 38,997 51,997
Unappropriated - - - 24,860 9,699
Treasury Stock - At cost - - - (853) (13,174)
Valuation and Translation Adjustments - - - 136,142 74,358
- - - 110,064 49,406
- - - (422) (729)
Revaluation Surplus of Land - - - 26,500 25,681
Total Equity - - - 341,257 265,026
Total Liabilities and Equity - - - 1,741,948 1,534,353
(STOCKHOLDERS' EQUITY)
Stockholders' Equity 236,472 237,991 306,671 - -
Common Stock 81,447 81,447 81,447 - -
Additional Paid-in Capital 49,485 49,485 49,485 - -
Additional Paid-in Capital 49,485 49,485 49,485 - -
Retained Earnings 47,410 45,822 60,548 - -
Reserve 43,023 39,332 35,564 - -
Unappropriated 4,386 6,490 24,984 - -
(Net Income) (14,492) 10,975 18,584 - -
Revaluation Surplus of Land 13,789 21,072 17,919 - -
44,688 40,696 97,953 - -
Treasury Stock - At cost (348) (533) (682) - - Total Liabilities and Stockholders' Equity 1,586,814 1,510,847 1,547,153 - -
Unrealized Gain on Available-for-sale Securities
Unrealized Gain on Available-for-sale Securities
Deferred Gain (Loss) on Derivatives under HedgeAccounting
34

7. HISTORICAL TRENDS7-5 Supplementary Information (Non-Consolidated)
As at 31 Mar 04 31 Mar 05 31 Mar 06 31 Mar 07 31 Mar 08
JPY m JPY m JPY m JPY m JPY m
Loans Guaranteed 143,709 131,293 136,859 119,453 80,798
Guarantee Commitments 70,827 64,096 63,610 49,933 28,181
Staff Numbers 1 10,395 9,950 9,729 9,552 9,254
FY03 FY04 FY05 FY06 FY07
JPY m JPY m JPY m JPY m JPY m
Other Data
R&D 10,853 9,767 9,218 8,973 9,445
Capital Expenditure 2 19,107 4,104 7,890 24,954 17,168
Depreciation / Amortization 2 10,009 11,741 8,876 8,393 9,096
Financing Income (Expenses) (3,186) (2,323) 484 95 6,480
2. The capital expenditure and the depreciation/amortization relate to tangible, intangible fixed assets as well as otherinvestment assets.
1. The staff numbers include employees who are; 1) seconded to subsidiaries, affiliates or other organizations, 2) sentto universities or other organizations for study.
35

7. HISTORICAL TRENDS7-6 Contract Awards (Non-Consolidated)
GEOGRAPHICAL AND CLIENT GROUP PROJECT GROUPFY03 FY04 FY05 FY06 FY08 FY03 FY04 FY05 FY06
Result Result Result Result Result Proportion Projection Result Result Result Result Result Proportion
JPY m JPY m JPY m JPY m JPY m % JPY m JPY m JPY m JPY m JPY m JPY m %
CIVIL ENGINEERING CIVIL ENGINEERINGJapan 278,041 312,570 213,261 214,564 239,780 70.6% 250,000 Flood Control 15,153 25,647 19,219 20,015 19,923 5.9% (Japan - Public) 201,127 212,520 115,715 115,714 105,591 31.1% - Railway 31,195 34,549 93,316 55,972 68,736 20.2% (Japan - Private) 76,913 100,049 97,546 98,850 134,189 39.5% - Potable / Waste Water 35,876 35,491 34,944 18,501 12,710 3.7% Overseas 10,648 31,073 88,090 161,723 100,036 29.4% 30,000 Land Improvement 13,531 17,862 16,429 10,375 21,143 6.2%
Port / Airport 27,612 80,694 8,052 15,323 3,210 1.0% Road 74,806 75,779 55,425 182,948 113,085 33.3% Transmission Lines 556 2,428 621 686 3,362 1.0% Other 89,957 71,189 73,342 72,462 97,644 28.7%
Sub-total 288,690 343,643 301,352 376,288 339,817 100.0% 280,000 Sub-total 288,690 343,643 301,352 376,288 339,817 100.0%
BUILDING CONSTRUCTION BUILDING CONSTRUCTIONJapan 801,765 995,114 910,064 910,838 1,057,516 99.9% 920,000 Office (Public / Private) 238,378 266,440 228,519 223,551 245,934 23.2% (Japan - Public) 77,531 67,027 56,484 46,534 21,360 2.0% - Lodging 13,963 23,029 42,591 30,497 44,402 4.2% (Japan - Private) 724,234 928,087 853,579 864,304 1,036,156 97.9% - Retail 44,677 63,961 73,774 45,638 98,398 9.3% Overseas 2,139 550 966 1,095 473 0.1% 0 Power Plant / Factory 98,683 214,613 203,956 213,645 260,481 24.6%
Warehouse / Distribution Center 8,994 34,437 23,222 48,430 48,382 4.6% Residential 137,007 180,235 89,106 141,126 147,751 14.0% Education / Research / Culture 104,676 92,295 125,278 82,374 84,938 8.0% Medical / Welfare 100,461 67,579 65,089 75,854 28,196 2.7% Recreational 16,392 16,993 29,186 20,765 7,957 0.7% Other 40,670 36,078 30,304 30,049 91,544 8.7%
Sub-total 803,905 995,664 911,030 911,934 1,057,989 100.0% 920,000 Sub-total 803,905 995,664 911,030 911,934 1,057,989 100.0%
TOTAL - CONSTRUCTIONJapan - Total 1,079,807 1,307,685 1,123,326 1,125,403 1,297,297 92.8% 1,170,000(Japan - Public) 278,659 279,547 172,199 162,248 126,951 9.1% - (Japan - Private) 801,147 1,028,137 951,126 963,155 1,170,345 83.7% -
(Manufacturing) 164,740 326,713 274,153 275,830 355,803 25.4% - (Non-Manufacturing) 636,406 701,424 676,973 687,324 814,541 58.3% -
Overseas 12,788 31,623 89,056 162,818 100,509 7.2% 30,000Sub-total 1,092,595 1,339,308 1,212,382 1,288,222 1,397,807 100.0% 1,200,000 Total - Construction 1,092,595 1,339,308 1,212,382 1,288,222 1,397,807 -
Real Estate and Other 85,559 145,146 161,617 99,642 65,880 - 75,000Total 1,178,155 1,484,454 1,374,000 1,387,864 1,463,688 - 1,275,000
FY07 FY07
36

7. HISTORICAL TRENDS7-7 Revenues (Non-Consolidated)
GEOGRAPHICAL AND CLIENT GROUP PROJECT GROUPFY03 FY04 FY05 FY06 FY08 FY03 FY04 FY05 FY06
Result Result Result Result Result Proportion Projection Result Result Result Result Result Proportion
JPY m JPY m JPY m JPY m JPY m % JPY m JPY m JPY m JPY m JPY m JPY m %
CIVIL ENGINEERING CIVIL ENGINEERINGJapan 306,141 274,460 281,892 252,817 247,539 70.6% Flood Control 50,691 33,097 43,568 25,615 39,165 11.2% (Japan - Public) 209,547 181,050 158,548 133,417 113,768 32.4% Railway 51,231 52,914 48,988 59,915 87,038 24.8% (Japan - Private) 96,593 93,410 123,343 119,399 133,771 38.2% Potable / Waste Water 40,465 34,572 37,189 31,336 23,216 6.6% Overseas 27,377 27,433 42,679 56,356 102,861 29.4% Land Improvement 19,451 19,086 21,173 13,895 17,679 5.0%
Port / Airport 21,918 22,075 20,933 14,082 13,050 3.7% Road 74,455 66,865 71,960 70,911 86,723 24.8% Transmission Lines 133 618 1,339 1,731 1,006 0.3% Other 75,171 72,663 79,418 91,685 82,520 23.6%
Sub-total 333,518 301,894 324,571 309,173 350,400 100.0% 315,000 Sub-total 333,518 301,894 324,571 309,173 350,400 100.0%
BUILDING CONSTRUCTION BUILDING CONSTRUCTIONJapan 762,915 833,761 930,944 988,134 938,005 100.0% Office (Public / Private) 211,103 218,325 253,544 245,967 253,570 27.0% (Japan - Public) 80,814 78,100 59,794 54,086 32,475 3.5% Lodging 19,454 29,661 20,863 33,341 34,503 3.7% (Japan - Private) 682,100 755,660 871,150 934,047 905,529 96.5% Retail 63,239 43,619 67,446 83,126 56,798 6.1% Overseas 1,958 2,318 1,261 846 325 0.0% Power Plant / Factory 121,080 150,478 194,214 220,295 225,437 24.0%
Warehouse / Distribution Center 15,566 19,760 35,009 23,789 53,031 5.7% Residential 108,094 109,552 134,838 153,284 116,284 12.4% Education / Research / Culture 100,642 118,025 93,991 118,531 84,787 9.0% Medical / Welfare 60,027 74,932 81,756 54,937 55,415 5.9% Recreational 16,877 20,919 21,707 22,810 21,764 2.3% Other 48,787 50,803 28,834 32,896 36,736 3.9%
Sub-total 764,874 836,080 932,206 988,980 938,330 100.0% 980,000 Sub-total 764,874 836,080 932,206 988,980 938,330 100.0%
TOTAL - CONSTRUCTIONJapan - Total 1,069,056 1,108,222 1,212,837 1,240,951 1,185,544 92.0% 1,187,500(Japan - Public) 290,362 259,151 218,342 187,503 146,244 11.4% (Japan - Private) 778,694 849,071 994,494 1,053,447 1,039,300 80.6%
(Manufacturing) 163,000 216,283 281,894 332,030 312,110 24.2% (Non-Manufacturing) 615,694 632,788 712,599 721,417 727,189 56.4%
Overseas 29,336 29,752 43,940 57,203 103,186 8.0% 107,500Sub-total 1,098,393 1,137,975 1,256,777 1,298,154 1,288,730 100.0% 1,295,000 Total - Construction 1,098,393 1,137,975 1,256,777 1,298,154 1,288,730 -
Real Estate and Other 74,039 158,251 84,504 146,771 134,413 - 75,000Total 1,172,432 1,296,226 1,341,282 1,444,925 1,423,143 - 1,370,000
FY07 FY07
37

7. HISTORICAL TRENDS7-8 Contract Backlogs (Non-Consolidated)
GEOGRAPHICAL AND CLIENT GROUP PROJECT GROUPAs at 31 Mar 04 31 Mar 05 31 Mar 06 31 Mar 07 As at 31 Mar 04 31 Mar 05 31 Mar 06 31 Mar 07
Actual Actual Actual Actual Result Proportion Actual Actual Actual Actual Result Proportion
JPY m JPY m JPY m JPY m JPY m JPY m JPY m JPY m JPY m JPY m JPY m JPY m
CIVIL ENGINEERING CIVIL ENGINEERINGJapan 434,654 472,764 404,133 365,881 358,122 61.4% Flood Control 96,337 88,886 64,537 58,938 39,695 6.8% (Japan - Public) 280,387 311,858 269,024 251,321 243,145 41.7% Railway 98,823 80,458 124,786 120,843 102,542 17.6%
(Japan - Private) 154,266 160,906 135,109 114,559 114,977 19.7% Potable / Waste Water 44,682 45,602 43,358 30,522 20,017 3.4%
Overseas 73,178 76,817 122,228 227,595 224,770 38.6% Land Improvement 19,793 18,568 13,825 10,305 13,770 2.4%
Port / Airport 31,725 90,344 77,463 78,704 68,864 11.8%
Road 102,218 131,328 114,793 226,830 253,192 43.5%
Transmission Lines 598 2,408 1,690 646 3,002 0.5%
Other 113,653 91,984 85,907 66,684 81,808 14.0%
Sub-total 507,832 549,581 526,362 593,476 582,893 100.0% Sub-total 507,832 549,581 526,362 593,476 582,893 100.0%
BUILDING CONSTRUCTION BUILDING CONSTRUCTIONJapan 790,238 951,591 930,711 853,415 972,927 100.0% Office (Public / Private) 244,793 292,908 267,884 245,468 237,832 24.4% (Japan - Public) 85,274 74,200 70,891 63,338 52,222 5.4% Lodging 21,430 14,798 36,526 33,683 43,582 4.5% (Japan - Private) 704,964 877,390 859,820 790,077 920,704 94.6% Retail 31,905 52,247 58,575 21,087 62,686 6.4%
Overseas 2,063 295 0 248 397 0.0% Power Plant / Factory 64,689 134,311 144,054 137,403 172,448 17.7%
Warehouse / Distribution Center 9,793 24,469 12,683 37,324 32,675 3.4%
Residential 163,478 234,161 188,429 176,271 207,738 21.4%
Education / Research / Culture 94,686 68,956 100,244 64,087 64,239 6.6%
Medical / Welfare 99,668 92,315 75,648 96,565 69,346 7.1%
Recreational 16,180 12,254 19,733 17,687 3,880 0.4%
Other 45,673 25,461 26,931 24,085 78,893 8.1%
Sub-total 792,302 951,886 930,711 853,664 973,324 100.0% Sub-total 792,302 951,886 930,711 853,664 973,324 100.0%
TOTAL - CONSTRUCTIONJapan - Total 1,224,893 1,424,355 1,334,844 1,219,297 1,331,049 85.5% (Japan - Public) 365,662 386,058 339,915 314,660 295,367 19.0%
(Japan - Private) 859,231 1,038,297 994,929 904,636 1,035,681 66.5%
(Manufacturing) 117,207 227,637 219,896 163,696 207,390 13.3%
(Non-Manufacturing) 742,023 810,659 775,033 740,939 828,291 53.2%
Overseas 75,241 77,112 122,228 227,844 225,167 14.5%
Sub-total 1,300,134 1,501,468 1,457,073 1,447,141 1,556,217 100.0% Total - Construction 1,300,134 1,501,468 1,457,073 1,447,141 1,556,217 -
Real Estate and Other 91,419 78,314 155,427 108,298 39,765 -
Total 1,391,554 1,579,782 1,612,500 1,555,439 1,595,983 -
31 Mar 08 31 Mar 08
38
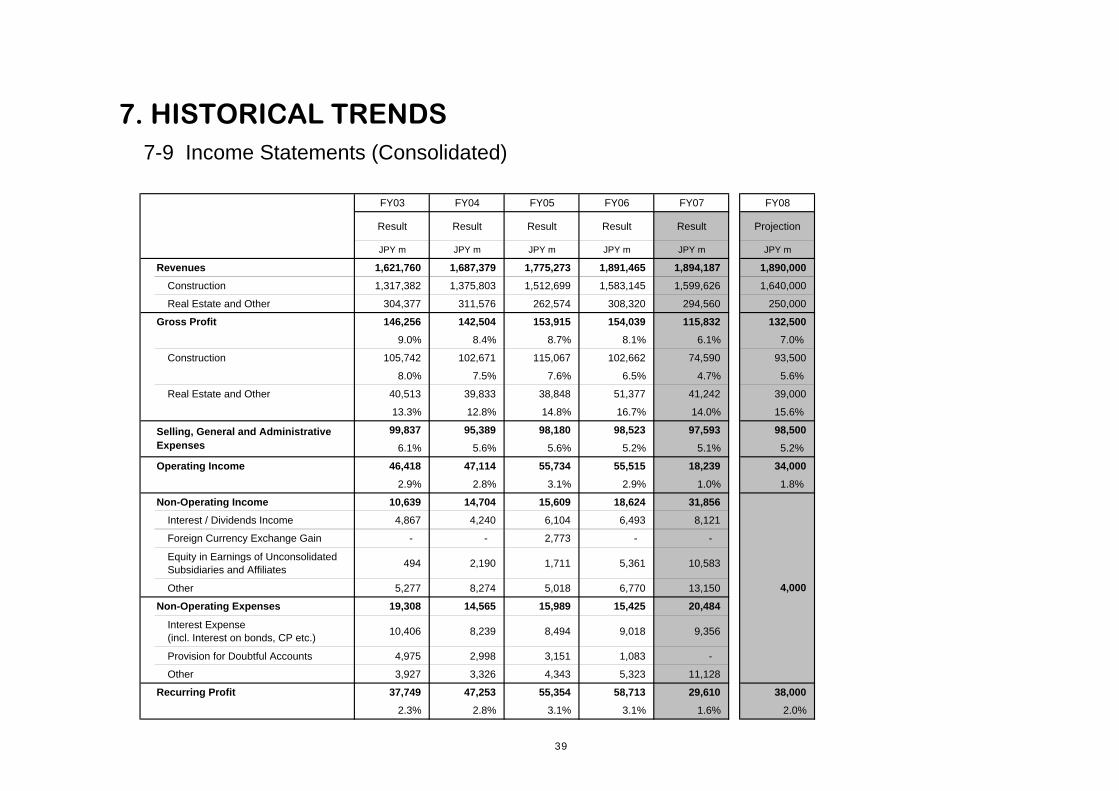
7. HISTORICAL TRENDS7-9 Income Statements (Consolidated)
FY03 FY04 FY05 FY06 FY07 FY08
Result Result Result Result Result Projection
JPY m JPY m JPY m JPY m JPY m JPY m
Revenues 1,621,760 1,687,379 1,775,273 1,891,465 1,894,187 1,890,000
Construction 1,317,382 1,375,803 1,512,699 1,583,145 1,599,626 1,640,000
Real Estate and Other 304,377 311,576 262,574 308,320 294,560 250,000
Gross Profit 146,256 142,504 153,915 154,039 115,832 132,500
9.0% 8.4% 8.7% 8.1% 6.1% 7.0%
Construction 105,742 102,671 115,067 102,662 74,590 93,500
8.0% 7.5% 7.6% 6.5% 4.7% 5.6%
Real Estate and Other 40,513 39,833 38,848 51,377 41,242 39,000
13.3% 12.8% 14.8% 16.7% 14.0% 15.6%
99,837 95,389 98,180 98,523 97,593 98,500
6.1% 5.6% 5.6% 5.2% 5.1% 5.2%
Operating Income 46,418 47,114 55,734 55,515 18,239 34,000
2.9% 2.8% 3.1% 2.9% 1.0% 1.8%
Non-Operating Income 10,639 14,704 15,609 18,624 31,856
Interest / Dividends Income 4,867 4,240 6,104 6,493 8,121
Foreign Currency Exchange Gain - - 2,773 - -
Equity in Earnings of UnconsolidatedSubsidiaries and Affiliates 494 2,190 1,711 5,361 10,583
Other 5,277 8,274 5,018 6,770 13,150
Non-Operating Expenses 19,308 14,565 15,989 15,425 20,484
Interest Expense(incl. Interest on bonds, CP etc.) 10,406 8,239 8,494 9,018 9,356
Provision for Doubtful Accounts 4,975 2,998 3,151 1,083 -
Other 3,927 3,326 4,343 5,323 11,128
Recurring Profit 37,749 47,253 55,354 58,713 29,610 38,000
2.3% 2.8% 3.1% 3.1% 1.6% 2.0%
4,000
Selling, General and AdministrativeExpenses
39

7. HISTORICAL TRENDS7-9 Income Statements (Consolidated) - continued
FY03 FY04 FY05 FY06 FY07 FY08
Result Result Result Result Result Projection
JPY m JPY m JPY m JPY m JPY m JPY m
Extraordinary Profit 8,559 13,180 2,776 30,592 38,472
Extraordinary Loss 43,396 24,469 7,773 16,255 16,861
2,913 35,965 50,357 73,050 51,221 39,000
Current 2,790 3,719 3,644 18,188 8,666
Deferred 5,120 18,378 22,827 12,918 52
Minority Interests 523 (647) (1,378) (503) (339)
Net Income (Loss) (4,474) 13,219 22,506 41,439 42,162 25,000
Extraordinary Loss DetailsLoss on Disposals of Fixed Assets - - - 710 5,759
Loss on Sales of Marketable and Investment Securities 121 - - - -
Valuation Loss on Marketable and Investment Securities 496 - - - -
Loss on Restructuring of Affiliates - 15,310 - - -
Loss on Investments in Affiliates - - - 3,320 -
Loss on Restructuring on Business - - 6,052 - -
Valuation Loss on Inventories - - - 7,554 -
Provision for Loss on Development Projects 6,774 1,858 - - -
Loss on Investments of Real Estate Development - - - 2,406 -
Loss on Impairment of Long-lived Assets - 1,771 - 1,260 2,969
Loss on Defect Rectification - - - - 3,589
Loss on Dissolution of Welfare Pension Fund 33,483 - - - -
Other 2,519 5,529 1,721 1,004 4,543
Total 43,396 24,469 7,773 16,255 16,861
14,000
Income before Income Taxes and Minority Interests
1,000
40

7. HISTORICAL TRENDS
7-10 Balance Sheets (Consolidated)
As at 31 Mar 04 31 Mar 05 31 Mar 06 31 Mar 07 31 Mar 08
Result Result Result Result Result
JPY m JPY m JPY m JPY m JPY m
(ASSETS)Current Assets 1,109,719 1,115,069 1,132,929 1,322,928 1,220,283
Cash and Cash in Banks 108,482 140,664 144,895 158,951 102,020
Notes and Accounts Receivable - Trade 382,691 455,516 468,386 630,044 586,195
Marketable Securities 129 227 454 298 258
Inventories:
Construction Projects in Progress 178,020 144,894 115,255 106,009 111,578
Development Projects in Progress,Real Estate and Other 231,248 191,953 242,822 229,542 230,303
Deferred Income Taxes 76,270 79,551 63,188 65,750 66,579
Other 146,317 110,602 108,598 137,618 128,356
Allowance for Doubtful Accounts (13,441) (8,341) (10,672) (5,286) (5,009)
Fixed Assets 760,559 702,660 773,034 784,293 698,226 Tangible Fixed Assets 378,804 348,237 344,184 343,195 347,761
Buildings and Structures 160,978 143,997 133,874 112,806 128,052
Machinery and Equipment 17,024 16,224 17,176 16,505 15,515
Land 170,012 157,124 158,357 164,883 194,682
Construction in Progress 29,814 29,932 33,820 48,071 8,743
Other 973 958 955 929 766
Intangible Fixed Assets 12,477 11,579 12,245 10,583 13,351 Goodwill - - 547 - -
Other 12,477 11,579 11,698 10,583 13,351
Investments and Other Assets 369,277 342,842 416,604 430,514 337,113 Investments in Securities 227,678 225,684 336,114 370,145 269,264
Long-term Loans Receivable 50,791 27,733 24,237 16,987 14,795
Deferred Income Taxes 54,775 39,740 5,798 4,897 15,132
Other 96,867 83,712 77,885 57,328 51,491
Allowance for Doubtful Accounts (60,836) (34,027) (27,431) (18,845) (13,569)
Total Assets 1,870,279 1,817,729 1,905,964 2,107,222 1,918,510
41

7. HISTORICAL TRENDS7-10 Balance Sheets (Consolidated) - continued
As at 31 Mar 04 31 Mar 05 31 Mar 06 31 Mar 07 31 Mar 08
Result Result Result Result Result
JPY m JPY m JPY m JPY m JPY m
(LIABILITIES)
Current Liabilities 1,172,494 1,171,495 1,148,318 1,318,243 1,208,941
461,847 519,351 538,771 628,263 562,720
180,954 150,956 130,607 155,323 137,808
44,000 26,000 24,000 50,000 77,000
29,626 55,306 35,808 28,178 24,711
3,144 4,657 3,735 14,309 3,428
Construction Projects in Progress 155,902 172,644 157,249 166,605 170,936
Development Projects in Progress, Real Estate andOther 76,713 64,224 63,036 35,253 19,768
144,441 87,676 99,388 134,649 105,317
706 614 936 1,318 1,487
- 3,920 4,211 8,613 20,785
- - - 176 156
75,157 86,141 90,572 95,550 84,820
Long-Term Liabilities 466,800 411,465 449,012 436,704 400,987
Bonds Payable 119,623 93,755 103,402 76,355 61,379
Long-term Debt 169,057 149,801 164,686 154,001 172,900
Deferred Income Taxes - 12 14,193 30,700 -
Deferred Income Taxes on Revaluation of Land 12,108 16,104 13,958 19,799 20,440
Liability for Retirement Benefits - Employees 66,105 62,870 64,252 65,348 64,021
5,307 5,795 6,133 1,240 -
Allowance for Loss on Development Projects 19,824 20,439 11,435 11,435 5,904
12,211 6,022 5,137 6,408 2,162
Negative Goodwill 468 19 - - -
62,094 56,644 65,810 71,412 74,178
Total Liabilities 1,639,295 1,582,960 1,597,330 1,754,947 1,609,928
Liability for Retirement Benefits - Directors andCorporate Auditors
Current Portion of Bonds
Other
Allowance for Warranty on Completed ConstructionProjects
Income Taxes Payable
Advances Received:
Deposits Received
Equity Loss in excess of Investments in and Loans toUnconsolidated Subsidiaries and Affiliates
Allowance for Foreseeable Losses on ConstructionProjects
Liability for Bonuses - Directors
Other
Notes and Accounts Payable - Trade
Short-term Borrowings
Commercial Paper
42

7. HISTORICAL TRENDS7-10 Balance Sheets (Consolidated) - continued
As at 31 Mar 04 31 Mar 05 31 Mar 06 31 Mar 07 31 Mar 08
Result Result Result Result Result
JPY m JPY m JPY m JPY m JPY m
(EQUITY)Owner's Equity - - - 204,035 225,213
Common Stock - - - 81,447 81,447
Additional Paid-in Capital - - - 49,485 49,485
Retained Earnings - - - 75,095 108,595
Treasury Stock - At cost - - - (1,992) (14,314)
Valuation and Translation Adjustments - - - 137,703 74,558 Unrealized Gain on Available-for-sale Securities - - - 110,725 49,492
Deferred Gain (Loss) on Derivatives underHedge Accounting - - - (310) (768)
Revaluation Surplus of Land - - - 26,943 26,161
Foreign Currency Translation Adjustments - - - 345 (326)
Minority Interests - - - 10,535 8,809 Total Equity - - - 352,274 308,581 Total Liabilities and Equity - - - 2,107,222 1,918,510
(MINORITY INTERESTS)Minority Interests 14,474 15,027 10,712 - -
(STOCKHOLDERS' EQUITY)Stockholders' Equity 216,509 219,741 297,921 - -
Common Stock 81,447 81,447 81,447 - -
Additional Paid-in Capital 49,485 49,485 49,485 - -
Retained Earnings 30,107 30,665 48,745 - -
Revaluation Surplus of Land 13,773 21,061 18,361 - -
Unrealized Gain on Available-for-sale Securities 44,924 40,997 98,748 - -
Foreign Currency Translation Adjustments (1,910) (2,412) 2,785 - -
Treasury Stock - At cost (1,317) (1,502) (1,651) - -
1,870,279 1,817,729 1,905,964 - - Total Liabilities, Minority Interests andStockholders' Equity
43

7. HISTORICAL TRENDS
7-11 Supplementary Information (Consolidated)
As at 31 Mar 04 31 Mar 05 31 Mar 06 31 Mar 07 31 Mar 08
JPY m JPY m JPY m JPY m JPY m
Loans Guaranteed 25,600 24,049 21,926 27,967 22,045
Guarantee Commitments 5,060 - - - -
Kajima Group Companies No. No. No. No. No.
- Consolidated Subsidiaries 78 71 73 74 76
(Japan) 12 11 12 12 13
(Overseas) 66 60 61 62 63
- Unconsolidated Subsidiaries accounted for using Equity Method 65 62 61 57 57
- Affiliated Companies accounted for using Equity Method 48 58 61 66 50
Total 191 191 195 197 183
FY03 FY04 FY05 FY06 FY07
JPY m JPY m JPY m JPY m JPY m
Other DataCapital Expenditure 1 25,266 13,584 21,912 39,801 34,525
Depreciation / Amortization 1 20,151 20,612 17,884 15,944 17,178
Financing Income (Expenses) (5,538) (3,999) (2,389) (2,525) (1,235) 1. The capital expenditure and the depreciation/amortization relate to tangible, intangible fixed assets as well as otherinvestment assets.
44

7. HISTORICAL TRENDS7-12 Business & Geographical Segment (Consolidated)
BUSINESS SEGMENT GEOGRAPHICAL SEGMENTFY03 FY04 FY05 FY06 FY07 FY03 FY04 FY05 FY06 FY07
Result Result Result Result Result Result Result Result Result Result
JPY m JPY m JPY m JPY m JPY m JPY m JPY m JPY m JPY m JPY m
1 Construction 1 JapanRevenues 1,317,712 1,377,665 1,517,311 1,589,150 1,602,216 Revenues 1,461,103 1,484,017 1,553,321 1,663,191 1,651,166
Operating Income 24,140 27,115 40,504 25,775 (5,040) Operating Income 42,842 58,171 59,065 54,346 11,976
2 Real Estate 2 North AmericaRevenues 188,136 205,787 152,692 209,600 194,129 Revenues 105,287 107,539 135,787 159,710 163,812
Operating Income 16,027 19,529 16,888 28,712 20,941 Operating Income 3,380 987 9,115 5,951 5,675
3 Other 3 EuropeRevenues 141,360 123,442 127,051 112,077 118,904 Revenues 21,818 35,707 28,250 27,175 25,647
Operating Income 953 628 1,141 1,071 1,219 Operating Income (2,460) (14,873) (13,958) (7,706) (2,277)
4 AsiaRevenues 34,783 60,664 58,089 42,133 55,114
Operating Income 2,657 2,752 1,413 2,817 2,855
4 Total (1+2+3) 5 Total (1+2+3+4)Revenues 1,647,209 1,706,895 1,797,056 1,910,828 1,915,249 Revenues 1,622,993 1,687,928 1,775,448 1,892,211 1,895,741
Operating Income 41,122 47,272 58,534 55,559 17,119 Operating Income 46,418 47,037 55,636 55,409 18,230
5 Elimination 6 EliminationRevenues (25,449) (19,515) (21,782) (19,362) (21,062) Revenues (1,232) (548) (175) (745) (1,554)
Operating Income 5,296 (157) (2,800) (43) 1,119 Operating Income 0 77 98 105 8
6 Consolidated Results 7 Consolidated ResultsRevenues 1,621,760 1,687,379 1,775,273 1,891,465 1,894,187 Revenues 1,621,760 1,687,379 1,775,273 1,891,465 1,894,187
Operating Income 46,418 47,114 55,734 55,515 18,239 Operating Income 46,418 47,114 55,734 55,515 18,239
45

7. HISTORICAL TRENDS7-13 Overseas Revenues (Consolidated)
FY03 FY04 FY05 FY06 FY07
Result Result Result Result Result
JPY m JPY m JPY m JPY m JPY m
North America 105,301 107,542 136,049 159,789 163,861
Note: 6.5% 6.4% 7.7% 8.4% 8.6%
Europe 22,395 36,291 28,584 27,732 26,216
Note: 1.4% 2.2% 1.6% 1.5% 1.4%
Asia 62,927 87,972 94,689 73,931 79,794
Note: 3.9% 5.2% 5.3% 3.9% 4.2%
Other Regions 2,993 3,243 9,189 26,943 80,699
Note: 0.1% 0.1% 0.5% 1.4% 4.3%
Total 193,618 235,050 268,512 288,397 350,572
Note: 11.9% 13.9% 15.1% 15.2% 18.5%
Consolidated Revenues 1,621,760 1,687,379 1,775,273 1,891,465 1,894,187
Note: percentage of overseas revenues to the consolidated revenues
46

7. HISTORICAL TRENDS
7-14 Kajima Group - Japan
FY03 FY04 FY05 FY06 FY07 FY08 FY03 FY04 FY05 FY06 FY07 FY08
Result Result Result Result Result Projection Result Result Result Result Result Projection
JPY m JPY m JPY m JPY m JPY m JPY m JPY m JPY m JPY m JPY m JPY m JPY m
Taiko Trading Co., Ltd. Chemical Grouting Co., Ltd.Revenues 195,782 205,635 198,620 182,906 168,556 150,000 Revenues 24,249 26,116 26,189 23,697 24,515 24,500
Operating Income 462 527 831 632 453 500 Operating Income 316 376 347 707 404 480
Recurring Profit 552 621 953 755 559 550 Recurring Profit 410 639 914 926 401 590
Net Income 301 294 661 161 206 270 Net Income 252 451 519 513 352 320
Total Assets 88,749 99,567 86,966 91,548 70,090 - Total Assets 19,887 21,802 20,766 18,999 20,689 -
Common Stock 400 400 400 400 400 - Common Stock 300 300 300 300 300 -
Staff Numbers 293 283 290 280 291 - Staff Numbers 282 278 281 273 281 -
Kajima Road Co., Ltd. Kajima Leasing Corp.Revenues 103,948 107,407 107,417 114,753 121,304 123,000 Revenues 11,057 11,624 12,377 9,023 10,324 10,000
Operating Income 398 778 1,075 1,375 1,243 1,200 Operating Income 333 562 554 176 505 390
Recurring Profit 421 818 1,084 1,240 1,199 1,000 Recurring Profit 307 554 576 154 502 380
Net Income (1,901) 172 1,143 405 376 200 Net Income 366 258 513 216 382 240
Total Assets 76,298 79,404 81,392 88,187 84,975 - Total Assets 31,586 28,456 31,394 29,528 28,295 -
Common Stock 4,000 4,000 4,000 4,000 4,000 - Common Stock 400 400 400 400 400 -
Staff Numbers 1,250 1,163 1,118 1,109 1,098 - Staff Numbers 29 29 31 34 30 -
Kajima Tatemono Sogo Kanri Co., Ltd. Kajima Mechatro Engineering Co., Ltd.Revenues 36,056 35,667 35,334 35,463 40,817 38,810 Revenues 9,953 8,976 8,651 8,362 8,866 10,600
Operating Income 870 884 1,060 1,091 1,289 1,270 Operating Income 28 15 (98) (51) 105 43
Recurring Profit 888 900 1,101 1,130 1,369 1,300 Recurring Profit 27 14 (133) (71) 113 40
Net Income 500 520 570 584 1,029 710 Net Income 1 1 (91) (82) 54 4
Total Assets 12,149 12,176 13,683 14,079 14,029 - Total Assets 7,118 6,736 6,872 6,378 5,200 -
Common Stock 100 100 100 100 100 - Common Stock 400 400 400 400 400 -
Staff Numbers 903 901 917 1,000 1,038 - Staff Numbers 134 134 127 126 140 -
47

7. HISTORICAL TRENDS
7-15 Kajima Group - Overseas
FY03 FY04 FY05 FY06 FY07 FY08 FY03 FY04 FY05 FY06 FY07 FY08
Result Result Result Result Result Projection Result Result Result Result Result Projection
JPY m JPY m JPY m JPY m JPY m JPY m JPY m JPY m JPY m JPY m JPY m JPY m
KUSA (Kajima USA Incorporated) KOA (Kajima Overseas Asia Pte. Ltd.)Contract Awards(Construction) 62,608 78,123 92,292 133,327 56,046 134,980 Contract Awards
(Construction) 9,653 29,039 22,449 24,247 74,210 69,570
Revenues 89,180 88,185 112,787 150,377 162,645 171,370 Revenues 22,729 23,428 28,664 28,192 38,843 67,050
Operating Income 2,186 (1,731) 5,071 4,181 4,745 3,020 Operating Income 1,801 1,075 2,172 2,374 2,484 3,650
Recurring Profit 2,591 1,818 6,870 6,793 10,760 7,780 Recurring Profit 2,386 3,052 4,353 5,133 4,635 3,530
Net Income 2,056 1,141 5,657 8,112 9,396 5,500 Net Income 1,837 2,414 3,434 3,792 15,955 2,150
Total Assets 102,918 104,702 126,863 147,325 153,324 - Total Assets 44,235 43,971 47,714 55,022 76,497 -
Staff Numbers 703 675 790 812 839 - Staff Numbers 947 976 999 1,063 1,477 -
EWDC (East West Development Corporation) Chung-Lu Construction Co., Ltd.Contract Awards(Construction) - - - - - - Contract Awards
(Construction) 15,858 44,160 11,239 33,950 11,408 16,480
Revenues 1,433 1,619 1,965 1,480 1,466 - Revenues 12,053 37,235 29,424 13,940 16,271 19,020
Operating Income (274) (108) (76) 0 4 - Operating Income 855 1,081 (751) 343 276 930
Recurring Profit (300) (131) (102) (10) (1) - Recurring Profit 956 1,335 (633) 442 388 960
Net Income (199) (131) (69) 1,850 1,798 - Net Income 669 932 (509) 325 266 720
Total Assets 2,222 2,224 3,253 3,541 860 - Total Assets 4,281 11,166 9,298 7,358 7,772 -
Staff Numbers 0 0 0 0 0 - Staff Numbers 99 138 129 126 135 -
KE (Kajima Europe B.V.) & KEUKH (Kajima Europe UK Holding Ltd.)Contract Awards(Construction) 10,785 34,945 2,264 12,429 21,331 15,490
Revenues 21,818 35,707 28,030 27,271 25,705 36,970
Operating Income (2,460) (15,330) (15,253) (7,766) (2,329) 2,450
Recurring Profit (257) (16,103) (15,724) (8,528) 103 2,520
Net Income (635) (13,595) (18,782) (8,118) 4,131 3,160
Total Assets 38,567 42,275 47,031 51,994 50,452 -
Staff Numbers 445 458 345 315 255 -
48