information item - smgov.net
TRANSCRIPT

Information Item
1
Date: September 21, 2011
To: Mayor and City Council
From: Gigi Decavalles-Hughes, Acting Director of Finance/City Treasurer
Subject: City Monthly Cash and Investment Report for June 2011
Introduction
In compliance with the City Charter, State law, and the City’s Investment Policy, the
attached monthly report provides information concerning City investments and cash held
and/or managed by the Director of Finance/City Treasurer as of June 30, 2011.
Discussion
The June 2011 Investment Report highlights changes from May. The value of cash and
investments held in the pooled portfolio decreased by $20.9 million in June to $597.3
million. The decrease reflects a one-time $10 million pay down of a portion of the City’s
CalPERS obligation as well as the transfer of funds to trustees for debt service payments
to be made July 1. The pooled portfolio yield-to-maturity increased by one basis point in
June to 1.1%. The yield was 42 basis points lower than one year earlier. Investment
earnings for the month were $0.5 million. Fiscal year earnings were down 40.1% from the
same period last year reflecting the impact of the record low interest rate environment.
Further detail is included in the attached report.
In addition to the pooled portfolio, the City’s total cash holdings as of June 30, 2011
included $31.5 million in Charnock settlement-related funds, $118.3 million in debt
proceeds held in trust with fiscal agents, $11.8 million in other funds held in trust, and
$57,222 in petty cash/change funds for a total balance of $758.9 million.

2
In compliance with Governmental Accounting Standards, the Monthly Cash and Investment
Report provides the fair market value of all investments held by the City, with certain
exceptions, as of the last day of the month. The fair market value may be greater or less
than the original purchase price (book/reported value) of the investments due to
fluctuations in the market resulting in either an unrealized gain or loss for financial
disclosure purposes only. Since it is the City’s policy to hold most securities to maturity,
these fluctuations in market value do not affect the redemption value of the securities or
the overall yield to maturity of the portfolio. The book values of investments shown in this
report are exclusive of amortization/accretion of premiums/discounts. As of June 30, 2011,
the market value of the City’s portfolio was about $0.8 million greater than the book value.
Attached is a summary of investment activity as well as a detailed report of public monies
held by the City Treasurer for the month of June 30, 2011.
Prepared by: David Carr, Treasury Administrator Attachments: 1 – Investment Highlights 2 – Investment Report
3
ATTACHMENT 1
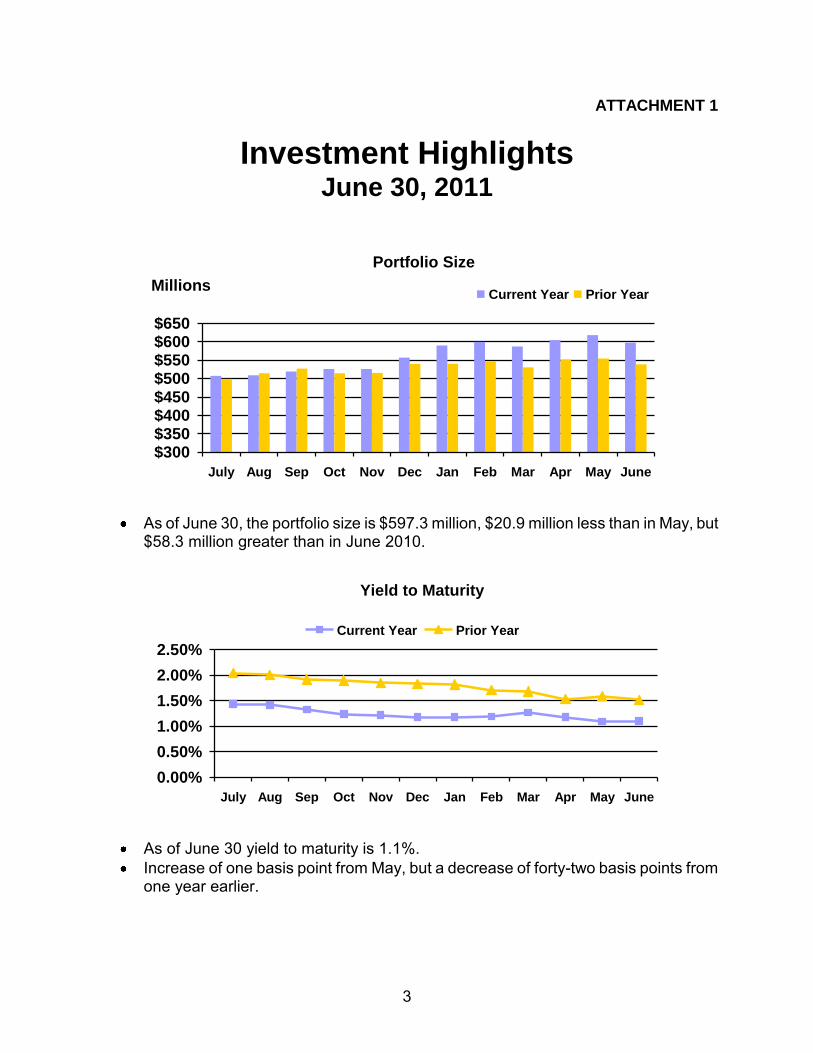
Investment Highlights June 30, 2011
Portfolio Size
$300$350$400$450$500$550$600$650
July Aug Sep Oct Nov Dec Jan Feb Mar Apr May June
MillionsCurrent Year Prior Year
As of June 30, the portfolio size is $597.3 million, $20.9 million less than in May, but $58.3 million greater than in June 2010.
Yield to Maturity
0.00%
0.50%
1.00%
1.50%
2.00%
2.50%
July Aug Sep Oct Nov Dec Jan Feb Mar Apr May June
Current Year Prior Year
As of June 30 yield to maturity is 1.1%.
Increase of one basis point from May, but a decrease of forty-two basis points from one year earlier.

4
Fiscal Year-to-Date Interest Earnings
(Cumulative by Month)
$0
$2
$4
$6
$8
$10
$12
Jul Aug Sep Oct Nov Dec Jan Feb Mar Apr May June
MillionsCurrent Year Prior Year
FY2010-11 earnings ended the year down 40.1% from FY2009-10.
Unrealized Gain/(Loss)
($6.0)
($4.0)
($2.0)
$0.0
$2.0
$4.0
June July Aug Sep Oct Nov Dec Jan Feb Mar Apr May June
Millions
The unrealized gain of $0.5 million reported as of June 30, 2011 is the difference between market value and the unamortized book value (purchase price).

5
ATTACHMENT 2
Investment Report June 2011
Prepared by: Gigi Decavalles-Hughes, Acting Director of Finance/City Treasurer David R. Carr, Treasury Administrator
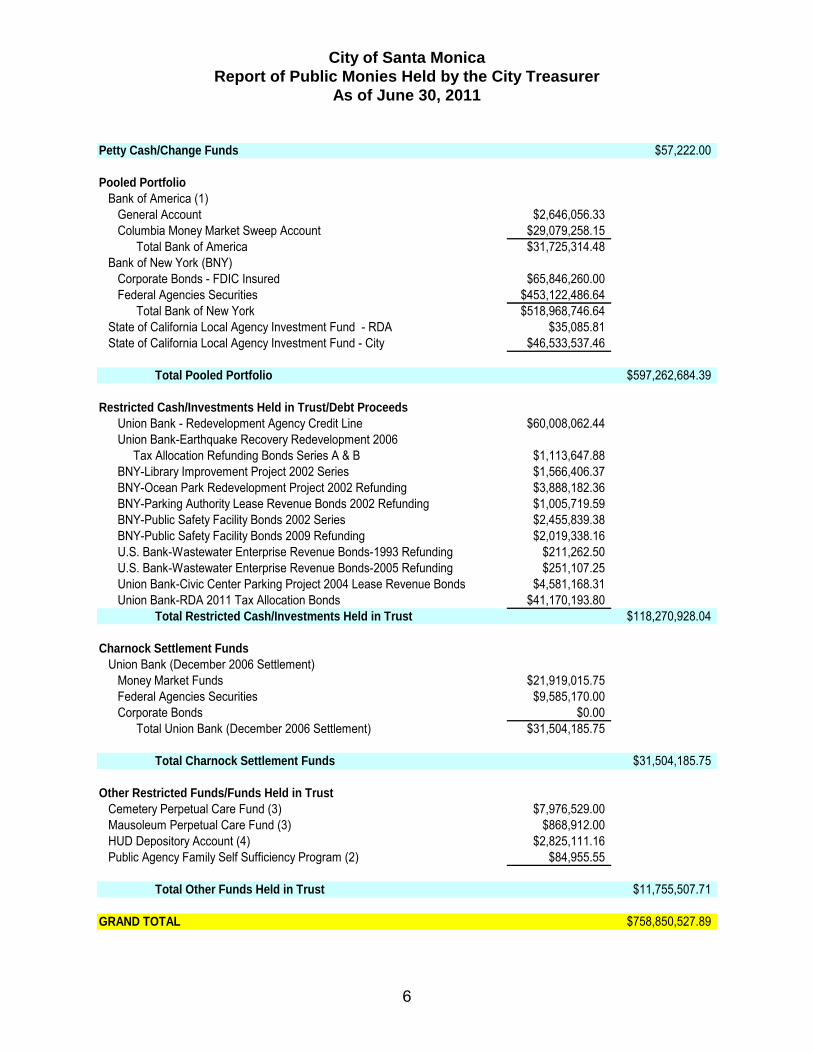
City of Santa Monica
Report of Public Monies Held by the City Treasurer
As of June 30, 2011
6
Petty Cash/Change Funds $57,222.00
Pooled Portfolio
Bank of America (1)
General Account $2,646,056.33
Columbia Money Market Sweep Account $29,079,258.15
Total Bank of America $31,725,314.48
Bank of New York (BNY)
Corporate Bonds - FDIC Insured $65,846,260.00
Federal Agencies Securities $453,122,486.64
Total Bank of New York $518,968,746.64
State of California Local Agency Investment Fund - RDA $35,085.81
State of California Local Agency Investment Fund - City $46,533,537.46
Total Pooled Portfolio $597,262,684.39
Restricted Cash/Investments Held in Trust/Debt Proceeds
Union Bank - Redevelopment Agency Credit Line $60,008,062.44
Union Bank-Earthquake Recovery Redevelopment 2006
Tax Allocation Refunding Bonds Series A & B $1,113,647.88
BNY-Library Improvement Project 2002 Series $1,566,406.37
BNY-Ocean Park Redevelopment Project 2002 Refunding $3,888,182.36
BNY-Parking Authority Lease Revenue Bonds 2002 Refunding $1,005,719.59
BNY-Public Safety Facility Bonds 2002 Series $2,455,839.38
BNY-Public Safety Facility Bonds 2009 Refunding $2,019,338.16
U.S. Bank-Wastewater Enterprise Revenue Bonds-1993 Refunding $211,262.50
U.S. Bank-Wastewater Enterprise Revenue Bonds-2005 Refunding $251,107.25
Union Bank-Civic Center Parking Project 2004 Lease Revenue Bonds $4,581,168.31
Union Bank-RDA 2011 Tax Allocation Bonds $41,170,193.80
Total Restricted Cash/Investments Held in Trust $118,270,928.04
Charnock Settlement Funds
Union Bank (December 2006 Settlement)
Money Market Funds $21,919,015.75
Federal Agencies Securities $9,585,170.00
Corporate Bonds $0.00
Total Union Bank (December 2006 Settlement) $31,504,185.75
Total Charnock Settlement Funds $31,504,185.75
Other Restricted Funds/Funds Held in Trust
Cemetery Perpetual Care Fund (3) $7,976,529.00
Mausoleum Perpetual Care Fund (3) $868,912.00
HUD Depository Account (4) $2,825,111.16
Public Agency Family Self Sufficiency Program (2) $84,955.55
Total Other Funds Held in Trust $11,755,507.71
GRAND TOTAL $758,850,527.89

City of Santa Monica
Report of Public Monies Held by the City Treasurer
As of June 30, 2011
7
(1) This is the actual bank account balance as of 6/30/11. It only reflects checks and warrants that have
been presented for payment and deposits received by the bank. The balance on deposit per the City books would reflect reductions for all checks and warrants issued and an increase for all deposits transmitted. Redevelopment Agency, Housing Authority, and Parking Authority Funds included in totals.
(2) The City of Santa Monica Housing Authority administers the Family Self Sufficiency Program. An
escrow account is set up for each family in the program. The Housing Authority maintains and releases the escrow funds as required by HUD regulations.
(3) The Cemetery Perpetual Care Funds and the Mausoleum Perpetual Care Funds are held in trust by
Charles Schwab & Company, Inc. and administered by the investment firm RNC Genter Capital Management Company. Market value is shown since a large portion of the portfolio is in equities.
(4) HUD Depository account is used to receive monthly housing assistance payments from HUD.

City of Santa Monica
Cash Receipts, Disbursements and Cash Balances*
June 30, 2011
8
Pursuant to Section 711d of the City Charter, I submit the following:
Cash and Investments - May 31, 2011 618,165,584.54
Receipts 43,865,625.45
Disbursements (64,768,525.60)
Cash and Investments - June 30, 2011 $597,262,684.39
* Pooled portfolio only. Excludes certain investments held in trust by third parties such as bond proceeds, perpetual care funds, and Charnock settlement funds.
Gigi Decavalles-Hughes Acting Director of Finance/City Treasurer

City of Santa Monica Monthly Cash and Investment Report
9 June 30, 2011
Overview As of June 30, 2011, total City cash and investments were $758.9 million, a $29.5 million increase from May. The increase primarily reflects proceeds from the issuance of $41.2 million in Redevelopment Agency tax allocation bonds. Partially offsetting is a $10 million payment to CalPERS to pay down a portion of the City’s pension obligation. Total cash and investments are categorized as follows:
Petty Cash 57,222.00$ Pooled Investment Portfolio 597,262,684.39$ Restricted Cash/Investment Held in Trust 118,270,928.04$ Charnock Settlement Funds 31,504,185.75$ Other Funds Held in Trust 11,755,507.71$
Total 758,850,527.89$
Definitions
Basis Point – One hundredth of one percent (.01%) Book (Reported) Value – The price paid for the security at purchase. Bullets – A security with a fixed coupon or interest rate that cannot be redeemed by the issuer before the maturity date. Callable Securities – A security that can be redeemed by the issuer before the maturity date. Duration – A measure of the timing of the cash flows, such as the interest payments and the principal repayment, to be
received from a security. The duration of a security is a useful indicator of its price volatility for given changes in interest rates.
Market Value – The price at which a security is currently trading and could be presumably bought or sold. Par Value – The full face value of the security.
Rebalancing – Strategy whereby low yielding securities are sold at a loss with the proceeds used to purchase higher yielding securities.
TLGP (Temporary Loan Guarantee Program) – Federal program through which the Federal Deposit Insurance Corporation guarantees repayment of certain bonds issued by financial institutions.
Unrealized Gain/Loss – Difference between the current market value and purchase price (book value) of a security.

City of Santa Monica Monthly Cash and Investment Report
10 June 30, 2011
Yield to Maturity – The rate of return of a security held to maturity when both interest payments and the investor’s gain
or loss (premium paid or discount taken) on the security is taken into account.
Pooled Investment Portfolio
As of June 30, 2011, the portfolio size (unamortized book value/purchase price) of City pooled cash and investments is $597.3 million, a $20.9 million decrease from May. Since the City holds most investments to maturity, variations in portfolio book value are typically due to receipt and expenditure patterns during the month rather than any realized gains or losses on securities. Additionally, the City does not amortize premiums or accrete discounts except for financial reporting purposes on the last day of each fiscal year. As noted earlier, this month’s decrease reflects a one-time $10 million pay down of a portion of the City’s CalPERS liability. In addition, approximately $9.5 million was transferred to the City’s trustees for semi-annual debt service payments to be made July 1. Fourteen investments were made during the month ($60 million), nine investments matured ($57.2 million), and nine investments were called ($41.8 million). No investments were sold. The net total City and RDA State Local Agency Investment Fund (LAIF) account balances were unchanged in June. The balance of the money market sweep account as of June month-end was $29.1 million. Details of the main portfolio follow.
Portfolio Composition The portfolio is well-diversified and is in compliance with the City’s Investment Policy and applicable provisions of the State Government Code. The largest sector of the portfolio is Federal Agency Securities (75.9%). The remaining 24.1% is invested in the State Local Agency Investment Fund (7.8%); corporate notes (11%); all of which are currently FDIC insured bonds (AAA rated) issued under the FDIC’s Temporary Liquidity Guarantee Program (TLGP); and cash including the money market sweep account (5.3%). This portfolio mix allows the City to maintain its primary investment objectives of safety and liquidity while attaining a rate of return consistent with the City’s Investment Policy and Investment Plan.
Portfolio Composition
Corp-
TLGP
11.0%
Cash/
Sweep
5.3%
LAIF-City
7.8%Federal
Agency
Bullets
41.6%
Callable
Agencies
34.3%

City of Santa Monica Monthly Cash and Investment Report
11 June 30, 2011
Portfolio Comparison The chart to the right shows the overall structure of the portfolio by type of investment compared to last month. There were no significant changes in June. However, more funds were held in the sweep account than is typical due to a number of investments being called at month-end. The City continues to hold a major balance in short term funds as interest rates remain at historic lows, and LAIF is still a significant benefit over other types of investments with maturities one year and under. The bond market, financial and economic conditions, and portfolio structure are continuously evaluated when making investment decisions.
Rebalancing of Portfolio
No portfolio rebalancing occurred in June due to the low interest rate environment. However, when rates begin to consistently rise again, rebalancing opportunities will be evaluated.
Portfolio Comparison
$0 $50 $100 $150 $200 $250 $300
Federal Agency Bullets
Callable Agencies
Corp-FDIC
LAIF-City
LAIF-RDA
Cash/Sweep
MillionsMay-11 Jun-11

12

13

14

15

16

17

18

City of Santa Monica Monthly Cash and Investment Report
19 June 30, 2011
Portfolio Yield The portfolio yield-to-maturity was 1.10% as of June 30, 2011, up one (1) basis point from May, but down forty-two (42) basis points from June 2010. The extended record low interest rate environment continues to affect portfolio returns. This month’s yield is three hundred ninety (390) basis points below the most recent high mark of 5.1% in September 2007 and continues near the lowest point for which records are available. The chart compares the month-end portfolio yield to the twelve-month moving averages of the two-year Constant Maturing Treasury security yield (CMT) and State Local Agency Investment Fund (LAIF) yield. June interest rates in the two to five year maturity range were relatively unchanged from May. The month-end two year CMT, while level with May, has dropped thirty-five basis points (44%) in the last three months and is just eleven (11) basis points above the all-time low reached in October 2010. The twelve month moving average of the CMT was two (2) basis points lower in June and is four hundred twenty-one (421) basis points off its February 2007 high. Rates are now expected to remain relatively low into 2013. LAIF rates also continue to reflect the low interest rate environment. The twelve month moving average LAIF yield of 0.5% was also unchanged from May, and has not shown a monthly increase in over forty months. The monthly LAIF yield for June was 0.48%, up seven basis points from May, but still near all-time lows. At its June meeting, the Federal Open Market Committee (Fed) left the target Fed Funds rate remained unchanged at a range of 0% to 0.25%. At the same time, the Fed lowered its forecast for economic growth and increased its forecast for unemployment for 2011 and 2012. Based on this, the Fed policy statements have indicated that they intend to keep rates at low levels for an extended time period. While certain sectors of the economy showed positive signs in June, other signs of weakness continue to appear and concerns regarding the long term health of the economy continue. The housing market
0.0%
0.5%
1.0%
1.5%
2.0%
2.5%
3.0%
January February March April May June
Portfolio Yield
Portfolio LAIF 2 Year T-Note

City of Santa Monica Monthly Cash and Investment Report
20 June 30, 2011
continued weak as prices showed year over year decreases, foreclosures remained at high levels and more analysts are beginning to project a “double dip” in the housing market. Persistent unemployment continues to dampen economic growth. The unemployment rate increased to 9.2% in June, the third consecutive increase after four months of decreases. Rising prices for energy and other commodities could dampen future economic growth. Economic growth in the first quarter as measured by GDP was a weak 0.4%. The stock market also suffered in June as the Dow Jones Industrial Average decreased slightly during the month. Concerns about economies in certain European countries also continue. Most economists now expect mild economic growth in the U.S. to continue for the remainder of 2011 and into 2012. The City’s portfolio yield-to-maturity has decreased significantly over the last four years as interest rates have reached historic lows resulting in many investments being called and reinvested at lower rates. Overall, the yield will likely continue to decrease over the next few months, but the market continues to be volatile, so yields could vary on a month-to-month basis. More bonds will be called in the next few months as interest rates are expected to remain near historic lows. Investment earnings in June were $0.8 million. FY2010-11 earnings ended the year down 40.1% from the prior year and further reductions are now anticipated in FY2011-12.
Maturity Distribution The weighted average days to maturity as of June 30, 2011 is 641 days (1.75 years), forty-five days more than the prior month. The current volatile and low interest rate environment continues to result in bonds being called, and the portfolio’s average days to maturity may vary over the next several months. Investments continue to be made primarily in maturities of
Maturity Distribution
$0
$50
$100
$150
$200
Cash/
Sweep
LAIF 0 - 1
Year
1 - 2
Years
2 - 3
Years
3 - 4
Years
4+
Years
Millions
Portfolio Maturities
2 - 3
Years
22.7%
3 - 4
Years
11.1%
Cash/
Sweep
5.3%LAIF
7.8%
4+ Years
8.8%
0 - 1
Year
25.3%
1 - 2
Years
19.0%

City of Santa Monica Monthly Cash and Investment Report
21 June 30, 2011
three years or less as rates are not expected to begin a period of significant increase until a number of months in the future. However, since most of the bonds being called have longer maturities, some bonds of longer maturities are being purchased to replace the called bonds and maintain appropriate diversification in the portfolio.
Unrealized Gains/Losses The Governmental Accounting Standards Board Statement No. 31 (GASB 31) requires public agencies to report all investments, with certain exceptions, at current fair market value rather than at the original purchase price. Current fair market value is defined in GASB 31 as “the amount at which a financial instrument could be exchanged in a current transaction between willing parties, other than in a forced or liquidation state.” The current fair market value and unrealized gain/loss of a security do not affect its redemption value or yield if held to maturity. There is an inverse relationship between the price of the bond and the market interest rate. The City’s practice is to purchase most securities with the intent to hold them to maturity. Book value and market values are exclusive of interest
realized to date on investments. Also, the book value shown is the purchase price and is exclusive of any amortization of premiums or accretion of discounts. As of June 30, 2011, the market value and the book value of the City’s pooled investments (excluding cash) are:
Market Value $ 595,091,948.25 Book Value (purchase price) 594,616,628.06 Unrealized Gain/(Loss) $ 475,320.19
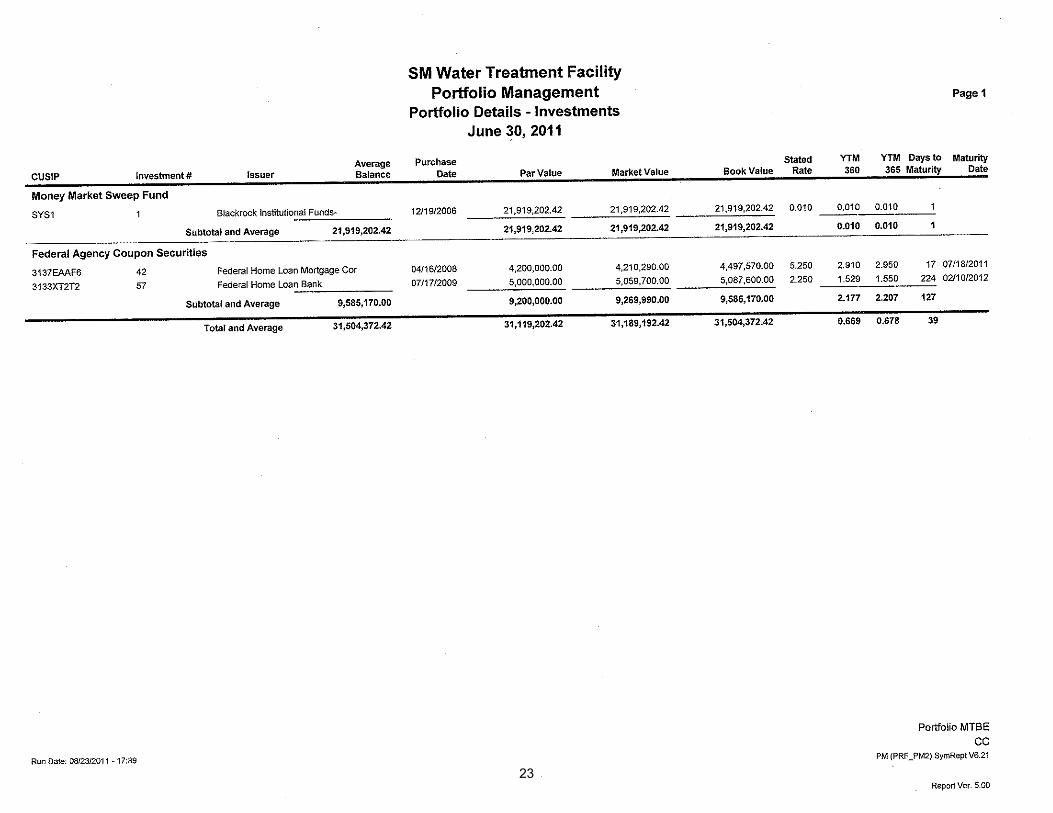
Charnock Settlement All remaining restricted settlement funds are now held in an escrow account with Union Bank to be used to pay for the costs of design, construction, and operation of the water treatment facility at the Charnock Wells. These funds are invested under the same guidelines as the pooled portfolio with maturity dates to match the estimated cash flow needs of the Water Treatment Facility project. In accordance with the December 2006 settlement agreement, investment income earned in the escrow account is not restricted for use on the project. In August 2009, all investment income earned from date of account opening (December 2006) through July 2009 was transferred to the City (approximately $9.7 million) and interest is now being

City of Santa Monica Monthly Cash and Investment Report
22 June 30, 2011
transferred on a monthly basis. Funds remaining in the account (approximately $31.5 million) should be sufficient to cover remaining costs related to construction of the facility and operations for the first three to four years. Construction was completed near the end of 2010 and the plant is now operational. The yield to maturity on these funds as of June 30, 2011 is 0.67%. On June 30, 2011, the portfolio showed an unrealized loss of $315,180. The weighted average days-to-maturity was 39 days. Most investments are being held in very short maturity/low yield investments.
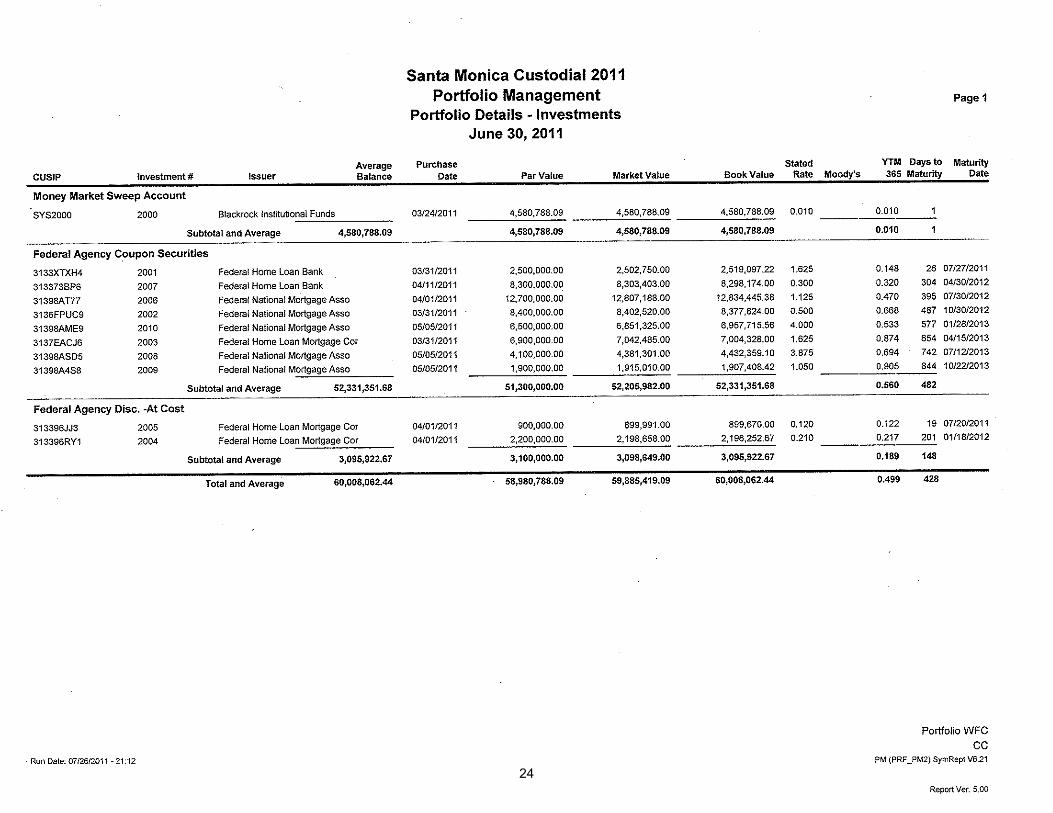
RDA Credit Line Proceeds In March, the Santa Monica Redevelopment Agency established a $60 million term loan with Wells Fargo Bank to be used to finance certain capital projects. The credit line was drawn down in its entirety with funds transferred to a new custodial account with Union Bank. The funds have been invested to match cash flow requirements of eligible capital projects. As of June 30, $55.4 million had been in invested in Federal agency securities with the remainder invested in a money market mutual fund. The month-end yield to maturity was 0.5%. The weighted average days to maturity was 428 days. The month-end unrealized loss was approximately $122,643.35.
Compliance California State law and the City’s Investment Policy set certain legal standards for allowable investments that can be included in the City’s portfolio. Additionally, there are certain maximum limits for classes of investments, as well as minimum credit quality requirements. In testing for compliance, the City considers all funds under the direct control and invested directly by the City including the pooled portfolio and the Water Treatment Facility account. Bond proceeds and the Cemetery and Mausoleum Perpetual Care Funds are excluded. The following tables summarize portfolio compliance as of June 30, 2011; all investments were in compliance with State law and the City’s Investment Policy at the time of purchase. State law requires that any investment subject to a credit downgrade subsequent to the time of purchase shall be reviewed for possible sale within a reasonable amount of time after the downgrade. As of the date of this report, the portfolio includes no bonds that have been downgraded since the time of purchase and all remaining corporate bonds are FDIC insured and rated AAA. Further detail regarding City compliance with State law and City investment guidelines is presented as follows:
23
24

City of Santa Monica Monthly Cash and Investment Report
25 June 30, 2011
SM Water Legal/ InPooled Treatment Facility Total % of Policy CompliancePortfolio Account (1) Portfolio (2) (4) Portfolio Limit (Yes/No)
Federal Agency Securities
Federal Home Loan Bank $159,984,771.70 $5,087,600.00 $165,072,371.70 26.3% 50.0% Yes Federal National Mortgage Association 120,374,057.22 0.00 120,374,057.22 19.1% 50.0% Yes Federal Home Loan Mortgage Corporation 123,152,374.44 4,497,570.00 127,649,944.44 20.3% 50.0% Yes Federal Farm Credit Bank 49,611,283.28 0.00 49,611,283.28 7.9% 50.0% Yes
Total Federal Agency Securities $453,122,486.64 9,585,170.00 462,707,656.64 73.6% n/a Yes
Corporate Bonds
Corporate Bonds - TGLP (FDIC Insured) $65,846,260.00 $0.00 65,846,260.00 Corporate Bonds - Other $0.00 0.00
Total Corporate Bonds $65,846,260.00 $0.00 $65,846,260.00 10.5% 30.0% Yes
Money Market Mutual Funds
Columbia Money Market Reserves Advisor Class 29,079,258.15 29,079,258.15 4.6% 10.0% Yes BlackrockT-Find Cash Management Sweep 21,919,202.42 21,919,202.42 3.5% 10.0% Yes
Total-Money Market Mutual Funds $29,079,258.15 $21,919,202.42 $50,998,460.57 8.1% 20.0% Yes
State Local Agency Investment Fund-City $46,533,537.46 $46,533,537.46 7.4% $50 million Yes
State Local Agency Investment Fund-RDA $35,085.81 $35,085.81 0.0% $50 million Yes
Cash (3) 2,646,056.33 2,646,056.33 0.4% None Yes
Total (Book Value) $597,262,684.39 $31,504,372.42 $628,767,056.81 100.00%
Notes:
(1) Held by Union Bank(2) Excludes bond proceeds, funds held in trust for others, petty cash accounts, and other funds which are not entirely under City ownership and control (3) City's general bank account held at Bank of America. Does not include balance of HUD depository account ($2,825,111.16)(4) Value used to test compliance is reported value (book value plus unrealized purchased interest).
Portfolio Allocation as of 6/30/11

City of Santa Monica Monthly Cash and Investment Report
26 June 30, 2011
Standard & Poors/ In Compliance
Fitch Moodys (Yes/No)
Best Quality AAA Aaa Yes
AA+ Aa1 Yes
High Quality AA Aa2 Yes
AA- Aa3 Yes
A+ A1 Yes
Upper Medium Grade A A2 Yes
A- A3 Yes
BBB+ Baa1 No
Medium Grade BBB Baa2 No
BBB- Baa3 No
Credit Ratings - Corporate Medium Term Notes
MTBE SM Water InPooled Custodial Treatment Facility Total Credit Compliance
Security Portfolio Account Account Portfolio Rating* (Yes/No)
Corporate - TLGP (FDIC Guaranteed)Bank of America 3.125% (TLGP) 6/15/2012 $5,199,100.00 $5,199,100.00 AAA YesSuntrust Bank 3% (TLGP) maturing 11/16/11 $5,153,450.00 $5,153,450.00 AAA YesGoldman Sachs 3.25% (TLGP) 6/15/2012 $5,206,850.00 $5,206,850.00 AAA YesGoldman Sachs 1.625% (TLGP) 7/15/11 $5,030,000.00 $5,030,000.00 AAA YesHSBC 3.125% (TLGP) maturing 12/16/11 $5,151,350.00 $5,151,350.00 AAA YesJP Morgan Chase 2.125% (TLGP) maturing 12/26/12 $4,993,850.00 $4,993,850.00 AAA YesWells Fargo Bank 3% (TLGP) maturing 1/12/11 $4,994,150.00 $4,994,150.00 AAA YesMorgan Stanley 1.95% (TLGP) maturing 6/20/12 $4,998,450.00 $4,998,450.00 AAA YesMorgan Stanley 2% (TLGP) maturing 9/22/11 $5,090,200.00 $5,090,200.00 AAA YesU.S. Bank 2.25% (TLGP) maturing 3/13/12 $4,999,400.00 $4,999,400.00 AAA YesCitigroup 2.125% (TLGP) maturing 7/12/12 $2,015,520.00 $2,015,520.00 AAA YesCitigroup 1.5% (TLGP) maturing 7/12/11 $5,010,400.00 $5,010,400.00 AAA YesCitigroup 1.875% (TLGP) maturing 10/22/12 $3,011,940.00 $3,011,940.00 AAA YesCitigroup 1.375% (TLGP) maturing 8/10/11 $4,991,600.00 $4,991,600.00 AAA Yes
* Per Standard and Poors
City Portfolio as of 6/30/11 (Book Value)
Certification

City of Santa Monica Monthly Cash and Investment Report
27 June 30, 2011
In compliance with California Government Code Section 53546 as amended January 1, 1996, I hereby certify that sufficient investment liquidity and anticipated revenues are available to meet the City’s budgeted expenditure requirements for the next six months. _______________________________________ Gigi Decavalles-Hughes, Acting Director of Finance/City Treasurer